In this new article, written with fellow geographer Stefano De Sabbata, we explore the relationship between spatial user-generated content from Twitter, Foursquare, OpenStreetMap, and Wikipedia and socio-economic variables in Los Angeles County [read the full paper in PDF]. All the data and resources are freely available on GitHub.
Abstract: Online representations of places are becoming pivotal in informing our understanding of urban life. Content production on online platforms is grounded in the geography of their users and their digital infrastructure. These constraints shape place representation, that is the amount, quality, and type of digital information available in a geographic area. In this article, we study the place representation of user-generated content (UGC) in Los Angeles County, relating the spatial distribution of the data to its geo-demographic context. Adopting a comparative and multiplatform approach, this quantitative analysis investigates the spatial relationship between four diverse UGC datasets and their context at the census tract level (about 685,000 geo-located tweets, 9,700 Wikipedia pages, 4M OSM objects, and 180,000 Foursquare venues). The context includes the ethnicity, age, income, education, and deprivation of residents, as well as public infrastructure. An exploratory spatial analysis and regression-based models indicate that the four UGC platforms possess distinct geographies of place representation. To a moderate extent, the presence of Twitter, OpenStreetMap, and Foursquare data is influenced by population density, ethnicity, education, and income. However, each platform responds to different socio-economic factors and clusters emerge in disparate hotspots. Unexpectedly, Twitter data tends to be located in more dense, deprived areas, and the geography of Wikipedia appears peculiar and harder to explain. These trends are compared with previous findings for the area of Greater London.
Keywords: Information geography; crowdsourcing; volunteered geographic information; user-generated content; Los Angeles; geo-demography
These are our findings:
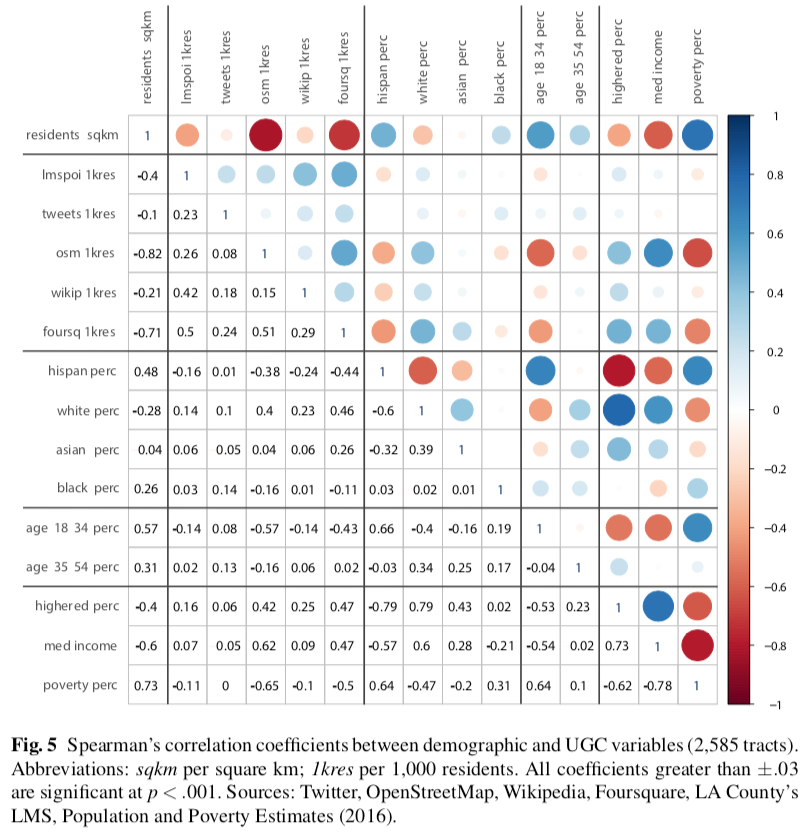
- Population density. In LA County, higher population density is correlated with higher poverty, more Hispanic residents, younger population, fewer White residents, lower income, and lower education. Higher density corresponds to more tweets and more OSM objects.
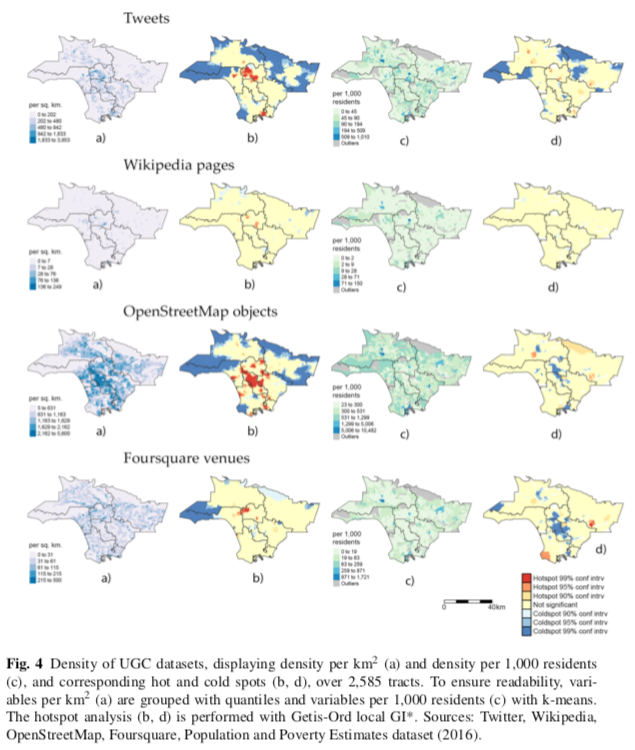
- Twitter. Geo-located tweets tend to appear in denser areas. Almost 60% of the variability in number of tweets can be explained. When considering tweets per resident, no clear demographic factor emerges. Counter-intuitively, tweet density correlates with the deprivation index (more deprived areas obtain more tweets), because LA business and leisure hotspots are often located in inner city areas.
- Wikipedia. Pages are very sparsely distributed. Pages per resident correlate with LMS POIs, and weakly with White residents and, negatively, with Hispanic residents. Only 18% of variability can be explained through demographic factors.
- OpenStreetMap. When considering OSM objects per resident, these objects tend to occur in White, educated, affluent, older, non-dense areas. The distribution of OSM objects is the most predictable, with 77% of variability related to demographic factors.
- Foursquare. Venues per resident exhibit positive correlations with infrastructural points of interest per resident, and with White, educated, affluent, older, non-dense areas. 47% of variability is venues can be predicted through demographic variables.
- Cross-platform comparison. Each of the four UGC sources has a distinct place representation, with different spatial distributions. In the regression models, Twitter, OSM, and Foursquare show a broadly similar structure, while Wikipedia appears more unique. Even sources that show relatively similar correlations (e.g. Foursquare, Twitter, OSM) have statistically different hot and coldspots.
- Los Angeles and London. When comparing these findings with an analogous study of Greater London (Ballatore and De Sabbata, 2018), similarities and differences emerge. In both cities, population size and the share of residents with higher education have explanatory power. Indicators of affluence also have some explanatory power, but with seemingly opposite effects (positively for property prices in London, negatively for household income in LA). While the ethnic composition of areas bears no explanatory power in London, the presence of White and, to a lesser extent, Asian residents is associated with more data in LA. The age group 30-44 has a clear contribution to data variability in London, but it is not a factor in LA. Half of the variability of Wikipedia and Twitter appears explainable in London, geo-demographic factors in LA explain almost 60% of Twitter and only 20% of Wikipedia. In London, the variability in Wikipedia is linked to up to 49% of that in Twitter, while only up to 6% in LA.
Reference: Ballatore, A. and De Sabbata, S. (2019) Los Angeles as a digital place: The geographies of user-generated content, Transactions in GIS, in press [pdf]
