


Abstract
Atlantic bluefin tuna (ABT, Thunnus thynnus; Linneaus, 1758) is an ecologically important apex-predator with high commercial value. They were once common off the coast of the United Kingdom (UK), before disappearing in the 1960s. In regions lacking commercial fisheries for ABT, such as the UK and Ireland, spatial data can be scarce. In these cases, sightings and bycatch databases can offset information shortfalls. Here, we document the reappearance of ABT into territorial waters of the UK from 2014 onwards, and increased occurrence off Ireland. We analyse a novel, multi-source dataset comprising occurrence data (2008–2019; 989 sightings and 114 tonnes of bycatch) compiled from a range of sources (scientific surveys, ecotours and fisheries). We show an increasing trend in effort-corrected ABT occurrence in (i) the pelagic ecosystem survey in the western English Channel and Celtic Sea (PELTIC), (ii) an ecotour operator, and (iii) the Irish albacore fishery in on-shelf and off-shelf waters. Sightings of ABT by the PELTIC correlated with modelled abundance estimates of ABT and the Atlantic multidecadal oscillation. These data demonstrate that sightings of ABT have increased off the UK and Ireland since 2014, following the same increasing trend (2010 onwards) as the eastern ABT population.
Introduction
The distributions of migratory species are temporally dynamic, driven by complex dispersal behaviours that reflect variations in the environment (Faillettaz et al., 2019), prey availability (Tiews, 1978), predation risk (Hammerschlag et al., 2010), anthropogenic pressure (Nowacek et al., 2015), and ontogenetic development (De Grissac et al., 2016; Votier et al., 2017). During the current period of rapid global change (Poloczanska et al., 2013), these complex dispersal patterns, if not properly understood, can complicate regional conservation or management efforts (Studds et al., 2017). Defining the spatial dynamics of migratory species is an important component of effective conservation.
Atlantic bluefin tuna (ABT, Thunnus thynnus; Linneaus, 1758) are large, endothermic predators that range throughout the Atlantic Ocean, from polar waters in the North (Fromentin and Powers, 2005) through subtropical waters of the Gulf of Mexico and Caribbean Seas (Teo et al., 2007) and into cold temperate waters of the South Atlantic (Mather et al., 1995). Since the 1990s, the species’ range has reduced and the core distribution has been restricted to the North Atlantic, Gulf of Mexico, and Mediterranean Sea (Worm and Tittensor, 2011). Understanding the role of fishing, environment and, concomitantly, population dynamics on the spatio-temporal distribution of ABT has been a key research goal in recent decades. Catch time series from commercial trap (1599 onwards, Ravier and Fromentin, 2001) and longline (1956 onwards, e.g. Takeuchi et al., 2009) fisheries detail large fluctuations in ABT abundance over time, driven by fishing pressure (Fromentin et al., 2014) and the environment (Faillettaz et al., 2019). More recently, the increased use of electronic tracking tags has added enormously to the understanding of ABT space use (Block et al., 2005; Galuardi et al., 2010; Cermeño et al., 2015; Arregui et al., 2018) and, in turn, helped inform management and conservation policy (Block et al. 2005).
The northeast Atlantic is a feeding ground for ABT between August and December (Stokesbury et al., 2007; Olafsdottir et al., 2016) and, historically, the North Sea hosted recreational (Bennema, 2018) and commercial fisheries for ABT from the 1920s (Hamre, 1961). Both fisheries collapsed in the mid 1960’s (Tiews, 1978) as the abundance of ABT in the region declined significantly (Faillettaz et al., 2019). Historical (pre-1927) records indicate that ABT were also found in waters off southwest England during the summer and autumn (Yarrell, 1836; Le Gall, 1927). However, the lack of any reliable data source (e.g. from fisheries landings) off southwest England during this period precludes any deeper insight into these patterns of occurrence.
Scientific surveys for marine animals pose a number of challenges (Kaschner et al., 2012), and opportunistic sightings can form a useful additional source of distribution data for some species (e.g. Witt et al., 2012). Existing databases of opportunistic sightings are typically dominated by air-breathing species (such as birds—Jones et al., 2014; cetaceans—Hammond et al., 2002; and pinnipeds—Leeney et al., 2010), but some water-breathing animals are also noted during surveys (e.g. elasmobranchs—Rohner et al., 2013; Moro et al., 2019). Due to conspicuous, surface-oriented feeding behaviour, ABT have recently appeared in regional sightings programs designed initially for cetaceans, birds and pinnipeds off the United Kingdom (UK) and Ireland (e.g. van der Kooij et al., 2015) providing a valuable data source for analysis. Here, by combining such databases with data on bycatch in a commercial fishery we document the recent occurrence of ABT in waters off the UK and Ireland and discuss potential drivers for observed changes.
Material and methods
Data sources
Records detailing ABT occurrence were compiled from five sources: (i) General public. From May 2018 members of the public submitted sightings of ABT with associated metadata (date, time, location, approximate size of ABT) via a dedicated website (www.thunnusuk.org/submit-sightings; last accessed 25 January 2021). (ii) Ecotour operators. Three ecotour businesses operating off southwest England submitted ABT sightings from routine wildlife watching trips, which generally took place between spring and autumn. Two ecotour operators (ecotour A and ecotour B) submitted ad-hoc sightings data (i.e. effort data was not routinely collected and was thus unavailable for this study) and the third (ecotour C; de Boer et al., 2018) submitted effort-correctable sighting records (sightings of ABT with accompanying GPS-logged vessel track) along with environmental conditions (sea state, swell height and visibility) between 2008 and 2018. (iii) Opportunistic surveys. Effort-correctable ABT sightings were made available from two opportunistic surveys conducted during scientific fishing for ABT as part of ongoing research off the northwest coast of Ireland in 2016 (Horton et al., 2020) and off the southwest coast of England in 2018. For both opportunistic surveys and the ecotour operators, vessel tracks followed an un-structured movement pattern as part of fishing and wildlife watching operations. (iv) Fisheries-independent surveys. Effort-correctable ABT sightings and environmental metadata (sea state, swell height and visibility) were submitted from the pelagic ecosystem survey in the Western English Channel and Celtic Sea (PELTIC, 2013–2018), and the Celtic Sea Herring Acoustic Survey (CSHAS, 2014 to 2016 and 2018). (v) Commercial fishery. ABT bycatch in the Irish mid-water pair trawl fishery for albacore (Thunnus alalunga; Bonnaterre, 1788) was recorded between 2003 and 2017.
Pelagic ecosystem surveys in the Western English Channel and Celtic Sea
The Centre for Environment, Fisheries and Aquaculture Science (CEFAS; UK) conduct annual acoustic surveys (2013 onwards) for pelagic ichthyofauna and plankton in the western English Channel and southern Celtic Sea (PELTIC; van der Kooij et al., 2015). Spatial coverage increased in 2017 from 47 464 to 115 851 km2 to encompass the full spatial range of the sardine (Sardina pilchardus; Walbaum, 1792) stock in ICES subarea 7 (ICES, 2019a). For both the PELTIC and CSHAS surveys, the survey technique is a line transect survey with a single vessel (Evans and Hammond, 2004). During acoustic transects, visual watches were conducted from the bridge (11 m above sea level) in daylight hours and focussed on the area dead ahead and 45° to either side of the vessel. Effort data (time, vessel location, and environmental conditions) were recorded every 15 min. For each sighting time, ship location, species, distance and bearing were recorded along with environmental conditions (i.e. sea state, visibility, cloud cover, swell height, precipitation, wind speed and wind direction). ABT sightings were assigned a confidence rating, with one being definite, two being probable and three being possible.
Celtic Sea Herring Acoustic Survey
Between 2014 and 2018, acoustic surveys were conducted for herring (Clupea harengus; Linneaus, 1758) during October by the Marine Institute, Ireland (O’Donnell et al., 2018). The spatial coverage of the survey increased in 2016 from 42 767 to 51 111 km2 to account for a shift in the distribution of herring in the area. Watches were conducted from the crow’s nest (18 m above sea level), otherwise, marine observer survey protocols were the same as for the PELTIC survey.
Bycatch by Irish mid-water pair trawl fishery for albacore (2003 to 2017)
Irish pair-trawl vessels targeting albacore in the northeast Atlantic report monthly ABT bycatch to the International Commission for the Conservation of Atlantic Tunas (ICCAT) at a spatial resolution of either 5° by 5° (prior to 2007) or 1° by 1° (2008 onwards). Catch and effort data from the ICCAT Task II catch/effort database were downloaded for bycatch up to 2017 (https://www.iccat.int/en/accesingdb.html; last accessed 25 Janary 2021) and were analysed in three spatially discrete regions (Figure 5): on-shelf waters off the UK and Ireland, shallower than 200 m (“on-shelf”), off-shelf waters of the northeast Atlantic, deeper than 200 m (“off-shelf”), and the Bay of Biscay (“Biscay”). The Irish albacore fleet are prohibited from targeting ABT and available ABT quota is for bycatch only. Changes in the spatial fishing strategy of the fleet are therefore assumed to be due to changes in the spatial distribution and/or availability of albacore in waters of the northeast Atlantic. Research indicates that albacore align to thermally suitable habitat between 16°C and 18°C (Sagarminaga and Arrizabalaga, 2010) and thus changes in their distribution (and the distribution of fishing fleets) are plausible.
Validation of sightings data
For sightings collected by non-scientific personnel (The general public, ecotour A and ecotour B), reporters were encouraged to submit accompanying photographs for species validation (e.g. https://www.thunnusuk.org/submit-sightings; Figure 1). Photographs were assessed by the first author for accuracy. No photographs were submitted with mistaken species identities. Sightings from these non-scientific data sources were not included in time series analysis. Characteristics of sightings collected by scientific personnel are summarized in Supplementary Table S1. To investigate the potential effect of duplicate and “probable” (i.e. confidence rating “2”) records on our results we conducted sensitivity analyses for all sighting time series (Supplementary Figures S4–S6). This consisted of comparing our results when removing (i) all but one daily record (i.e. “ABT positive days”), and (ii) all sightings with a confidence level of “2”. For each of (i) and (ii) Spearman rank correlation tests were conducted on new datasets (Supplementary Figures S4–S6). Results from these analyses indicate no change from the results we present here. Consequently, only “possible” sightings (confidence rating “3”) were excluded due to their uncertainty. Given the often low numbers of daily records for each dataset (between 1 and 10) and the highly mobile nature of ABT (>200 km in a single day; Horton et al., 2020), duplicate records are highly unlikely. Sightings were reported with and without information on shoal size. Given the challenges in accurately counting the numbers of individuals in shoals and the high number of observers we chose to omit information on shoal size (see Supplementary Figures S4–S6).
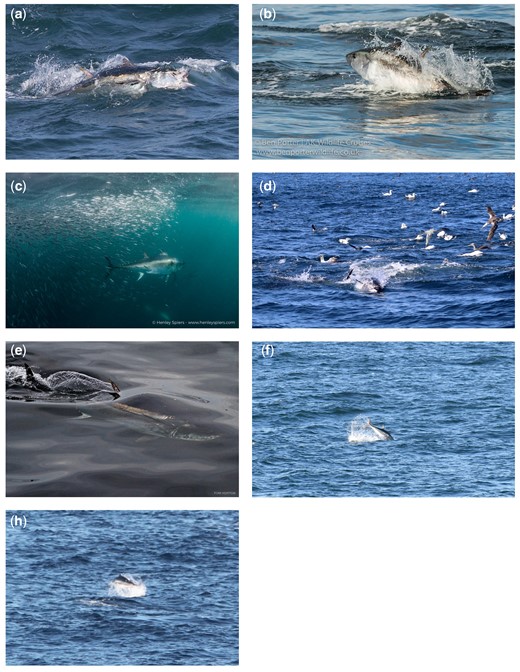
Examples of Atlantic bluefin tuna sightings analysed in this study. Images taken by members of the public, ecotour operators, and scientific staff between 2015 and 2018 detailing characteristic surface-orientated feeding behaviour of Atlantic bluefin tuna off the UK and Ireland. (a) General public dataset, August 2017, (b) Ecotour A, August 2017, (c) Ecotour B, September 2017, (d) Ecotour C, August 2018, (e) opportunistic surveys (taken by Horton), (f) PELTIC, and (g) CSHAS. Photo credits: (a) Joe Pender/Scilly Pelagics, (b) Ben Porter/AK Wildlife Cruises, (c) Henley Spiers, (d) Thomas Horton/Marine Discovery Penzance, (e) Thomas Horton, (f) Jeroen van der Kooij, and (g) Seán O Callaghan/IWDG.
Body length data
ABT that were bycaught by fisheries operating in the English Channel were measured ashore during biological sampling by scientific staff (curved fork length, CFL; n = 46). In addition, ABT captured during scientific fishing off northwest Ireland (2016, n = 16; Horton et al., 2020) and southwest England (2018 and 2019, n = 39) were measured prior to release with electronic tracking tags. Tracking data form an additional study and are outside the scope of this work.
Database preparation and analyses
Data that could not be corrected for observer effort (public sightings, two ecotour operators and regional by-catch) were error checked (observer, time, date and location) and expressed as raw sightings. For temporal analysis, public sightings were considered to operate year-round and ecotour operator active months were inferred from websites, with effort assumed to be evenly distributed across active months (ecotour A and ecotour B). Median first and last sightings of ABT were inferred from the general public and ecotour A datasets due to effort occurring year-round.
Sightings per unit effort (SPUE) indices were calculated for data that could be corrected for observer effort (PELTIC and CSHAS, ecotour C and opportunistic surveys), defined here as annual summed sightings divided by annual summed effort (distance surveyed). Effort data are defined as track distances when observers were active on watch and sea states were four or less (97% of sightings, Supplementary Figure S1). To allow comparison of time series data pre- and post-expansion for the CSHAS and PELTIC surveys, only data that occurred within the areas defined by surveys pre-expansion were used. Irish albacore fleet data were screened to exclude records when the fishery was not pair trawling (i.e. operating as a gill-net fishery) and effort was reported as “Days Fished” (Supplementary Figure S6). Bycatch per unit effort (BPUE) was calculated annually for 2003 to 2017 by dividing summed ABT bycatch by summed fishing effort. Sightings, bycatch and effort time series data from ecotour C, PELTIC and CSHAS surveys and the Irish albacore fleet allowed calculation of six relative indices of occurrence.
All mapping and analyses were conducted in QGIS (QGIS Development Team, 2019) and R (R Core Team, 2018) and all errors are reported as one standard deviation. Indices of occurrence (ecotour C, PELTIC, CSHAS, and Irish albacore) were not temporally auto-correlated beyond lag-0 (threshold was p = ≤0.05, ascertained using the function “acf” in R) and as such statistical tests without correlation structures were used to investigate changes over time. Correlations between survey year and indices of occurrence were studied using non-parametric Spearman’s rank correlation tests.
Investigating drivers of occurrence
Annual indices of ABT abundance, environment and pelagic prey biomass were available for the years 2013 to 2018. Modelled ABT abundance estimates (spawning stock biomass, SSB) were provided by ICCAT for the purposes of this study (ICCAT, 2020). SSB estimates were calculated using a Virtual Population Assessment (Garavis, 1988). Annual total biomass estimates of ABT forage fish with spatially discrete stock units occurring within the PELTIC survey range (sardine; sprat, Sprattus sprattus, Linneaus, 1758; and, European anchovy, Engraulis encrasicolus, Linneaus, 1758) were generated from the PELTIC survey data using recommended practices (ICES, 2015). For the environment index, detrended and unsmoothed monthly values for the Atlantic Multidecadal Oscillation (AMO; downloaded at http://www.esrl.noaa.gov/psd/data/timeseries/AMO; last accessed 25 January 2021) were averaged to obtain annual means. A generalized linear model (GLM, Gaussian family) was fit to annual SPUE with fixed terms for stock size (SSB), environment (annual mean AMO) and prey (total pelagic prey biomass) using the function “GLM” in R. The most appropriate model was selected by removing individual fixed effects and comparing with the null model using a likelihood ratio test (F-test) and assessed using Akaike’s information criterion. As model residuals were normally distributed the final model was validated by visually inspecting standardized residuals (Supplementary Figure S7).
Results
A total of 989 unique ABT observations were made (2014 onwards) across eight databases of surface sightings of marine animals (observer effort between 2008 and 2019; Figure 2). Surface-feeding ABT were recorded by members of the general public (n = 80; 8%), ecotour operators (n = 175; 18%), observers during opportunistic surveys (n = 547; 55%), and observers during the PELTIC and CSHAS surveys (n = 187; 19%), with 985 records (>99%) including spatial information (Figure 2). Most ABT interactions were reported from Atlantic-facing shores (n = 983; >99%) and occurred within Exclusive Economic Zones (EEZ) of the UK (n = 693; 70%), Ireland (n = 287; 29%), and France (n = 5; <1%). Most records from the general public (Figure 2) and the PELTIC survey (Figure 3) occurred off the southern English coast and Isles of Scilly (86 and 77%, respectively), despite the PELTIC survey having a much broader survey range. All records from the CSHAS survey occurred off southeast Ireland in the Celtic Sea (Figure 4). Median time of first observation of ABT in waters off southwest England (inferred from the general public and ecotour datasets; Figure 2b) was the 14th of August (range 5 May to 1 October; n = 11 years). The median last observation (inferred from ecotour A and the general public datasets) was the 27 October (range 29 August to 17 February; n = 6 years). Generally, peak annual ABT observations occurred between August and November.
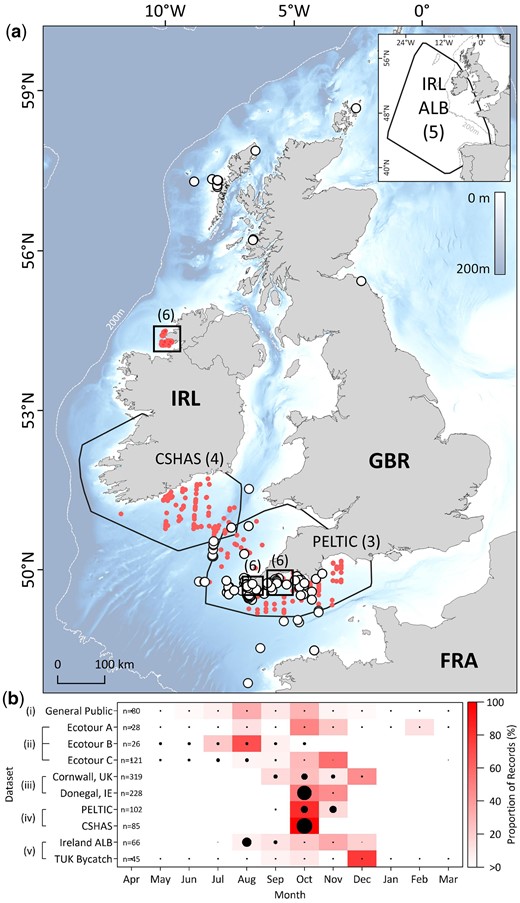
Occurrence of Atlantic bluefin tuna off the United Kingdom and Ireland. (a) Opportunistic sightings of surface-feeding shoals of ABT, corrected for effort (white filled circles) and non-effort corrected (red circles). Black polygons in main and inset map delineate spatial extents of effort-based datasets (numbers in parentheses indicate corresponding figure in this manuscript that shows data in more detail). Bathymetry courtesy of the Generalized Bathymetric Chart of the Oceans (GEBCO, https://www.gebco.net/). (b) Temporal range of occurrence data (effort normalized where possible) pooled for all survey years. Black filled circles denote months where effort was expended, and size of circle denotes relative effort. Occurrence datasets are labelled as outlined in the materials and methods.
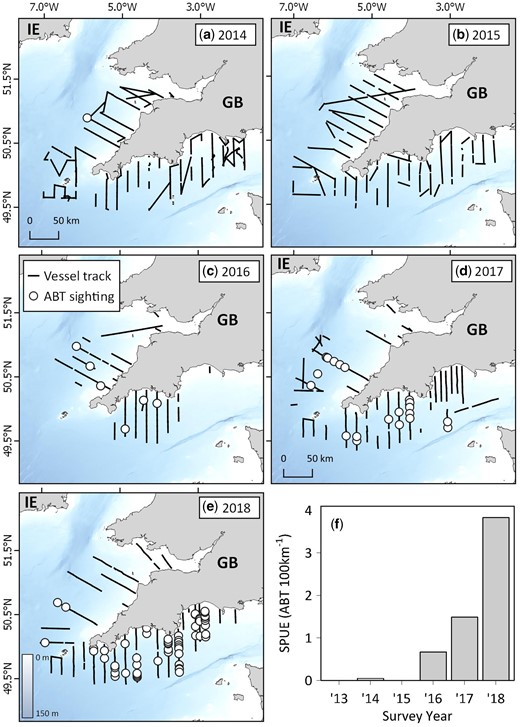
Multi-annual sightings of Atlantic bluefin tuna from the Cefas PELTIC survey between 2014 and 2018. (a–e) Vessel tracks (where observers were on effort and Beaufort Sea States were four or less) and ABT sightings off the southwestern United Kingdom, and (f) time series of ABT sightings per unit effort (SPUE) between 2013 and 2018.
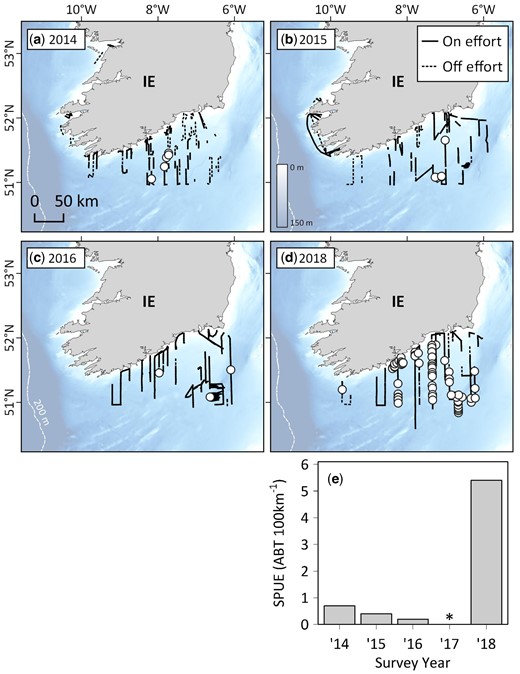
Multi-annual sightings of Atlantic bluefin tuna from the Marine Institute’s Celtic Sea Herring Acoustic Survey (CSHAS) between 2014 and 2018. (a–d) Vessel tracks (where observers were on effort and Beaufort Sea States were four or less) and ABT sightings off southern Ireland, and (e) time series of ABT sightings per unit effort (SPUE) over the same period (asterisk denotes a year where data were unavailable).
Time series of ABT sightings
Indices of SPUE were significantly correlated with survey year for the PELTIC survey (77-fold increase between 2014 and 2018; Spearman’s correlation, rs = 0.9, p = 0.0149; Figure 3) and ecotour C (8-fold increase between 2015 and 2018; Spearman’s correlation, rs = 0.9, p = 0.0007; Figure 6c). For the PELTIC survey, SPUE values were positively related to SSB estimates generated by ICCAT (GLM; t = 8.369, df = 5, p = 0.014; Figure 7, Supplementary Figure S8) and negatively related to mean annual AMO (GLM; t = −4.928, df = 5, p = 0.039) but not to prey biomass (t = −3.792, df = 5, p = 0.063). SPUE was not correlated with survey year for the CSHAS survey but peaked at 5.2 ABT per 100 km in 2018 (mean 1.6 ± 2.4 ABT per 100 km; Figure 4).
Bycatch
The Irish albacore fleet bycaught a total of 114 tonnes of ABT between 2003 and 2017 in three areas of the northeast Atlantic (Figure 5; Supplementary Table S4): The Bay of Biscay (“Biscay”; annual mean 2.9 ± 3.3 tonnes), off-shelf waters northeast Atlantic deeper than 200 m (“off-shelf”; 6.8 ± 7.3 tonnes) and on-shelf waters off the UK and Ireland, shallower than 200 m (“on-shelf”; 1.8 ± 2.1 tonnes). BPUE in the Irish albacore fishery was significantly correlated with survey year in on-shelf (9-fold increase between 2011 and 2017; Spearman’s correlation, rs = 0.98, p = <0.0001; Figure 5b) and off-shelf regions (204-fold increase between 2004 and 2017; Spearman’s correlation, rs = 0.95, p = <0.0001, p = ≤0.05; Figure 5c). BPUE in the Bay of Biscay region did not increase over time (r = −0.2, Spearman’s correlation, p = 0.8; Figure 5d). Annual mean latitude of fishing effort varied significantly (Kruskal–Wallis rank sum, χ2 = 4266, df = 14, p = <0.001), highlighting an initial phase when vessels targeted albacore in the Bay of Biscay (2003 to 2008), and a second phase when vessels switched to higher latitude waters of the on- and off-shelf northeast Atlantic (2009 onwards). The highest BPUEs, where effort was more than 10 days fished, were in the off-shelf region (2017, 138 kg per day) and in the Celtic Sea area of the on-shelf region (2015, 127 kg per day). In all years between 2013 and 2017 there were 1° × 1° grid cells in the on-shelf region where catches were comprised solely of ABT (n = 18 grid cells; mean catch 0.7 ± 0.6 tonnes per grid cell).
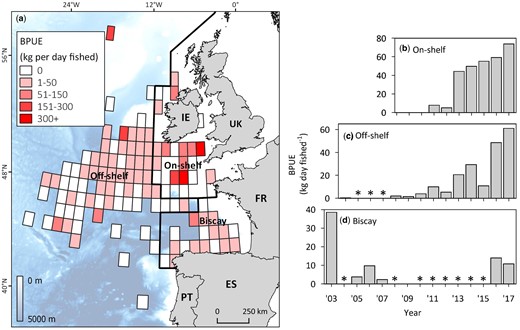
Atlantic bluefin tuna bycatch in the Irish albacore fishery between 2003 and 2017. (a) Map showing spatial variability in ABT bycatch per unit effort (BPUE) in the Irish mid-water trawl fishery for albacore in the northeast Atlantic averaged across all years when data was reported at 1° × 1° resolution (2008–2017). Bold black lines delineate areas used to calculate regional time series (labelled in bold). (b–d) regional time series of ABT BPUE. Asterisks denote years where no effort was expended for that area.
Opportunistic surveys and body length
Mean SPUE during scientific tagging fieldwork off Ireland (990 km of effort over 16 days in 2016) and southwest England (1594 km of effort over 24 days in 2018; Figure 6) was 0.2 ± 0.4 ABT per km and 0.1 ± 0.4 ABT per km, respectively. Maximum daily ABT sightings (of single or multiple fish) off Ireland was 51 and 61 off southwest England. ABT measured as part of scientific tagging and bycatch post-mortems were significantly larger off northwest Ireland (n = 16, mean 220 ± 13 cm CFL) than southwest England (n = 79, mean 180 ± 20 cm CFL; Kruskal Wallis, χ2 = 56, df = 2, p = <0.001).
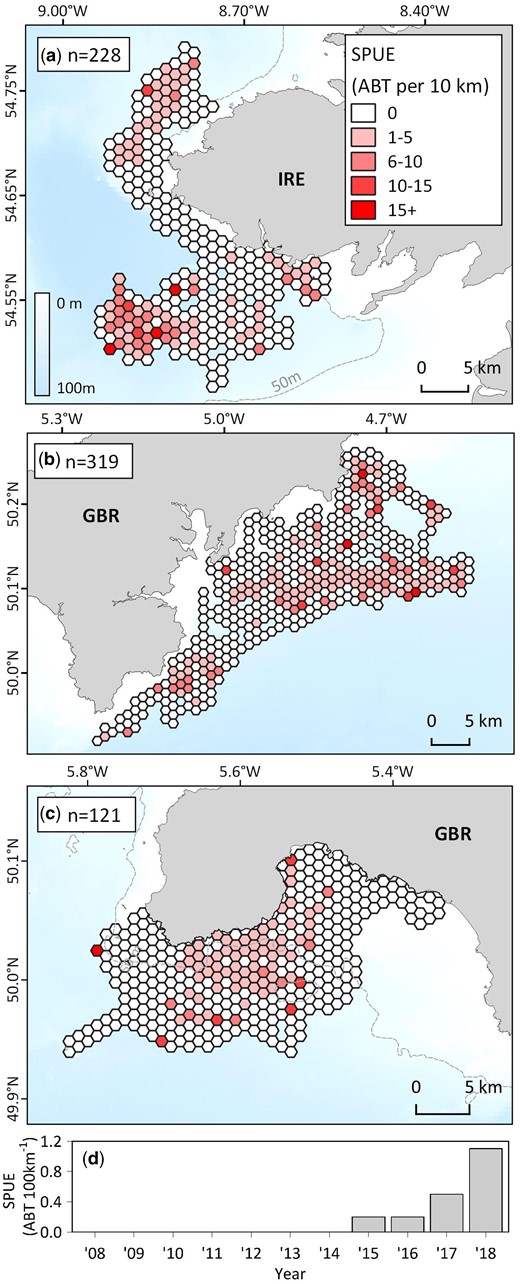
Opportunistic Atlantic bluefin tuna sightings collected off the United Kingdom and Ireland. Effort corrected maps with 1 km hexagonal grids detailing spatial variability in ABT sightings per unit effort (SPUE) from opportunistic surveys during electronic tagging research off (a) Donegal, Ireland (2016; Horton et al., 2020), (b) the southwestern United Kingdom (2018), and (c) during ecotour trips for ecotour C (2008–2018; for annual maps see Supplementary Figure S9). (d) time series of ABT SPUE for ecotour C. Broader spatial context for plots is provided in Figure 2.
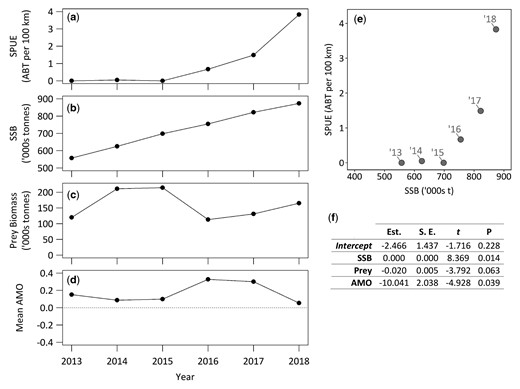
Potential drivers for Atlantic bluefin tuna sightings in the PELTIC survey between 2013 and 2018. (a) Time series of ABT sightings per unit effort (SPUE), (b) ABT eastern spawning stock biomass (SSB), (c) summed annual sardine (Sardina pilchardus), sprat (Sprattus sprattus), and European anchovy (Engraulis encrasicolus) biomass estimates, and (d) annual mean index for the Atlantic multidecadal oscillation (AMO) where the blue dotted line delineates boundary between warm (positive) and cold (negative) AMO indexes. (e) The relationship between SSB and SPUE for the PELTIC survey. Labels denote the year of the data point in the time series. (f) Results from the generalized linear model with SPUE (a) as a response variable and SSB (b), summed prey biomass (c) and annual mean AMO (d) as predictors.
Discussion
Our study details the reappearance of ABT into territorial (12 nm) waters of the UK since 2014, after a sustained period of absence. We also document ABT un territorial waters off the northwest coast of Ireland, where reports suggest they had become scarce since 2007 (Cosgrove et al., 2008). We reveal increases in effort-corrected surface sightings of ABT off southwest England (from 2014) and bycatch of ABT in commercial fisheries (from 2011), up to peak occurrences in 2018 and 2017, respectively. Peak occurrences of ABT reported by the PELTIC survey correlate with highest modelled SSB, and annual mean AMO, indicating a possible relationship between ABT population size, hydroclimatic forcing and the increased occurrence of ABT in territorial waters of the UK.
Annual occurrence of Atlantic bluefin tuna return off the UK and Ireland
We have used surface sightings and bycatch as an occurrence metric for ABT. Sightings datasets, once adequately controlled (Supplementary Table S1), have been used to define the phenology and spatial habits of large fish species including basking (Witt et al., 2012) and white sharks (Moro et al., 2019) despite neither species being obligate surface dwellers. Electronic tracking data suggest that ABT spend a majority of time in surface waters whilst foraging in the study region (Stokesbury et al., 2007; Horton et al. 2020). Consequently, it is likely that the increase in sightings we report reflects an increase in occurrence, rather than a recent shift towards surface-orientated feeding behaviour of ABT increasing the likelihood and regularity of surface sightings. In the Irish fishery, albacore shoals are identified using sonar and targeted mid-water using pair trawls (Cosgrove et al., 2014). Thus, rates of ABT bycatch in this fishery are independent of surface feeding behaviours of ABT. Bycatch of ABT could, in theory, be affected by changes in the associations between albacore and ABT but this is not testable with the data available. A simpler and more likely explanation is changes in bycatch rates reflects changes in occurrence of ABT. Together these datasets indicate that the trends observed represent an increased occurrence of ABT in the study region (2014–2018) and not a behaviour or sampling bias.
Data in the present study suggest that ABT were likely absent, or present in undetectable numbers, in the English Channel and Celtic Sea between 2008 and 2014. Prior to, and during this time, several other surveys focused on large marine fauna in the region (Jones, 2012; Leeney et al., 2012; CSHAS cruises between 2004 and 2012—https://oar.marine.ie/) but no ABT were recorded. Kingston et al. (2004) report on 45 days of scientific fishing for ABT off southwest England between September and December in 2003, where no ABT were sighted or caught. By contrast, a similar survey in 2018 (Figure 5b, overlapping spatially and seasonally with Kingston, 2004) recorded 319 ABT surface sightings in 24 days, and a further eleven ABT were caught. Furthermore, Atlantic-wide electronic tracking of ABT between 1996 and 2014 has indicated periods of residency off west Ireland, but not the English Channel (Stokesbury et al., 2007; Walli et al., 2009; Aranda et al., 2013; Arregui et al., 2018). While ABT may not have been the primary species of concern for Jones (2012) or Leeney et al. (2012), when considered with Kingston (2004) and electronic tracking data (e.g. Stokesbury et al. 2007; Walli et al. 2009), these studies collectively indicate that ABT have likely been absent, or present in a much lower density in the English Channel for far longer than the period documented here.
Likely causes of the return of Atlantic bluefin tuna
The reappearance of ABT has been recorded in other regions of the northeast Atlantic, most notably the North Sea where ABT disappeared in 1962 and reappeared in 2010s (Tiews, 1978; MacKenzie et al., 2017; Nøttestad et al., 2020). Prior research has indicated that ABT migrate seasonally from lower latitude waters of the eastern Atlantic up the northeastern Atlantic shelf edge to higher latitude off-shelf foraging grounds (e.g. Block et al., 2005). The observations we present suggest a change in ABT distribution in the northeast Atlantic in recent years, with ABT also now foraging in territorial waters of the UK. It seems likely that multiple processes including top-down population control (e.g. fishing pressure), ocean climate and prey dynamics have acted in concert to increase ABT occurrence in these on-shelf regions. Here, we begin investigation into the likely causes of this increased occurrence. Recognizing that datasets spanning short timeframes should be cautiously interpreted, we independently consider each factor analysed below.
Stock management
Fishing can act as a top-down control on fish populations, that, in-turn can stimulate distributional changes as fish populations decline (Lawton, 1993). ABT distribution in the open Atlantic has been positively correlated with relative stock abundance (Worm and Tittensor, 2011). After a period of severe overfishing (Gagern et al., 2013; Porch et al., 2019), catch quotas for the eastern-Atlantic stock of ABT were limited from 2009 onwards and coupled with increased enforcement and traceability initiatives. As a result, the stock has been recovering since 2014, with modelled abundance estimates suggesting that the spawning stock grew from ca. 300 000 tonnes in 2008 to ca. 600 000 tonnes in 2014 (ICCAT, 2020). Off northwest Ireland, ABT have been bycaught since the 1970s (O’Farrell and Molloy, 2004) and encountered by anglers since 2000 (e.g. Stokesbury et al., 2007). After 2007, catches and sightings declined, which was seen as symptomatic of the depleted state of the ABT eastern stock (Cosgrove et al., 2008). Our data suggest that ABT were sighted more regularly from 2014 onwards in territorial waters off the southern and north western Irish coasts, when the ABT stock was estimated at double the size it was in 2007. This could indicate a density dependent effect: Irish foraging grounds may be peripheral in the range of ABT and are only occupied in significant numbers when the ABT stock is of a large enough size, corroborating the positive relationship between range and abundance in ABT identified by Worm and Tittensor (2011). However, this relationship alone does not describe the pattern of ABT occurrence off southwest England. Although ABT were caught in 2002, 2003 and 2004 off the northwest coast of Ireland (Cosgrove et al., 2008) none were caught off southwest England, despite fishing efforts (Kingston, 2004). During this period, catches by Japanese longline vessels operating in the northeast Atlantic (approximately 600 km from northwest Ireland) were comprised of ABT of 120 cm fork length and larger (Kimoto et al., 2014). However, since 2010, catches have been comprised of progressively fewer ABT similar in size to those measured off southwest England (120–200 cm fork length; Ortiz and Palma, 2020). This could reflect changes in the migratory patterns of smaller ABT, possibly due to the removal of older fish, which may “teach” migratory routes to the rest of the population (De Luca et al., 2014). Finally, neither the UK nor the Republic of Ireland have previously had commercial ABT fishing quota (except for Ireland’s access to the 61.69 tonnes of by-catch quota allocated by ICCAT to EU Member States; EU, 2011) and no other EU member state routinely targets ABT in the EEZs of the UK and Ireland. As such, these waters have, for the large part, acted as an area closed to commercial fishing for ABT. This may have enhanced the survival likelihood for individuals whilst residing EEZs of the UK and Ireland (Boerder et al., 2019). However, individuals present seasonally in inshore waters of the UK and Ireland may still be vulnerable to fishing pressure in other areas in the Atlantic Ocean as they migrate (Block et al., 2005; Stokesbury et al., 2007; Horton et al., 2020). In summary, the proliferation of ABT off the UK may be linked to changes in population demographics, as well as population size and regional protection off the UK and Ireland due to the lack of any target fishery.
Environment
Migrations of ABT are influenced by ontogeny, life history and environmental factors such as ocean temperature (Block et al., 2005) as fish migrate between suitable environments for foraging and spawning (Druon et al., 2016; Reglero et al., 2018). Between 2003 and 2014, waters within the UK EEZ were shown to be suitable (i.e. sufficiently warm) foraging habitat for ABT of 5–25 kg mass in the summer, and ABT of more than 25 kg mass year round (Druon et al., 2016). Faillettaz et al. (2019) corroborate this and indicate that the study region has been a suitable habitat for ABT since the onset of the most recent warm phase of the AMO (1995 to present), which was positively correlated with ABT abundance. This matches the broader pattern of occurrence of ABT off the UK and Ireland (i.e. ABT returned to territorial waters off southwest England during a warm AMO phase). However, we show that ABT did not appear in any considerable numbers off southwest England until 2014, nineteen years into the most recent warm AMO phase (Druon et al., 2016; Faillettaz et al., 2019). Ambient conditions will play a role in structuring ABT space use, and certain episodes of elevated occurrence have been explained by environmental variations (i.e. Brazil 1961–1966; Fromentin et al., 2014). However, in territorial waters of the UK the temporal mismatch between the timing of this occurrence episode (2013 until present) and the periods of highest habitat suitability (1995 to present; Druon et al., 2016; Faillettaz et al., 2019) indicate that other causal factors (e.g. fine-scale environmental processes, fisheries management, conservation and prey) could further explain recent trends in ABT occurrence.
Prey
ABT migrate seasonally into higher latitude waters of the North Atlantic to forage on a wide variety of caloric-rich pelagic prey (Pleizier et al., 2012; Olafsdottir et al., 2016), which include mackerel (Scomber scombrus; Linneaus, 1758), Atlantic saury (Scomberesox saurus; Walbaum, 1792), sardine, sprat, herring and European anchovy in the study region (O’Donnell et al., 2013; Nolan et al., 2014; van der Kooij et al., 2015). Consequently, increases in the abundance of any of these species, either through range expansion (e.g. anchovy and climate—Petitgas et al., 2012) or population growth, could have a bottom-up effect on predator residency (Sherley et al., 2013; Golet et al., 2015). Here, we found no relationship between overall prey biomass and relative ABT occurrence in the PELTIC survey range. However, ABT-prey systems are often complex (Olson et al., 2016) and it could be that prey species not included in our analyses also factor into ABT residency in EEZs off the UK and Ireland. Additionally, pelagic fish stocks in the northeast Atlantic are changing (Petitgas et al., 2012; Montero-Serra et al., 2015; Fernandes et al., 2017) but not all in a similar manner: while mackerel (ICES, 2019b) and sardine (ICES, 2019a) stocks are growing and anchovy have expanded their population in the North Sea (Petitgas et al., 2012), sprat and Celtic Sea herring have been declining since 2013 (ICES, 2018) and 2011 (ICES, 2019c), respectively. Given the mobile nature and wide variety of prey species of ABT, analyses of longer time series and specific research on the foraging dynamics off the UK and Ireland may aid in identifying a causal link between regional ABT occurrence and the dynamics of pelagic fish stocks.
Conclusions
Here, we have demonstrated the utility of combining multiple datasets to shed light on the occurrence of ABT in the coastal waters of the UK and Ireland. We present data revealing ABT have returned to the English Channel from 2014 onwards, seasonally between August and December, after a period of prolonged absence. Our results suggest an ontogenetic difference in distribution, with larger year classes further North in the waters off Ireland, highlighting the complex nature of ABT dispersal dynamics. We have identified a potential link between observations of ABT off the UK and the size of the eastern stock of ABT and climate, but not prey. It is, however, likely that management, fishing, environment and prey dynamics have all contributed to the proliferation of ABT in territorial waters of the UK. Future research should consider all of the variables we consider over the longest timescale possible and aim to examine the role of each factor in the spatial life history of ABT. The effective conservation of this important apex predator that has now returned to coastal waters of the UK should be of paramount importance.
Data availability
Where applicable available data sources are linked in text. Where not specifically referred to in-text, data are subject to inter-organization data-sharing agreements and/or GDPR restrictions. Consequently, data requests will be processed on a case-by-case basis by the authors.
T. W. Horton, B. A. Block, R. Davies, L. A. Hawkes, D. Jones, H. Jones, K. Leeves, N. Ó Maoiléidigh, D. Righton, J. van der Kooij, D. Wall, and M. J. Witt. 2021. Evidence of increased occurrence of Atlantic bluefin tuna in territorial waters of the United Kingdom and Ireland. – ICES Journal of Marine Science, 00: 000–000.
Acknowledgements
T.W.H. was supported by a University of Exeter PhD scholarship, M.J.W., L.A.H. and T.W.H. were supported by the European Maritime and Fisheries Fund grant ENG2395 and Defra grant C7531. B.A.B. is supported by the NOAA Bluefin Tuna Research Program and TAG A Giant. We thank the chief scientists, captains, crew, and scientists on board the RVs “Celtic Explorer” and “Endeavour” for their help during the CSHAS and PELTIC surveys, respectively. We also thank the many contributors to the Thunnus UK sightings database for submitting ABT sightings data.
Author contributions
This study was designed by L.A.H., T.W.H., D.R., J.v.d.K., and M.J.W. D.W. managed surveyors and data quality for Irish Whale and Dolphin Group ship-based surveys. J.v.d.K. was Chief Scientist aboard and responsible for managing all aspects of the Cefas PELTIC survey and RD coordinated wildlife observers on-board RV Cefas Endeavour. D.J., H.J., and K.L. collected and supplied ecotour operator data. N.Ó.M. coordinated the 2016 electronic tracking off the northwest coast of Ireland. Analyses and figure production were conducted by T.W.H. The manuscript was drafted by T.W.H. and edited by B.A.B., L.A.H., D.J., N.Ó.M., D.R., J.v.d.K., D.W., and M.J.W.
