


Abstract
A major goal of global gene expression profiling in plant seeds has been to investigate the parental contributions to the transcriptomes of early embryos and endosperm. However, consistency between independent studies has been poor, leading to considerable debate. We have developed a statistical tool that reveals the presence of substantial RNA contamination from maternal tissues in nearly all published Arabidopsis thaliana endosperm and early embryo transcriptomes generated in these studies. We demonstrate that maternal RNA contamination explains the poor reproducibility of these transcriptomic data sets. Furthermore, we found that RNA contamination from maternal tissues has been repeatedly misinterpreted as epigenetic phenomena, which has resulted in inaccurate conclusions regarding the parental contributions to both the endosperm and early embryo transcriptomes. After accounting for maternal RNA contamination, no published genome-wide data set supports the concept of delayed paternal genome activation in plant embryos. Moreover, our analysis suggests that maternal and paternal genomic imprinting are equally rare events in Arabidopsis endosperm. Our publicly available software (https://github.com/Gregor-Mendel-Institute/tissue-enrichment-test) can help the community assess the level of contamination in transcriptome data sets generated from both seed and non-seed tissues.
COMMENTARY
A major focus of plant seed biology and epigenetics is to understand the gene expression profiles of the early embryo and endosperm, and relative contributions of the maternal and paternal genomes to these transcriptomes. Advances in transcriptomics made it feasible to study global gene expression of these two fertilization products and more than 100 transcriptomes from Arabidopsis thaliana embryos and endosperm have been generated to date (Nodine and Bartel, 2010, 2012; Belmonte et al., 2013; Autran et al., 2011; Slane et al., 2014; Xiang et al., 2011; Hsieh et al., 2011; Gehring et al., 2011; Pignatta et al., 2014). However, data from independent studies investigating parental contributions to early embryo and endosperm transcriptomes has been inconsistent, and the parental genomic contributions to early zygotic transcriptomes has remained controversial (Nodine and Bartel, 2012; Autran et al., 2011; Weijers et al., 2001; Meyer and Scholten, 2007; Del Toro-De León et al., 2014). We hypothesized that inconsistencies between the studies mentioned above are due to varying amounts of RNA contaminants from cells surrounding the tissues of interest. To detect RNA contamination in Arabidopsis embryo transcriptomes, we developed a statistical tool (named the tissue enrichment test) that quantifies the levels of tissue-enriched transcripts in microarray or high-throughput sequencing data sets (see Methods). For Arabidopsis, an extensive collection of microarray data sets has been generated by laser capture microdissection (LCM) to profile global gene expression in seed subcompartments during development (Belmonte et al., 2013). We used this LCM atlas as a reference to identify tissue-enriched transcripts from seven tissue types at six stages of development (Figures 1A and 1B). To be considered tissue-enriched, a transcript was required to show 8-fold significantly higher levels in the tissue of interest compared with other tissues in the seed (ANOVA, 0.1% false discovery rate; Supplemental Data Set 1). Parameters for the test were selected by internally benchmarking the test against the LCM atlas and optimizing its sensitivity and specificity for reporting the presence of the respective microdissected tissue types (see Methods; Supplemental Figure 1A). As previously reported, both embryo and endosperm have gene expression profiles that are very distinct from maternal seed coat tissues, with hundreds of transcripts detected only in the seed coat at all stages of development (Belmonte et al., 2013). Moreover, because the maternal seed coat comprises the majority of tissue in a young fertilized seed, transcriptomes from seeds are highly enriched in seed coat RNA during the early stages of development (Figure 1B).
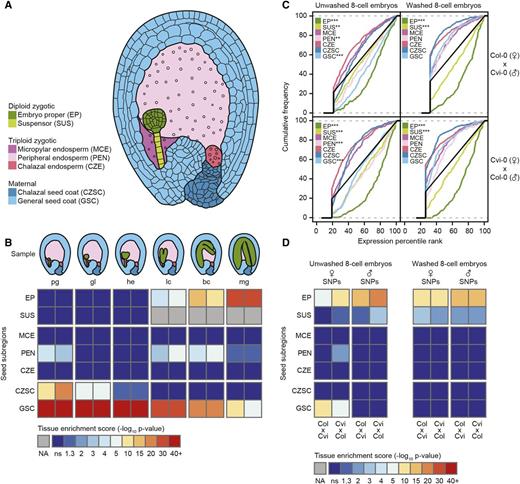
Detection of RNA Contamination in Tissue-Specific Transcriptomes.
(A) Diagram of a cross section from an Arabidopsis seed during the globular stage of embryo development. Three basic tissue types exist in the seed: the diploid fertilization product (embryo), the triploid fertilization product (endosperm), and the maternal tissue (seed coat). These tissues were further divided into subregions defined by Belmonte et al. (2013) and are indicated in the key.
(B) Heat map illustrating results from the tissue enrichment test on transcriptomes from whole seed sections at six stages of development (Belmonte et al., 2013). Stages are indicated from left to right: preglobular (pg), globular (gl), heart (he), linear cotyledon (lc), bent cotyledon (bc), and mature green (mg). Rows represent tissue subregions as abbreviated in (A). Paired columns represent results from biological replicates. Colors indicate the level of tissue enrichment according to the key.
(C) Cumulative frequency distribution of tissue-enriched transcripts from each of the seven seed compartments in transcriptomes from washed and unwashed hand-dissected eight-cell stage embryos from a reciprocal interaccession cross (Nodine and Bartel, 2012). Maternal accession is listed first. Cvi-0, Cape Verde Islands-0. Asterisks indicate P values: P < 0.05 (*), P < 0.01 (**), and P < 0.001 (***) based on a Wilcoxon rank-sum test with respect to the population of non-tissue-enriched genes (black line).
(D) Tissue enrichment of reads overlapping SNPs exclusive to the maternal or paternal ecotype in the same embryonic transcriptomes shown in (C).
To determine whether the tissue enrichment test could detect RNA contamination in a transcriptome, we applied the test to mRNA sequencing libraries identically generated from hand dissected eight-cell stage embryos that were either unwashed or washed three times prior to RNA isolation (Nodine and Bartel, 2012). While the test detected embryo-enriched transcripts in all samples, only the unwashed samples were additionally enriched for seed coat and endosperm transcripts (Figure 1C). Furthermore, because the libraries were generated from reciprocal crosses between two inbred Arabidopsis accessions, we unambiguously determined the parent of origin for any read that contained at least one single-nucleotide polymorphism (SNP) specific to one parent. When considering the abundance of transcripts based on only SNP-specific reads, we observed that the presence of seed coat-enriched transcripts in unwashed embryos was exclusively derived from the respective maternal genome in both samples of the reciprocal cross (Figure 1D). Therefore, the tissue enrichment test reveals RNA contamination from sources other than the tissue of interest.
We then assessed the prevalence of seed coat RNA contamination in 46 published transcriptomes from Arabidopsis embryos (Nodine and Bartel, 2010, 2012; Autran et al., 2011; Slane et al., 2014; Xiang et al., 2011; Hsieh et al., 2011; Gehring et al., 2011; Pignatta et al., 2014) (Supplemental Data Set 2). Surprisingly, the majority of these transcriptomes from globular embryos or earlier stages (24/30) contained substantial seed coat contamination regardless of whether the samples were isolated by hand dissection or fluorescence-activated nuclear sorting (Nodine and Bartel, 2010, 2012; Autran et al., 2011; Slane et al., 2014; Xiang et al., 2011) (Figure 2 A). In the case of one sample (“Zygote” in Figure 2A), only enrichment for seed coat RNA could be detected. Transcriptomes generated by fluorescence-activated nuclear sorting do show enrichment for the intended cell types, but they also contain the highest amount of RNA contamination from tissues other than the embryo. No RNA contamination from maternal tissues was detected in early embryo samples isolated by LCM; however, significant contamination from the micropylar endosperm, which surrounds the early embryo, was observed in both LCM suspensor data sets as previously suggested (Slane et al., 2014) (Supplemental Figure 1B). In contrast to young embryos, none of the 16 published transcriptomes from heart stage or older embryos had a significant enrichment of seed coat transcripts (Figure 2B).
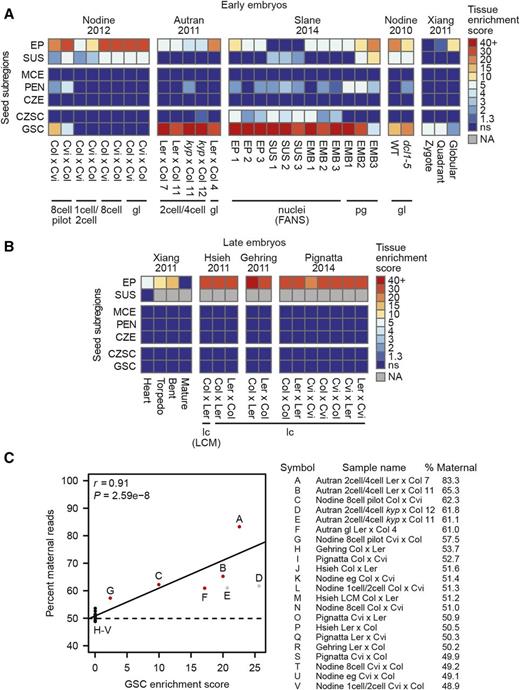
Widespread Seed Coat Contamination in Early Embryo Transcriptomes.
(A) and (B) Heat maps of tissue enrichment test results of 30 transcriptomes from embryos between the zygote and globular stages (A) or 15 transcriptomes from the heart stage or later (B) as described in Figure 1B. Column labels mark the sample name, and labels below each black bar show the developmental stage. Isolation method is specified in parentheses if it is not hand dissection.
(C) Scatterplot depicting the relationship between the presence of seed coat-enriched transcripts in a data set and the percentage of SNP-containing reads that map to the maternal genome. Pearson's r and the associated P value are indicated. Red circles indicate samples with significant presence of seed coat-enriched genes. Gray circles indicate samples with a double homozygous kyp-2/gl1-1 maternal genotype. Because the gl1-1 allele is derived from Col-5 (The Arabidopsis Information Resource), a kyp-2/gl1-1 mutant cannot be completely isogenic Ler-0. Therefore, maternal reads are not guaranteed to contain Ler-0 SNPs, and these samples were discarded from the correlation analysis (see Methods).
A major motivation for generating early embryo transcriptomes has been to study zygotic genome activation. In multiple plant species, including Arabidopsis, de novo transcription from both the maternal and paternal genomes can be observed in the zygote immediately after fertilization (Nodine and Bartel, 2012; Weijers et al., 2001; Meyer and Scholten, 2007), but the global activity of the paternal genome is currently debated (Del Toro-De León et al., 2014, 2016; Kawashima and Berger, 2014; Baroux et al., 2013; Palovaara et al., 2016). Transcriptome-wide evidence of global maternal dominance in two-cell/four-cell embryos and a gradual activation of the paternal genome through the globular stage via maternally controlled epigenetic pathways has been reported (Autran et al., 2011). However, we found that the amount of global maternal dominance in a transcriptome strongly correlates with the amount of seed coat contamination present in the sample regardless of the developmental stage (Figure 2C). The same study reported good agreement between two biological replicates of two-cell/four-cell embryos from Ler-0 × Col-0 crosses, showing a global maternal dominance of 88 and 82%, respectively (Autran et al., 2011). We were unable to replicate these results with the published data sets and instead found 83 and 65% maternally mapping reads for the two samples where the sample with less seed coat contamination had a more balanced parental contribution (Figure 2C). A difference of at least 12.9% between the two samples persisted regardless of the reference genome version or SNP collection used for analysis (Supplemental Data Set 3). A follow-up report by Baroux et al. (2013) provided a seed coat transcriptome and claimed that transcripts not detected in the seed coat when the embryo is at the two-cell/four-cell stage still show 84% total maternal reads in the data sets from Autran et al. (2011). By contrast, we found that the total reads from transcripts detected at ≥1 transcript per million (TPM) in wild-type two-cell/four-cell embryo data sets from Autran et al. (2011), but undetected in the seed coat transcriptome from Baroux et al. (2013), were 64 or 43% maternal depending on the replicate being analyzed (Supplemental Table 1). No embryo transcriptomes without detectable seed coat contamination deviated substantially from the 1:1 parental contribution expected from equal transcriptional activity of both genomes in the early embryo. Therefore, the concept of delayed paternal genome activation in plant embryos is not supported by published genome-wide transcriptome studies.
Another major field of study affected by RNA contamination is genomic imprinting. Imprinting refers to parent-of-origin-specific gene expression resulting from differential epigenetic marks on the alleles from one parent (Kinoshita, 2004; Köhler et al., 2012). In plants, imprinting has been predominantly observed in the endosperm, a terminal nutritive tissue in the seed that contains both maternally expressed imprinted genes (MEGs) and paternally expressed imprinted genes (PEGs) (Gehring, 2013). To identify imprinted genes in the endosperm, three independent studies generated transcriptomes from endosperm derived from reciprocal crosses between different Arabidopsis accessions (Hsieh et al., 2011; Gehring et al., 2011; Pignatta et al., 2014). Because RNA contaminants from the maternal seed coat would appear as false-positive MEGs, each study took measures to minimize false positives from seed coat contamination. However, the amount of seed coat contamination in each transcriptome may vary considerably, so the number and identity of true MEGs in the endosperm is currently unclear. In an effort to resolve this issue, we reanalyzed all endosperm transcriptomes from these studies to quantify the effect of RNA contamination on determining parentally biased gene expression. We detected substantial seed coat RNA contamination in all 30 hand dissected endosperm transcriptomes (Figure 3A). Furthermore, when only considering reads that specifically map to the maternal or paternal genome, we again observed significant seed coat contamination in the maternal portion of all 30 transcriptomes from hand dissected samples (Figure 3B). The endosperm is a triploid tissue, which possesses two maternal copies and one paternal copy of the genome. Therefore, random allelic sampling for all transcripts is expected to yield a 2:1 maternal-to-paternal ratio, or 66.7% maternal transcripts. As with the embryo transcriptomes, we see a strong positive correlation between global maternal bias and seed coat RNA contamination, with the single uncontaminated LCM sample most closely approaching the expected 2:1 ratio with 66.9% maternally derived reads (Figure 3C; Supplemental Data Set 3).
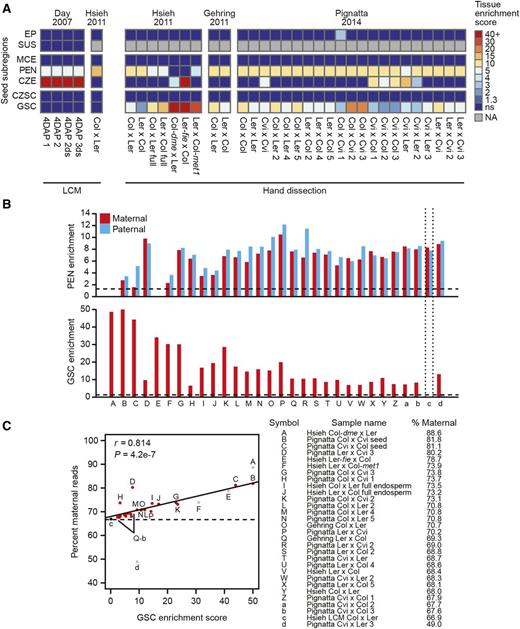
Maternal RNA Contamination of Endosperm Transcriptomes.
(A) Tissue enrichment test results of five endosperm transcriptomes isolated by laser capture microdissection (left panel) and 30 hand-dissected endosperm transcriptomes (right panel) as described in Figure 1B.
(B) Maternal and paternal SNP-specific expression of transcripts enriched in the peripheral endosperm (top panel) and the general seed coat (bottom panel) in all interaccession crosses from endosperm and two whole-seed samples. Vertical dotted lines mark the endosperm sample isolated by LCM. Horizontal dashed lines denote a tissue enrichment test P value < 0.05 (enrichment score > 1.3).
(C) Scatterplot showing the correlation of general seed coat enrichment scores (GSC) and percentage of reads mapping to maternal SNPs, as described in Figure 2C. Gray circles indicate samples derived from crosses with mutant parents (samples A, E, and F) or a sample with a ratio of SNP-mapping reads that cannot be explained by its described genotype (sample d), which were removed from the correlation analysis. Pearson's r and the associated P value are indicated.
To quantify the effect of RNA contamination on imprinting studies we reexamined parentally biased gene expression in twelve pairs of endosperm transcriptomes derived from reciprocal crosses. A gene was considered parentally biased if at least 2-fold significantly more reads were detected from the same parent in both samples from the reciprocal cross (P < 0.01, Fisher's exact test, Bonferroni multiple testing correction). Our initial unfiltered lists agree well with those originally reported (Supplemental Data Set 4). A total of 1583 maternally biased genes and 209 paternally biased genes passed these criteria in at least one endosperm reciprocal cross experiment. Because all endosperm samples in this analysis were dissected after cellularization of the endosperm, genes with imprinted expression only in the early proliferating endosperm would not appear in this list. Additionally, we would not identify MEGs/PEGs that do not contain SNPs in the accessions used in these studies (4134 genes or 11.2% of all Araport11 genes), which included the MEG MEDEA and the PEG PHERES1 in crosses performed between Col-0 and Ler-0 (Hsieh et al., 2011). While we expect a relatively low number of false negative MEGs, false positives appear to comprise a larger source of error in calling MEGs. For instance, 22 genes were detected as maternally biased in all 12 experiments, 13 of which were defined in this study as enriched in the seed coat, including well-known seed coat markers BANYULS and TRANSPARENT TESTA10 (Devic et al., 1999; Pourcel, 2005). Many other genes encoding seed coat-enriched transcripts were robustly detected as maternally biased including PER36, ELA1, and SEEDSTICK (Kunieda et al., 2013; Creff et al., 2015; Mizzotti et al., 2014). In total, 79% (234/295) of all torpedo stage general seed coat-enriched transcripts were maternally biased in at least one endosperm cross.
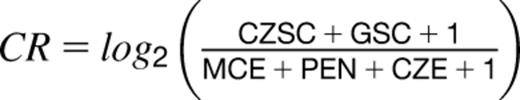
We then tested the possibility of distinguishing true MEGs from false positives due to maternal seed coat RNA contaminants. Contamination ratios (CRs), which quantify the relative abundance of seed coat RNA to endosperm RNA, were calculated for all 45 samples containing seed coat and/or endosperm RNA at the torpedo stage (Supplemental Figure 2A; see Methods). We then tested whether the transcript levels of each putative MEG increased as a function of CR. Seed coat-enriched transcripts tended to have strong positive correlations with CR, whereas endosperm-enriched transcripts generally had a strong negative correlation (Supplemental Figure 2). In fact, we found that 99.7% (294/295) of all seed coat-enriched transcripts had a positive correlation with seed coat contamination with 88.8% (262/295) of these being significant at P < 0.05 (Spearman correlation test). Moreover, 86.5% (518/599) of transcripts enriched in an endosperm subregion have a contamination correlation equal to or less than zero. Including transcripts whose CR correlation is positive but not significant captures 99.5% of endosperm-enriched transcripts but fails to exclude over 10% of general seed coat enriched transcripts and over 50% of chalazal seed coat enriched transcripts. These results show that a stringent CR correlation filter can separate true positive MEGs expressed in the endosperm from false-positive MEGs expressed in the seed coat. We therefore required maternally enriched transcripts to have a CR correlation ≤0 in order for the corresponding genes to be considered high-confidence MEGs. If a maternally biased gene had a positive, nonsignificant CR correlation, it was considered a low-confidence MEG. Of 777 maternally biased transcripts detected in two or more crosses, 57 passed the stringent criteria, with another 91 meeting the relaxed criteria (Figure 4A; Supplemental Data Set 5). These 57 high-confidence MEGs include well-characterized imprinted genes such as FIS2, FWA, HDG9, MPC, MRU1, SDC, and JLO (Hsieh et al., 2009, 2011; Kinoshita, 2004; Jullien, 2006; Tiwari et al., 2008; Gehring et al., 2009). Applying the same criteria to PEGs, we found 67 high-confidence PEGs (Figure 4B). Because PEGs cannot be false positives in this test due to seed coat contamination, we can estimate a false-negative rate based on how many detected PEGs are discarded using our CR correlation filter. We see that the stringent filter retains 80% of PEGs detected in at least two samples (67/84). Fifteen of the remaining seventeen PEGs are captured by the relaxed filter. Assuming the same false-negative rate for MEGs, we can expect ∼15 of 91 putative MEGs that pass the relaxed CR filter are true MEGs. Given that 16 strongly seed coat-enriched transcripts are present in the list of low-confidence MEGs (Supplemental Data Set 5), it is probable that many low-confidence events do not reflect true MEGs.
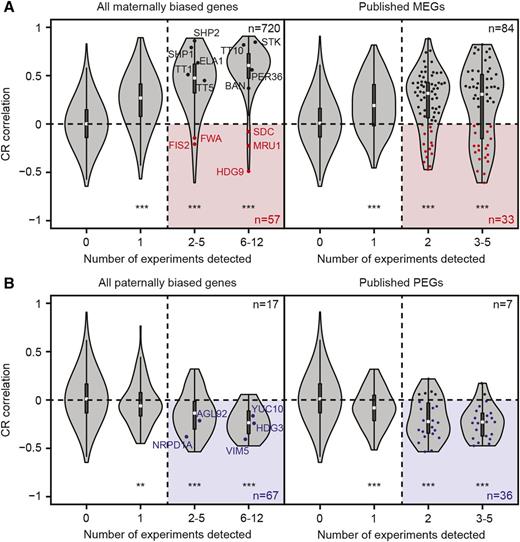
Effect of Seed Coat Contamination on Imprinting Studies in Endosperm.
(A) Violin plots showing the CR correlation of all transcripts with a detectable maternal bias in endosperm data sets (left panel) or those reported to be maternally expressed (right panel). White squares, black lines, and polygons in the violin plots represent the medians, interquartile ranges, and kernel densities of the distributions, respectively. Red circles indicate transcripts from maternally expressed imprinted genes (MEGs) in the endosperm, and black circles denote selected seed coat-enriched transcripts. Only characterized MEGs are labeled in the left panel, whereas red circles in the right panel depict all high-confidence MEGs. The numbers of MEGs are indicated by n. Asterisks indicate P values: P < 0.05 (*), P < 0.01 (**), and P < 0.001 (***) based on two-sided Kolmogorov-Smirnov tests. The highlighted region demarcates high-confidence transcripts.
(B) Violin plots as described in (A) for genes with paternally biased expression. Dark blue indicates transcripts from paternally expressed imprinted genes (PEGs). Only characterized PEGs are labeled in the left panel, whereas blue circles in the right panel depict all high-confidence PEGs. The numbers of PEGs are indicated by n.
Aware of potential false positives from seed coat contamination, the authors of each imprinting study performed their own in silico filter against genes that were highly expressed in the seed coat. After filtering, each study still reports twofold to 12-fold more MEGs than PEGs in the endosperm (Supplemental Data Set 6). We found that previously published filtering methods were insufficient to remove false positives due to seed coat RNA contamination. Of 117 filtered MEGs reported in more than one experiment, only 33 (28%) could be considered high-confidence MEGs, whereas 36 PEGs (84%) pass the same filter (Figure 4B; Supplemental Data Set 6). This indicates an up to 4-fold overestimation of MEGs in published filtered data sets due to false positives from seed coat RNA contamination. Indeed, a recent study of imprinting in Arabidopsis lyrata performed mRNA sequencing on the seed coats in each experiment to control for contamination, and a larger number of PEGs than MEGs could be detected after filtering (Klosinska et al., 2016). In contrast to prevailing models, our findings together with the results of Klosinska et al. (2016) suggest that maternal and paternal genomic imprinting in the endosperm are equally rare events in Arabidopsis.
In conclusion, RNA contamination is a frequent and serious problem in the generation of tissue-specific transcriptomes. It can lead to substantial misinterpretations of the data and thus have major repercussions on several fields of research including developmental biology and epigenetics. Avoiding RNA contamination is particularly crucial for parent-of-origin studies, where the seed coat contains abundant and exclusively maternal transcripts. From the data available, the tissue enrichment test makes it clear that high-precision, low-throughput methods like laser capture microdissection or hand dissection with extensive washing offer the highest degree of sample purity for transcriptomics. Knowing the expression profiles of surrounding tissues is necessary to make a confident statement on the purity of a transcriptome data set. For future embryo and endosperm transcriptomes in Arabidopsis, we recommend that the tissue enrichment test be used as a quality control method to ensure that any caveats regarding sample purity can be appropriately addressed. While our test currently enables the detection of RNA contaminants in transcriptome data from subcompartments of Arabidopsis seeds, it could be extended to other species with appropriate seed subcompartment reference data sets. With the advent of RNA sequencing methods for low input RNA and high spatial resolution, we encourage researchers to build comprehensive spatial maps of gene expression in their own species or tissues of interest. Given the prevalence of RNA contamination in Arabidopsis seed transcriptome data sets, we suspect that it could also be a frequent problem in other cell- and tissue-specific transcriptomes. Therefore, we recommend rigorous testing for RNA contamination in order to generate accurate data sets and reach robust conclusions.
METHODS
Identifying Tissue-Enriched Transcripts
Globally mean-normalized expression data for seed subregions were downloaded from the Gene Expression Omnibus (GSE12404) and used as a reference atlas. All genes with unique, unambiguous probes on the ATH1 array were considered for analysis. Tissue-enriched transcript sets were defined as follows: For a spatiotemporal reference set, let spatial subregions be defined as {S1,S2,…,Sn} for n in the number of subregions, and let time points be defined as {T1,T2,…,Tm} for m in the number of time points. Any particular sample in the reference set will be located in the series at some SiTj for i in {1…n} and j in {1…m}.
For every possible SiTj, a set of tissue-enriched transcripts, E(SiTj), is defined by applying ANOVA to the expression values of each gene in two groups of reference transcriptomes: an in-group and an outgroup. The in-group includes all samples SiTj- 1… j +1, and the outgroup includes all samples S! iTj -1… j +1, where !i = {1…n ≠ i}. A transcript is in E(SiTj) if mean(in-group) ≥ 8 × mean(outgroup) and ANOVA P value < 0.001 (Benjamini-Hochberg multiple testing correction) and the transcript is not in any E(S! iTj); i.e., all sets E(S1… nTj) are disjoint.
ANOVA was performed with function aov() in R (R Core Team, 2016), and Benjamini-Hochberg multiple testing correction was performed with p.adjust(). In-group sample sizes ranged from n = 2 to n = 8, and outgroup sample size ranged from n = 18 to n = 39.
The parameters for defining tissue-enriched transcripts were optimized by testing the performance of the tissue enrichment test on the reference atlas (see below). Defining sensitivity as the percentage of samples in the reference atlas where the tissue of interest was called “significantly enriched” by the test, and specificity as the percentage of tests called “significantly enriched” for tissues other than the tissue of interest, a range of minimum fold changes and maximum P values was tested empirically (Supplemental Figure 1A). A fold change of 8 and P value of 0.001 showed the optimal specificity (95.6%) and sensitivity (94.7%). These parameters yielded from 9 to 533 tissue-enriched transcripts for each tissue at every stage of development, with the sole exception of the suspensor, which could be evaluated up to the heart stage (Supplemental Data Set 1).
Tissue Enrichment Test
To quantify enrichment of a tissue i in a sample X isolated at time point j, we compared the expression values of tissue-enriched transcript set E(SiTj) to the global population of transcripts not in E(SiTj), or !E(SiTj), in sample X. All expression values are converted to percentile rank to minimize the effect of outliers. If mean(E(SiTj)) > mean(!E(SiTj)), the null hypothesis that tissue i is not enriched in sample X is tested with a Wilcoxon rank-sum test of E(SiTj) against !E(SiTj) using wilcox.test() in R. Input data for all mRNA-seq data sets were formatted as TPM, SNP-specific sequencing data as reads per SNP per million (see “Counting SNPs” below), and microarray data as mean-normalized probe intensity. The tissue enrichment score is –log10 of the P value resulting from the tissue enrichment test, with a maximum possible enrichment score set to 50.
Quantification of mRNA Sequencing Data
A reference genome was built from the Arabidopsis thaliana Col-0 TAIR10 genome and Araport11 annotations (Cheng et al., 2017) using the STAR aligner and rsem-prepare-reference from the RSEM package (Dobin et al., 2013; Li and Dewey, 2011). Gene expression was quantified using rsem-calculate-expression with the options –star,–seed 12345,–estimate-rspd,–calc-ci. TPM values for all genes in Araport11 were used for downstream analysis (Supplemental Data Set 7).
Counting SNPs
For each interaccession cross, an in-house script (https://github.com/Gregor-Mendel-Institute/tissue-enrichment-test/blob/master/figure_and_table_scripts/pseudogenome_assembler.py) was used to build a hybrid pseudogenome that contains two copies of the TAIR10 genome, identical at all regions except for SNPs identified in the two parental accessions by the 1001 Genomes Consortium (2016). All reads were aligned to the hybrid pseudogenome using STAR with the options –runMode alignReads,–runRNGseed 12345,–clip3pNbases 2,–clip5pNbases 2,–outFilterMultimapNmax 1,–outFilterMismatchNmax 0,–outFilterIntronMotifs RemoveNoncanonicalUnannotated,–quantMode GeneCounts. These settings discard all reads that do not map perfectly and uniquely to one parental genome. The gene counts were then split into maternal and paternal (Supplemental Data Set 8). This assumes that both parents are isogenic for their accessions, which did not hold true for two two-cell/four-cell embryonic samples derived from a Ler-0/kyp-2 × Col-0 cross (Supplemental Figure 3). For parent-specific tissue enrichment tests, gene count values were converted to reads per SNP per million by dividing the number of reads mapping to a gene by the number of SNPs present in the exonic regions of that gene, and these values were subsequently divided by the number of million SNP-normalized gene mapping reads for that sample. For identifying parentally biased gene expression, only unique reads were considered in order to mitigate false positives due to PCR artifacts, and unique reads were counted in the same manner as above (Supplemental Data Set 9).
Identifying Parentally Biased Gene Expression
For a reciprocal cross between two accessions, the unique reads for each gene were tested for a parent-of-origin effect with Fisher's exact test. A gene with at least five nonidentical uniquely mapping reads, a >2-fold parent-of-origin effect and a Benjamini-Hochberg adjusted P value < 0.01 were considered to have parentally biased expression in that cross.
Contamination Correlation of Endosperm Gene Expression
Accession Numbers, Data Acquisition, and Code Availability
All high-throughput sequencing data sets were downloaded from the Sequence Read Archive (NCBI). All Sequence Read Archive accessions used in this study can be found in Supplemental Data Set 2. Biological replicates were defined as independently acquired pooled collections of tissues in the publicly available data sets used in this study. Scripts for performing the tissue enrichment test, as well as a tutorial, example data sets, and all scripts used to generate data and figures for this work, are publicly available on GitHub in the project “tissue-enrichment-test” (https://github.com/Gregor-Mendel-Institute/tissue-enrichment-test).
Supplemental Data
Supplemental Figure 1. Tissue enrichment in the seed laser capture microdissection atlas.
Supplemental Figure 2. Correlation of seed coat RNA contamination and endosperm-enriched transcript levels.
Supplemental Figure 3. Mixed genomic background of the kyp-2/gl1-1 mutant line.
Supplemental Table 1. Maternal enrichment in embryo transcriptome data sets does not persist in transcripts absent from the seed coat.
Supplemental Data Set 1. Tissue-enriched transcripts at six stages of Arabidopsis thaliana seed development.
Supplemental Data Set 2. All samples used in this study and interaccession crosses.
Supplemental Data Set 3. Read mapping statistics.
Supplemental Data Set 4. Imprinting reanalysis.
Supplemental Data Set 5. Contamination ratio correlation filtered MEGs and PEGs.
Supplemental Data Set 6. Reported MEGs and PEGs.
Supplemental Data Set 7. Gene expression data for all 61 RNA-seq libraries used in this study.
Supplemental Data Set 8. SNP-mapping reads for 52 RNA-seq libraries generated from interaccession crosses.
Supplemental Data Set 9. Nonduplicate SNP-mapping reads.
Acknowledgments
We thank F. Hofmann for building an RNA-seq data analysis pipeline and M. Kellner for useful comments on the manuscript. We also thank M. Gehring, G. Jürgens, and O. Mittelsten Scheid for encouraging discussions and helpful suggestions regarding the manuscript. This work was supported by funding from the European Research Council under the European Union's Horizon 2020 research and innovation program (Grant 637888 to M.D.N.).
AUTHOR CONTRIBUTIONS
M.A.S. and M.D.N. conceived the idea and designed the analyses. M.A.S. performed the analyses. M.A.S. and M.D.N. interpreted the results and wrote the manuscript.
References
Author notes
Address correspondence to michael.nodine@gmi.oeaw.ac.at.

Articles can be viewed without a subscription.
