Edit chart
Loading graph
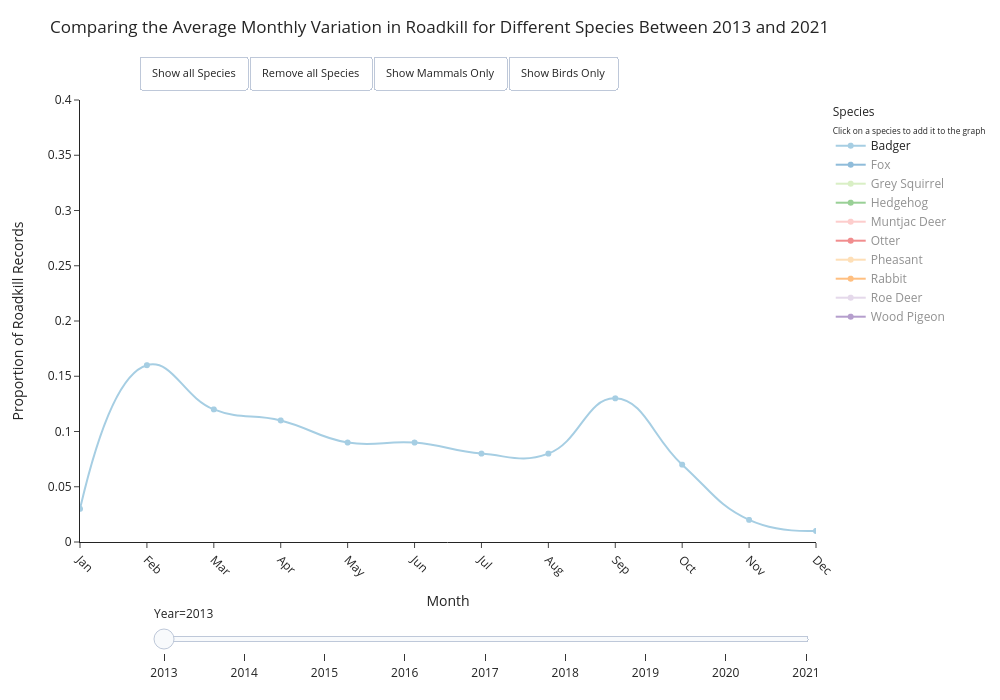
Jpryke's interactive graph and data of "Comparing the Average Monthly Variation in Roadkill for Different Species Between 2013 and 2021" is a , showing Badger, Fox, Grey Squirrel, Hedgehog, Muntjac Deer, Otter, Pheasant, Rabbit, Roe Deer, Wood Pigeon; with Month in the x-axis and Proportion of Roadkill Records in the y-axis.. The x-axis shows values from 0 to 11. The y-axis shows values from 0 to 0.4.