Since 1964 the coffee market size has increased by 190%, how has this value been transferred accross the coffee value chain?

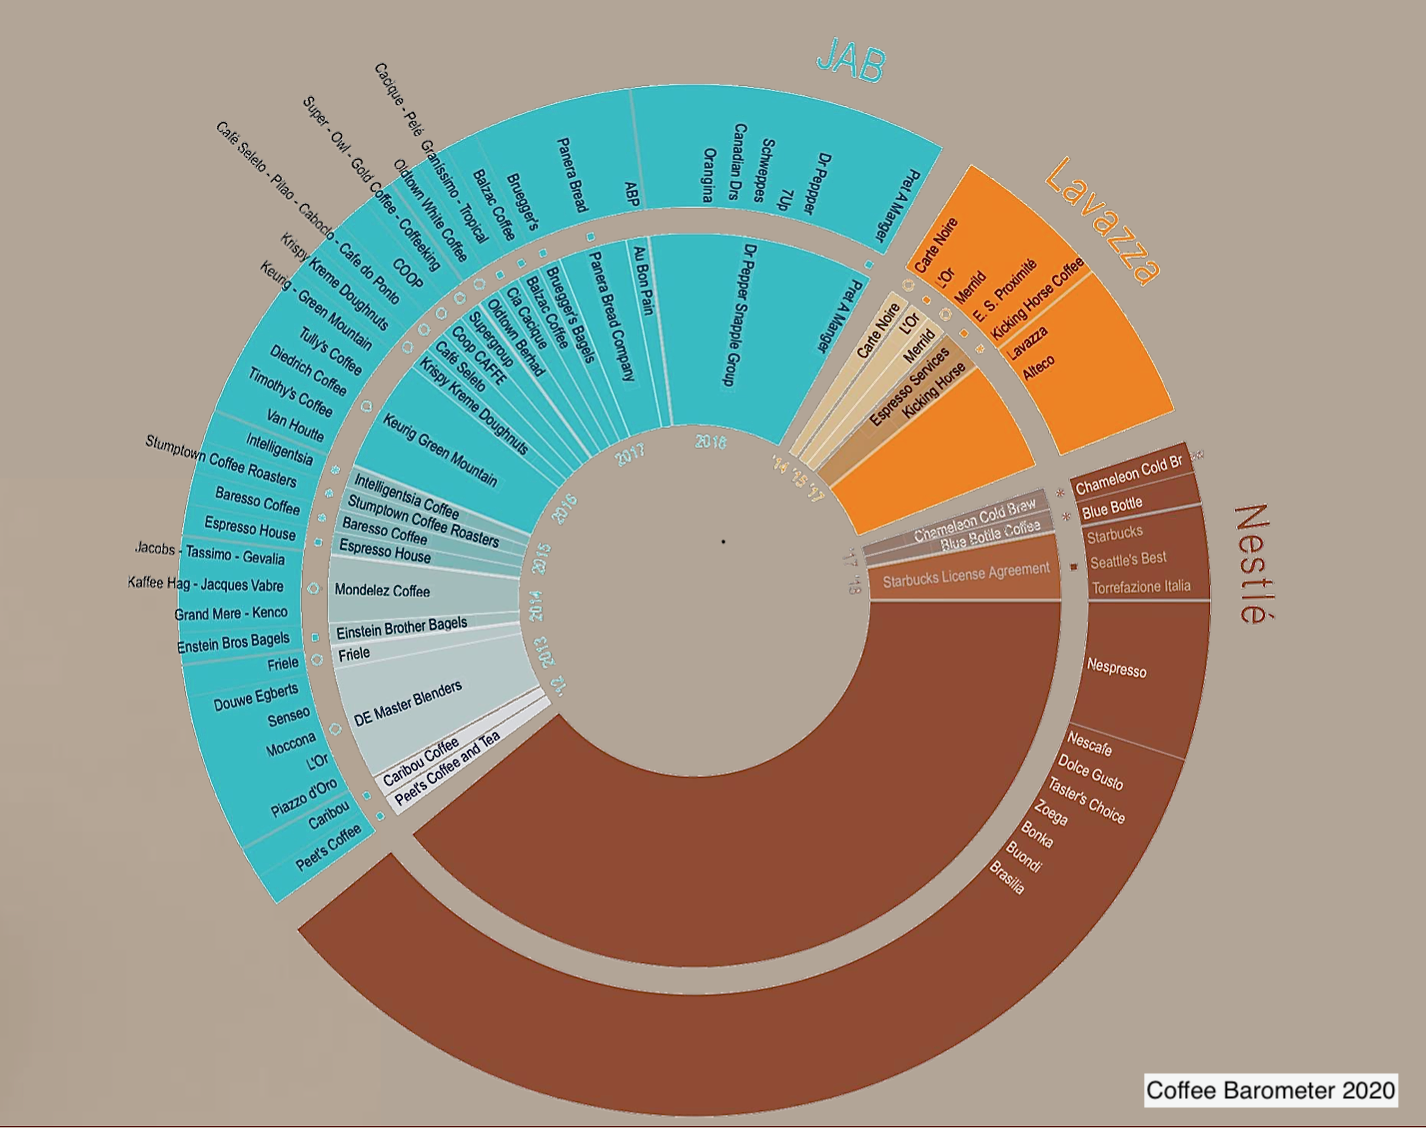
In the last ten years, the coffee industry has been in the middle of a storm of corporate mergers and acquisitions. It is estimated that more than $60 billion USD have been invested in this industry since 2012 when JAB holding started its aggressive approach to purchase some of the leading players in the coffee industry through the acquisition of Peet’s Coffee for USD 974 million (which also involved JDE, Keurig Green Mountain, Dr. Pepper Snapple, Caribou Coffee, Intelligentsia, Stumptown Coffee Roaster, Espresso House, Baresso Coffee, Balzac Coffee, Oldtown, Pret A Manger, Panera Bread, Au Bon Pain, Bruggers’ Bagels, Krispy Kreme Doughnuts, Einstein Noah Bagels, Tatte Bakery, Johan & Nyström….). This kickstarted a new phase of coffee consolidation where all other prominent players such as Nestlé (Blue Bottle and Starbucks’ retail products), Lavazza (Carte Noire, Merrild, Mars Drinks, Kicking Horse Coffee, Blue Pod Coffee), and Coca Cola (Costa Coffee) took part (Figure 1). If such a significant amount of money has been invested in this industry, one would think its future growth potential is high. Is this a fact?
*Figure 1: Main M&A operations in the coffee market *
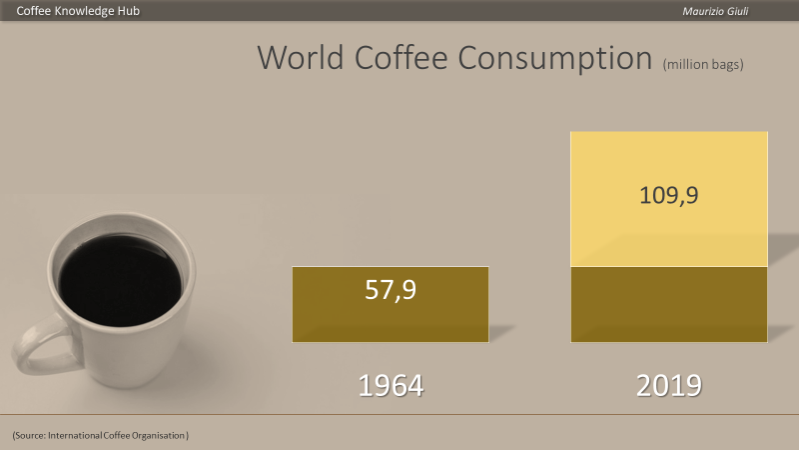
Coffee is one of the most popular beverages in the world today. 3 billion cups of coffee are consumed each day. It generates, in global terms, an annual income of $200 billion USD according to ICOii (2020). The world coffee demand in 2019 was estimated between 164.8 million bags (ICO) and 166.5 million bags (ITC 2021iii). In the last 50 years, the compounded average yearly growth rate was 1.9%, and in the last two decades, it rose to 2.2%. This increment means that since 1964 the market size increased by 190% (from 57.9 to 166.5 million bags).
Since 1990 the most significant part of this growth has been generated by the producing and emerging countries as they have become consumers as well. This aspect can play an essential role in the future evolution of the coffee market, as we’ll discuss later.
*Figure 2: World Coffee Consumption (1964-2019, millions of 60Kg bags) *
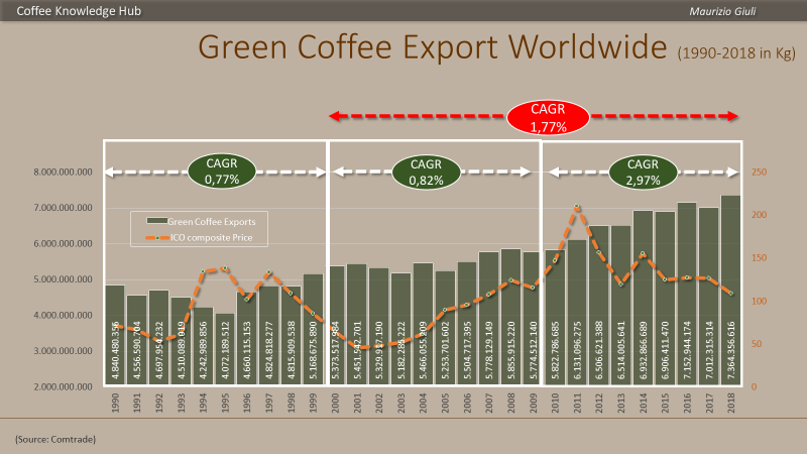
Let's look at the trend for green coffee exports in the last 30 years (Figure 3). There is a generalized constant growth divided into three phases: In the first decade, there has been a sort of U shape with a slowdown in the first third and a recovery in the second. In the last two decades, the annual growth has accelerated. The average growth rate in the last decade was 3,9 times bigger than in the first decade and it was unrelated to the green coffee price (Ico composite index)
Figure 3: Green Coffee Exports worldwide (1990-2018 in Kg)
What pushed up the coffee demand?
We can identify three main drivers for the increase in coffee consumption:
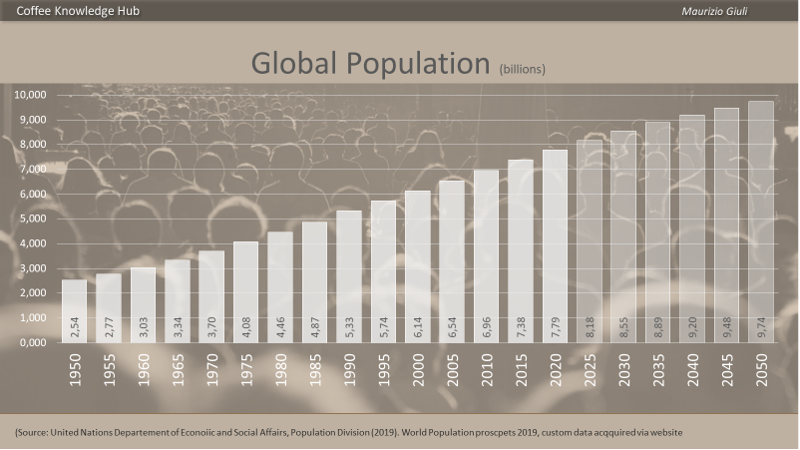
a) Demography: This happens when the population grows- a bigger population tends to consume more coffee. During the period 1995-2020, the world population grew from 5.7 billion up to 7.8 billion people. The United Nations forecasts such growth to reach 9.73 billion in 2050, which means a further increase of 1.94 billion people (Figure 4). But this growth is mostly concentrated in countries with low coffee consumption. In the traditional consuming western developed countries, the increase was just 104 million (+8.9%) in 1995-2020, with the 2050 forecast to rise only by 6.6 million (0.34% total).
Figure 4: Global Population (millions)
So, let’s say that population growth does not seem to be a strong driver of future coffee demand. The variation of the demographic pyramid is probably more relevant from this point of view. We know that coffee is related to people over 14, as children usually don’t drink coffee. Since 1950 the population percentage over 14 years old, increased both in developed and less developed countries, as shown in the figures, and this trend will also continue in the future (figure 4).
Figure 5: Demographic Pyramid in Developed countries and in Developing Regions (1959, 2020, 2050)
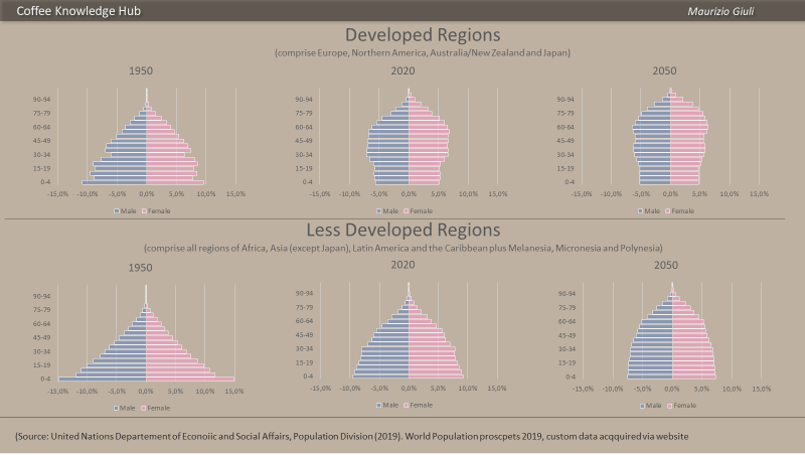
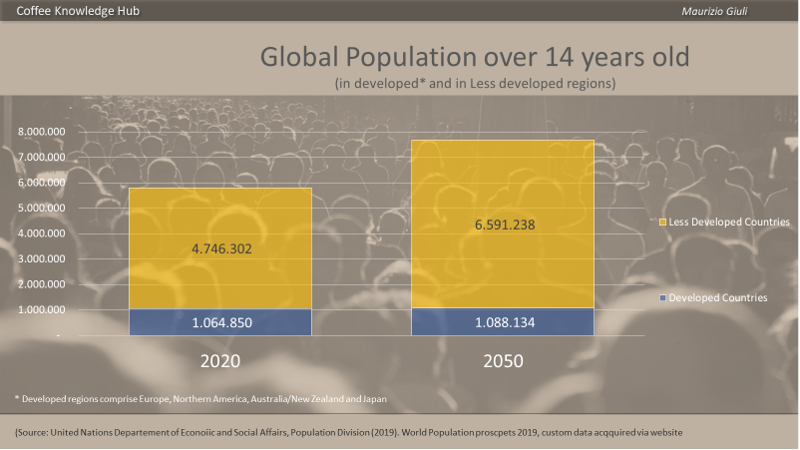
According to the United Nations, the population will is forecast to increase by 1.94 billion by 2050, 1.87 of these will be over 14. Of these 1.87 billion, 23 million will come from developed regions, while 1.85 billion from less developed countries (Figure 6). These dynamics will shape the future of coffee demand.
Figure 6: Population over 14 years old (2020-2050)
As confirmed by ITC, in the last 20 years, the world’s population expanded by 1.2% a year, and global coffee consumption has grown almost 2.2% a year. This means that demography can only partly explain the growth of coffee demand, so other factors play a role in this dynamic.
b) The second is income.
The economic development, particularly the rise of the per-capita income, means growth of disposable income, which generates more liquidity to buy goods, including coffee. In the emerging economies, it also means the development of a middle class that can purchase a better quality coffee.
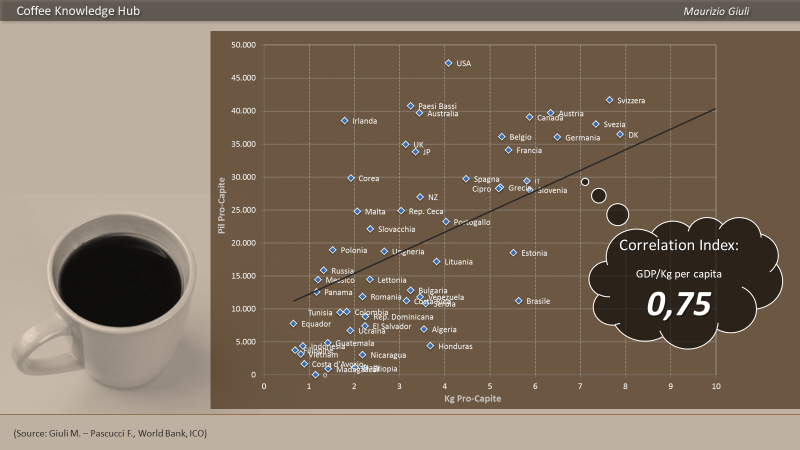
In earlier research from Giuli, M and Pascucci F. , it has been shown that with an index of 0.75, there is a strong positive correlation between coffee consumption and the GDP per capita (Figure 7).
Figure 7: Income-coffee consumption distribution (GDP per capita Vs Kg per capita)
A study referring to the period 1830-1900 about Western economies showed that the demand to income elasticity was 1.3, meaning that coffee consumption grew faster than the GDP. China is an example of this dynamic since, in the last 20 years, it registered an average yearly growth rate of 15% for coffee consumption, which is far higher than the recorded GDP growth during the same period. However, the elasticity of coffee demand to the per-capita income is not stable because it also reflects the diffusion level of the coffee consumption in the population. When it reaches high levels, the further increase in the GDP produces a minor effect on coffee demand. A study performed by the US Federal Trade Commission indicated that the elasticity of coffee demand to income in 1954 decreased to 0.2%. This means that income still plays a role, but with a much weaker impact. This marginal effect is related to two main factors: one is associated with the human tolerance of caffeine, limiting the quantity of daily coffee consumption to certain levels. The European Food Safety Authority suggests no more than 400mg caffeine a day, the equivalent of up to five cups of coffee (in the case of pregnant and breastfeeding women, the limit is 200mg). And the second is related to the so-called "Engel's law," meaning that as a family's income grows, the proportion spent on food decreases.
According to Luciana Florencio , between 1990 – 2017, the global nominal GDP per capita increased from USD 4.738 to USD 10.751 (a 126,9% rise), and the per capita coffee consumption passed from 0.897kg per year from 1990 to 1.069Kg per year by 2016 (+19.2%).
The biggest per capita growth in coffee consumption took place after 2000, which goes beyond the demographic and income effects.
c) The third growth driver is Cultural transformation.
In some cases, the demographic growth and the increase in disposable income did not increase coffee demand. This is partly explained by political issues; in the East European countries for example, coffee was not so popular until 1989 because of the political restrictions and some commercial barriers. Beside these cases, the main cause of lower demand relates to cultural barriers. In the so-called “tea-drinking” countries, such as Turkey, the Russian Federation, the United Kingdom, Ireland, the Middle East, Far East Asia, etc., coffee was not part of their heritage, resulting in a meagre impact on coffee consumption.
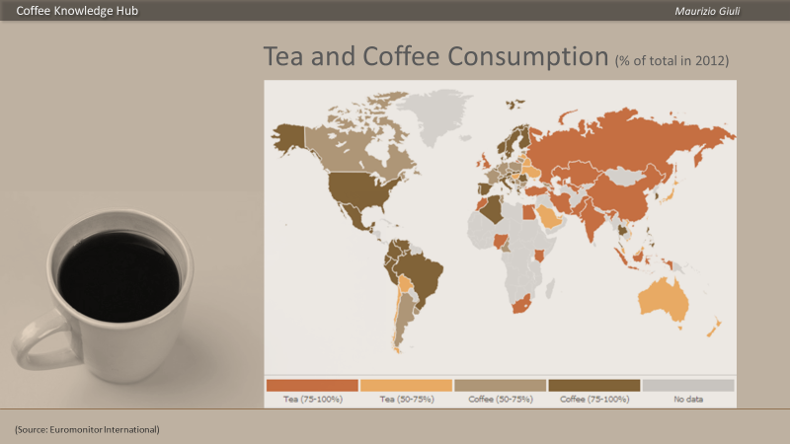
We are talking about a significant share of the world population: in a study published by FAO (2001), it is evident that in 1996 tea-drinking nations were by far more prevalent, where the coffee drinking areas were limited to the North, Central, and part of South America, Europe, except Ireland and UK, Australia, South Korea, Ethiopia, and Algeria. Since then, a big part of the growth in coffee consumption came from these tea-drinking nations, even if, as evident in the map below, coffee consumption is still low in most of them (Figure 8).
Figure 8: Tea and Coffee Consumption (% of total, 2012)
Japan for instance consumed almost no coffee 70 years ago, but starting in 1950, a growing number of Japanese people began to drink coffee, and now the country is one of the largest coffee-consuming markets which imports more than 8 million bags of green coffee yearly.
Two factors seem to underpin the cultural shift of coffee consumption in the last three decades: Firstly, the spread of espresso-based beverages, such as cappuccino, flat white, latte, americano etc. Their versatility of preparation and ingredients give them a broader appeal to different cultures and demographics within those cultures. The second factor is related to where these beverages are served: the modern coffee shops, introduced by Starbucks, represent a new space to spend social time that bridges the gap between the office and home.
The United Kingdom is an excellent example of this cultural revolution. From a tea-drinking tradition, they became a “nation of coffee lovers” which drinks 95 million cups of coffee a day according to BCA (British Coffee Association), with an annual revenue of £17.7 billion. A very recent survey published for the UK Coffee Week 2021 [2] revealed that 70% of Britains drink at least two cups of coffee per day. Among these coffee drinkers, 23% drink three cups regularly and a further 21% at least four cups of coffee a day.
The lifestyle associated with the coffee shops, the atmosphere, the espresso-based beverages, and the country’s customs removed the cultural barrier that limited its consumption for centuries. Thanks to these two factors, coffee also started to become popular in some countries with low per-capita income, such as China, Vietnam, Indonesia, Malaysia, Thailand, and Russia (see figure below). In these countries, a new population segment, “the new rich” (composed of those who have quickly achieved material wealth), show off their status through conspicuous consumption (Veblen’s goods ). This term indicates that sitting in a modern coffee shop drinking a coffee is a sign of distinction and social prestige.
Espresso-based beverages, together with the atmosphere of the coffee shops, played a disruptive role in the evolution of the coffee industry, which broadened coffee consumption in new countries. In contrast, it attracted a new segment of consumers (young and women) in the traditional consuming countries. Furthermore, the popularity of espresso coffee was a foundation for the success of Nespresso and the single-serve system; once people started to drink espresso coffee in coffee shops, they tried to bring it into their home and office. Nespresso was launched in 1986 (based on the first capsule system patented by Nestlé in 1976), but was not commercially successful until just after 2000, after the “second” and the “third” waves. Before that moment, most of the markets were not ready to accept its product.
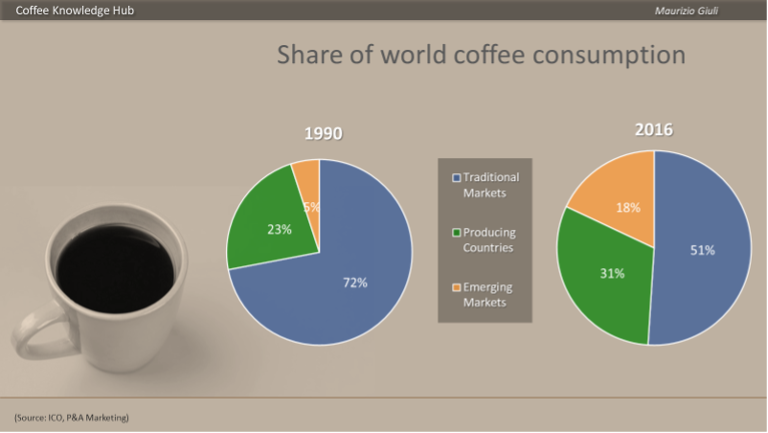
These shifting dynamics in the coffee industry have provided new opportunities for the coffee market. In 1990-2016, coffee consumption by traditional countries decreased from 72% to 51% (Figure 9). These groups of countries were limited to the United States, Canada, Western Europe, and Japan until recently. But other countries such as Brazil, Australia, New Zealand, the Republic of Korea, and Singapore have joined this group since then, where the average per capita coffee consumption is above 4 Kg. The total population of this group of countries accounts for 1.57 billion, and their average consumption growth in 2000-2019 was at 1.8% per annum. These countries reached maturity, and their potential for further growth is not much higher than 1% a year.
*Figure 9: World Coffee Consumption in traditional, producing and emerging markets (1990-2016) *
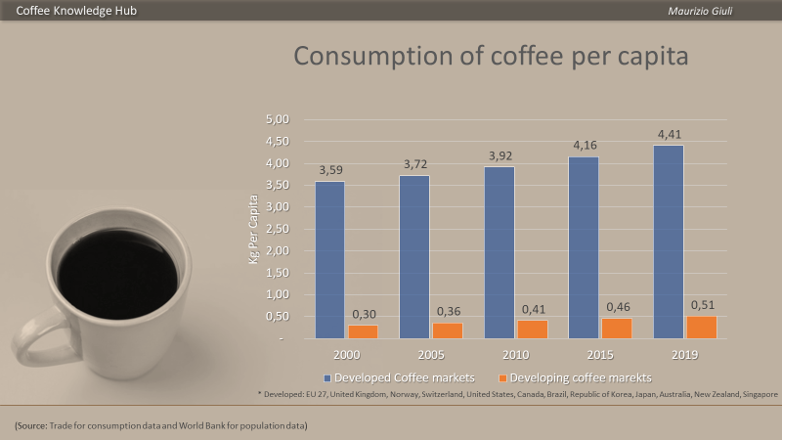
On the other side, developing countries have a population of more than 6.1 billion, and their per capita coffee consumption is still relatively low at 0.51 Kg (Figure 10). Their compound annual growth rate in 2000-2019 was 3.7%, highlighting their high potential to influence global coffee market dynamics in the year to come.
Figure 10: Consumption of coffee per capita in developed and developing markets
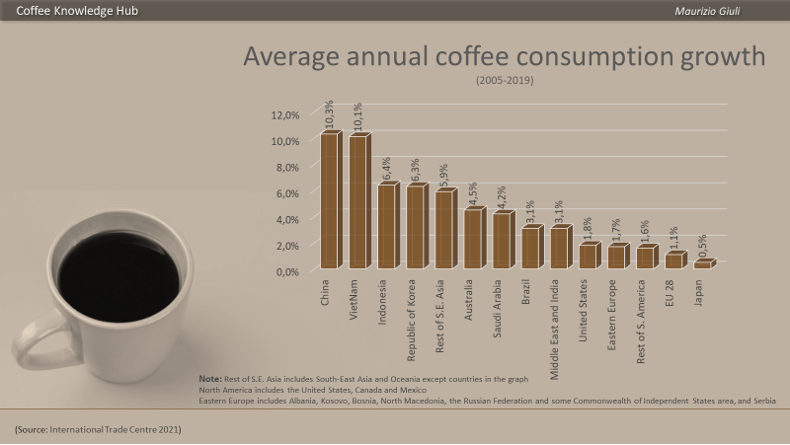
In South-East Asia, the recent rise of coffee consumption has grown in 1992/93 and 2016/17 at an average annual rate of 6% more than three times the global average (ICO 2018) . In the last 15 years (2005-2019), the highest total increase (Figure 11) has been recorded in China, Vietnam, Indonesia, and Republic of Korea (where the explosion of coffee consumption started a few years before).
Coffee consumption is also skyrocketing in the Middle East, where according to ICO, Saudi Arabian coffee imports rose by 42.8% in 2008-2019. Imports jumped almost 193% in Turkey, while we can see an incredible 249% increase in the United Arab Emirates. High spending power combined with low alcohol consumption, create the perfect combination for the successful and rapid development of the coffee market.
Figure 11: Average annual coffee consumption growth (2005-2019)
Based on this evidence, it is possible to conclude that the demographic income and cultural aspects increase coffee demand. But growth opportunities in the coffee market can also come from the value perspective.
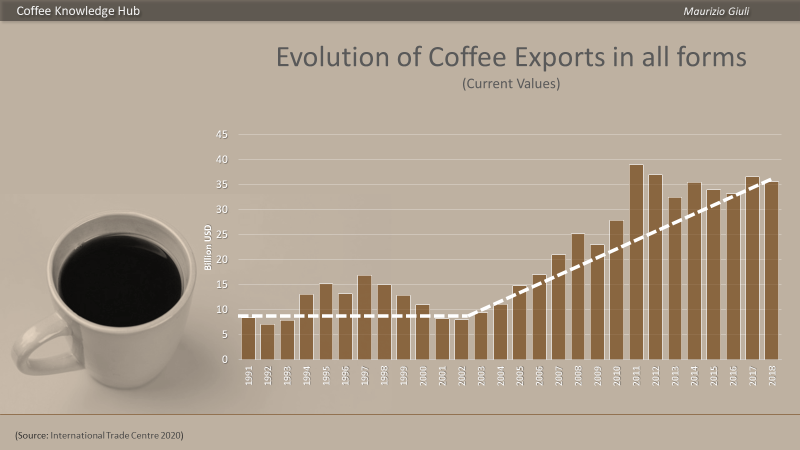
Looking at the dynamics of the cross-border coffee exports in all forms (including green coffee, roasted coffee, and soluble coffee), we see that since 1991 it has quadrupled from 8.4 billion USD in 1991 to 35.6 billion USD in 2018 (Figure 12). Before 2003 the growth in the coffee trade was moderate, and since then, there has been a considerable expansion (white line). This sharp increase was mainly related to the upsurge of the coffee shops phenomenon in most countries and the leap of the capsule market. As we’ve seen, both are associated with the global dispersion of the espresso coffee culture.
Figure 12: Evolution of coffee exports in all forms (current values)
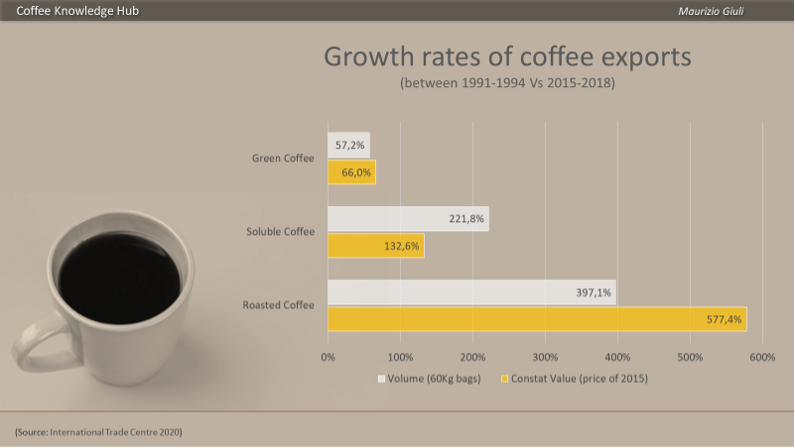
To better understand the dynamics, it is helpful to exploit this data and see how the three different export forms contributed to this growth. As shown in figure 13, in the period which extends from the early 1990s and 2018, the export growth rate of roasted coffee was highest, followed by soluble coffee, while the growth rates of green coffee was the lowest. Even more relevant is the different growth rate between the value (white) and the volume (yellow): except in the case of soluble coffee export where the volume increased more than the value, in the other two forms of exports, the unit values increased over time but at a different pace. Concerning roasted coffee, the unit value grew by 1.45 times, while green coffee increased by 1.15 times, meaning that there are significant growth opportunities to generate value at the roasted level because the consumers are more available to pay higher prices for reasons discussed later.
Figure 13: Growth rate of coffee exports
This evidence is also confirmed by the data regarding the world export of roasted coffee. The chart below (Figure 14) shows the trend in volume (white line) and value (yellow line) compared with the ICO composite (green line), which is an index of the green coffee trade price. In 1994-2017 the volume of roasted coffee traded increased by 6,6 times, while in value, it increased by 13 times, whereas the ICO composite index decreased by 20%.
Figure 14: Trend of World Export Roasted Coffee in Value and in Volume (1994 = 100)
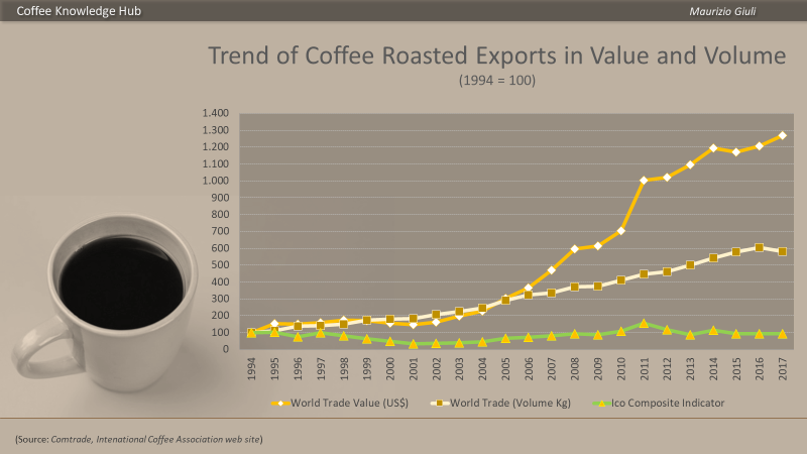
Looking at the value line (yellow), it is evident that up until 2005, its trend was traced the volume line (white). But, since then, the growth rate has dwarfed that of the ICO composite indicator. This means that the consumers are willing to pay a higher price for a greater perceived value, which can come from a better quality of the coffee, a better service (such as in the case of the single-serve system), or an improved experience in coffee shops. What is relevant is the fact that this upward trend toward a value-driven market will continue because of several factors:
- Consumers are becoming more skilled and more demanding in terms of coffee quality.
- The growth of the economic development and disposable income in most countries means an increase in spending opportunities for many low-consumption of coffee-per-capita-countries, soluble coffee is the first step on the journey to increasing consumption. With improved knowledge about coffee and a higher disposable income, the quality of coffee consumed also improves, and the consumption model evolves toward better quality products.
- Some origin countries (such as Colombia, Costa Rica, Mexico, and India) are working to improve their citizen’s economic conditions to push up their internal consumption and reduce their dependence on external buyers. In this way, they try to retain more value in their countries and to support local producers. Most of the efforts done in this direction are to increase in volume. Still, part of the rise of the internal economic conditions is transferred into higher quality products because of the expansion of the local middle-class and increased coffee knowledge.
- The traditional coffee-drinking markets are described as having reached maturity, and overall growth has been limited. The compound annual growth rate in Western Europe, the largest and most mature market globally, was just 1% in 2012-2017, and a similar level of growth is expected in 2017-2022. The trend toward a premiumization of coffee consumption will be stronger. Nearly half of all value growth globally in the following years is expected in the Western countries as consumers trade up to more expensive formats. Euromonitor forecasts that the value of the US Coffee market will increase by 2.9% in 2018-2023 , though volume will decline by 1%.
- Specialty coffee comprises just a tiny percentage of the total market volume that, according to ITC (2020), does not exceed 5%-10% of the global coffee market. In the United States, the need for green coffee has an estimated range of 5%-38%, depending on the definition of 'specialty' . But most of the sources consider that this sector has the most growth potential because of the ever-changing consumer habits. The investment done by some of the significant roasters into the specialty business to acquire knowledge across the sector suggests that the specialty market is likely to continue to expand. Not all sources are aligned with this view. According to ITC, for example, the higher popularity reached by specialty coffee has stimulated the demand for better quality even on the more commercial use. This suggests that the historical quality differentiation between the standard and the specialty market segments will decrease. ITC identifies this trend as "the fourth wave" characterized by the growth of an intermediate premium market segment that combines good quality and the more accessible prices for the average consumer. The trend accelerated during Covid-19, which has transformed part of the out-of-home coffee consumption into household consumption. In this perspective, the specialty market will target a niche market that usually appeals to consumers with disposable incomes. In contrast, the premium market will broaden to a large extent of coffee drinkers.
- The marketing campaigns and consumer education activities pursued by most roasters to push up the demand will create a more willing market to spend more on better products.
To conclude, the global coffee market seems to be launched toward a flourishing future with a demand which can reach 300 million bags by 2050, according to Panhuysen, S. and Pierrot, J. (Coffee Barometer 2018) and with good perspectives in terms of value.
So, can we say that everything is okay?
Not really! Some threats can project a dark shadow to this promising outlook. A combination of challenging environmental, social, and economic factors is putting the coffee sector at risk.
With the rapid advance of climate change, maintaining production to meet growing demand is becoming difficult. Rising temperatures, erratic rainfall, and more frequent and intense extreme weather events are expected to render certain producing areas less suitable or even entirely unsuitable for coffee growing . Some regional studies have found that by 2050, up to 75% of arable land will be lost for Arabica production and more than 60% for Robusta (Sachs et al., 2019 ; Laderach et al., 2017 ). New crop areas will be created to cope with the rising demand for coffee at the expense of forests; 60% of suitable land for coffee production in 2050 is currently forested. It is estimated that the loss of 10-20 million hectares of tropical forest results in approximately 1.65-3.3 gigatons of additional carbon emission (Coffee Barometer 2018). This leads to further environmental concerns.
Almost 80% of coffee is produced by smallholder farmers, the most vulnerable part of the coffee supply chain. They are price-takers and generally unable to face the increasing pressures coming from the market. The consolidation process in the consumption end of the supply chain is not good news for them: according to Coffee Barometer (2018), "as the global coffee industry consolidated, it cuts the cost to optimize profits, which causes additional downward pressure in the value chain which the producers at the farm level increasingly feel."
Low prices, excessive volatility, and low yields resulting from climate change could affect the income of 125 million farmers (ITC 2021). This could place them below the global extreme poverty line (of USD 1.8 a day according to the World Bank) . It also erases the opportunity for farmers to invest in their property and reduces the interest of future generations to engage with coffee farming. Many coffee farmers are aging, and there is little incentive for the younger population to remain on farms resulting in a labour shortage issue.
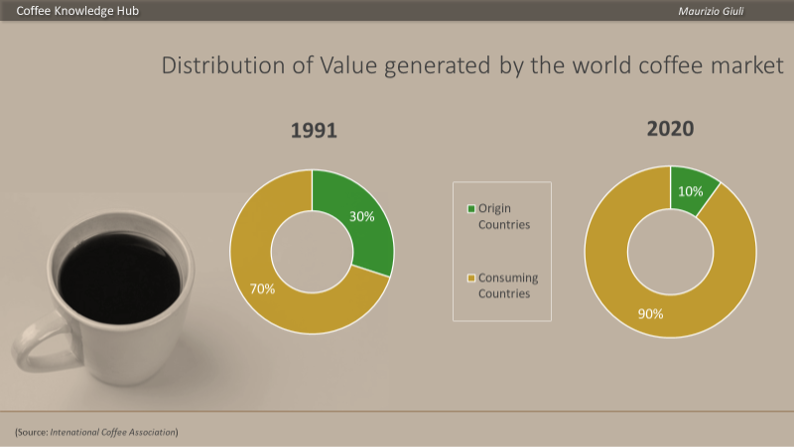
The worsening of the producer's condition is evident also by the share of value retained in the origin countries. In recent years, no more than 10% of the income generated by the global coffee industry remains in the origin countries, while 30 years ago, this share was 30% (see graph).
*Figure 15: Distribution of value generated by the world coffee market (1991-2020) *
Many coffee roasters and retailers have deployed initiatives to support the farmer's conditions, but they risk being a drop in the ocean. As stated by Barometer 2018 , for an industry whose annual value is currently 200 billion USD, the total investment in sustainability efforts has an estimated annual budget of 350 million USD.
The industry must re-examine the distribution of value across the value chain if we are to achieve a sustainable future. Short term thinking will have detrimental medium and long term impacts on social, environmental and economic drivers of prosperity from producers through to consumers.
Bager, S., Lambin, E., 2020, “Sustainability strategies by companies in the global coffee sector”.
Barry, M., 2019 (august 8), “4 types of global coffee markets. Euromonitor. https://blog.euromonitor.com/4-types-of-global-coffee-markets/
British Coffee Association, https://www.britishcoffeeassociation.org/
Coffee Barometer 2020, Panhuysen, S. and Pierrot, J.
Coffee Barometer 2018, Panhuysen, S. and Pierrot, J.
Coffee Barometer 2014, Panhuysen, S. and Pierrot, J.
Comtrade, https://comtrade.un.org/
Euromonitor International (March 2018). Passport Hot Drinks: Coffee in Western Europe
Euromonitor, 2018 (October), “Coffee in 2018: the new age of coffee everywhere”.
Euromonitor, https://www.euromonitor.com/the-consolidating-global-coffee-industry/report
Florencio L. et al, 2020, “Coffee Consumption and Industry Strategies”, Wooodhead Publishing
Giuli M., Pascucci F. 2014 - Il ritorno alla competitività dell’espresso Italiano, Franco Angeli Milano
Global Coffee Magazine, https://www.gcrmag.com/ma-activity-by-coffees-corporate-giants/
Global Coffee Magazine, https://www.gcrmag.com/the-consolidation-of-coffee/
https://www.ukcoffeeweek.com/news/2021/coffeeweeksurvey2021
ICO 2018 “Emerging Markets South and East Asia”
International Coffee Organisation (ICO) 2020 “The value of coffee” Coffee Development Report
International Trade Centre (ITC), “The Coffee Guide” Fourth edition, 2021
Laderach P.et. al. 2017, “Climate Change adaptation of coffee production in space and time”
Morris J., 2018, “Coffee. A Global History”, Rection Books
Nasdaq Kapitall, Jul 14, 2011 https://www.nasdaq.com/articles/coffee-ma-list-possible-takeover-targets-coffee-industry-2011-07-14
Nickilange, https://www.nickilange.com/journal/2019/9/30/manda-is-brewing-in-the-coffee-industry
Pewresearch, https://www.pewresearch.org/fact-tank/2013/12/20/chart-of-the-week-coffee-and-tea-around-the-world/
Sachs, J. Et al. 2019. “Ensuring Economic Viability and Sustainability of Coffee Production. Columbia Center on Sustainable Investment”
Sanger, C. (ICO), 2018, “State of the global coffee market”, United nations Conference on Trade and Development, Geneve
Thorstein Veblen, 1899 “The theory of the Leisure Class”, Macmillan
United Nations https://population.un.org/wpp/
World Bank, https://www.worldbank.org/en/understanding-poverty
World Coffee Research (WCR), 2020, “Annual report 2019, creating the future of coffee”
Well done Maurzio. Very informative and extremely well written
Thank you Damian.
Very nicely summarized!
Become part of a global community of coffee professionals. Access courses and be the first to hear about news, research and events from across the coffee world.
Join now
© 2024 Coffee Knowledge Hub
Simonelli Group SpA
Via Emilio Betti, 1, 62020
Belforte del Chienti MC
P.IVA 01951160439
VAT n. 01951160439
info@coffeeknowledgehub.com
This website utilises cookies to enable necessary site functionality such as logging you in to your account. By remaining on this website you indicate your consent as outlined in our Cookie Policy.
 English
 Italian

