

Abstract
Objective. Microfabricated neuroprosthetic devices have made possible important observations on neuron activity; however, long-term high-fidelity recording performance of these devices has yet to be realized. Tissue-device interactions appear to be a primary source of lost recording performance. The current state of the art for visualizing the tissue response surrounding brain implants in animals is immunohistochemistry + confocal microscopy, which is mainly performed after sacrificing the animal. Monitoring the tissue response as it develops could reveal important features of the response which may inform improvements in electrode design. Approach. Optical coherence tomography (OCT), an imaging technique commonly used in ophthalmology, has already been adapted for imaging of brain tissue. Here, we use OCT to achieve real-time, in vivo monitoring of the tissue response surrounding chronically implanted neural devices. The employed tissue-response-provoking implants are coated with a plasma-deposited nanofilm, which has been demonstrated as a biocompatible and anti-inflammatory interface for indwelling devices. We evaluate the method by comparing the OCT results to traditional histology qualitatively and quantitatively. Main results. The differences in OCT signal across the implantation period between the plasma group and the control reveal that the plasma-type coating of otherwise rigid brain probes (glass) only slightly improve the glial encapsulation in the brain parenchyma indicating that geometrical or mechanical influences are dominating the encapsulation process. Significance. Our approach can long-term monitor and compare the tissue-response to chronically-implanted neural probes with and withour plasma coating in living animal models. Our findings provide valuable insigh to the well acknowledged yet not solved challenge.
Export citation and abstract BibTeX RIS

Original content from this work may be used under the terms of the Creative Commons Attribution 4.0 license. Any further distribution of this work must maintain attribution to the author(s) and the title of the work, journal citation and DOI.
1. Introduction
Implantable neural microelectrodes are developed to deliver therapeutic electrical stimulus for treating neural degenerative diseases, and to collect electrophysiology signals from surrounding neurons (Fanselow et al 2000, Rouse et al 2011, Tooker et al 2014, Pinnell et al 2016, 2018). These neural implants are designed to stay within the nervous system over a long period up to years (Krüger 2010, Prasad et al 2012, Jorfi et al 2015, Nolta et al 2015). However, the performance of the electrode in terms of signal transferring efficacy and measurement signal-to-noise ratio deteriorate over time due to the inevitable foreign body reaction which eventually forms a dense glial sheath to encapsulate the implant, isolating it from the neural environment (Szarowski et al 2003, Kim et al 2004, Polikov et al 2005, Williams et al 2007, Ward et al 2009, Barrese et al 2013).
To realize a long-term reliable neuro-electrode interface, it seems essential to minimize the foreign body response (Winslow and Tresco 2010, Nguyen et al 2014, Potter et al 2014, Sohal et al 2016). To this end, many approaches have been proposed and investigated including innovations on bio-compatible flexible materials (Stieglitz and Meyer 1998, Rousche et al 2001, Takeuchi et al 2004, Rubehn et al 2010, Richter et al 2013, Nguyen et al 2014, Sohal et al 2016, Böhler et al 2017, Luan et al 2017), decreasing implant size (Patel et al 2015, 2016, Khilwani et al 2017, Ferro et al 2018, Yang et al 2019) or surface modifications by coating the device with anti-inflammatory drugs that will actively release (Azemi et al 2011, Kolarcik et al 2012, Potter et al 2014, Boehler et al 2017, Eles et al 2017).
These approaches are often evaluated by analyzing cellular changes corresponding to the progression of the foreign body reaction over time following implantation, mostly based on postmortem immunohistochemistry (IHC) (Turner, 1999, Szarowski et al 2003, Biran et al 2007, Ward et al 2009, Lo et al 2018). The process of the foreign body reaction incorporates a rapid activation of microglial cells immediately following the implantation; and as the response develops up to 3 months, it reaches a chronic phase with compact astrocytic scar tissue generated to sheathe the implant (Leach 2010, Pflüger et al 2019). Normally, a large number of implanted and control animals are sacrificed to obtain sufficient temporal resolution of the progression curve as well as to reach a statistical significance. Furthermore, it is impractical to monitor the complete course of progression of the same object using postmortem histology.
In vivo two-photon microscopy (TPM) has been adopted for continuous monitoring the progression of the biological processes in neural tissue in response to foreign implants (Kozai et al 2016, Eles et al 2017, Wellman and Kozai 2018). It has been demonstrated that TPM is able to obtain spatiotemporal information of the dynamic cellular response to the implanted electrodes up to 12 weeks (Kozai et al 2016). However, the imaging depth of TPM is limited within hundreds of micrometers (e.g. 200 µm), which only allows investigation of immune reactions very close to the brain's surface.
Here we report our approach using fiber-based optical coherence tomography (OCT) to monitor the development of the glial scar in vivo over the course of the implantation. We previously demonstrated the use of fiber-based OCT to gain insight as a minimally-invasive imaging modality during in vivo whole rat brain trajectories (Xie et al 2013) and flexible implants (Xie et al 2014), and elucidated the bases of its contrast's origins (Xie et al 2017). However, we observed OCT signal deterioration over time along the implantation duration presumably due the gliotic encapsulation around the OCT detection probe itself. In this study, we first sought to compare the ability of fiber-based OCT with traditional IHC in observing the glial scar around another rigid implanted device (i.e. a silicon probe). Second, we used fiber-based OCT to investigate the foreign-body response of surface modifications by plasma deposited methane coatings, which have shown promise for affecting protein adsorption, reducing cellular adhesion, and reducing tissue encapsulation intravascularly in pigs (Bergmann et al 2015, Bergmann 2015).
2. Materials and methods
Six female Sprague Dawley rats were each implanted with one inactive silicon probe and one OCT probe at 90° to one another as shown in figure 1. To assess glial scar development over time around silicon probes, OCT monitoring was performed weekly for up to 8 weeks before sacrificing for histological assessment with IHC. To investigate the effect of plasma deposited CH4 coatings on glial scar development around implanted device, the implantable OCT probes were separated into CH4-coated group and uncoated control group. Then, tissue properties were assessed by measuring the tissue attenuation coefficient of the OCT signal (Xie et al 2013, 2014) and finally by IHC. We chose to apply coating on OCT probes rather than silicon probes as it is up till now unclear, which effects the CH4 coating might have on the electrical properties of probe's metal recording sites. We further wanted to investigate (a) if there were detectable changes in the tissue surrounding the OCT probe due to the coatings, (b) whether the coatings would diminish the tissue foreign-body reaction thus rectify OCT performance on monitoring the tissue changes over time around the silicon microelectrode probes. Due to the light attenuation in tissue eventual difference in tissue response due to the coatings would be most detectable closest to the OCT probe.

Figure 1. Surgical setup. (a), (b) To detect the silicon probe with the OCT signal, probes had to be angled as close to 90° from one another as possible, maximizing reflectance back into the OCT probe. (c) Top view of the surgical setup. A burr hole line was drilled to allow implantation of probes into brain tissue. The OCT probe and silicon probe were pre-aligned before advancing into brain tissue. The silicon probe was advanced first, followed by the OCT probe until the silicon probe could be detected in the OCT signal. (d) OCT signal during surgery after both probes are aligned and implanted, showing the reflectance of the implanted silicon probe.
Download figure:
Standard image High-resolution image2.1. Implantable probes: optical coherence tomography fiber probe and silicon microelectrode probe
The customized OCT fiber probe (SM800-CANNULA, Thorlabs) consists of a ceramic fiber connector ferrule (CF126-10, Thorlabs) with 2.5 mm diameter and 10.5 mm length and an 8 mm long single mode fiber (SMF) (ø 125 µm, SM800-5.6-125, Thorlabs) with clean cleaved distal end that is perpendicular to the fiber's longitudinal axis. The single mode fiber is implanted into brain tissue to enable monitoring foreign body reaction in situ, while the ferrule remains exposed and is connected with the SMF cable of the OCT system each time the OCT measurement is conducted. The silicon-based rigid microelectrode probe is chosen in this study as it has a wide range of applications in neuroscience. Thus, a spatiotemporal in situ assessment on the foreign body reaction against the chronically implanted silicon probe would be of great interest to neuroscientists. The silicon probe used here is 50 µm thick, 140 µm wide and 10 mm long. Both OCT fiber probes and silicon microelectrode probes are immersed in 70% ethanol for 20 min for disinfection, and rinsed thoroughly with sterile saline (0.9% Sodium Chloride) before implantation.
2.2. Plasma deposition of CH4 coating on glass OCT probes
Using methane as the starting material, silicon probes were plasma coated as previously described (Ledernez 2011, Bergmann et al 2015). Briefly, a magnetron enhanced plasma polymerization process was conducted in a system from the company Shinko Seiki, with two parallel titanium electrodes separated by 10 cm. Samples were rotated between the electrodes to ensure good homogeneity of the resulting plasma films. The plasma chamber was evacuated down to a pressure of 0.1 Pa to avoid cross-contamination, then coated at a pressure of 5 Pa using a power of 45 W.
2.3. Implant surgery
All experiments in this study were performed with approval from the locally responsible Animal Welfare Committee with the Regierungspräsidium Freiburg in accordance with the guidelines of the European Union Directive 2010/63/UE under permit G13/51. We used eight adult female Sprague Dawley rats (Charles River, Germany) weighing 280–320 g, among which six rats (three rats in each group) underwent successful probe implantation and were used for OCT recording and histology analysis. One silicon probe and one OCT probe were implanted under micromanipulator control to a strict perpendicular implant geometry into each animal. To study the effect of CH4 plasma coating (Bergmann et al 2015, Bergmann 2015) on the foreign body reaction, three of the rats were implanted with CH4 plasma coated OCT probes. The remaining OCT probes and all of the silicon probes were uncoated. G*Power (Faul et al 2007) was used to perform post-hoc power analyses, outlined in table S1.
The surgical procedure was performed as previously described (Richter et al 2013). In brief, rats were anesthetized (induction: 5% isoflurane in 2 l min−1 O2; maintenance: 0.5%–3% isoflurane in 2 l min−1 O2), the surgical area was shaved, and rats were placed on a water-circulating heating pad to maintain a body temperature of 35 °C. The rats were fixed into a stereotactic frame (Kopf Instruments), and eyes were covered with ophthalmic ointment. The surgical area was sterilized using alternating wipes of polyvidone-iodine and alcohol. A midline incision was made along the scalp, and the skin was pulled aside to expose the skull's surface. Bregma was identified and used as a landmark coordinate (0, 0 mm). Bone screws were placed into the skull anterior to bregma, posterior and lateral (left) to bregma, and posterior to lambda, to better secure a headcap with dental acrylic later. A burr hole line 9 mm long and 1 mm wide was drilled from 1 mm posterior and 3 mm lateral (right) to 10 mm posterior and 3 mm lateral (right) of bregma. Then, using two different arms on the stereotactic frame, the implantable OCT imaging probe and the silicon probe were positioned above the burr hole line, each angled 45° up from horizontal, and angled 90° from one another (figure 1). The OCT probe was connected to the OCT imaging system, and the OCT probe and silicon probe were aligned laterally, pointing the OCT probe at the silicon probe ∼1 mm away, until the strongest reflectance signal from the silicon probe was achieved in the OCT signal. This process was essentially a practice run in air, creating the correct alignment and positioning of the probes for best imaging signal when implanted into tissue. Once correctly aligned in the medio-lateral direction, the probes were separated along the antero-posterior direction, and the silicon probe was advanced into brain tissue ∼10 mm, maintaining the same angle and lateral positioning as during the alignment in air. Then, the OCT probe was slowly advanced into brain tissue, until the OCT reflectance signal from the silicon probe was detected ∼1–2 mm away from the OCT probe tip. The OCT probe was advanced until the distance between the OCT probe tip and the silicon probe was 1 mm, as measured by the OCT signal. The entire burr hole line including the entry points of the probes were covered in gelfoam (Pfizer) wetted with sterile saline, then with silicone elastomer (Kwik-Sil, World Precision Instruments), and finally sealed with dental acrylic. Dental acrylic was sequentially applied in several layers, securing the implanted probes in place, and building the dental acrylic headcap to cover the wound of the animal. The ferrule interfacing between the implanted OCT probe and the fiber optic cable leading to the OCT imaging system was left uncovered from dental acrylic, enabling access for connection to the OCT imaging system throughout the study. Carprofen (4 mg kg−1) was administered subcutaneously for 5 days post-surgery to manage pain. The animals were housed separately with enrichment and daily inspection.
2.4. Optical coherence tomography
The OCT imaging system used in this study is identical to that which is previously described (Xie et al 2013, 2014). The fiber-based spectral radar OCT system utilizes a superluminescent diode with center wavelength at 840 nm as light source. The system axial resolution is approximately 14.5 µm measured in air. Briefly, we used OCT (Fercher et al 1993) to monitor the development of foreign body capsule formation around implanted OCT fiber probes and silicon probes in brain tissue. The implanted fiber transmits incident light into brain tissue and collects light that scatters back into the fiber. The intrinsic optical properties of the tissue are encoded by the interference pattern created by the incident and backscattered light, which is detected by a spectrometer to construct A-scan (one-dimensional depth scan) signals that present backscattered light intensity as a function of depth. As our OCT utilizes a low-coherence superluminescent light source in the near infrared portion of the spectrum (840 nm), contrast in the OCT signal predominantly depends on the attenuation (optical density of tissue and cells) and the dichroitic properties (like myelin fibers) of the illuminated tissue (Kut et al 2015). Both sending and receiving optics are defined by a cleaved single mode fiber (0.12 NA, SM800-5.6-125, Thorlabs) achieving extremely high localization of beams and thus making perfect arrangement an important requirement.
The single mode fiber (5.6 µm diameter core, numerical aperture = 0.12) has an acceptance angle of 6.9°. Thus, the back scattered light collected by the OCT probes was within a conical shape starting at the OCT probe tip and diverging at an angle of 6.9°. To successfully image the tissue response around the silicon probe, the light projecting from the OCT probe must shine on the silicon probe penetrating the tissue around it. It was possible to see the silicon probe as a strong reflectance signal in the OCT signal (see figure 1(d) about 0.75 mm deep into the tissue), and this reflectance signal was used to confirm that the OCT probe was pointed correctly at the silicon probe. However, this only worked if the OCT probe was oriented perpendicular to the silicon probe. If oriented other than 90°, the reflectance signal from the silicon probe was diminished (figure 1(a)). Prior to OCT and silicon probe implantation, the two probes were oriented in air above the animal to ensure that the probes were lined up correctly, as confirmed by the strong reflectance signal from the silicon probe in the OCT signal. Once probes were correctly lined up, implantation surgery proceeded. After both OCT and silicon probes had been advanced into tissue, it could be verified that the OCT probe was pointed directly at the silicon probe using the reflectance signal from the silicon probe. An example of this verification is shown in the raw OCT A-scans data in figure 1(d). OCT recording is performed live and new data is streamed into the visualization window continuously. Figure 1(d) shows an approx. 1 s recoding of OCT A-scans of this live streaming (referred as 'snapshot' in this report), where the x-axis is time and the y-axis is distance into tissue with the top of the image is the tip of the OCT imaging probe, and tissue depth increases going down the y-axis. The strength of the OCT signal is represented as brighter points in the image. The reflectance signal from the silicon probe can be seen as the bright line about 0.7 mm deep into tissue in figure 1(d). OCT A-scans data from all animals throughout the implantation period is also represented using these snapshots in figure S1 (available online at stacks.iop.org/JNE/18/045002/mmedia). In order to analyze the effect of coating on OCT probe's characteristics with regard to the output power of light and its numerical aperture, we measured the output beam profile and power of the coated and uncoated OCT probes using a power meter (400–1100 nm, PM160, Thorlabs).
Implanted OCT fibers were either coated with plasma-deposited CH4 or left uncoated. After a CH4-coated or uncoated fiber had been implanted and fixed in place within the dental cement headcap, the fiber optic cable connecting the implanted fiber to the OCT imaging system could be disconnected, allowing the animal to move around freely. After disconnecting the implanted OCT probe, the ferrule was wrapped in parafilm for protection. Before each imaging session, the parafilm was removed and the ferrule was cleaned using Fiber Connector Cleaning Solution (FCS3, Thorlabs). The implanted OCT probe was then connected to the OCT system via the fiber optic cable and in vivo imaging was performed. If a poor signal was observed, the fiber optic cable was removed, the ferrule re-cleaned, and the OCT system re-connected to try again. Rats were not anesthetized during OCT imaging, but only data recorded while the animal was motionless were used for analysis, as movement of the animal can disrupt the OCT signal quality. To create an OCT signal profile, imaging data over an entire second of motionless collection was averaged together and plotted as OCT signal intensity vs distance from the tip of the OCT probe.
2.5. Tissue histology
After 8 weeks, rats were given an intraperitoneal injection of ketamine/xylazine and sacrificed by cardiac perfusion with PBS to clear the blood, and then 4% paraformaldehyde to fix the tissue. Rat heads were removed and post-fixed in 4% paraformaldehyde overnight, then washed in phosphate buffered saline (PBS) and stored in EPES-buffered Hank's Solution (HBHS) with sodium azide prior to brain removal. Because we wanted to compare the OCT signals to tissue histology, we aimed to maintain both the implanted OCT imaging probe and silicon probe in situ within one slice to prevent distortion effect on the surrounding tissue due to probe extraction procedures, as demonstrated previously (Woolley et al 2011, 2013). To do this, headcaps were carefully drilled into using a surgical drill, and implants were cut at the entry point through the skull to maintain implant positioning within brain tissue. Tissue blocks were carefully aligned for sagittal slicing, keeping both probes along the plane of slicing. Using a vibratome, tissue blocks were supported with agar gel and sliced at 300 μm thickness to capture both probes within a single slice. Slices were immunolabeled using primary antibodies GFAP (1:1000 dilution, rat IgG2a, Invitrogen cat# 13-0300) to label astrocytes, Iba1 (1:250 dilution, rabbit IgG, Wako cat# 016-20001) to label microglia, NeuroTrace 640/660 (1:250 dilution, Invitrogen cat# N21483) Nissl stain to label neuronal cell bodies, and Hoechst 33342 (1:1000 dilution, ThermoFisher) to label cell nuclei. Secondary antibodies goat anti-rat AlexaFluor 488 (1:200) and goat anti-rabbit AlexaFluor 594 (1:200) were used to target GFAP and Iba1 primaries, respectively. Slices were mounted in Fluoromount G and cover slips were sealed with nail polish. Slides were imaged at 10× and 30× using an Olympus spinning disc fluorescence microscope, scanning across multiple imaging fields to image the entire area of interest. Optical sections were taken every 0.3 μm throughout the thickness of the slice to gather fluorescence data from the whole tissue slice of 300 µm thick. Background subtraction was performed, and a custom MATLAB script stitched the scanned image stacks together to create a 3D representation of the fluorescence data. Finally, all optical sections were compiled together into one image by taking a maximum projection. All images were captured using the same settings across fluorescence channels.
To assess the effects of CH4 plasma coating on the foreign body reaction, the fluorescence of glial cell markers around implants were examined. Analysis of the glial cell responses surrounding implants was achieved using a custom MATLAB script that measured the average fluorescence intensity of each channel versus distance from the implant in 10× images. Fluorescence profiles from all animals in each group were averaged together, normalized to control fluorescence (no primary antibody) and subjected to statistical analysis (student's t-test). Comparisons between coated and uncoated groups were performed, as well as coated vs control, and uncoated vs control comparisons. Control data was gathered by averaging the fluorescence intensity of a field far (>2 mm) from implants but at the same tissue depth. Statistical comparisons were performed every 5 µms from the implant edge. As an additional assessment of the effect of the CH4 plasma coating, the OCT signal's attenuation factor was calculated for each probe.
To compare the OCT imaging signal to the IHC, 30× image scans of tissue between the OCT probe and the silicon probe were collected. In those images, the shape of the light collected and imaged by the OCT probe was recreated. As aforementioned, the light collected by OCT probe was within a 6.9° conical shape space. The IHC images were analyzed by measuring fluorescence profiles from the tip of the OCT probe outwards in a conical shape, rotating the angle of the profiles to cover the whole area of the cone, and then averaging those profiles together to create one profile. In this way, the OCT imaging signal could be compared to the analogous fluorescence profile from the same tissue that the OCT system imaged (figure 2).

Figure 2. Qualitative comparisons between IHC (a), (b) and OCT signal (c) for one uncoated sample (left) and one CH4 plasma coated sample (right) that showed satisfactory OCT signal until the final day of imaging. (a) 10× scans show wide scans encompassing both OCT and silicon probes or probe tracts which were captured within the tissue slice (scalebar: 500 µm). (b) 30× scans of the tissue between the two probes that had been imaged by OCT (illustrated by white beam) allows comparison between OCT signal and IHC profiles. Implants are outlined by dotted lines (scale bar: 100 µm). (c) OCT signal profile plotted below fluorescence profiles from the same tissue that had been imaged by OCT. The x-axis spans from the OCT imaging probe tip, through the tissue, and ends at the implanted silicon probe. Increases in fluorescence intensity profiles from labeled glial cells (dotted red line) match with the increase in OCT signal at the location of the silicon probe (solid red line). The two red arrows in the right panel indicate the respective Iba1 and GFAP activities expanding to ∼1 mm distance from the OCT probe tip.
Download figure:
Standard image High-resolution image3. Results and discussions
3.1. OCT probe and recording
From the test experiments aligning the OCT probe and the silicon probe mentioned in section 2.4, the OCT signal reached a maximum when its fiber probe was positioned perpendicular to the silicon probe. An OCT signal above 50% of maximum was recorded between 81° and 99° (figure 1(a)). We also found there was no impact on OCT signal in terms of intensity and divergence angle from the plasma coating.
The OCT signal of each individual rat at their respective sampling points (days post implantation surgery) over the entire course of implant duration is shown in figure S1. The implanted silicon probe was visible in the OCT signal for all rats at the day of implantation, and the distance of the silicon probe from the tip of the OCT probe was approximately 1 mm for all rats as shown in the OCT recordings. The implantation procedure was tracked by the OCT. It provided a direct evident of a successful implantation in which the final position of the silicon was confirmed with the depth distance and intensity of the silicon probe in OCT signal. As foreign body reaction developed across the implant period up to 56 days post-surgery, surprisingly there was no marked difference in OCT signal between rats with coated and uncoated OCT probe. The tissue developing around the OCT probe progressed in similar manner as reflected in the attenuation value of the OCT signal (figures S1 and S3). The attenuation factor of OCT signal represents how much light attenuates when propagate within a medium. In biological tissue, the higher attenuation factor often links to tissue with compact structure, which supports the findings here that compact gliotic sheathing was formed around the OCT probe regardless of coating. Moreover, the OCT signal of silicon probes was found to become more prominent post implantation surgery. We speculate that likewise the silicon probe provoked a foreign body reaction and a dense layer of gliotic scar formed during the implant period, thus it presented increasing high reflectance OCT signals. However, this effect demonstrated no marked difference in between the two groups in comparison.
3.2. Comparison of OCT signal to tissue histology by IHC
One goal of this study was to compare OCT signals with traditional IHC. At the beginning of the study, the silicon probe was clearly visible in all OCT imaging signals. However, by the end of the implantation period, some animals did not have silicon probes visible in the OCT anymore. For these animals, the comparison between OCT signal on the final day and IHC was not possible. Two animals for which the silicon probe OCT signal was still present on the final day are shown in figure 2. It is uncertain why signal was lost for the other animals, but it is likely that the sensitive alignment of the two probes shifted, meaning the light from the OCT probe was not reflecting back off the silicon probe by the end of the study. The variability in OCT signal over time can be seen in figures S1 and S2, where the position and reflectance signal from the silicon probe is shown to change over time. This is likely due to slight changes in positioning of one or both of the probes throughout the course of the study.
Because of the contribution from glial cells in typical neural implant encapsulation, we assessed iba1 (microglia), GFAP (astrocyte), and cell nuclei (DAPI) fluorescence along the OCT light path between the two implants using IHC. We hypothesized that we would be able to see similarities in these fluorescence profiles and the OCT imaging profiles. When comparing the OCT signal to the fluorescence profiles from the tissue histology images, qualitative similarities were observed. Both OCT signal and fluorescence of glial cell markers were increased at the location of the implanted silicon probe (figure 2(c), red lines) where the highest degree of glial encapsulation is expected. However, it was difficult to see any other strong quantitative similarities between OCT imaging and the glial cell fluorescent profiles.
The location of the glial scar in fluorescent plots matched the location of the implanted silicon probe in the OCT signal. However, we were unable to find a difference in the extent of glial scarring around the silicon probes over time using the OCT signal. From Xie et al (2017), it was determined that OCT image contrast in brain tissue is more likely from fibrous, well-ordered, myelin-rich structures such as axons, than from other cells such as glia. This helps to explain why we were unable to detect changes in gliosis over time using OCT signal.
Interestingly, we were able to detect changes in the silicon probe's position relative to the OCT probe (visible in all animals in figure S1 and highlighted in one animal in figure S2). This may be an important observation since electrode position relative to nearby neurons greatly affects the signals recorded by that electrode.
3.3. Effect of CH4 plasma coating on foreign body reaction
A qualitative comparison between representative coated and uncoated samples can be seen in figure 2. These samples were chosen because OCT imaging maintained good quality until the final day in both of these animals, and the probes or probe tracts were well preserved within the tissue slice for IHC in these animals. Figure 2(c) shows the fluorescent profiles of glial cells along the imaging path, with the OCT probe at the left end of the x-axis. For this sample, microglia (iba1) encapsulation was tight around the uncoated OCT probe (figure 2(c)-left) as shown by the peak at the far left of the plot, whereas astrocyte (GFAP) encapsulation was seemingly minimal. For this coated OCT probe (figure 2(c)-right), encapsulation of both microglia (iba1) and astrocytes (GFAP) seemed to extend farther out into tissue as shown by the hump centered around 0.10 mm along the x-axis (marked with red arrows).
To quantitatively assess the effect of CH4 plasma coating on glial encapsulation of the implanted OCT probes, multiple comparisons were performed: one comparing uncoated vs coated OCT probes using the attenuation signal from the OCT imaging (figure S3), and the rest using IHC fluorescence for glial cells surrounding the OCT probes (figure 3).
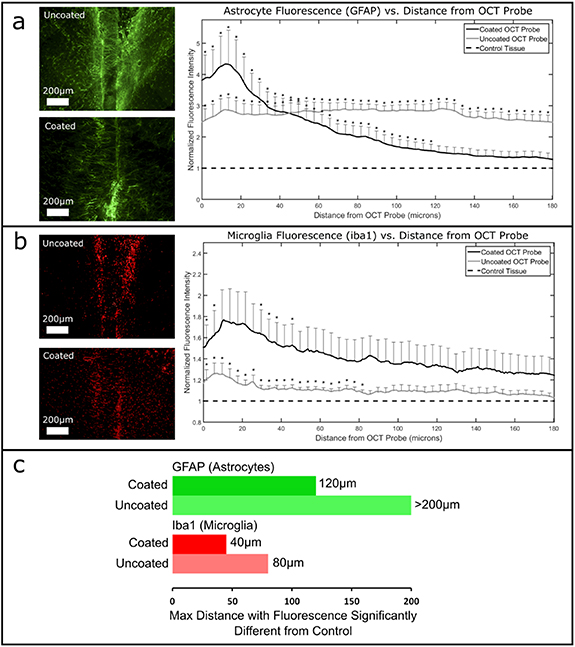
Figure 3. Effect of CH4 plasma coating on glial encapsulation of the OCT probes. Shown are quantified encapsulation by (a) astrocytes labeled by GFAP, and (b) microglia labeled by Iba1, with representative uncoated and coated OCT probe images. The maximum distance with fluorescence intensity significantly different from control tissue is plotted in (c).
Download figure:
Standard image High-resolution image
First, OCT signal attenuation revealed no trends or significant differences between the uncoated and coated groups.
Second, uncoated vs coated comparisons were performed. Uncoated implants were directly compared to coated implants, measuring GFAP (astrocytes) and iba1 (microglia) fluorescence vs distance from the probe and performing student t-tests every 5 µms from the edge of the implants. However, there were no significant differences between the uncoated and coated groups by direct comparison.
Third, both treatment groups were compared separately to control tissue (no implant). Specific comparisons performed were: uncoated vs control, and coated vs control, measuring GFAP (astrocytes) and iba1 (microglia) fluorescence vs distance from the probe and performing student t-tests every 5 µms from the edge of the implants. Both coated and uncoated OCT probes showed significantly higher GFAP (figure 3(a)) and iba1 (figure 3(b)) fluorescence around the implants compared to control tissue (no implant). However, the significant differences did not extend equally for both groups. For coated groups, the distance to non-significantly different fluorescence was shorter than for uncoated groups. That is, the maximum distance with fluorescence significantly different from control was lower for coated implants than uncoated implants (figure 3(c) and significance notations in figures 3(a) and (b)).
Table S1 summarizes the comparisons and statistical tests that were performed in this section, along with a post-hoc power analysis showing that the uncoated vs coated direct comparisons were lacking in power, and the uncoated vs control and coated vs control comparisons were sufficiently powered. Given that there were only three animals per group, the sample size should be increased to be able to properly test the differences between coated and uncoated groups.
In a previous implant study, CH4 plasma coatings reduced tissue encapsulation of titanium intravascular implants (Bergmann 2015). However, our study revealed no clear differences between CH4-coated or uncoated probes by OCT Imaging or by IHC. This may be explained by the differences between the intravascular and nervous system environments, and by the flow component present intravascularly but not in brain tissue. Also, the aforementioned study used titanium as the base material, whereas this study used glass. The fluorescence of CH4 coated probes stopped being significantly different from controls closer than uncoated probes, suggesting the glial capsule may be smaller around CH4 coated probes. However, the variance was generally high for both groups. Further study with larger sample sizes need to be performed to elucidate any relationship between CH4 plasma coatings and the foreign body reaction in the brain.
4. Conclusions
The tissue's intrinsic foreign body reaction often deteriorate the interface between implanted device and biological tissue, thus leading to a worsened performance of electrical recording and/or stimulation, and shortened lifetime of the device. One of the efforts sought to mitigate this impact is to apply plasma coating on an implantable device and has been shown promising results in cardiology applications. To the best of our knowledge, we performed the first investigation on the effectiveness of plasma coating for neural implantable devices. We monitored and compared the tissue reaction to implanted OCT probes with and without plasma coating in rat models. We found there was only a slight improvement of plasma coating in the two groups in comparison as shown in OCT signals and immunohistology analysis. We assume the micro environment in brain to be too different to the cardiovascular system where blood flow constantly flushes the implanted device's coating. Additionally it seems that geometrical (Veiseh et al 2015) or mechanical properties (Mazza and Ehret 2015) dominate foreign tissue response in respect to surface modifications.
Further investigation with larger number of animals would be helpful to derive any statistical information, however our pilot study will provide valuable insight to this well acknowledged yet not solved challenge.
Acknowledgments
This work is partially supported by the BrainLinks-BrainToolsCluster of Excellence funded by the German Research Foundation (DFG, Grant No. EXC 1086). Funding by the German Ministry of Education and Research (BMBF) in project FMT—13GW0230A.
Data availability statement
The data that support the findings of this study are available upon reasonable request from the authors.