Vertically layered flow structure at confluence of a reservoir and tributary carrying high sediment loads
 Yining Sun1
  Ji Li
Ji Li Zhixian Cao
 Alistair G.L. Borthwick
- 1State Key Laboratory of Water Resources and Hydropower Engineering Science, Wuhan University, Wuhan, China
- 2Zienkiewicz Centre for Computational Engineering, Faculty of Science and Engineering, Swansea University, Swansea, United Kingdom
- 3Institute for Infrastructure and Environment, The University of Edinburgh, Edinburgh, United Kingdom
- 4School of Engineering, Computing and Mathematics, University of Plymouth, Plymouth, United Kingdom
Enhanced understanding of flow structure at a river confluence is essential for predictions of sediment transport and morphological evolution. To date, however, the confluent flow structure of a reservoir and tributary carrying high sediment loads has remained poorly understood, and may be vertically layered sharply, featuring subaqueous sediment-laden flow, i.e., turbidity currents underneath subaerial clear water. Here a recently established 2D double layer-averaged model, able to resolve the formation, propagation, and recession of turbidity currents, is used to investigate a series of idealized laboratory-scale cases and a prototype case study of the Guxian Reservoir on the Yellow River, China. Four primary patterns of the stable, vertically layered flow structure at a reservoir-tributary confluence are identified: 1) single layers of sediment-laden inflow in both the main channel and tributary, sustained by sufficient vertical mixing; 2) a double layer in the main channel and a single layer of sediment-laden inflow in the tributary, when the sediment-laden flow in the tributary suffices to block intrusion of flow in the main channel; 3) a single layer of sediment-laden inflow in the main channel and a double layer in the tributary, induced by the intrusion of sediment-laden flow from the main channel into clear-water flow with small discharge in the tributary; and 4) double layers in both the main channel and tributary, which may be further divided into three subpatterns, as turbidity current exists in both the main channel and tributary, or in the main channel (tributary) intruding into the tributary (main channel). In response to unsteady discharge and sediment inputs from upstream, the vertically layered flow structure evolves in time, and may fall into one of the patterns identified above. Although bed deformation in the long term may modify the confluent flow, the vertically layered flow pattern remains so far as the present cases are concerned. The findings have implications for sediment transport and morphological evolution at a reservoir–tributary confluence, for which further studies are suggested to inform the optimization of reservoir operation schemes to mitigate capacity loss caused by sedimentation.
1 Introduction
To generate electricity, prevent floods, supply water, and provide irrigation capacity, a huge number of large reservoirs have been constructed worldwide. For reservoirs built on rivers carrying high sediment loads, subaerial sediment-laden flows from the main channel and/or tributaries may plunge into less dense ambient fluid, and convert into subaqueous sediment-laden flows called turbidity currents. The hydrological and morphological impacts of large reservoirs with high sediment loads can be enormous, as exemplified by the Yellow River, China. In long-term hydro-sediment-morphodynamic processes, confluent flows with high sediment loads may cause severe bed aggradation. One of the most telling cases concerns the Sanmenxia reservoir on the Yellow River, where severe bed aggradation occurred inside its tributary, the Weihe River, driven by the intrusion of turbidity currents from the Yellow River in August 1967 (Fan, 2011). Severe bed aggradation caused by a turbidity current at the confluence of a reservoir and tributary can adversely affect flood control and hydropower functions. Notably, disparate vertically layered flow structures are often generated at these confluences, which exert a major influence on local sediment transport and morphological evolution processes. Enhanced understanding of such layered flow structures is essential for the management of large rivers with confluences carrying sediment-laden flows.
The hydro-sediment-morphodynamics of river confluences have been investigated for more than half a century. Field investigations (Rhoads and Sukhodolov, 2001; Sukhodolov and Rhoads, 2001; Biron et al., 2002; Riley and Rhoads, 2012; Ramón et al., 2013; Rhoads and Johnson, 2018; Zhang et al., 2020; Yuan et al., 2021), laboratory experiments (Taylor, 1944; Webber and Greated, 1966; Weber et al., 2001; Ribeiro et al., 2012; Yuan et al., 2018), and mathematical modelling studies (Bradbrook et al., 2001; Biron et al., 2004; Constantinescu et al., 2012; Lyubimova et al., 2014; Yang et al., 2014) have improved the understanding of the hydrodynamic characteristics, mixing, sediment transport, and bed morphology near river confluences. Generally, it has been revealed that the flow structure at river channel confluences can be divided into six major zones, i.e., flow stagnation, flow deflection, flow separation, maximum velocity, flow recovery, and distinct shear zones (Best, 1987). Accordingly, bed morphology at channel confluences is characterized by three elements: avalanche faces at the mouth, a deep central scour and a bar within the separation zone (Best, 1988), depending on width-to-depth ratio (Parsons et al., 2007; Szupiany et al., 2009), confluence angle (Mosley, 1976; Ghobadian and Bajestan, 2007) and momentum flux ratio between tributary and main channel (Rhoads and Johnson, 2018). Such studies have, however, almost exclusively been confined to confluent flows with low sediment loads or clear water, where sediment entrainment and scouring at the confluence are fundamentally controlled by downwelling and upwelling flows of helical motions (Yuan et al., 2018; Yuan et al., 2021). By contrast, fluvial processes of highly concentrated sediment-laden confluent flows can be distinct as characterized by much more significant sediment deposition without obvious scour hollow at the junction. To date, only a few experimental and computational studies have focused on river confluences with hyperconcentrated tributary flows (Zhang et al., 2015; Zhang and Wang, 2017; Wang et al., 2019). Increased sediment deposition and more prominent bars occur at confluences with high sediment loads than at those starved of sediment (Zhang and Wang, 2017). A number of investigations have been carried out on flows at river confluences, but little attention has been paid to reservoir-tributary confluences. Reservoir-tributary confluent flows carrying high sediment loads exhibit constantly changing and complex hydro-sediment-morphological processes. A thorough investigation of such processes can only be obtained when flow structures at reservoir-tributary confluences are properly understood. However, the understanding of flow structures at the confluences of reservoirs and tributaries carrying high sediment loads is presently far from clear.
Under appropriate inflow and sediment input conditions, especially when there is sufficiently high sediment load from either the main channel or a tributary, a turbidity current may develop at the river confluence and lead to a vertically layered flow structure, featuring complicated fluid-particle interactions that are not yet fully understood (Armanini, 2013; Cantero-Chinchilla et al., 2015). Over the past few decades, computational simulations have facilitated resolution of turbidity currents in reservoirs (Ford and Johnson, 1983; Hu et al., 2012; Cao et al., 2015; Xia, 2019). Full 3D models (Georgoulas et al., 2010; An and Julien, 2014) incur excessively high computational overheads and so are not viable for large-scale, long-duration applications. Based on an empirical plunging criterion, Wang et al. (2016) proposed a 1D model for open channel flows with turbidity currents, which ignored the differences between incipient and stable plunging criteria that have been revealed by theoretical analysis (Dai and Garcia, 2009; Li et al., 2011) and flume experiments (Lee and Yu, 1997). 2D layer-averaged models are significantly more efficient than 3D and so are more commonly used for turbidity current propagation (Hu et al., 2012; Lai et al., 2015). For the first time, Cao et al. (2015) developed a 2D double layer-averaged model to resolve the whole processes of reservoir turbidity currents, from formation and propagation to recession, as well as bed evolution. This model, along with its recently extended double layer-averaged two-phase flow version, has been applied to resolve landslide-generated waves, and barrier lake formation and breach processes (Li et al., 2019; Li et al., 2020; Li et al., 2021).
This study aims to unravel the vertically layered flow structure at a river confluence under a wide range of inflow and sediment input conditions. The coupled 2D double layer-averaged model proposed by Cao et al. (2015) is used to investigate a series of idealized laboratory-scale tests and a large-scale prototype case study concerning the Guxian Reservoir on the Middle Yellow River, China. The computational results are evaluated in accordance with the corresponding physical controls to ascertain the layered flow structure patterns at a reservoir-tributary confluence under different conditions in the main channel and tributary.
2 Mathematical model
The 2D double layer-averaged model is detailed in Cao et al. (2015) and outlined in Supplementary Text S1 in the Support Information online. Briefly, the governing equations in the 2D double layer-averaged model (Cao et al., 2015) are derived from fundamental conservation laws for shallow water-sediment flow dynamics. These include mass and momentum conservation equations for the upper clear-water flow layer and the lower sediment-laden flow layer (e.g., turbidity current), a mass conservation equation for sediment carried by the turbidity current, and a mass conservation equation for bed sediment. For the upper layer,
The model governing equations (Cao et al., 2015) are synchronously solved as two hyperbolic systems, one for the upper layer, the other for the lower layer. Each hyperbolic system is solved by a quasi-well-balanced numerical algorithm involving drying and wetting, using an accurate finite volume Godunov-type approach in conjunction with the HLLC (Harten-Lax-van Leer Contact Wave) approximate Riemann solver on a fixed rectangular mesh. The numerical algorithm is second-order accurate, explicit, and its time step is controlled by the Courant-Friedrichs-Lewy condition.
An earlier version of the aforementioned 2D double layer-averaged model was applied to dam break flows over erodible bed (Li et al., 2013), and gave numerical predictions that agreed well with observed data involving shock waves and contact discontinuity. To date, the 2D double layer-averaged model (Cao et al., 2015) has remained to the authors’ knowledge the only 2D model that can resolve the whole process of formation, propagation, and recession of turbidity currents. It has been extensively calibrated and validated using a series of experimental turbidity currents related to lock-exchange (Bonnecaze et al., 1995) and sustained inflows (Lee and Yu, 1997), and also successfully applied to the whole process of turbidity currents in the Xiaolangdi Reservoir in the Middle Yellow River, China. Recently, it has been tested against a suite of flume experiments of turbidity currents in a main channel-tributary system (Wang et al., 2020), with the tributary joining the main channel at an angle of 90° or 60°, as displayed in Text S2 in the Support Information online. Further, the model has been further extended to resolve landslide-generated waves and barrier lake formation and breach processes (Li et al., 2019; Li et al., 2020; Li et al., 2021). Here it is applied to resolve the flow at a reservoir-tributary confluence, noting that its extended two-phase flow version (Li et al., 2020; Li et al., 2021) produces equivalent results for reservoir turbidity currents.
3 Laboratory-scale tests
3.1 Case description
A series of laboratory-scale numerical cases are designed based on the flume experiments of Lee and Yu (1997). As the experiments originally did not involve a tributary, a hypothetical tributary is herewith set to the right-hand side of the main channel, with the tributary meeting the main channel at a junction angle of 90° (Figure 1). Two junction locations are considered, at
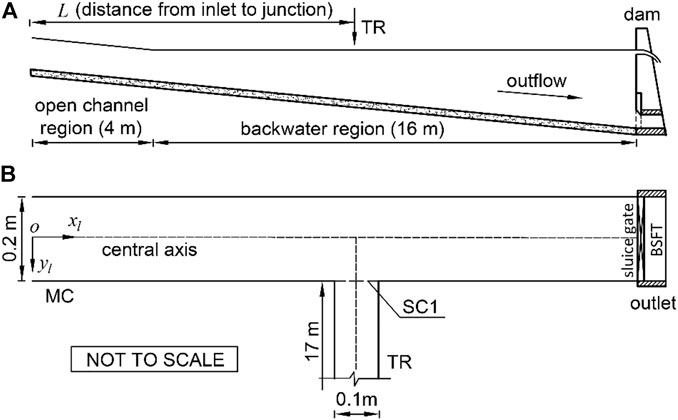
FIGURE 1. Vertical profile (A) and plan view (B) of the main channel (MC) and tributary (TR). Abbreviation BSFT refers to bottom sediment flushing tunnel, and abbreviation SC1 refers to the cross-section located at the junction.
Table 1 lists three series of numerical cases designed according to combinations of different inflows from the main channel and tributary: Series B for sediment-laden flow from the main channel and clear-water flow from the tributary; Series C for sediment-laden flows from both the main channel and tributary; and Series D for clear-water flow from the main channel and sediment-laden flow from the tributary. The tributary-to-main channel discharge ratio is defined by
TABLE 1. Series of numerical cases of laboratory-scale confluence flows.
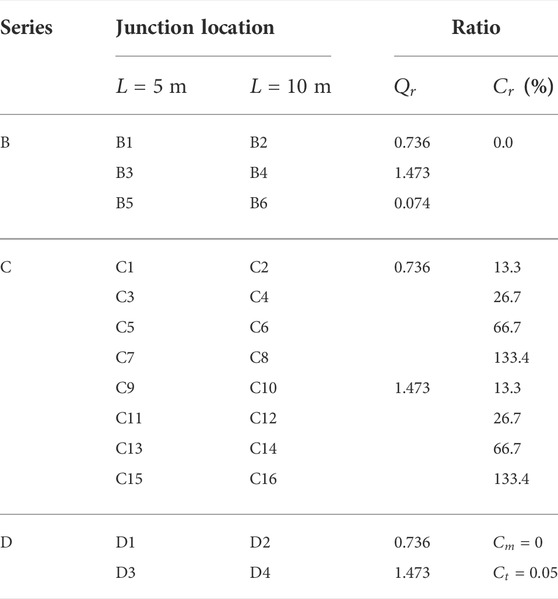
TABLE 2. Summary of junction location and inflow conditions for all numerical cases.
The present computations assume initially steady, gradually varied, clear-water flows in accordance with the prescribed discharges in the main channel and tributary, and an undisturbed water depth of 0.34 m immediately upstream of the dam.
When the inflow contains sediment (and hence there is no clear-water flow layer), the prescribed discharge and sediment concentration (Table 2) determine the boundary conditions at the inlet cross-sections in the main channel and tributary for the subaerial sediment-laden flow layer. The prescribed discharge (Table 2) is used to specify the corresponding boundary condition for clear-water flow, when there is no sediment-laden flow layer. The boundary conditions are implemented using the method of characteristics.
At the outlet cross-section, before arrival of the turbidity current front at the dam, the bottom sluice gate is closed, and there is no outflow of the turbidity current. The depth and velocity of the upper clear-water flow layer are determined by the method of characteristics according to the outflow discharge,
where
The suspended material is non-cohesive kaolin having a specific gravity of 2.65 and a mean particle diameter of 6.8 μm. The bed roughness Manning coefficient is
3.2 Results
The vertically layered flow structures at the confluence are herewith evaluated in terms of the free water surface, interface, and bed profile of the main channel and tributary at two instants corresponding to a stable state and a long-term state. Here the long-term state means that bed deformation is so great that its effects on the vertically layered flow structure are considerable.
The vertically layered flow structure at the confluence evolves in time when the upstream boundary conditions at the main channel or tributary correspond to highly concentrated sediment-laden flow, as opposed to initial clear-water flow. Under certain conditions, subaerial sediment-laden flows in the main channel and tributary plunge into clear water to form subaqueous sediment-laden flow in the form of a turbidity current. Given that the upstream boundary discharge and sediment concentration are steady in the cases considered herein, the vertically layered flow structure at the confluence should evolve eventually to a steady regime. In the long run, bed deformation occurs near the confluence, leading to a feedback effect on the vertically layered flow structure.
Notably, the formation of vertically layered flow structures at the confluence mainly depends on the discharge and sediment concentration from upstream in the main channel and tributary, as well as the junction location. Table 3 summarizes four primary patterns of stable, vertically layered flow structure at the confluence, identified as: 1) SL MCSF—SL TRSF (single layers in both the main channel and tributary), 2) DL MCSF—SL TRSF (a double layer in the main channel and a single layer in the tributary), 3) SL MCSF—DL TRCW (a single layer in the main channel and a double layer in the tributary), and 4) DL MC—DL TR (double layers in both the main channel and tributary). Moreover, the vertically layered flow structure DL MC—DL TR is divided into three subpatterns, i.e., DL MCSF—DL TRCW, DL MCSF—DL TRSF, and DL MCCW—DL TRSF (where SF denotes sediment-laden inflow and CW denotes clear-water inflow). In Table 3, the stable plunge point denotes the plunge point of reservoir turbidity current along the central line of main channel at a stable state. Supplementary Table S2 in the Supporting Information online lists the distance between stable plunge point and main flume entrance for Cases B1-B6 and C1-C16. Figures 2–7 display the free water surface elevation, interface between the lower sediment-laden flow layer and upper clear-water flow layer, and bed elevation along the central axes of the main channel and tributary for typical cases at two instants (t = 2 min and 2 h), as well as the long-term three-dimensional layered flow structure at t = 2 h.
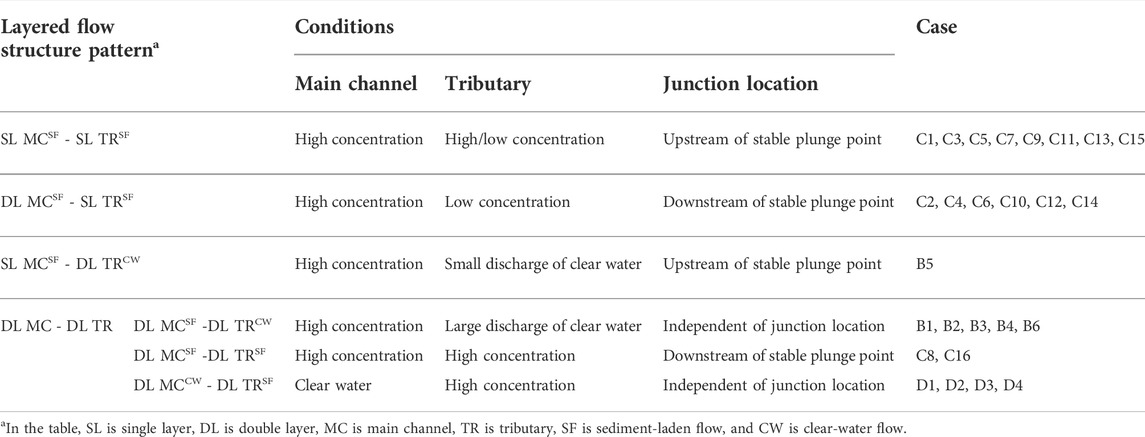
TABLE 3. Stable vertically layered flow structure patterns at idealized, laboratory-scale confluences.
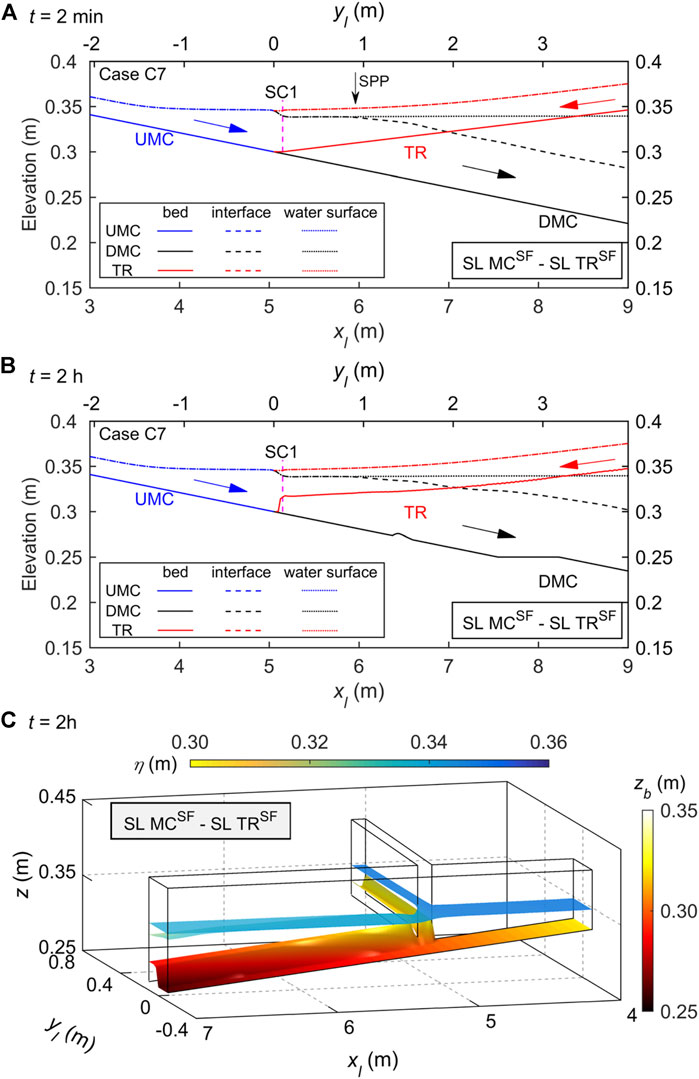
FIGURE 2. Case C7 of SL MCSF—SL TRSF for highly concentrated, sediment-laden flow in the main channel (MC) and tributary (TR), where UMC and DMC denote upstream and downstream of the MC confluence, and SPP is stable plunge point: free water surface elevation, interface, and bed elevation profiles along the central axes of the main channel and tributary at (A) a stable state (t = 2 min), (B) a long-term state (t = 2 h); and (C) three-dimensional layered flow structure at t = 2 h.
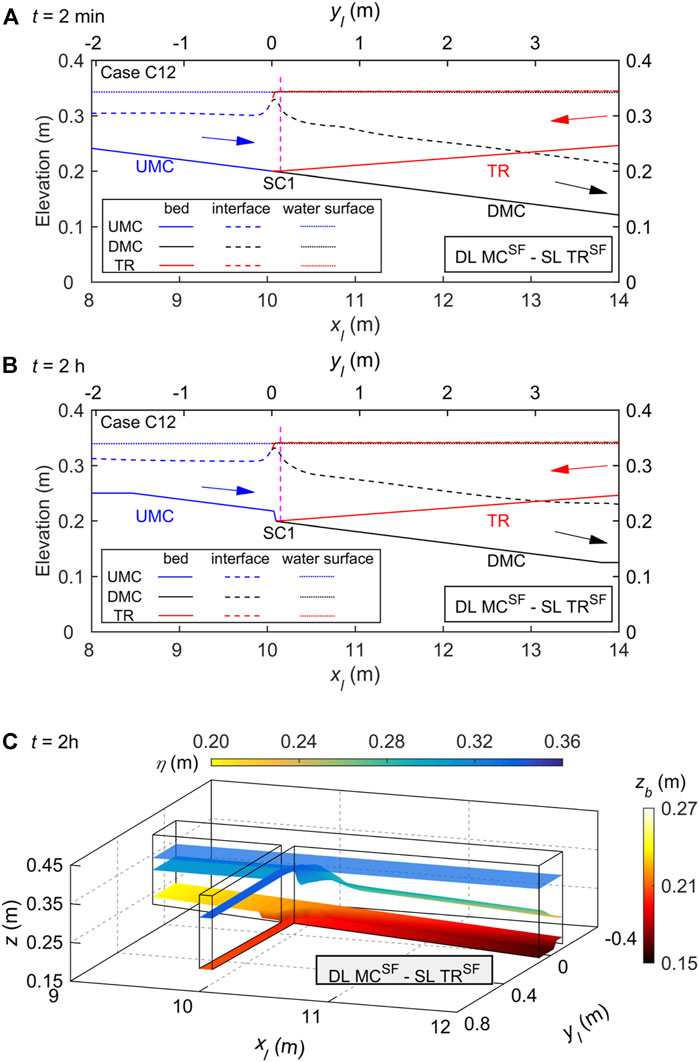
FIGURE 3. Case C12 of DL MCSF—SL TRSF for high-concentration sediment-laden flow in the main channel (MC) and low-concentration sediment-laden flow in the tributary (TR), where UMC and DMC denote upstream and downstream of the MC confluence: free water surface elevation, interface, and bed elevation profiles along the central axes of the main channel and tributary at (A) a stable state (t = 2 min), (B) a long-term state (t = 2 h); and (C) three-dimensional layered flow structure at t = 2 h.
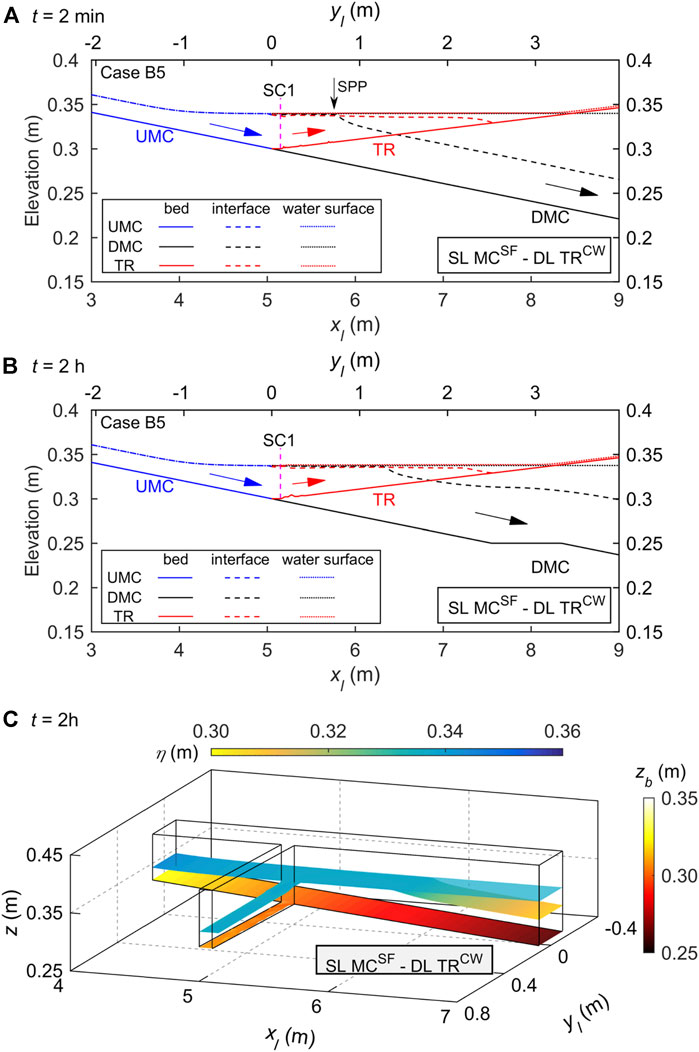
FIGURE 4. Case B5 of SL MCSF—DL TRCW for high-concentration sediment-laden flow in the main channel (MC) and low discharge clear-water flow in the tributary (TR), where UMC and DMC denote upstream and downstream of the MC confluence, and SPP is stable plunge point: free water surface elevation, interface, and bed elevation profiles along the central axes of the main channel and tributary at (A) a stable state (t = 2 min), (B) a long-term state (t = 2 h); and (C) three-dimensional layered flow structure at t = 2 h.
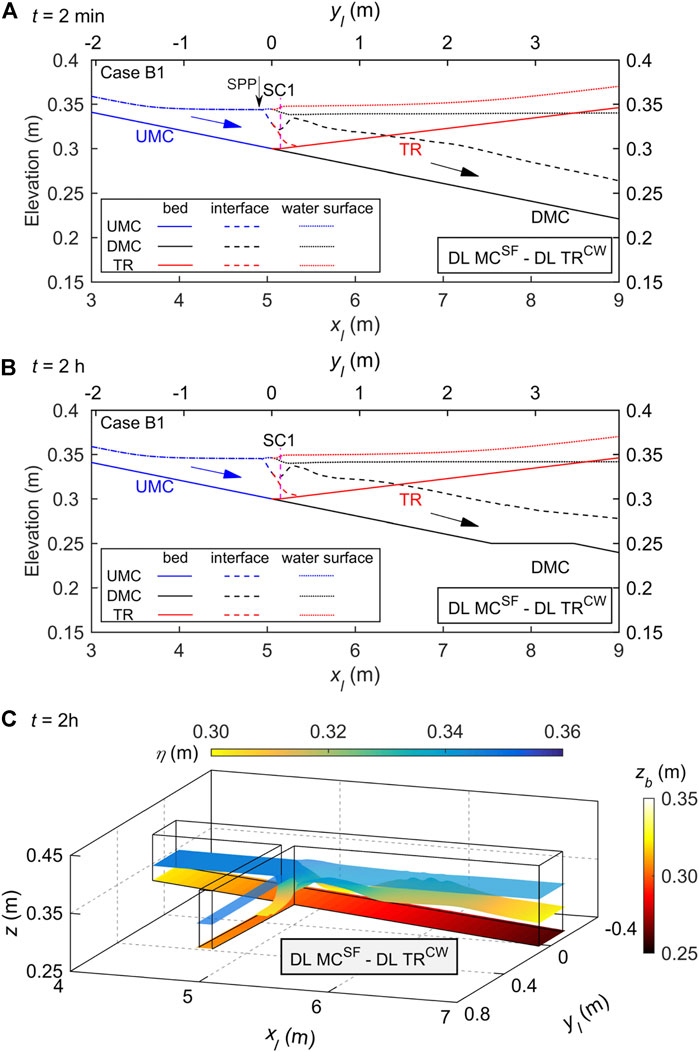
FIGURE 5. Case B1 of DL MCSF—DL TRCW for highly concentrated, sediment-laden flow in the main channel (MC) and high discharge, clear-water flow in the tributary (TR), where UMC and DMC denote upstream and downstream of the MC confluence, and SPP is stable plunge point: free water surface elevation, interface, and bed elevation profiles along the central axes of the main channel and tributary at (A) a stable state (t = 2 min), (B) a long-term state (t = 2 h); and (C) three-dimensional layered flow structure at t = 2 h.
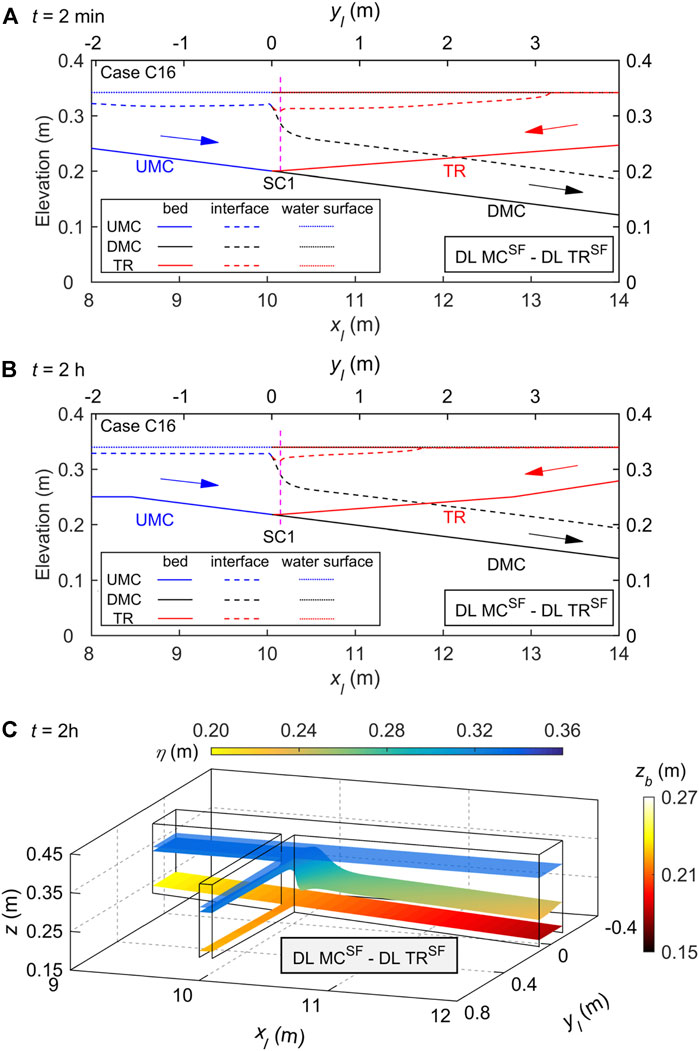
FIGURE 6. Case C16 of DL MCSF—DL TRSF for highly concentrated, sediment-laden flows in both the main channel (MC) and tributary (TR), where UMC and DMC denote upstream and downstream of the MC confluence: free water surface elevation, interface, and bed elevation profiles along the central axes of the main channel and tributary at (A) a stable state (t = 2 min), (B) a long-term state (t = 2 h); and (C) three-dimensional layered flow structure at t = 2 h.
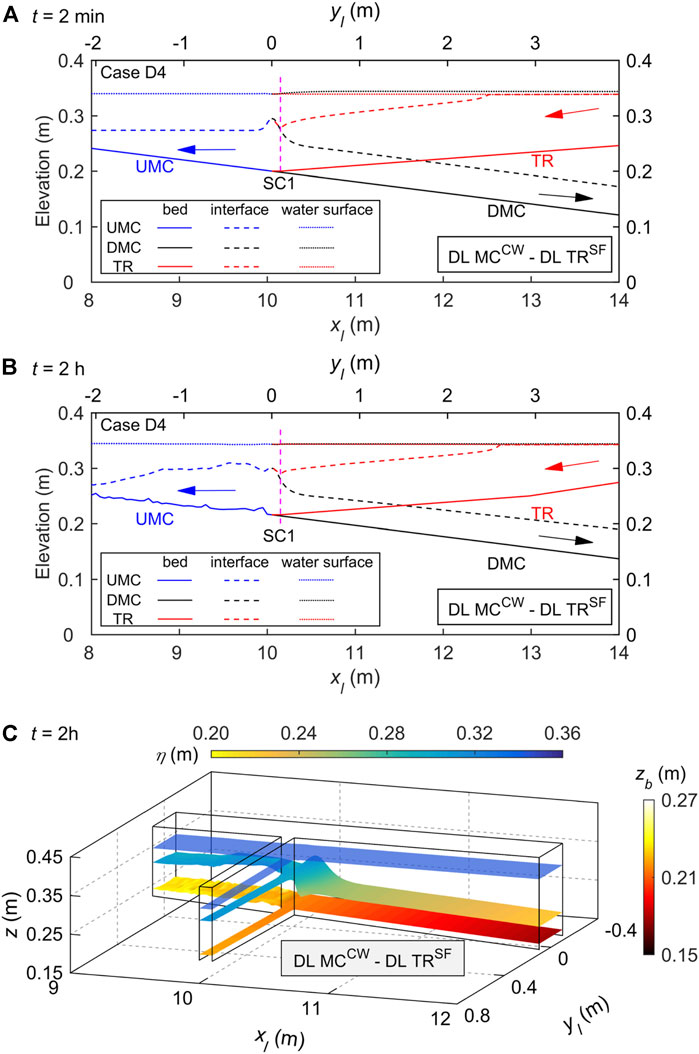
FIGURE 7. Case D4 of DL MCCW—DL TRSF for clear-water flow in the main channel (MC) and highly concentrated, sediment-laden flow in the tributary (TR), where UMC and DMC denote upstream and downstream of the MC confluence: free water surface elevation, interface, and bed elevation profiles along the central axes of the main channel and tributary at (A) a stable state (t = 2 min), (B) a long-term state (t = 2 h); and (C) three-dimensional layered flow structure at t = 2 h.
3.2.1 Vertically SL MCSF - SL TRSF
For Cases C1, C3, C5, C7, C9, C11, C13, and C15, which feature the junction located upstream of stable plunge point and sediment-laden inflows from upstream in both the main channel and the tributary, vertically SL MCSF - SL TRSF occurs at the confluence, as summarized in Table 3. First, a typical Case C7 is considered. At t = 2 min, subaerial sediment-laden flow in the main channel has plunged into clear water and turned into a turbidity current. The plunge point of the main channel turbidity current is stable at
3.2.2 Vertically DL MCSF—SL TRSF
In Cases C2, C4, C6, C10, C12, and C14, the stable layered flow structure at the confluence is characterized by DL MCSF - SL TRSF, in accordance with high sediment load upstream in the main channel, low sediment load upstream in the tributary, and the junction located downstream of stable plunge point (Table 3). For a typical Case C12, at t = 2 min, subaerial sediment-laden flow in the main channel has plunged into clear water, with the plunge point located upstream of the junction. The single sediment-laden flow of the tributary has encountered the main channel turbidity current whose thickness increases appreciably at the junction. Additionally, subaerial sediment-laden flow from the tributary plunges into clear water at the junction and maintains a continuous interface between two layers of the main channel turbidity current (Figure 3A). At t = 2 h, sediment has been deposited upstream of the dam during propagation of the turbidity current toward the outlet, whilst severe bed aggradation has occurred upstream of the junction and below the opposite tributary side, thus raising the interface along the main channel (Figures 3B,C).
3.2.3 Vertically SL MCSF—DL TRCW
For Case B5, characterized by highly concentrated, sediment-laden flow from upstream in the main channel and low discharge, clear-water flow from upstream in the tributary, and junction location upstream of stable plunge point, vertically layered flow structure SL MCSF—DL TRCW occurs at the confluence. By t = 2 min, subaerial sediment-laden flow in the main channel has plunged into the clear water and formed a turbidity current in the reservoir, with front already intruding into the tributary. The plunge point of the main channel turbidity current occurs downstream of the junction, stabilizing at
3.2.4 Vertically DL MC—DL TR
Depending on junction locations and inflow and sediment input conditions from the main channel and tributary, the vertically layered flow structure DL MC—DL TR at the confluence is even more complicated than the afore-stated SL MCSF—SL TRSF, DL MCSF—SL TRSF, and SL MCSF—DL TRCW structures (Table 3), which can be further divided into three subpatterns as follows:
1) Vertically layered flow structure DL MCSF—DL TRCW at the confluence appears to result from highly concentrated, sediment-laden flow in the main channel and high-discharge clear-water flow in the tributary, as per Cases B1, B2, B3, and B4 (Table 3). Figure 5 displays the free water surface elevation, interface, and bed elevation profiles along the central axes of the main channel and tributary for Case B1 at times t = 2 min and 2 h, and its long-term three-dimensional layered flow structure at t = 2 h. At t = 2 min, the subaerial sediment-laden flow turns into a turbidity current in the main channel, whose front has extended into the tributary. The plunge point of the main channel turbidity current locates upstream of the junction and stabilizes at
2) Vertically layered flow structure DL MCSF—DL TRSF at the confluence develops when both main channel and tributary carry high-concentration, sediment-laden flows, and the junction is located downstream of a stable plunge point, as in Cases C8 and C16. Figure 6 shows the free surface elevation, interface, and bed profiles for Case C16 at times t = 2 min and 2 h, and the long-term three-dimensional layered flow structure at t = 2 h. By t = 2 min, substantial turbidity currents have developed in the main channel and tributary and interacted with each other. The thickness of the main channel turbidity current increases considerably at the confluence because of the inflow and sediment input from the tributary (Figure 6A). The plunge points of the turbidity current in the main channel and tributary are both stable and located upstream of the junction. In the long term (t = 2 h), the interface elevation is increased, and bed aggradation occurs at the confluence and upstream of the dam during the propagation of turbidity currents along the main channel and tributary (Figures 6B,C).
3) Vertically layered flow structure DL MCCW—DL TRSF at the confluence results from clear-water flow in the main channel and high-concentration sediment-laden flow in the tributary, as per Cases D1, D2, D3, and D4. For a typical Case D4, Figure 7 displays the free surface elevation, interface, and bed profiles along the central axes of the main channel and tributary at times t = 2 min and 2 h, and the long-term three-dimensional layered flow structure at t = 2 h. By t = 2 min, the subaerial sediment-laden flow in the tributary has plunged into clear water and turned into a turbidity current. The plunge point of the tributary turbidity current is located upstream of the junction, and its front intrudes into the main channel and propagates both upstream and downstream (Figure 7A). In the long term (t = 2 h), during the propagation of tributary turbidity current along the main channel, its upstream propagation distance is less than downstream. This occurs primarily because shear stresses at the interface between the upper clear-water flow layer and the lower sediment-laden flow layer are greater when the turbidity current propagates upstream in the main channel. Bed aggradation occurs at the confluence, with more sediment deposited upstream of the junction along the main channel (Figures 7B,C).
4 A field-scale case—Guxian Reservoir, Yellow River
4.1 Study area
The Guxian Reservoir, planned for the Middle Yellow River, China (Figure 8) is selected for the present field (prototype) case study because its tributary sediment inputs may account for more than 40% of the total sediment input, unlike the Xiaolangdi Reservoir, into which the tributary sediment inputs are negligible (Cao et al., 2015). Currently, an enhanced understanding of the vertically layered flow structure in the proposed Guxian Reservoir and its tributaries is urgently needed for its design and operation, as it underpins the investigations of sediment transport and morphological evolution.
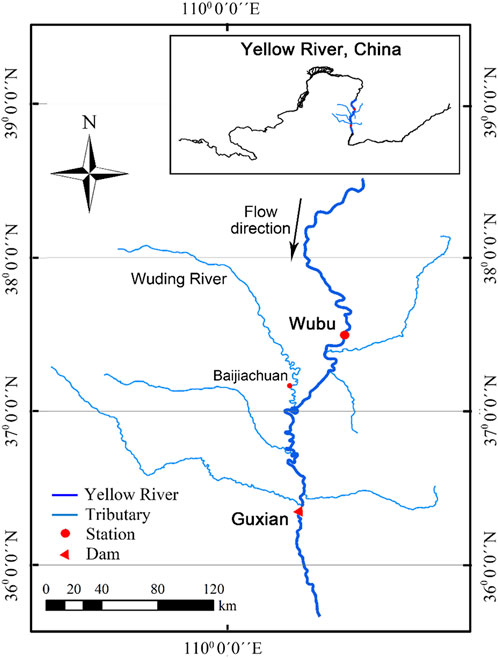
FIGURE 8. Guxian Reservoir and its tributaries.
The total length of the Guxian Reservoir, from Wubu station to the dam, is approximately 195 km. The normal water level of the Guxian Reservoir is 627 m, corresponding to a total water storage capacity of
The computational domain comprises the main channel from Wubu to the Guxian dam (approximately 195 km long, and 300 m–1,500 m wide), and the Wuding River from Baijiachuan to its junction with the main Yellow River (Figure 8). The study reach of the Wuding River is ∼16 km long from the junction to Baijiachuan, located ∼125 km upstream of the Guxian dam. The confluence of the main channel and Wuding River is asymmetrical, with a 60° geometric angle between the two confluent flows. The initial bed topography used in the present computational model is estimated from observed data of April 2017.
4.2 Model setup
Under normal operating conditions, the water level in the Guxian Reservoir is 627 m with respect to the 1985 National Height Datum, China. A fixed-bed, steady flow simulation is conducted first, and the flow hydraulics thus obtained is used as the initial condition, with gradually varied clear-water inflow corresponding to discharges specified at Wubu and Baijiachuan.
Table 4 lists flow discharges and sediment concentrations at the two upstream boundary cross-sections (i.e., Wubu and Baijiachuan, Figure 8). A computational case is considered, based on the availability of observed data for input to the model. It simulates the evolution of vertically layered flow structures at the river confluence for a highly concentrated, sediment-laden flood that entered the Guxian Reservoir in July 2012 (Figure 9, Wubu) along with clear-water inflow (without sediment) from the Wuding River. At the downstream boundary (Guxian dam), a boundary condition is not required for the turbidity current before its front arrives. The depth and velocity of the clear-water flow layer are determined by the method of characteristics according to the outflow discharge Qout, which was kept constant at 6,067 m3/s, the design discharge for the Guxian Reservoir.
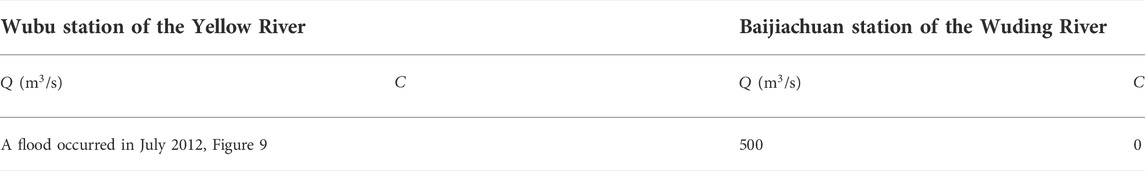
TABLE 4. Summary of prototype cases—Guxian Reservoir.

FIGURE 9. Flow discharge hydrographs and sediment concentration time series: Observed data and linear approximation at the Wubu station for a highly concentrated, sediment-laden flood lasting from 8:00 a.m. on July 26 to 8:00 a.m. on 31 July 2012, and two flood peaks caused by secondary rainfall.
The following parameters are specified based on data for the Middle Yellow River: mean sediment particle size
4.3 Results
In response to unsteady discharge and sediment input from upstream, a vertically layered flow structure evolves at the confluence of the Guxian Reservoir and Wuding River. Figure 10 displays the free water surface elevation, interface, and bed elevation profiles along the thalweg, as well as the three-dimensional layered flow structure at t = 24 h. Up to t = 24 h, subaerial sediment-laden flow at the inlet of the Guxian Reservoir has plunged into clear water and formed a turbidity current in the main channel. The plunge point of the main channel turbidity current is located upstream of the junction at
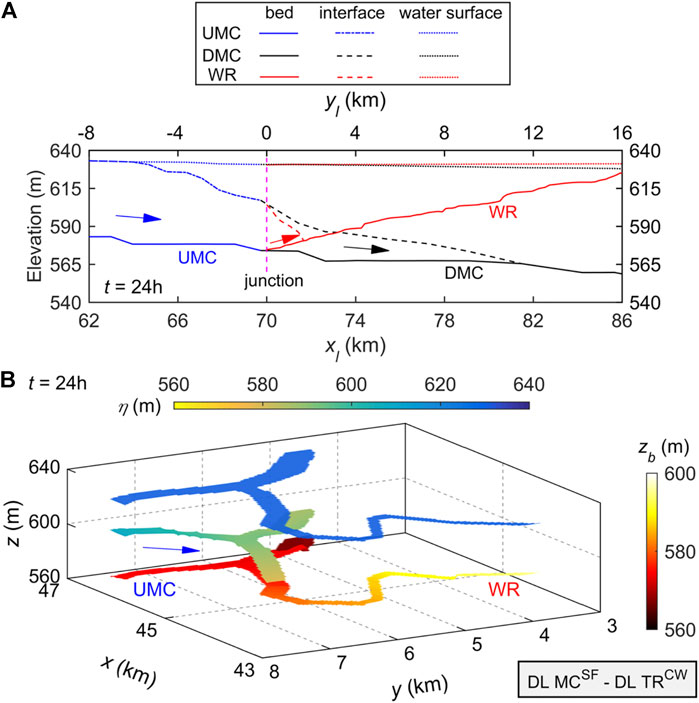
FIGURE 10. Vertically DL MCSF—DL TRCW within the confluence of MC (Yellow River) and WR (Wuding River) at t = 24 h, where UMC and DMC denote upstream and downstream of the MC confluence: (A) water surface elevation, interface, and bed profiles along the thalweg, and (B) three-dimensional layered flow structure.
By t = 120 h (Figure 11), the plunge point of the main channel turbidity current occurs downstream of the junction with Wuding River, and the upper clear-water layer at the junction has disappeared. Meanwhile, a vertically layered flow structure SL MCSF—DL TRCW can be discerned at the confluence (Figure 11A), similar to the vertically layered flow structure at t = 2 min for Case B5 shown in Figure 4A. As the lower sediment-laden flow intrudes from main channel to Wuding River, the velocity of the sediment-laden layer in Wuding River decreases, leading to sediment deposition in the Wuding River, whilst bed aggradation occurs inside the tributary mouth (Figure 11B), similar to the bed deformation at the confluence for Case B5 displayed in Figure 4C. It should be noted that the vertically layered flow structure at the confluence evolves in time in response to the unsteady discharge and sediment concentration at the Wubu boundary (Table 4), unlike the occurrence of stable layered flow structures in the idealized laboratory-scale cases due to steady inflow conditions (Table 3), whereby the initial plunge point of the main channel turbidity current may differ from the stable plunge point (Cao et al., 2015).
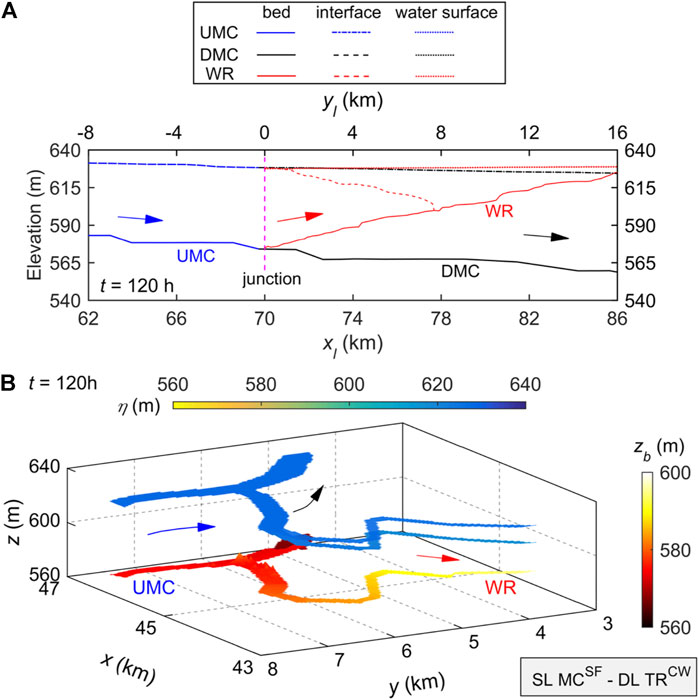
FIGURE 11. Vertically SL MCSF—DL TRCW within the confluence of MC (Yellow River) and WR (Wuding River) for Case G1 at t = 120 h, where UMC and DMC denote upstream and downstream of the MC confluence: (A) water surface elevation, interface, and bed profiles along the thalweg, and (B) three-dimensional layered flow structure.
Succinctly, the vertically layered flow structure at a reservoir-tributary confluence, such as case of the Guxian Reservoir, evolves in time in response to the unsteady discharge and sediment concentrations. Yet the layer flow structure falls into one of the patterns identified based on the laboratory scale cases as shown in Figures 2–7. Consequently, the patterns of the vertically layered flow structures identified from the idealized laboratory-scale cases under steady inflow conditions are of fundamental importance in the investigation of hydro-sediment-morphodynamics at reservoir-tributary confluences carrying high sediment loads.
5 Discussion
It is interesting to probe into the physical controls on the distinct layered flow structures at a reservoir-tributary confluence, as described above. Given that the upstream boundary discharge and sediment concentration are steady in the laboratory-scale cases, the vertically layered flow structure at the confluence evolves to a steady regime. In contrast to the unsteady discharge and sediment input from the upstream reach of the Yellow River and its tributary Wuding River, the vertically layered flow structure at the confluence evolves in time and eventually falls into one of the primary patterns identified.
As shown in Figure 2, for Case C7, single sediment-laden flows are generated upstream of the main channel and tributary, respectively, while the tributary with higher sediment concentration sufficiently intrudes into the main channel. Sediment-laden flows from the main channel and tributary are well mixed vertically at the confluence, thus producing a vertically layered flow structure SL MCSF—SL TRSF. By contrast, as shown in Figure 4, for Case B5, there is a single layer sediment-laden flow upstream in the main channel and clear-water flow upstream in the tributary. The tributary flow with smaller discharge does not suffice to block the intrusion of the sediment-laden flow from the main channel. Therefore, a vertically layered flow structure SL MCSF—DL TRCW is formed at the confluence in the laboratory-scale case (Figure 4A), in accordance with the field-scale results of the Guxian Reservoir at t = 120 h (Figure 11). In a long term, the upper clear-water flow layer inside the tributary mouth diminishes, and thus the SL MCSF—DL TRCW is less discernible (Figure 4B). Comparison between Figures 2, 4 shows that when the main channel features a single layer (i.e., SL MCSF), the formation of a single layer or double layer in the tributary (i.e., SL TRSF or DL TRCW) mainly depends on whether the main channel sediment-laden flow could intrude into the tributary or not.
As illustrated in Figure 3, for Case C12, a double layer flow exists upstream of the confluence in the main channel, and a single sediment-laden flow layer exists upstream in the tributary, featuring no intrusion between the main channel and tributary. Thus, a vertically layered flow structure DL MCSF—SL TRSF is produced at the confluence. By contrast, as shown in Figure 6, for Case C16, a double layer flow exists upstream of the confluence in the main channel and in the tributary, leading to the formation of DL MCSF—DL TRSF at the confluence. Figures 3, 6 illustrate that when the main channel features a double layer (i.e., DL MCSF), the formation of a single layer or double layer in the tributary (i.e., SL TRSF or DL TRSF) at the confluence depends on whether a turbidity current could form upstream in the tributary.
As illustrated by Figure 5, for Case B1, there is a double layer upstream of the confluence in the main channel and a single clear-water flow layer upstream in the tributary. The main channel turbidity current intrudes into the tributary at the confluence and thus produces a vertically layered flow structure DL MCSF—DL TRCW, similar to the field-scale results of the Guxian Reservoir at t = 24 h in Figure 10. By contrast, as displayed in Figure 7, for Case D4, there is a single clear-water flow layer upstream in the main channel and a double layer upstream of the confluence in the tributary. With intrusion of turbidity current from the tributary into the main channel, a vertically layered flow structure DL MCCW—DL TRSF occurs at the confluence. In short, it is the intrusion of turbidity current from the main channel (or tributary) into clear-water flow in the tributary (or main channel) that leads to the formation of a double layer at the confluence.
Physically, bed evolution at a reservoir-tributary confluence carrying high sediment load depends strongly on the pattern of vertically layered flow structure that develops. More specifically, with intrusion of the reservoir turbidity current from main channel to tributary, a vertically layered flow structure SL MCSF—DL TRCW with bed aggradation inside the tributary mouth appears to occur at the confluence (Figures 4B,C). For high-concentration, sediment-laden flows in both the main channel and tributary, a vertically layered flow structure SL MCSF—SL TRSF causes bed aggradation inside the tributary mouth and below the downstream junction corner (Figures 2B,C), whereas a vertically layered flow structure DL MCSF—DL TRSF leads to severe bed aggradation within the confluence (Figures 6B,C). For a high-concentration, sediment-laden flow arising solely from the tributary, the resulting DL MCCW—DL TRSF structure leads to bed aggradation at the confluence and more sediment deposition upstream of the junction along the main channel (Figures 7B,C). By contrast, for high-concentration, sediment-laden flow in the main channel and low-concentration sediment-laden flow in the tributary, a vertically layered flow structure DL MCSF—SL TRSF develops at the confluence with bed aggradation upstream of the junction and below the opposite tributary side (Figures 3B,C). These findings contrast with the scour hollow observed in previous studies (Herrero et al., 2017; Sambrook Smith et al., 2019) of river confluences with low sediment loads or clear water. It is implied that sediment transport and morphological evolution at such reservoir-tributary confluences may vary drastically under the influences of distinct layer flow structures identified above. Further studies along this line are certainly warranted.
The present 2D double layer-averaged model does not explicitly consider the effect of velocity discrepancy between sediment particles and the fluid phase. Although this effect is negligible in the present computational cases with essentially fine sediment, future studies should be conducted using two-phase flow models (Li et al., 2020; Li et al., 2021). Moreover, the effect of sediment on the turbulence model is neglected in the 2D double layer-averaged model. In practice, this effect remains far from clear, even for steady, uniform sediment-laden flows in open channels (Cao et al., 2015). Furthermore, when the sediment concentration is sufficiently high, the water-sediment mixture may behave as a non-Newtonian fluid, and the present model would have to be extended accordingly. Computational cost is also of major concern in the present work, particularly when the model is used to simulate natural large-scale fluvial processes. Therefore, the present model could be improved to incorporate an unstructured mesh, local time step, and parallel computing following e.g., (Hu et al., 2019; Ni et al., 2020). To better represent the vertically layered flow structure in complicated domains, it is also recommended that the present model be boundary fitted, perhaps using cut-cell methods on an adaptive grid (see e.g., Liang et al. (2007), for an application to shallow flow hydrodynamics) and using sophisticated wetting and drying algorithms (Liang and Borthwick, 2009).
6 Conclusion
The vertically layered flow structure at a confluence of a reservoir and tributary carrying high sediment loads was investigated computationally using a coupled 2D double layer-averaged model (Cao et al., 2015). The following conclusions are drawn from the numerical results for laboratory-scale confluences and a field porotype-scale case concerning the Guxian Reservoir on the Middle Yellow River, China.
At a reservoir-tributary confluence, four primary patterns of vertically layered flow structure at such confluences are identified (Table 3). Vertically layered flow structures at such confluences are primarily controlled by the interaction between hydro-sediment factors in both the main channel and tributary:
(i) Formation of SL MCSF—SL TRSF and SL MCSF—DL TRCW mainly depends on whether the tributary flow could intrude into the main channel sediment-laden flow.
(ii) Formation of DL MCSF—SL TRSF and DL MCSF—DL TRSF primarily depends on whether the tributary sediment-laden flow could block the main channel upper clear-water flow or if the tributary flow is highly concentrated.
(iii) Formation of DL MCSF—DL TRCW and DL MCCW—DL TRSF mainly depends on whether the main channel turbidity current could intrude into the tributary clear-water flow or the other way around.
In response to unsteady discharge and sediment inputs from upstream, the vertically layered flow structure at such a reservoir-tributary confluence evolves in time. Yet it remains to fall into one of the primary patterns identified. Concurrent bed aggradation may considerably modify the confluent flow, yet the vertically layered flow pattern remains unchanged so far as the computational cases at both laboratory- and prototype scales considered herein are concerned.
The present study is limited to the vertically layered flow structure at the confluence of a reservoir and tributary carrying high sediment loads. The findings have implications for sediment transport and morphological evolution at river confluences, for which further investigations are warranted in order to facilitate optimization of reservoir operation schemes to mitigate sedimentation and accordingly alleviate capacity loss.
Data availability statement
The original contributions presented in the study are included in the article/Supplementary Material, further inquiries can be directed to the corresponding author.
Author contributions
YS: Methodology, Investigation, Writing—Original Draft. JL: Methodology, Investigation, Writing—Original Draft. ZC*: Resources, Methodology, Investigation, Writing—Review and Editing. AB: Writing—Review and Editing.
Funding
This work has been funded by the National Natural Science Foundation of China under Grant No. 12072244.
Conflict of interest
The authors declare that the research was conducted in the absence of any commercial or financial relationships that could be construed as a potential conflict of interest.
Publisher’s note
All claims expressed in this article are solely those of the authors and do not necessarily represent those of their affiliated organizations, or those of the publisher, the editors and the reviewers. Any product that may be evaluated in this article, or claim that may be made by its manufacturer, is not guaranteed or endorsed by the publisher.
Supplementary material
The Supplementary Material for this article can be found online at: https://www.frontiersin.org/articles/10.3389/feart.2022.924005/full#supplementary-material
References
An, S., and Julien, P. Y. (2014). Three-dimensional modeling of turbid density currents in Imha Reservoir, South Korea. J. Hydraul. Eng. 140 (5), 5014004. doi:10.1061/(ASCE)HY.1943-7900.0000851
Armanini, A. (2013). Granular flows driven by gravity. J. Hydraulic Res. 51 (2), 111–120. doi:10.1080/00221686.2013.788080
Best, J. L. (1987). Flow dynamics at river channel confluences: Implications for sediment transport and bed morphology. Recent Dev. Fluvial Sedimentology 39 (5), 27–35. doi:10.2110/pec.87.39.0027
Best, J. L. (1988). Sediment transport and bed morphology at river channel confluences. Sedimentology 35 (3), 481–498. doi:10.1111/j.1365-3091.1988.tb00999.x
Biron, P. M., Ramamurthy, A. S., and Han, S. (2004). Three-dimensional numerical modeling of mixing at river confluences. J. Hydraul. Eng. 130 (3), 243–253. doi:10.1061/(asce)0733-9429(2004)130:3(243)
Biron, P. M., Richer, A., Kirkbride, A. D., Roy, A. G., and Han, S. (2002). Spatial patterns of water surface topography at a river confluence. Earth Surf. Process. Landf. 27 (9), 913–928. doi:10.1002/esp.359
Bonnecaze, R. T., Hallworth, M. A., Huppert, H. E., and Lister, J. R. (1995). Axisymmetric particle-driven gravity currents. J. Fluid Mech. 294, 93–121. doi:10.1017/S0022112095002825
Bradbrook, K. F., Lane, S. N., Richards, K. S., Biron, P. M., and Roy, A. G. (2001). Role of bed discordance at asymmetrical river confluences. J. Hydraul. Eng. 127 (5), 351–368. doi:10.1061/(asce)0733-9429(2001)127:5(351)
Cantero-Chinchilla, F. N., Dey, S., Castro Orgaz, O., and Ali, S. Z. (2015). Hydrodynamic analysis of fully developed turbidity currents over plane beds based on self‐preserving velocity and concentration distributions. J. Geophys. Res. Earth Surf. 120 (10), 2176–2199. doi:10.1002/2015JF003685
Cao, Z. X., Li, J., Pender, G., and Liu, Q. Q. (2015). Whole-process modeling of reservoir turbidity currents by a double layer-averaged model. J. Hydraul. Eng. 141 (2), 4014069. doi:10.1061/(ASCE)HY.1943-7900.0000951
Constantinescu, G., Miyawaki, S., Rhoads, B., and Sukhodolov, A. (2012). Numerical analysis of the effect of momentum ratio on the dynamics and sediment-entrainment capacity of coherent flow structures at a stream confluence. J. Geophys. Res. 117, F4028. doi:10.1029/2012JF002452
Dai, A., and Garcia, M. (2009). Analysis of plunging phenomena. J. Hydraulic Res. 47 (5), 638–642. doi:10.3826/jhr.2009.3498
Fan, J. H. (2011). Density currents and sedimentation engineering: Experiments and design. Beijing, China: China Water & Power Press. (in Chinese).
Ford, D. E., and Johnson, M. C. (1983). An assessment of reservoir density currents and inflow processes. Vicksburg, MS: E-83-7. US Army Corps of Engineers Waterways Experiment Station.
Georgoulas, A. N., Angelidis, P. B., Panagiotidis, T. G., and Kotsovinos, N. E. (2010). 3D numerical modelling of turbidity currents. Environ. Fluid Mech. (Dordr). 10 (6), 603–635. doi:10.1007/s10652-010-9182-z
Ghobadian, R., and Bajestan, M. S. (2007). Investigation of sediment patterns at river confluence. J. Appl. Sci. 7 (10), 1372–1380. doi:10.3923/jas.2007.1372.1380
Herrero, H., Díaz Lozada, J. M., García, C. M., Szupiany, R., Best, J., and Pagot, M. (2017). The influence of tributary flow density differences on the hydrodynamic behavior of a confluent meander bend and implications for flow mixing. Geomorphology 304, 99–112. doi:10.1016/j.geomorph.2017.12.025
Hu, P., Cao, Z. X., Pender, G., and Tan, G. M. (2012). Numerical modelling of turbidity currents in the Xiaolangdi Reservoir, Yellow River, China. J. Hydrology 464-465, 41–53. doi:10.1016/j.jhydrol.2012.06.032
Hu, P., Lei, Y. L., Han, J. J., Cao, Z. X., Liu, H. H., He, Z. G., et al. (2019). Improved local time step for 2D shallow-water modeling based on unstructured grids. J. Hydraul. Eng. 145 (12), 6019017. doi:10.1061/(ASCE)HY.1943-7900.0001642
Lai, Y. G., Huang, J., and Wu, K. (2015). Reservoir turbidity current modeling with a two-dimensional layer-averaged model. J. Hydraul. Eng. 141 (12), 4015029. doi:10.1061/(ASCE)HY.1943-7900.0001041
Lee, H. Y., and Yu, W. S. (1997). Experimental study of reservoir turbidity current. J. Hydraul. Eng. 123 (6), 520–528. doi:10.1061/(asce)0733-9429(1997)123:6(520)
Li, J., Cao, Z. X., Cui, Y., and Borthwick, A. G. L. (2020). barrier lake formation due to landslide impacting a river: A numerical study using a double layer-averaged two-phase flow model. Appl. Math. Model. 80, 574–601. doi:10.1016/j.apm.2019.11.031
Li, J., Cao, Z. X., Cui, Y., Fan, X., Yang, W. J., Huang, W., et al. (2021). Hydro-sediment-morphodynamic processes of the baige landslide-induced barrier Lake, Jinsha River, China. J. Hydrology 596, 126134. doi:10.1016/j.jhydrol.2021.126134
Li, J., Cao, Z. X., and Liu, Q. Q. (2019). Waves and sediment transport due to granular landslides impacting reservoirs. Water Resour. Res. 55 (1), 495–518. doi:10.1029/2018WR023191
Li, J., Cao, Z. X., Pender, G., and Liu, Q. Q. (2013). A double layer-averaged model for dam-break flows over mobile bed. J. Hydraulic Res. 51 (5), 518–534. doi:10.1080/00221686.2013.812047
Li, Y., Zhang, J., and Ma, H. (2011). Analytical Froude number solution for reservoir density inflows. J. Hydraulic Res. 49 (5), 693–696. doi:10.1080/00221686.2011.593905
Liang, Q., and Borthwick, A. G. L. (2009). Adaptive quadtree simulation of shallow flows with wet-dry fronts over complex topography. Comput. Fluids 32 (2), 221–234. doi:10.1016/j.compfluid.2008.02.008
Liang, Q., Zang, J., Borthwick, A. G. L., and Taylor, P. H. (2007). Shallow flow simulation on dynamically adaptive cut cell quadtree grids. Int. J. Numer. Methods Fluids 53 (12), 1777–1799. doi:10.1002/fld.1363
Lyubimova, T., Lepikhin, A., Konovalov, V., Parshakova, Y., and Tiunov, A. (2014). Formation of the density currents in the zone of confluence of two rivers. J. Hydrology 508 (1), 328–342. doi:10.1016/j.jhydrol.2013.10.041
Mosley, M. P. (1976). An experimental study of channel confluences. J. Geol. 84 (5), 535–562. doi:10.1086/628230
Ni, Y. F., Cao, Z. X., Liu, Q., and Liu, Q. Q. (2020). A 2D hydrodynamic model for shallow water flows with significant infiltration losses. Hydrol. Process. 34 (10), 2263–2280. doi:10.1002/hyp.13722
Parker, G., Fukushima, Y., and Pantin, H. M. (1986). Self-accelerating turbidity currents. J. Fluid Mech. 171 (3), 145–181. doi:10.1017/S0022112086001404
Parsons, D. R., Best, J. L., Lane, S. N., Orfeo, O., Hardy, R. J., and Kostaschuk, R. (2007). Form roughness and the absence of secondary flow in a large confluence-diffluence, Rio Parana, Argentina. Earth Surf. Process. Landf. 32 (1), 155–162. doi:10.1002/esp.1457
Ramón, C. L., Hoyer, A. B., Armengol, J., Dolz, J., and Rueda, F. J. (2013). Mixing and circulation at the confluence of two rivers entering a meandering reservoir. Water Resour. Res. 49 (3), 1429–1445. doi:10.1002/wrcr.20131
Rhoads, B. L., and Johnson, K. K. (2018). Three-dimensional flow structure, morphodynamics, suspended sediment, and thermal mixing at an asymmetrical river confluence of a straight tributary and curving main channel. Geomorphology 323, 51–69. doi:10.1016/j.geomorph.2018.09.009
Rhoads, B. L., and Sukhodolov, A. N. (2001). Field investigation of three-dimensional flow structure at stream confluences: 1. Thermal mixing and time-averaged velocities. Water Resour. Res. 37 (9), 2393–2410. doi:10.1029/2001WR000316
Ribeiro, M. L., Blanckaert, K., Roy, A. G., and Schleiss, A. J. (2012). Flow and sediment dynamics in channel confluences. J. Geophys. Res. 117, F1035. doi:10.1029/2011JF002171
Riley, J. D., and Rhoads, B. L. (2012). Flow structure and channel morphology at a natural confluent meander bend. Geomorphology 163-164, 84–98. doi:10.1016/j.geomorph.2011.06.011
Sambrook Smith, G. H., Nicholas, A. P., Best, J. L., Bull, J. M., Dixon, S. J., Goodbred, S., et al. (2019). The sedimentology of river confluences. Sedimentology 66 (2), 391–407. doi:10.1111/sed.12504
Sukhodolov, A. N., and Rhoads, B. L. (2001). Field investigation of three-dimensional flow structure at stream confluences: 2. Turbulence. Water Resour. Res. 37 (9), 2411–2424. doi:10.1029/2001WR000317
Szupiany, R. N., Amsler, M. L., Parsons, D. R., and Best, J. L. (2009). Morphology, flow structure, and suspended bed sediment transport at two large braid-bar confluences. Water Resour. Res. 45, W05415. doi:10.1029/2008WR007428
Taylor, E. H. (1944). Flow characteristics at rectangular open-channel junctions. Trans. Am. Soc. Civ. Eng. 109 (1), 893–902. doi:10.1061/TACEAT.0005772
Wang, T., Wang, Y. J., Ma, H. B., Li, T., Ren, Z. H., and Wang, Z. L. (2020). Experimental study on flow and sediment evolution characteristics in conjunction area after confluence of density current at reservoir tributary. Yellow River 42 (5), 56–61. (in Chinese). doi:10.3969/j.issn.1000-1379.2020.05.011
Wang, Z., Xia, J., Li, T., Deng, S., and Zhang, J. (2016). An integrated model coupling open-channel flow, turbidity current and flow exchanges between main river and tributaries in Xiaolangdi Reservoir, China. J. Hydrology 543, 548–561. doi:10.1016/j.jhydrol.2016.10.023
Wang, Z., Xia, J., Zhou, M., and Li, T. (2019). Numerical modeling of hyperconcentrated confluent floods from the Middle Yellow and Lower Weihe Rivers. Water Resour. Res. 55 (3), 1972–1987. doi:10.1029/2018WR024152
Webber, N. B., and Greated, C. A. (1966). An investigation of flow behaviour at the junction of rectangular channels. Proc. Institution Civ. Eng. 34 (3), 321–334. doi:10.1680/iicep.1966.8925
Weber, L. J., Schumate, E. D., and Mawer, N. (2001). Experiments on flow at a 90° open-channel junction. J. Hydraul. Eng. 127 (5), 340–350. doi:10.1061/(asce)0733-9429(2001)127:5(340)
Xia, C. C. (2019). Coupled mathematical modelling of shallow water flow and substance transport in open channels. Wuhan, China: Wuhan University. (in Chinese).
Yang, Q. Y., Lu, W. Z., Zhou, S. F., and Wang, X. K. (2014). Impact of dissipation and dispersion terms on simulations of open-channel confluence flow using two-dimensional depth-averaged model. Hydrol. Process. 28 (8), 3230–3240. doi:10.1002/hyp.9881
Yuan, S. Y., Tang, H. W., Li, K., Xu, L., Xiao, Y., Gualtieri, C., et al. (2021). Hydrodynamics, sediment transport and morphological features at the confluence between the Yangtze River and the Poyang Lake. Water Resour. Res. 57, e2020WR028284. doi:10.1029/2020WR028284
Yuan, S. Y., Tang, H. W., Xiao, Y., Qiu, X. H., and Xia, Y. (2018). Water flow and sediment transport at open-channel confluences: An experimental study. J. Hydraulic Res. 56 (3), 333–350. doi:10.1080/00221686.2017.1354932
Zhang, R. J., and Xie, J. H. (1993). Sedimentation research in China: Systematic selections. Beijing, China: China Water & Power Press. (in Chinese).
Zhang, T., Feng, M. Q., and Chen, K. L. (2020). Hydrodynamic characteristics and channel morphodynamics at a large asymmetrical confluence with a high sediment-load main channel. Geomorphology 356, 107066. doi:10.1016/j.geomorph.2020.107066
Zhang, Y. F., and Wang, P. (2017). Deposition pattern and morphological process at hyperconcentrated flow confluences in upper Yellow River. J. Hydroelectr. Eng. 36 (12), 39–48. (in Chinese). doi:10.11660/slfdxb.20171205
Keywords: reservoir, river confluence, turbidity current, vertically layered flow structure, Yellow River
Citation: Sun Y, Li J, Cao Z and Borthwick AGL (2022) Vertically layered flow structure at confluence of a reservoir and tributary carrying high sediment loads. Front. Earth Sci. 10:924005. doi: 10.3389/feart.2022.924005
Received: 21 April 2022; Accepted: 25 July 2022;
Published: 26 August 2022.
Edited by:
Hajime Naruse, Kyoto University, JapanCopyright © 2022 Sun, Li, Cao and Borthwick. This is an open-access article distributed under the terms of the Creative Commons Attribution License (CC BY). The use, distribution or reproduction in other forums is permitted, provided the original author(s) and the copyright owner(s) are credited and that the original publication in this journal is cited, in accordance with accepted academic practice. No use, distribution or reproduction is permitted which does not comply with these terms.
*Correspondence: Zhixian Cao, zxcao@whu.edu.cn