Article

Coproducing Weather Forecast Information with and for Smallholder Farmers in Ghana: Evaluation and Design Principles

by
Talardia Gbangou
1,*,
Rebecca Sarku
2,
Erik Van Slobbe
1,
Fulco Ludwig
1,
Gordana Kranjac-Berisavljevic
3 and
Spyridon Paparrizos
1
1
Water Systems and Global Change Group, Wageningen University & Research, P.O. Box 47, 6700 AA Wageningen, The Netherlands
2
Public Administration and Policy, Wageningen University and Research, P.O. Box 8130, 6700 EW Wageningen, The Netherlands
3
Department of Agricultural Mechanization and Irrigation Technology, University for Development Studies, Tamale 1350 TL, Ghana
*
Author to whom correspondence should be addressed.
Atmosphere 2020, 11(9), 902; https://doi.org/10.3390/atmos11090902
Submission received: 16 July 2020 / Revised: 14 August 2020 / Accepted: 14 August 2020 / Published: 25 August 2020

Abstract

:
Many West African farmers are struggling to cope with changing weather and climatic conditions. This situation limits farmers’ ability to make optimal decisions for food and income security. Developing more useful and accessible weather and climate information services (WCIS) can help small-scale farmers improve their adaptive capacity. The literature suggests that such WCIS can be achieved if forecast information is produced jointly by farmers and scientists. To test this hypothesis and derive design requirements for effective WCIS, we evaluated the outcomes of an experimental coproduction of weather forecasts in Ada, Ghana. The experiment involved a user-driven design and testing of information and communications technology (ICT)-based digital (smartphones and apps) and rainfall monitoring tools by 22 farmers. They collected data and received weather forecasts during the 2018/2019 study period. The results showed a positive evaluation of the intervention, expressed by the level of engagement, the increase in usability of the tools and understanding of forecast uncertainty, outreach capacity with other farmers, and improved daily farming decisions. The success of the intervention was attributed to the iterative design process, as well as the training, monitoring, and technical support provided. We conclude that the application of modern technology in a coproduction process with targeted training and monitoring can improve smallholder farmers’ access to and use of weather and climate forecast information.

1. Introduction

Agriculture is a key source of food and income security in many sub-Saharan African countries [1,2]. However, the sector is heavily impacted by climate variability and change [3,4,5]. Future projections suggest significant risks to agriculture, even if global warming remains below the limits set by the Paris Agreement [3,6]. Moreover, people involved in different agricultural water use systems throughout sub-Saharan Africa are unevenly impacted by climate variability and change [7,8].
Climate variability and change prompted increased demand for early warning systems for weather and climate risks, especially in developing countries, where the climate is already highly variable and threatens food security, and where adaptation capacities are low [3,9,10]. In West African countries like Ghana, where crop production depends largely on smallholder farming and rainwater, the need for better weather and climate information systems is significant [3,10,11,12,13]. Although much effort is made by governments and other organizations to provide such information services to farmers and water managers, the resulting systems are often of limited usefulness for local smallholders [3,14]. This is because many smallholder farmers in Africa need information to be more tailored to their specific needs [15,16,17]. Among the climate information services currently available to West African farmers, the majority are hampered by information irrelevance, incompleteness, uncertainty, and the lack of user training for a better understanding of the required technology [3,13]. Hence, the design of information systems needs not only to be based on the provider’s ideas and principles but also to integrate local farmers’ needs and knowledge in a user-driven design approach [14,18,19].
The coproduction of information systems is a potential strategy for attaining adequate interaction between information producers and users, as well as to foster knowledge sharing [20,21]. Regarding weather and climate information systems, coproduction is increasingly recognized as a potential path to success, with several positive outcomes already documented [14,16,22]. The current study uses the term “coproduction” to refer to participatory engagement between researchers and a group of farmers and extension agents in the design of tools and the production of weather data and forecasts [23]. By definition, the coproduction process is built according to user engagement and needs and, thus, can facilitate the development of and access to climate services, i.e., the production, translation, and use of weather and climate information in a way that assists users in terms of decision-making and policy planning [24,25]. Such services are crucial for smallholder farmers, who are particularly vulnerable to climate variability and change because of their reliance on rainfall for farming and their limited adaptive capacity [10,26].
Interactions with local farmers in Ada East District, Ghana (Figure 1) helped to define and predict relevant, tailor-made agrometeorological indices, such as the onset of the wet season, dry spell occurrence, and total seasonal rainfall, to support farming decision-making [10,15]. Previous research undertaken as part of the Waterapps project (www.waterapps.net) in Ada found that, due to the lack of location-specific information and limited understanding of modern forecasts [3,13,16], local farmers rely mainly on traditional knowledge for farming decisions. The coproduction of forecast knowledge with and for farmers can help foster trust and increase the local uptake of scientific model-based forecasting knowledge [27]. Furthermore, collecting and integrating local or traditional knowledge with scientific data can help increase credibility and improve access [28,29]. Good local information can help to enhance usefulness and skills of model-based forecasts [28]. For instance, information about crop types, cropping calendars, and other local specific needs can be incorporated into models to derive relevant forecast information to enable adaptation to climate variability. Similarly, harnessing local forecasts can potentially be combined with the model’s forecasts to synergize the accuracy of the combined weather and climate forecast information [28,30,31]. As in many West African countries, Ghana’s current climate information services are based on long-term modeled trends and resilience planning, regional agrometeorological bulletins, and weather forecasts at grid scales that are often too coarse to be useful for location-specific predictions [5,10].
In this regard, modern digital technology offers opportunities for developing innovative climate information services. For example, information and communications technology (ICT) such as mobile phones, smartphones, apps, and the internet can serve as supportive tools at all stages of climate information service provision, including production, transfer, and use by end-users [3,16]. The ICT interface can be designed with and for farmers to facilitate effective data collection, feedback, and interaction [19]. Farmers can also be engaged as citizen scientists to monitor daily and seasonal climate observations and share these with peer farmers and scientists [32,33,34,35]. Despite the overall limited use of ICT by local communities [36], there is evidence of a rapidly increasing digital literacy that indicates promise for ICT adoption in West Africa, particularly in Ghana [37,38,39]. The coproduction of weather and climate information services (WCIS) using digital tools could be an important means to enhance adaptive capacity and resilience of smallholder farmers in the face of climate variability. Nonetheless, there is limited practical evidence on smallholder farmers’ use of ICT-based technology in coproduction processes in West Africa [3,40,41]. Practical evidence regarding the coproduction of climate information services could orient knowledge and policy to better support vulnerable smallholder farmers [13,42].
This paper reports on an ICT-based weather information service coproduction process involving farmers, extension workers, and scientists in Ada East District, Ghana (Figure 1), on the testing of the codesigned WCIS and evaluation of the experiment’s results. Based on the evaluation findings, design criteria for such services are proposed. Extracting the design principles will help improve future WCIS for smallholder farmers in Ghana and elsewhere. The current study focuses on aspects of WCIS implementation, particularly testing of design features and the associated training, monitoring, and support provided during the testing phase of the coproduction experiment.

2. Materials and Methods

This section details the methodological approach for coproduction implementation, data collection, and analysis. Figure 2 presents a general methodological flowchart, including the participants, inputs, and processes, as well as the outcomes evaluated. The various components of the figure are addressed below. Other results from the field study, for instance, regarding local forecast performance and motivations and barriers for farmer participation, are presented elsewhere [26,29] and, therefore, not included in the current paper. Similarly, before the design and testing phase, farmers’ agrometeorological information needs and local forecasting indicators were assessed under the Waterapps project. Results of those pre-surveys were discussed in Reference [29].

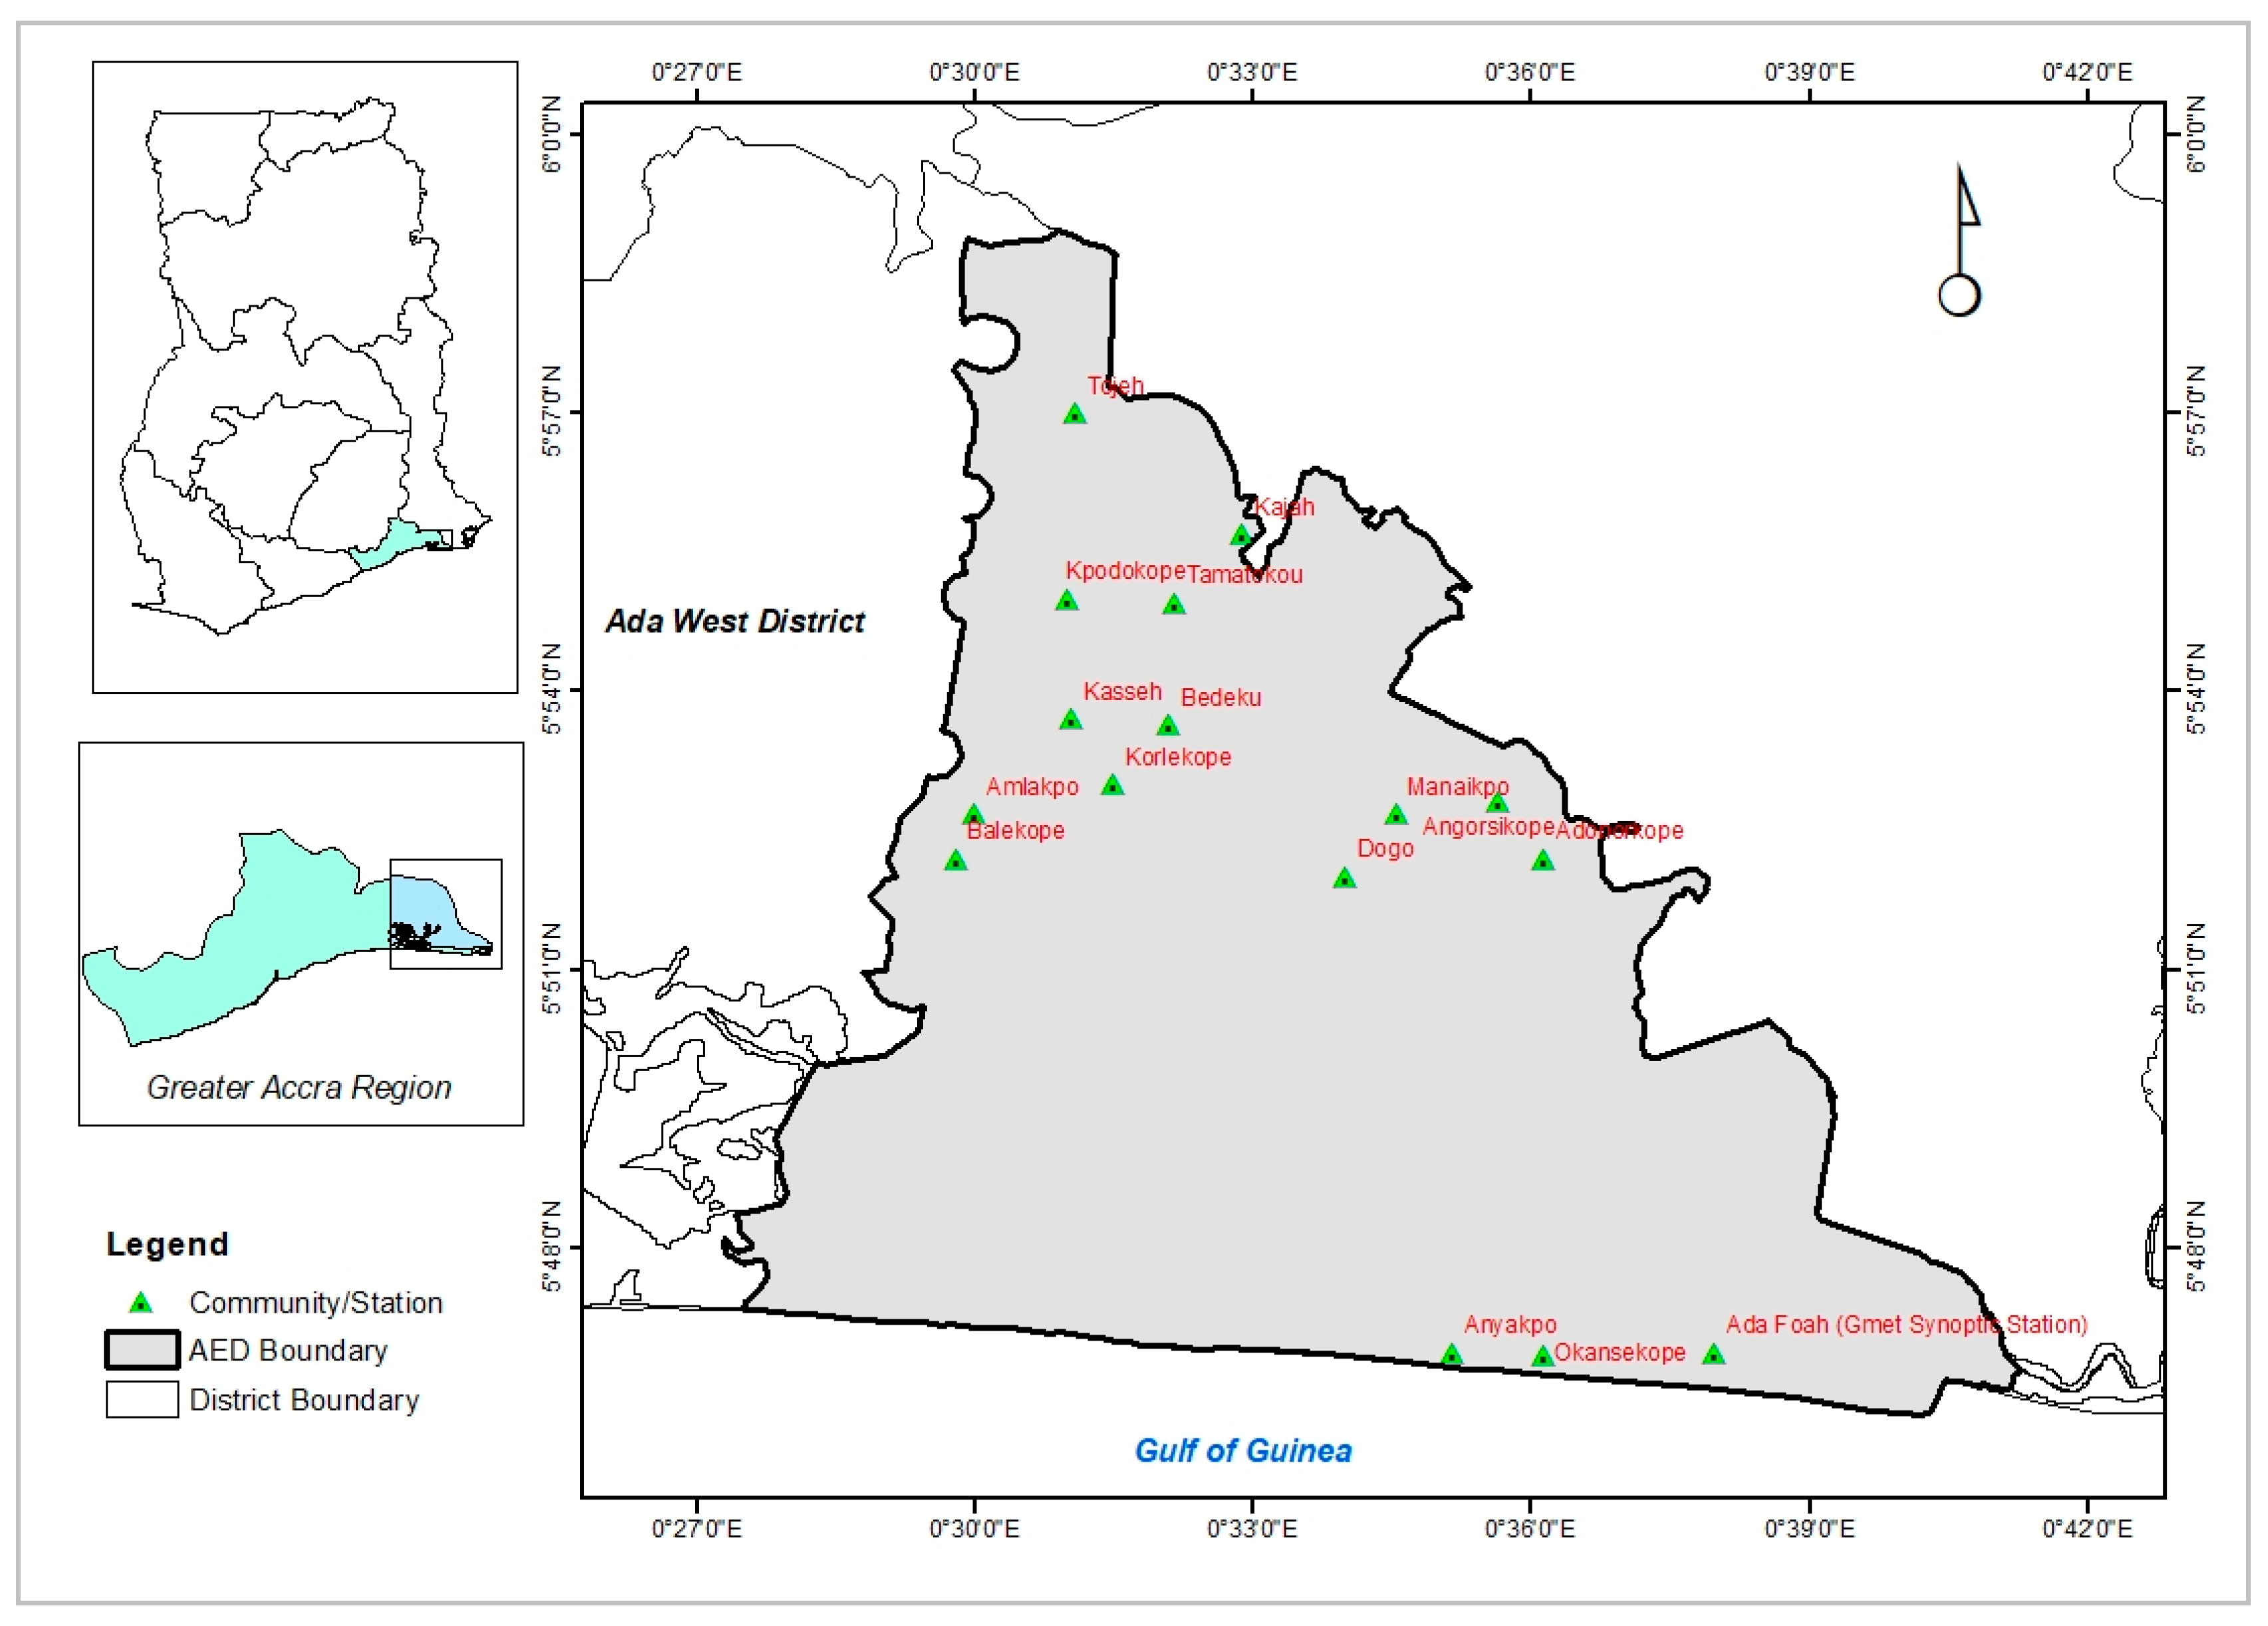
2.1. Study Area and Participants

Our study was carried out in the Ada East District (AED) of Ghana, which is a peri-urban district located in the Volta Delta, a coastal savanna subregion. The map in Figure 1 shows the location of communities with field study participants. In this region, crop growth is affected by changing climatic conditions, including greater variability in the onset date of the rainy season, more erratic total seasonal rainfall, and dry spells [10,15,43]. Unpredictable early and late onset dates and dry spell occurrence affect AED farmers’ decision-making strategies [26]. Unlike many farmers in Northern Ghana, who have access to private weather forecast services in addition to national forecasts [44,45], AED farmers only occasionally receive (mainly via radio and television (TV)) daily national weather forecasts that are given for the entire coastal region and are, thus, too coarse for location-specific farming decisions [10,46,47]. Hence, local farmers in the area are among the most vulnerable to climate variability in Ghana. Crop production in the district mainly includes cassava, pepper, rice, maize, and tomato. These products represent an important source of food for urban markets, especially in nearby major cities like Accra and Tema in Ghana, as well as Lomé in Togo. The district’s proximity to urban areas also suggests a potential for adoption of ICT-based digital technology by farmers. Developing location-specific, tailored ICT-based forecast information services could help farmers improve their daily farming decisions and adaptive capacity.
Study participants were selected using a purposive sampling method based on experience with local forecasts, availability, gender, and willingness to participate. A group of 22 farmers, five agricultural extension agents, and one meteorological extension agent was selected. This was considered representative and sufficient for the experiment in WCIS codesign and testing, which took place in 2018–2019. Figure 3 presents the socio-demographic characteristics of participants, including gender, age, and education levels. In our sample there were 18 male and four female farmers. Participant ages ranged from 20 to over 60, thus including both young and older farmers. Education levels varied from no formal education to high school level, with the majority of farmers having attended middle school. Extension agents were considered key participants, as they worked with farmers in different communities and, thus, had greater outreach potential. Although the extension agents did not collect primary data, they saw, shared, and interacted with the forecasts and data collected by the farmers and scientists. The extension agents were also asked to give their opinions in evaluating the coproduction experiment.

2.2. Digital and Rainfall Monitoring Tools

Modern technology, including web-connected smartphones, mobile applications (apps), and the internet, was used to facilitate the coproduction process. We provided a smartphone with an internet data bundle from a local telecommunication company to each of the 22 participating farmers and to extension agents who did not already have one. Each phone contained (i) a weather app (http://waterapps-weatherforecast.azurewebsites.net/Account/Login) for collecting local forecast indicators and rainfall observation data, and (ii) WhatsApp (a smartphone chat app) for disseminating forecasts prepared by scientists for farmers and to enable interaction among the participants. Although this dual-app set-up was satisfactory for the coproduction experiment, future applications might seek ways to integrate data collection, dissemination, and interaction into one ICT tool. To measure daily rainfall, a total of 20 manual rain gauges were distributed to farmers from the 15 communities involved (see Figure 1). We ensured that each community had at least one rain gauge.

2.3. Data Collection and Sharing

Data collected by local farmers included daily local weather forecast indicators (see Table S1, Supplementary Materials) and daily rainfall observations (Table 1). Farmers collected these on a real-time basis, sharing them with the research team via the weather app. These data were then processed into daily forecasts (for details see [29]) and shared with all participants via the WhatsApp group. Similarly, daily scientific model-based weather forecasts (from www.meteoblue.com) were simplified and shared via the WhatsApp group. This sharing was done in real time and on a daily basis from April to July 2019.

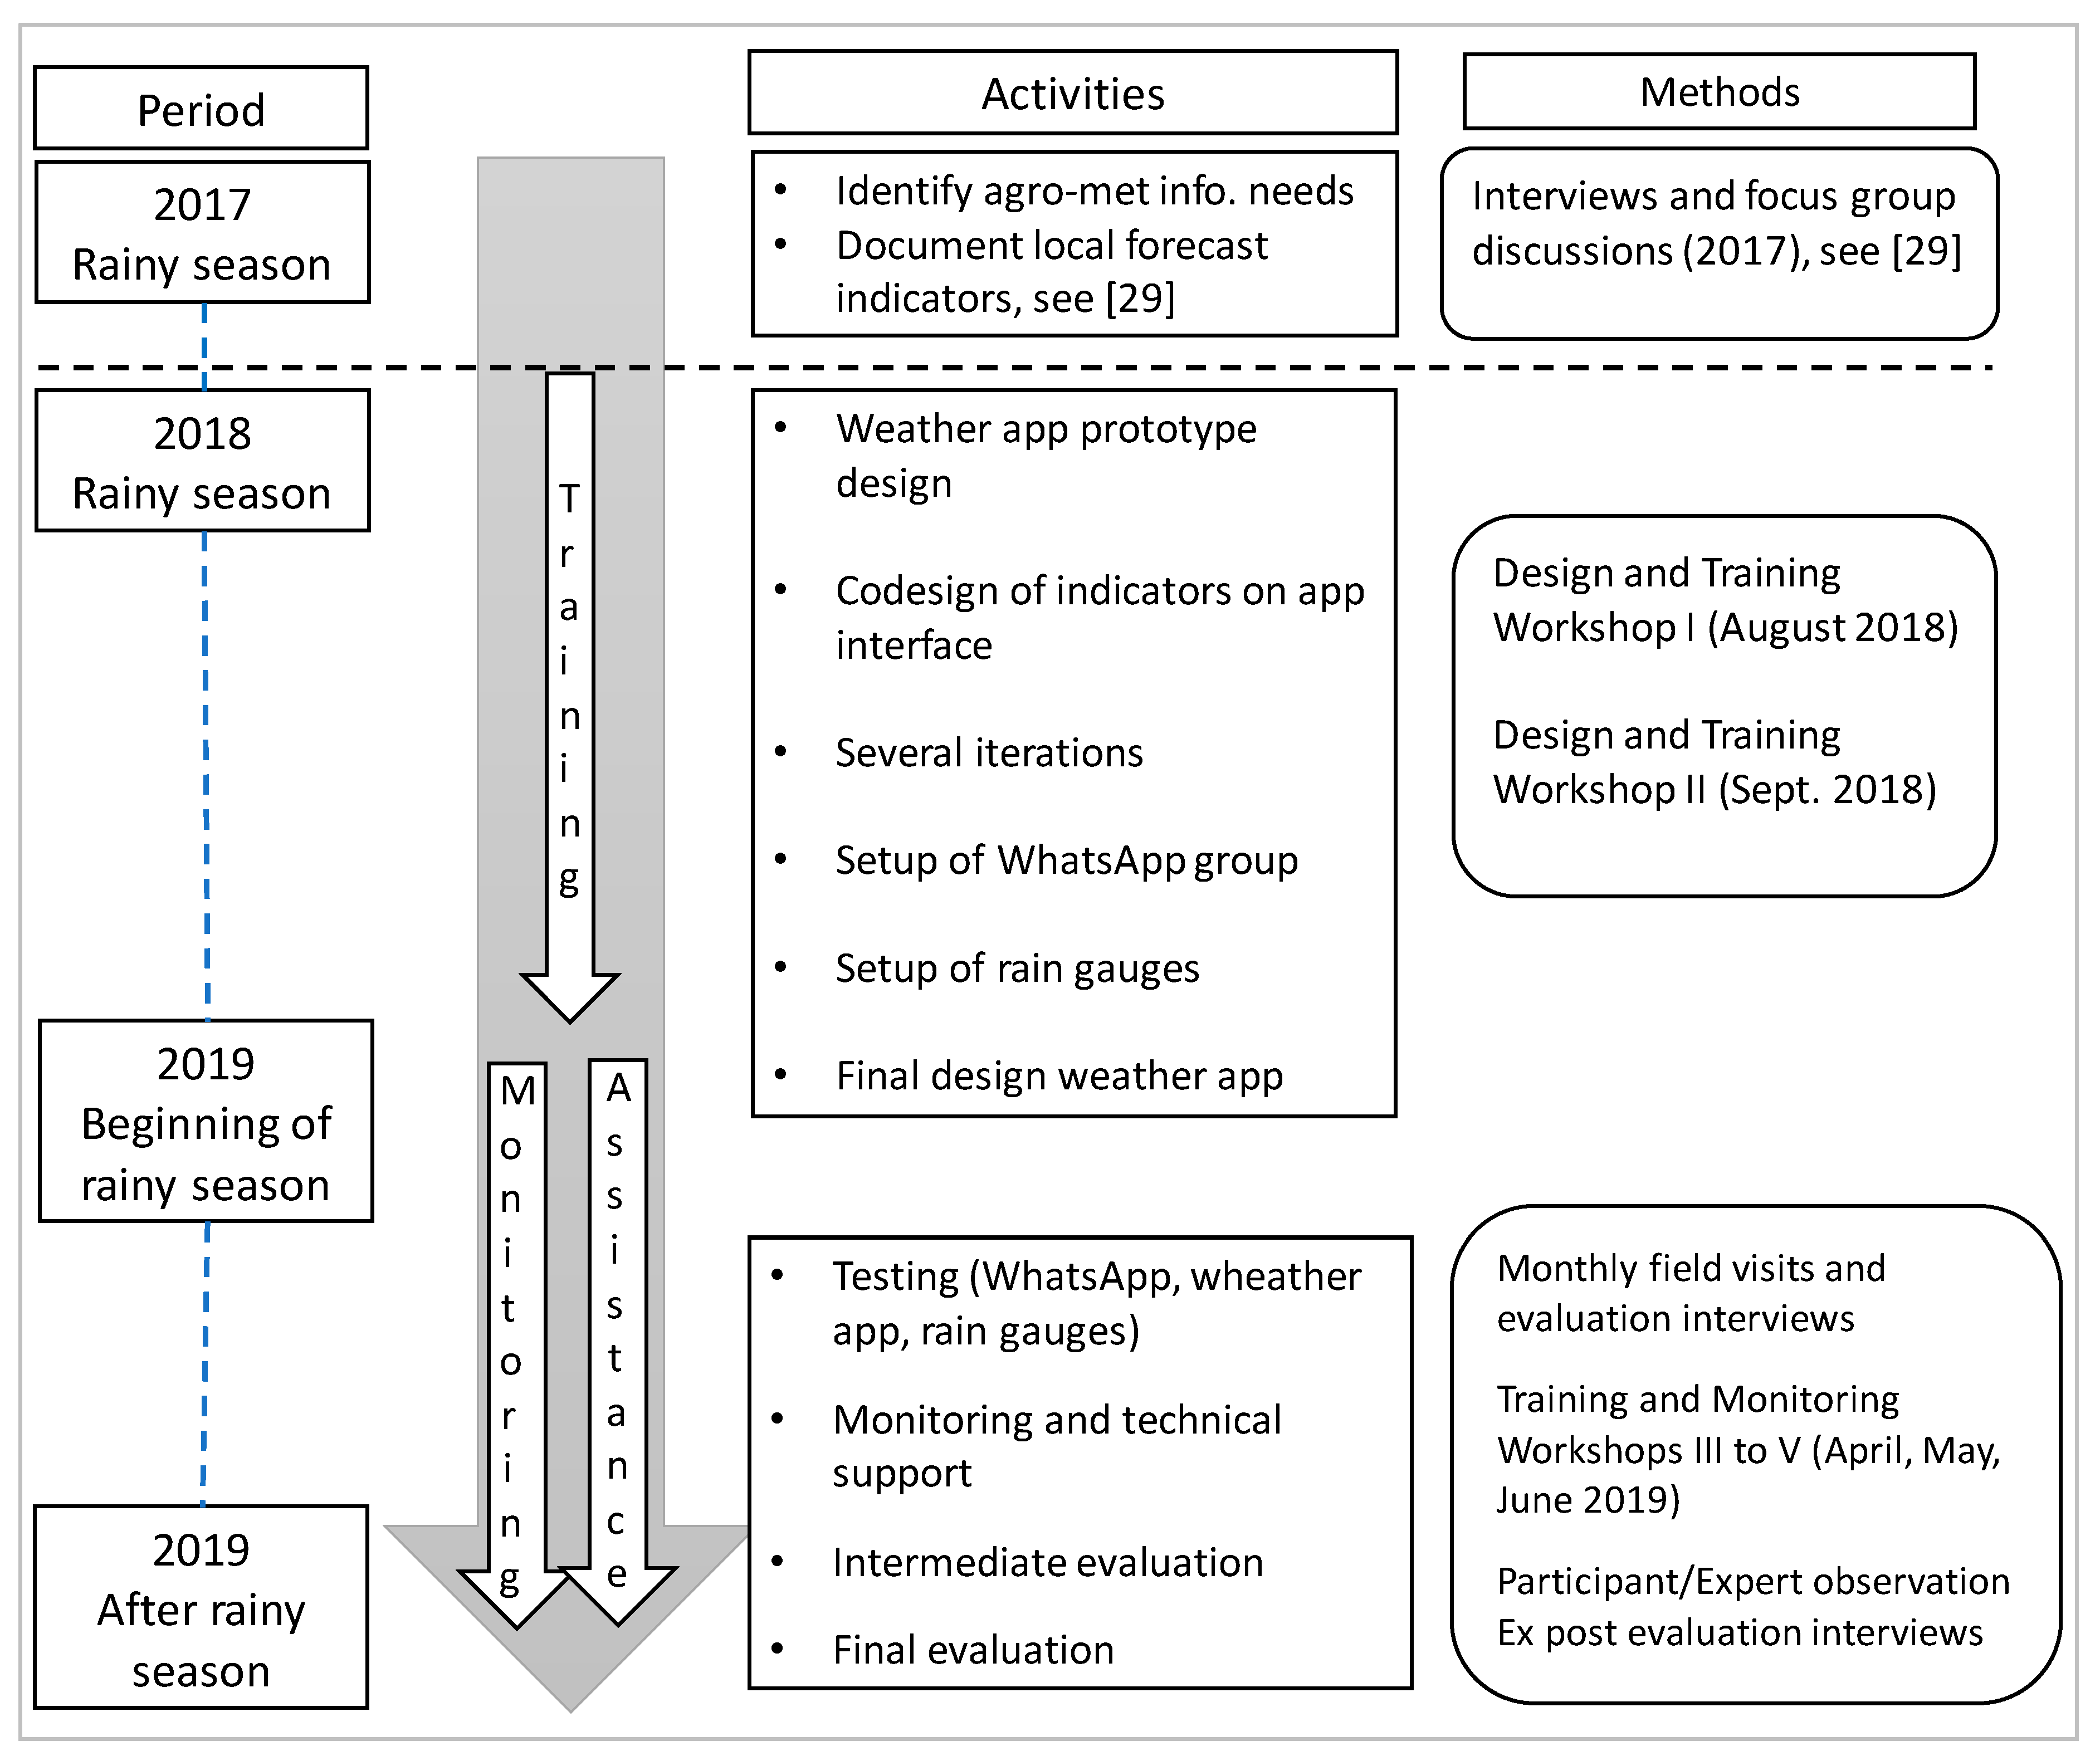
2.4. Workshops, Training, and Monitoring

Several workshop sessions were conducted to learn from farmers what forecast indicators they typically used and to codesign the digital tool interface for the weather app. This was done following a user-driven design approach [48]. Hence, the researchers learned from farmers and extension agents and, with them, jointly defined and redefined features of the apps, including visuals, symbols, texts, and format. Farmers were also trained in use of the digital tools, including the smartphones, apps, internet handling, and installation and use of the rainfall monitoring tools. They were also educated on the probabilistic nature of the forecasts shared via WhatsApp group. Throughout the four-month data collection period (April to July 2019), monitoring was carried out, including field visits with farmers. A final evaluation of the whole experiment was conducted at the end of the rainy season, in July 2019. Figure 4 summarizes the chronology, activities, and methods used. Activities carried out in the rainy season of 2017 on local agrometeorological information needs and local forecasting indicators are outside the scope of the present study (details on these can be found in Reference [29]). Nonetheless, this step is included in Figure 4 to show the flow of the project and the link to local information needs and forecasting indicators.

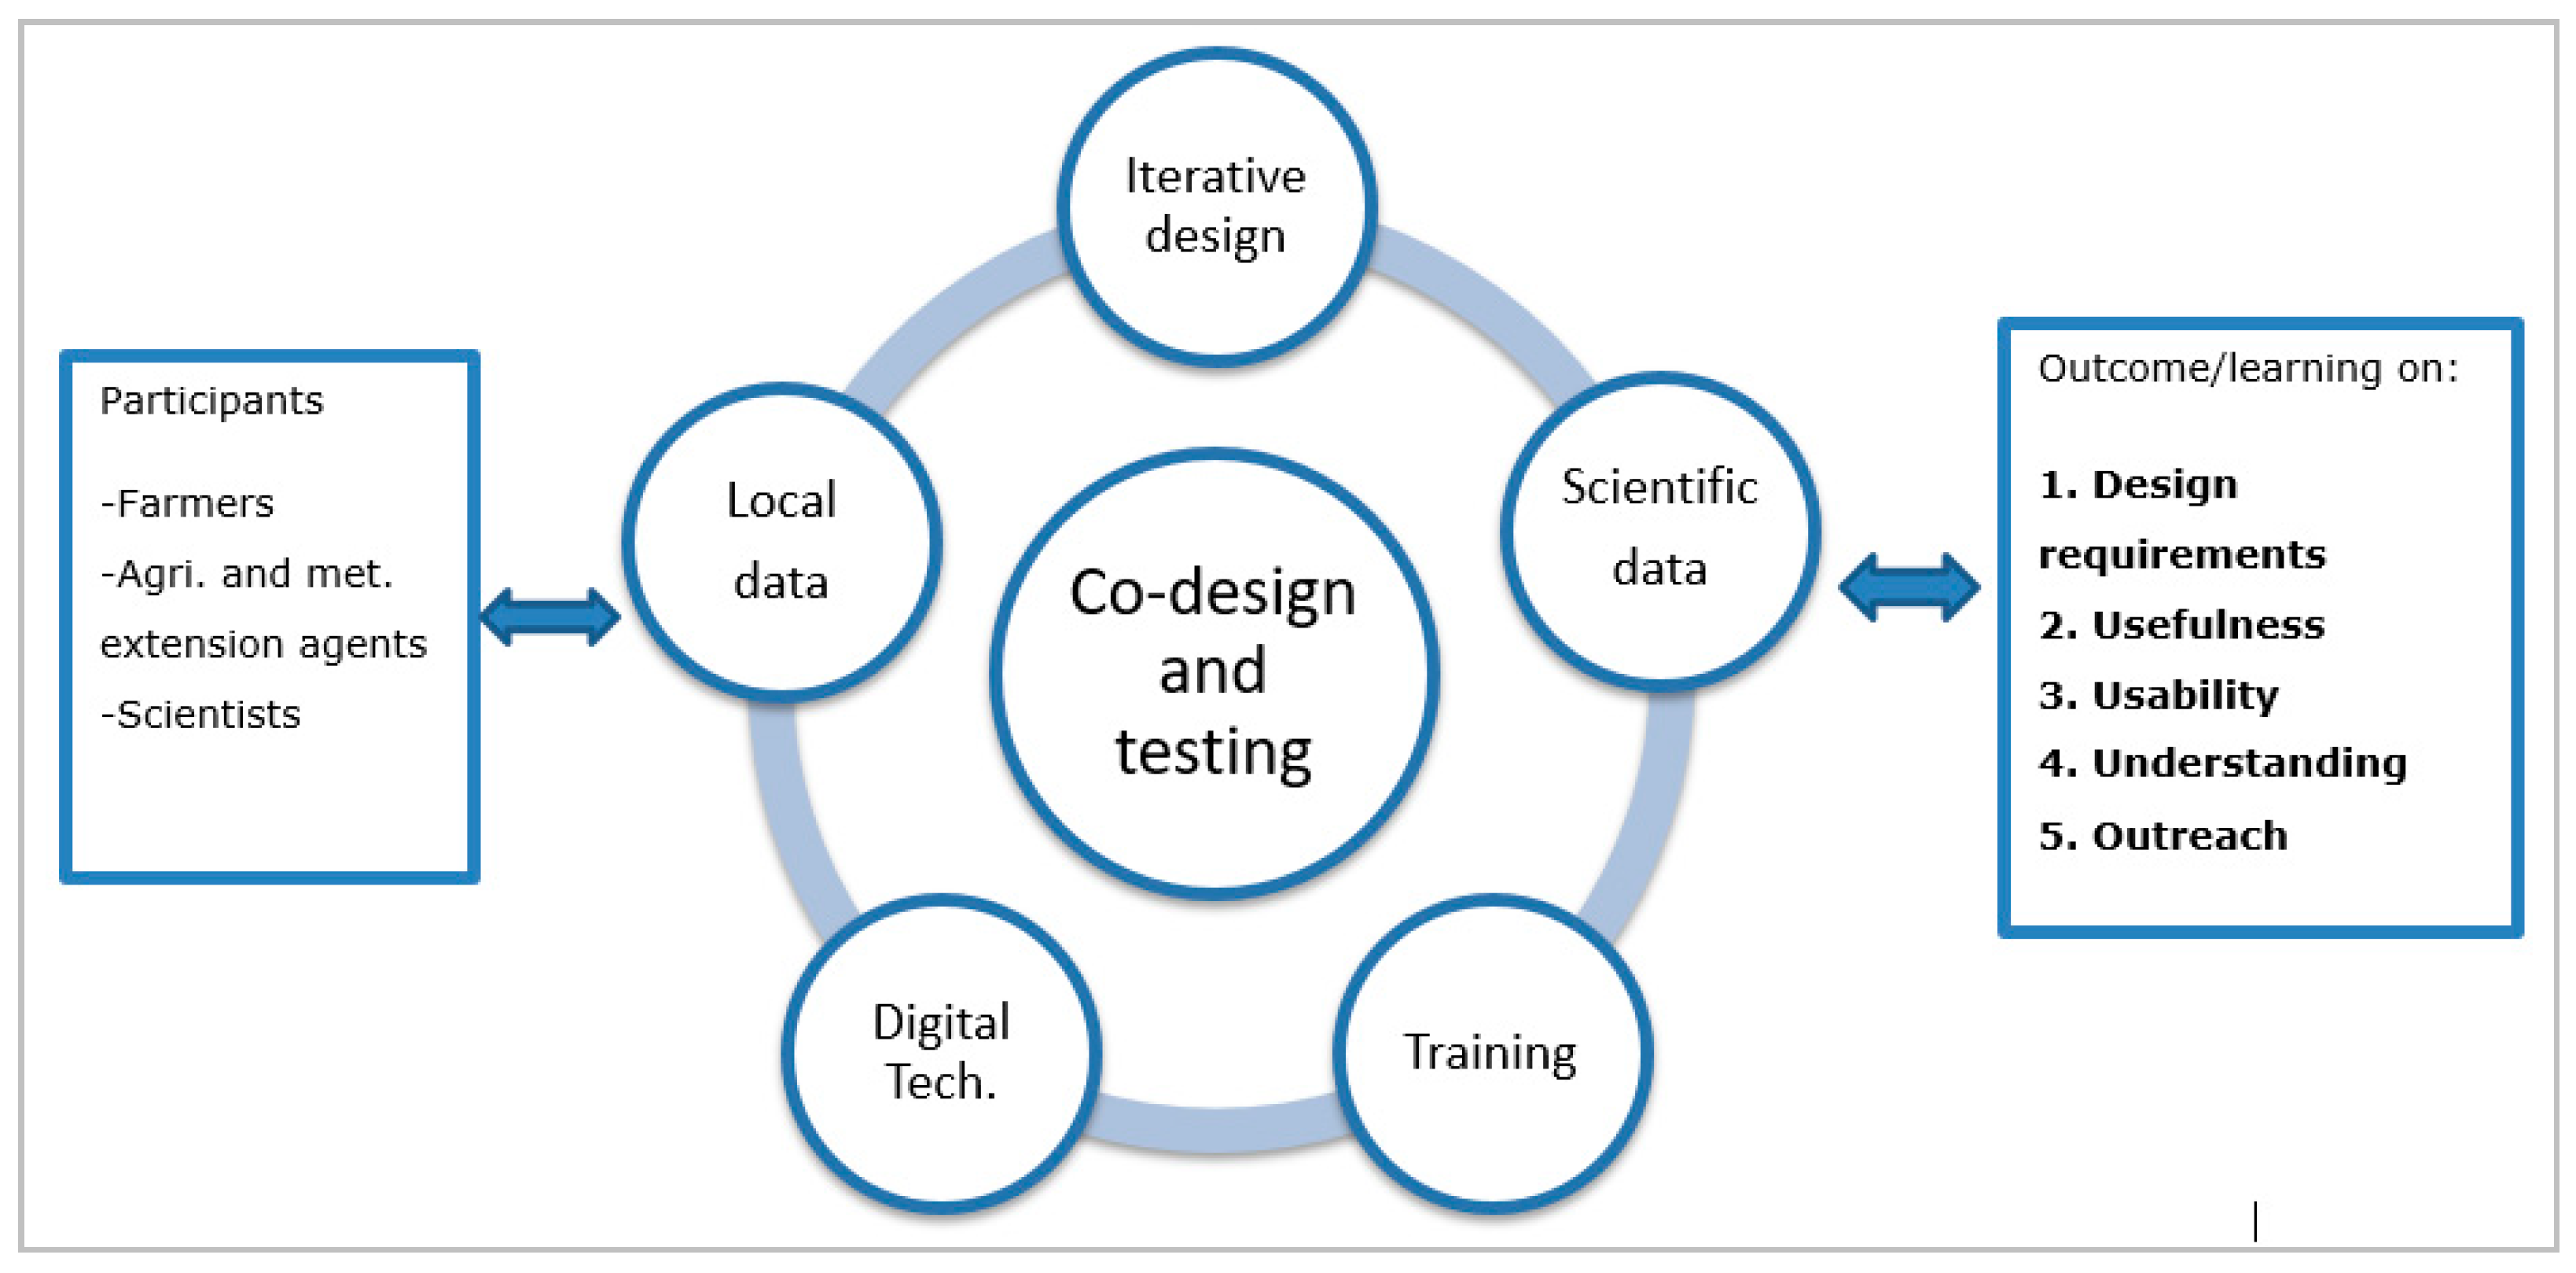
2.5. Analysis of Design and Lessons Learned

Since the aim of this study was to improve the quality and effectiveness of weather and climate information services in the study area, an ex post evaluation approach was adopted [49]. This approach was deemed suitable for the actual intervention and sought to document and analyze participants’ behavior and the impacts of climate information service delivery [13,49]. Note that the focus of the current study was on evaluating farmers’ engagement and the usability and usefulness of the weather information system introduced to them, not on examining the impacts of the intervention in terms of farming outcomes (like changes in cropping practices or yields). To determine the usability and usefulness of the WCIS and the extent to which farmers’ understanding and daily management decisions improved or changed following access to the weather and climate information, we used answers to a set of descriptive questions. These covered the ability of farmers to use the information service (i.e., its usability [50]), estimation of the potential relevance of the service for farmers (i.e., its usefulness [51]), and identification of elements of design and implementation that could lead to better outcomes (i.e., design criteria [50,51]). The evaluation questions were posed in interviews conducted with both the participating farmers and the extension agents. Considering our small sample size, a binomial distribution approach was used to test the significance of the results. Expert (participant) observation [52,53] was also applied, to better understand differences between socio-demographic groups (age, gender, and literacy) in challenges encountered by farmers during the testing phase. Based on the evaluation results and expert judgments, design principles for an effective ICT-based weather information service coproduction process were derived.

3. Results

3.1. Design Phase of the Digital and Rain Monitoring Tools

The co-development process began in 2017, with an initial exploration, by researchers, of the forecast information needs and challenges faced by Ada East District farmers in using weather and climate information [10,26]. ICT-based tools appropriate for weather and climate information sharing and rainfall monitoring were then designed with and for farmers and extension agents in 2018. Table 2 presents design features, which were iteratively adjusted and refined by participants at design workshops. The main tools used were a web-based weather app, a WhatsApp group, and rain gauges (see Figure 5 for illustration).
The weather app was designed to be user-friendly and allow for collection of local forecast observations and rainfall data from local farmers. These local observations included indicators that farmers typically paid attention to when assessing daily weather (see Reference [29]). These indicators were represented by symbols agreed upon with local farmers. The weather app also contained pictures illustrating various intensities of rainfall; these could be selected by participants (farmers) to record the amounts of rainfall observed at their locations. Each picture was complemented with a short descriptive text, as the majority of farmers could read (Figure 5a). The weather app required a login step for security purposes, although it offered the option of remembering the user’s log-in details. Its interface offered easy selection of options, scrolling, and submission of data with a confirmation message sent to verify successful data submission.
The WhatsApp mobile application was installed on participants’ smartphones, and a WhatsApp chat group was created so they could receive both local and scientific forecasts and interact with one another (Table 2). Participants received training to help them understand and interpret the probability of rainfall occurrence represented by the simple pie charts that were shared (see Figure 5b for illustration). Farmers could also write messages or use emojis to interact with other members of the WhatsApp group. Farmers unfamiliar with WhatsApp were trained in its aim and usage. Farmers were free to share their opinions on forecast quality. They could also share their rainfall data in the WhatsApp group to help others understand rainfall distribution across the district. Both apps required participants to use the mobile internet connection included in their smartphone subscription (e.g., they needed to be able to turn mobile data on and off).
Participants were also trained by a meteorological extension officer to install, read, and record rainfall data using the manual rain gauges provided (Figure 5c). Only farmers were asked to record daily rainfall at their locations, which they submitted via the weather app, the WhatsApp group, or notebook records. Farmers were asked to not only be attentive and report the rainfall amount and category (low, medium, and high; see Figure 5a) but also to note the beginning and end times of rainfall events when these occurred.
Summarizing, the coproduction tools were designed with and for farmers to be user-friendly, and consensus on design features was sought with the study participants. The design features agreed upon with farmers in 2018 were tested in real time during the rainy season of 2019, from April to July. At the end of the rainy season, in July 2019, an evaluation was carried out.

3.2. Evaluation of the Testing Phase

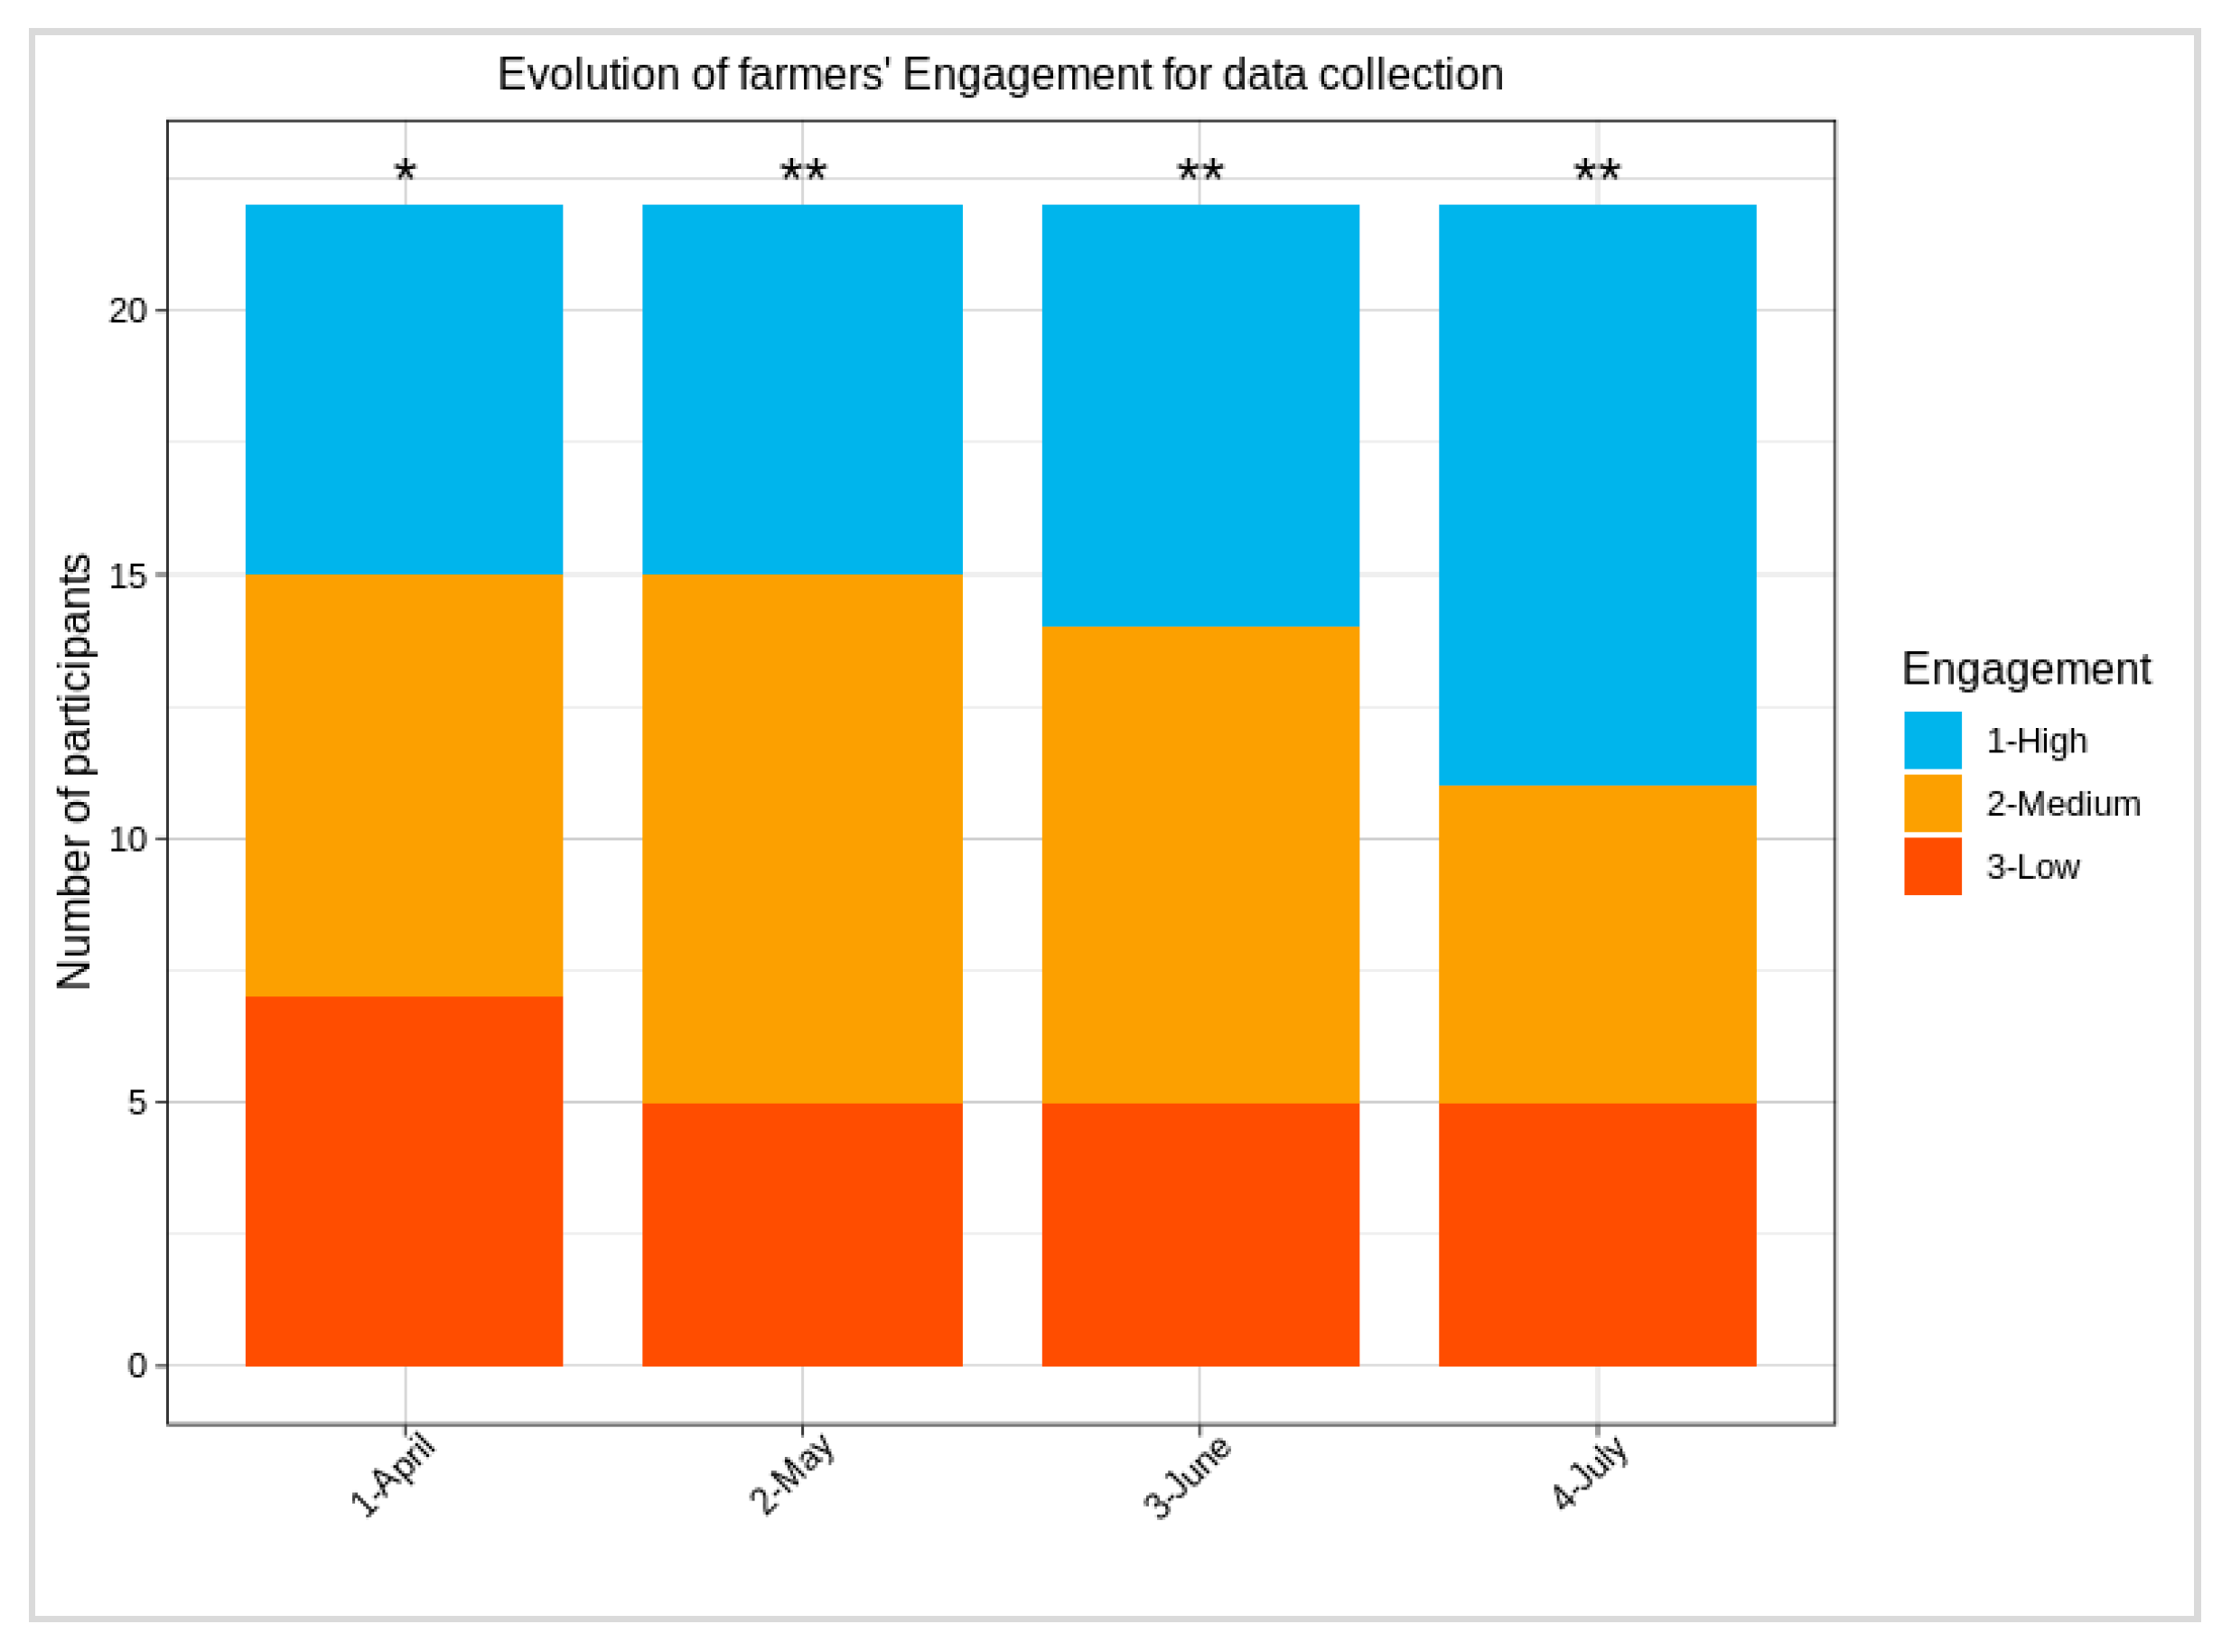
3.2.1. Participant Engagement

During the testing phase, from April to July 2019, engagement of the farmers and extension agents varied in terms of their data inputs and participation (Figure 6). Based on the frequency of data collection and interaction, we ranked engagement levels into three categories: low (<33%), medium, and high (>66%). Some 76% of farmers fell into the medium to high range during the four-month testing period. The high-level engagement category grew over time. Extension agents’ engagement remained constant over time, meaning that they were consistently active in monitoring activities, providing feedback, and sharing knowledge with farmers beyond those involved in the experiment.

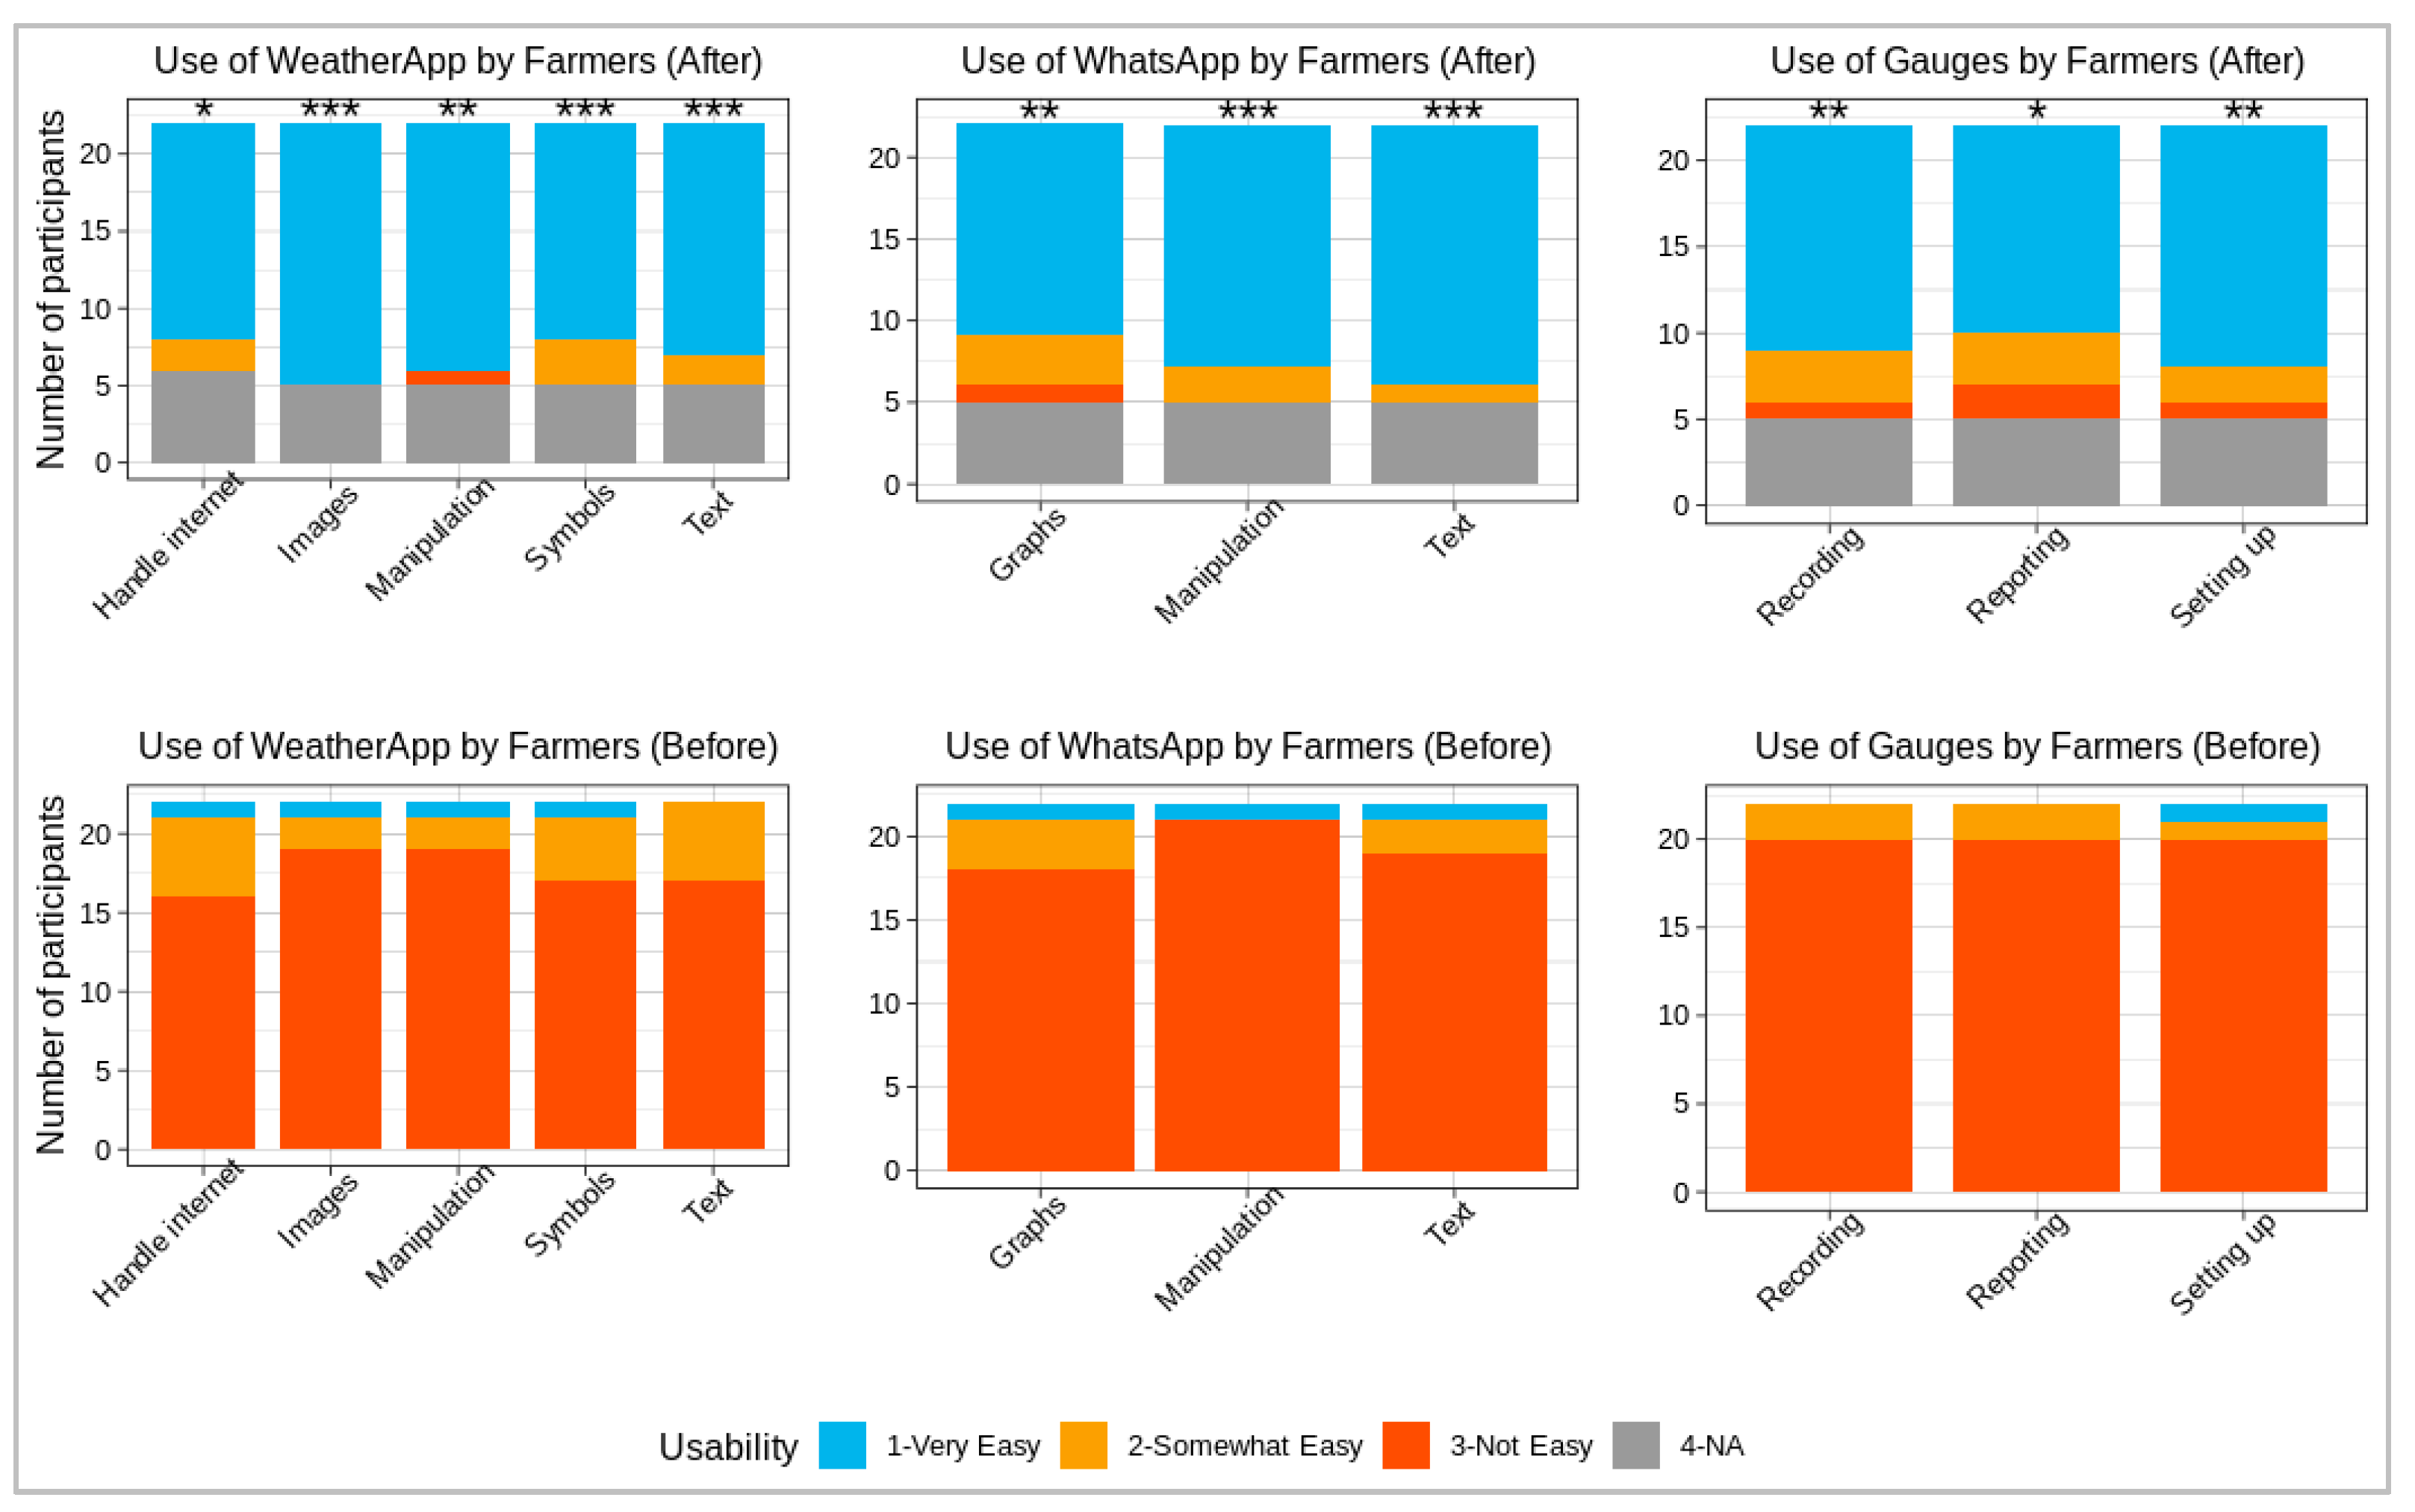
3.2.2. Usability of the Digital Technology

Farmers’ ability to use the digital and rain monitoring tools was evaluated throughout the testing phase. Figure 7 shows participants’ assessments of the usability of the various tools, before and after four months of practice. Usability of all the tools improved considerably. Nonetheless, the figure indicates some design aspects that, although improved, still needed further refinement. These included the mobile internet connection, inputting text in the WhatsApp, recording rainfall data, and submitting reports. A small percentage of farmers (<23%) did not answer because they did not know or dropped out of the experiment due to low motivation or other barriers.

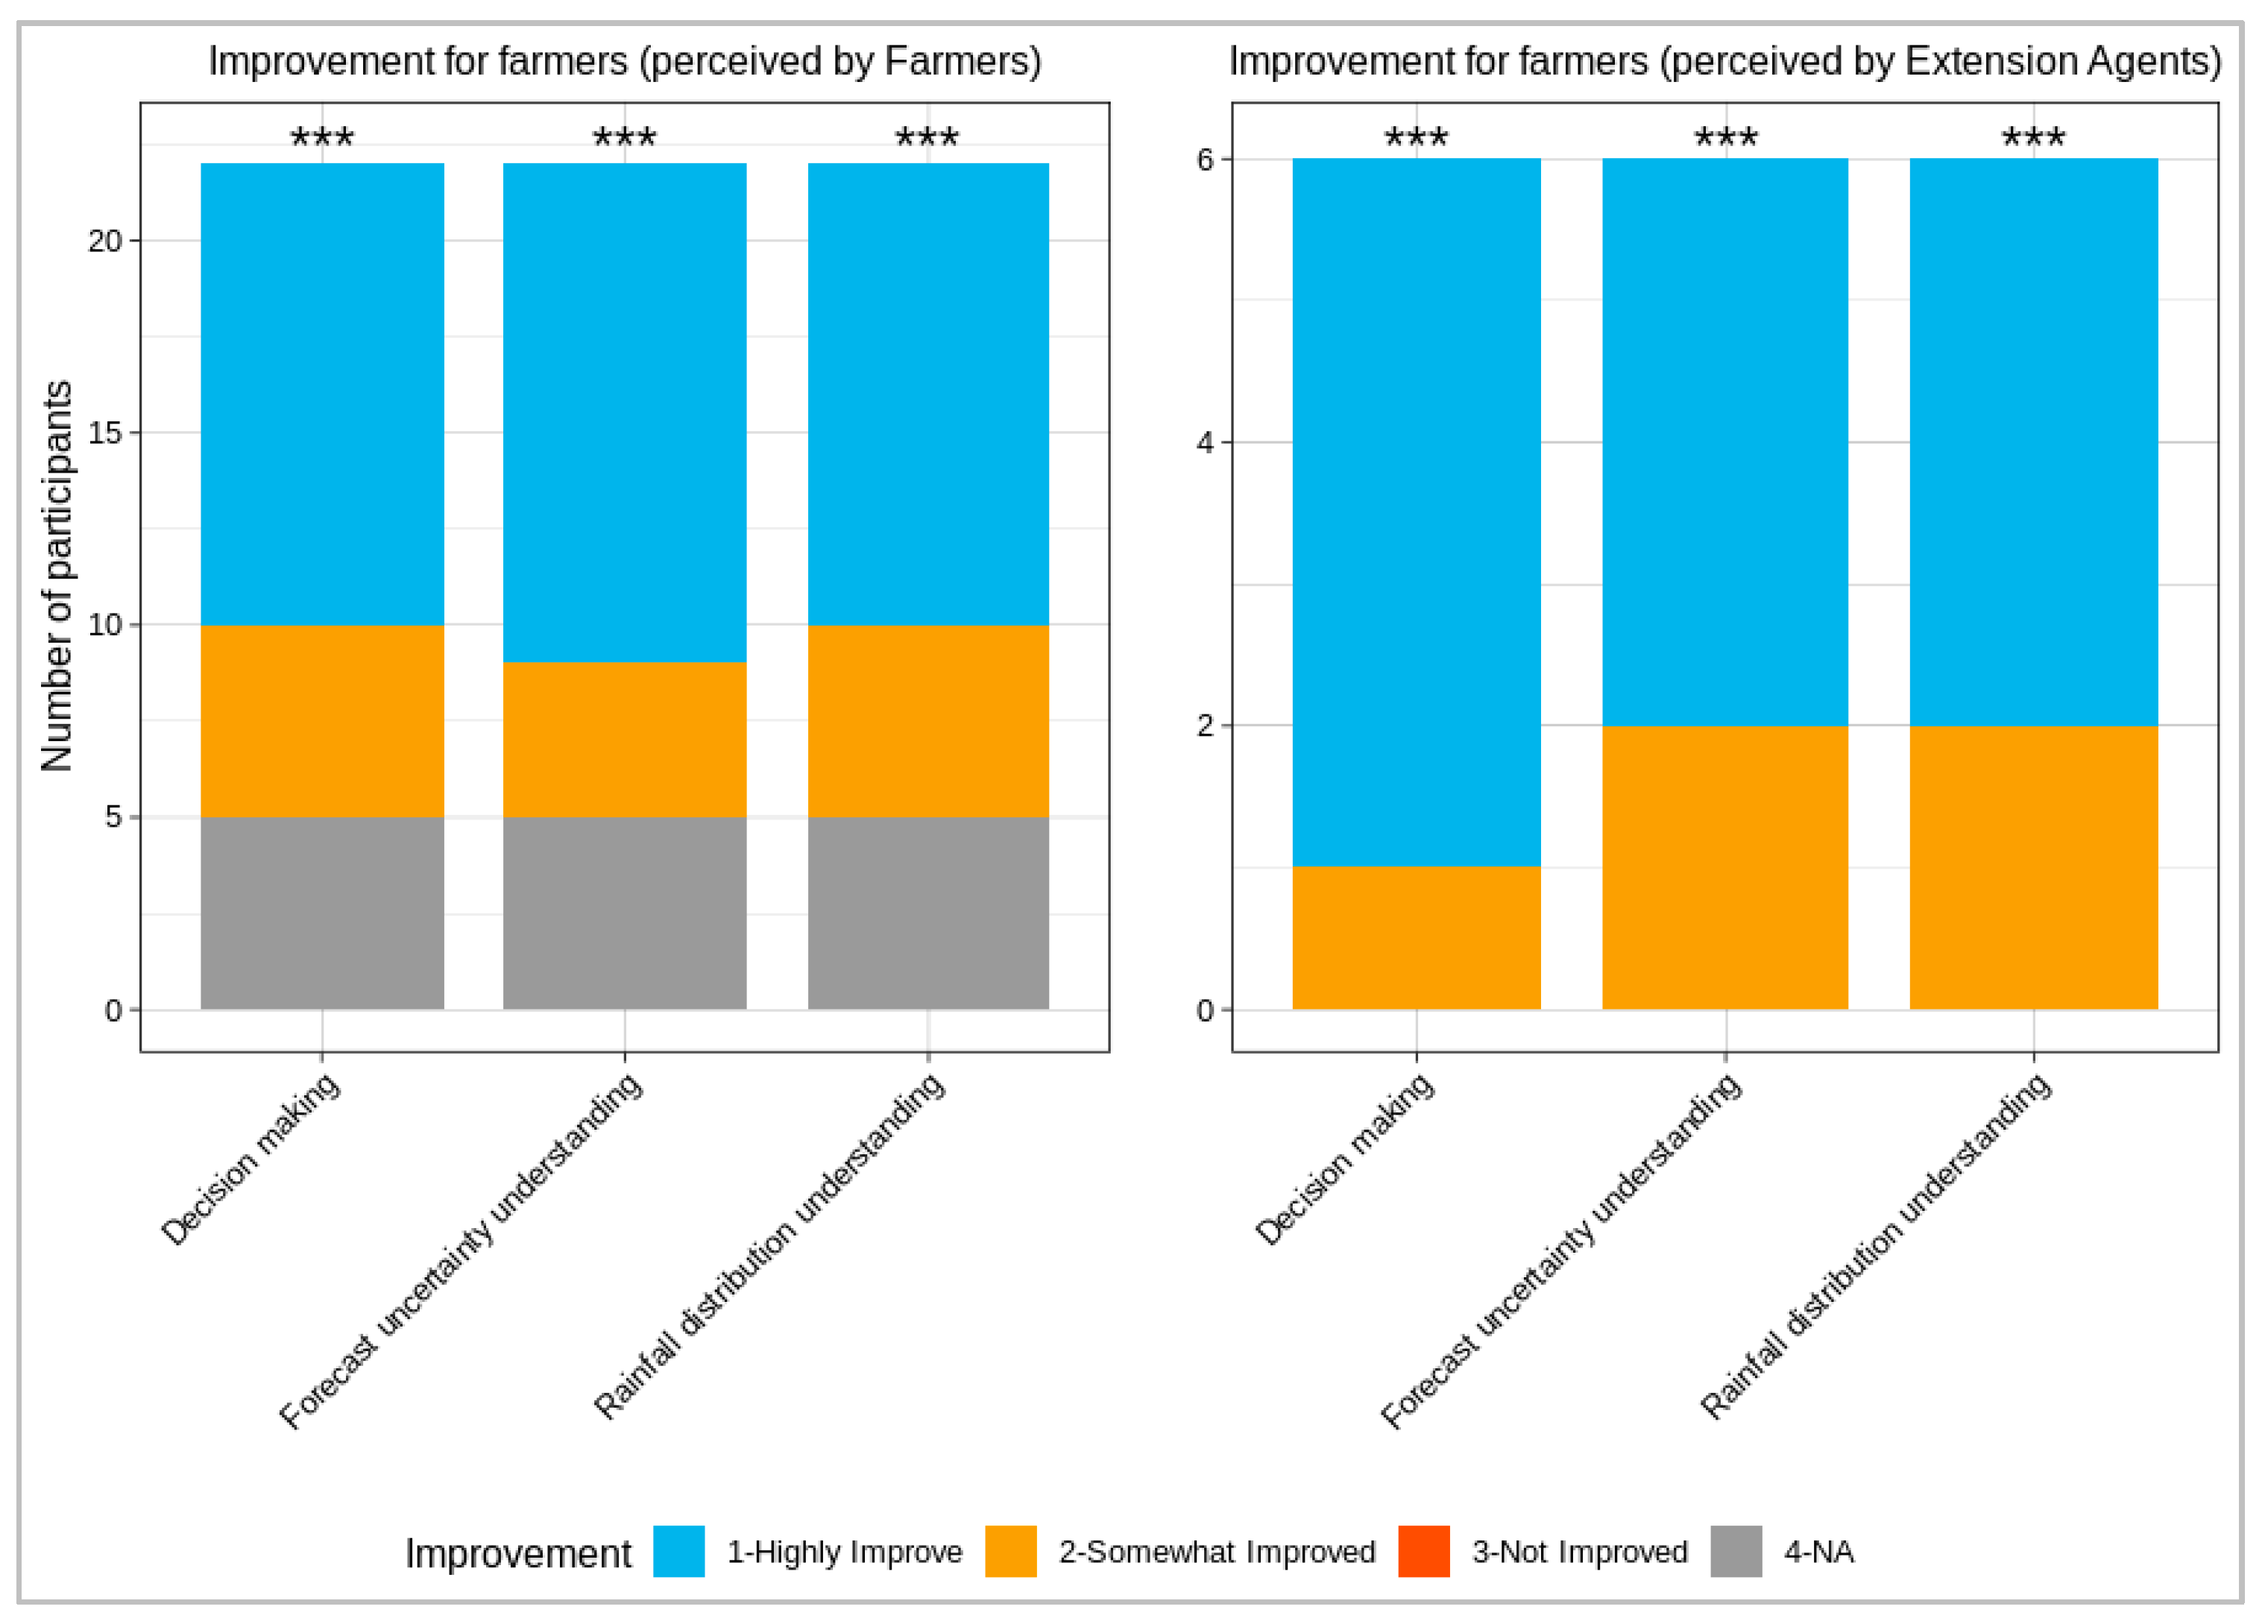
3.2.3. Usefulness of Tools, Weather Forecasts, and Data

The usefulness of the tools, weather forecasts, and data was also evaluated. Figure 8 presents farmers’ and extension agents’ opinions on the relevance of each component to farmers in the study area. Most participants confirmed that the design tools (i.e., mobile internet, the rain gauges, smartphones, the weather app, and WhatsApp) were at least somewhat relevant as communication tools for weather forecast information (compared to traditional channels like radio and TV). Similarly, the majority thought the local and scientific weather forecasts and data produced and shared were highly relevant to their daily farming decisions. However, some digital technology items (e.g., mobile internet) were less appreciated by participants. This was mainly due to the low internet coverage in remote locations of the study district, which prevented some participants from using the apps effectively.
Both farmers and extension agents observed that the experiment helped farmers improve their understanding of rainfall distribution and forecast uncertainties. Furthermore, farmers’ decision-making was said to have improved, compared to previous years (see daily decisions in Table S2, Supplementary Materials). Most participants noted that their understanding and decisions improved, at least somewhat (Figure 9).
In summary, although further improvements were still called for, the evaluation pointed to positive outcomes regarding engagement of farmers, usability and usefulness of the tools, understanding of the tools, and farming decisions. These results are significant at the 95% confidence level, considering a binomial distribution for the medium and high response categories, except for the internet category (see details in Tables S3 and S4, Supplementary Materials).

3.2.4. Outreach to Other Farmers

The coproduction experiment reached more farmers in Ada East communities beyond those directly involved in the experiment. Table 3 presents the numbers of farmers with whom experiment participants (i.e., both farmers and extension agents) shared data and what they learned. In total, farmers indicated having shared their data and knowledge with more than 350 fellow farmers, while the extension agents, who were in constant contact with farmers throughout Ada East, indicated they reached out to more than 504 farmers. This implies that all participants can spread the knowledge coproduced. It also demonstrates the importance of involving agricultural and meteorological extension agents, as they have larger networks and can transmit the coproduced knowledge to many farmers not involved in the experiment.

3.2.5. Monthly Monitoring and Assistance Activities

Continuous monitoring was carried out during the testing phase to support farmers in their usage of the tools and to ensure the quality of the data collected. Table 4 lists several adjustments made during the process, alongside observations on lessons learned regarding design principles. Primary adjustments were to increase the frequency of tool maintenance (e.g., replacing broken rain gauges and defective phone batteries), correcting rainfall recording and reporting techniques, and advising some farmers on how to work around internet instability. These activities generated a workload for scientists of a half-day per week and one full day each month on average.
We also observed differences between the socio-demographic categories of participants that helped us to adjust and target our monitoring and assistance efforts (Table 4). For example, older farmers had better knowledge of local forecast indicators (see Table S6, Supplementary Materials) but faced more technical challenges in using the tools compared to younger farmers. Moreover, literate farmers tended to have less difficulty in handling the tools. Female and male farmers invested similar levels of time and effort in their participation in the coproduction experiment activities.
As noted, mobile internet stability varied across the district, and this particularly affected data collection and interaction of farmers in the most remote communities. Adjustments were made to help them address the issue. For instance, they were advised to try to reconnect on an elevated surface or, alternatively, to use a notebook to record rainfall data and local forecast indicators, and to call one of the scientists to submit their data.
Both apps (the weather app and WhatsApp) were essential for data collection and participant interaction. However, the double tools generated increased workload for both the farmers and the scientists. For instance, farmers had to keep track of two separate tools, which effectively doubled the technical challenges some faced. Researchers, for their part, had to manually process the data input via the weather app for sharing on WhatsApp.

4. Discussion

The objective of this study was to evaluate a coproduction experiment and extract lessons on design principles for an ICT-based WCIS that combines local and scientific forecasting knowledge and is tailored to the needs of smallholder farmers. This section discusses the evaluation results and draws lessons on design criteria. In our evaluation of the experiment, we drew on participants’ engagement in the coproduction experiment, the usability and usefulness of the tools, the weather forecasts and data coproduced, and improvements in farmer decision-making and understanding of rainfall distribution and forecast uncertainty. Our focus was on the design process, as the aim was to define critical design criteria/principles for effective ICT-based WCIS. We did not evaluate impacts in terms of farming outcomes, like changes in cropping practices or yields.

4.1. Evaluation of the Coproduction Experiment

The results include the level of engagement (i.e., 76% of farmers with medium and high levels of engagement) and the usability of the designed tools that were found to increase over time. In addition, most farmers and extension agents expressed appreciation for the relevance of the features and functionality of the tools (i.e., the weather app, the WhatsApp group, and the rain gauges) and the coproduced information (i.e., weather forecasts and rainfall data). A large share of the participants indicated that their understanding of rainfall distribution, forecast uncertainty, and farm decisions improved. Moreover, the coproduction experiment reached many farmers beyond those directly involved. A next step could be to evaluate the impacts of the coproduction experiment, for example, in terms of changes in cropping practices and yields. This was beyond the scope of the current experiment, as it would require a longer-term intervention.
Capacity building proved to be a key factor in the success of the experiment, alongside the continuous monitoring and technical support provided throughout the design and testing phases. This includes the joint definition and refinement of the app interfaces with farmers during the design phase, as well as several adjustments made during the testing phase of the experiment (see Table 4). The participants’ engagement and interaction allowed the research team to identify and address challenges early and ensured the continuity of the experiment activities. Both farmers and scientists learned from each other as they defined the features and functionalities of the tools together. The scientists followed up by providing the participating farmers individualized coaching and technical assistance (see Table 4). Despite the intensive interactions between the scientists and farmers, a small portion of farmers still dropped out of the experiment.
At the start of the intervention, most of the participating farmers had no prior experience with mobile internet and smartphones, as they were still using basic mobile phone services, such as text alerts and voice messaging. The choice to use smartphones in our experiment meant that greater effort would be required to achieve the goals of the coproduction. However, the decision not to limit our experiment to the level of technology currently in use, but instead to jump ahead to the next level (smartphones) reflects our expectation of the fast development of digital technology in sub-Saharan Africa, and especially Ghana, in the near future [37,38,39]. ICT services, including internet service providers and telecommunication companies, have huge investments planned for the coming years in Ghana [54]. The cost of mobile devices, including mobile data subscriptions, is also dropping, making them more accessible to peri-urban farmers and even to rural ones [39,55,56]. Digital devices like smartphones with mobile apps have much more power to generate interaction between scientists and farmers than short message service (SMS)-based alert services [57].
In line with our results, many previous studies found that coproduction is an efficient way to reach out to and engage smallholder farmers and build trust and user confidence [16,21,28]. Consistent with the literature, our results suggest that capacity building is essential to the success of coproduction [16,17,58]. Capacity building is particularly important for interventions involving the testing of an innovative approach [58,59].
Application of our findings could add value to existing climate information systems in Ghana. Indeed, today’s information systems in Ghana still apply a traditional top-down approach, referred to as “one-directional”. In these first-generation climate information services, researchers create and transfer knowledge and/or technology to end-users (e.g., farmers) and assume that farmers will access, understand, and adopt the information provided for improved decision-making [19,54]. This applies to the forecast information provided by the Ghana Meteorological Agency and by private information services such as Esoko and Farmerline [19,45]. Our study went beyond this traditional approach. It used a holistic or second-generation methodology that acknowledges farmers as active participants in the production of knowledge and the codesign of innovative technology [19,60]. This approach additionally promotes processes of intense collaboration between researchers and dedicated groups of farmers and extension agents, to build a strong foundation for technology design, weather forecast production, and dissemination of knowledge to the wider community.
The concept of joint, intensive collaboration with farmers for provision of location-specific knowledge is not new in West Africa [61,62]. Nonetheless, our findings extend existing scholarship [13,42] by providing practical evidence that coproduction of climate information services can advance science and policies on smallholder agriculture within and outside Ghana. Our experiment showed the codesign of ICT-based tools, which harness real-time local/traditional weather forecasting knowledge, to be a significant step forward, particularly in the development of climate services that integrate traditional forecasting systems and scientific model-based forecasts. Availability of such combined services can foster acceptance and use of climate information by smallholder farmers [63,64]. This could, in turn, enhance the adaptive capacity and resilience of smallholder agriculture in developing countries in the face of climate variability and change
Although implementing this approach requires efforts to build a strong collaboration with local farmers (especially during the development phase), once codesigned, the information service can be scaled up relatively quickly. Another limitation is the need for traditional forecasting knowledge to be local-specific, meaning that, while the information service designed may be good for the target community, it may not be wholly transferable to other regions within or outside Ghana.
Our overall results suggest that the use of modern technology in a coproduction process, with targeted training, can improve access to and use of weather forecasts by smallholder farmers. Currently, such an approach is mainly applicable in peri-urban areas of Ghana, like the Ada East District, or in rural areas with basic ICT infrastructure, particularly internet service and electricity. However, implementation in other remote rural communities will likely be possible in the near future, considering the fast growth of ICTs and internet access in Ghana and West Africa overall [39].

4.2. Design Criteria for Weather and Climate Information Services for Smallholders

Our research demonstrates that digital and rainfall monitoring tools can be codesigned with user-friendly features (e.g., visualization with symbols, Table 5) and tailored to smallholder farmers’ needs. It also highlights the importance of appropriate training and monitoring throughout the design and testing of information systems for farmers, particularly if target farmers differ in literacy levels, ages, and locations (see Figure 1 and Figure 3). Our coproduction experiment’s use of two different apps and multiple data sources proved to be hectic for both scientists and farmers. In the future, we recommend combining the functionality of the weather app and WhatsApp in a single app that offers users the ability to both record data and interact. An additional improvement would be to process the forecasts and data from both local sources and scientific models by algorithms integrated into the back-end design of the single app. This would reduce the data processing, training, and monitoring workload. Nonetheless, for the purpose of this experiment, and considering limitations of time, the current set-up was sufficient for learning design principles for an effective WCIS. Additionally, involving young farmers and balancing gender would seem important for sustainable knowledge sharing. Particularly, mixing age groups can foster knowledge transmission between generations.
In designing a WCIS, it is important to focus on a smaller but dedicated group of intensive users who will form the basis for wider dissemination in their communities. This is especially because of the workload and the cost related to tool training, monitoring, and assistance, which require the coproduction investments to be optimized to ensure sustainability in future applications. The focus can then be on a representative but an optimal sample size of participants (especially farmers who are collecting the data, as well as extension agents) and with attention paid to the good use of tools and quality of the data (Table 5). Coproduction requires investment of sufficient resources to allow for targeted technical support to ensure the continued engagement of participants and guarantee the quality of the data collected. The coproduced information can then be made publicly available in the district. Regarding outreach, the current study found that extension agents had bigger networks and were good disseminators of forecast information. Although “extension-to-farmer” outreach was higher than “farmer-to-farmer” outreach in our case, the latter remains an important channel for reaching other farmers in the community. Farmer-to-farmer dissemination has the potential to spread agricultural technologies among smallholder farmer communities [65]. However, more research is needed to understand and determine the impact and effectiveness of the “farmer-to-farmer” dissemination route for weather and climate information.
The lessons drawn from the coproduction approach used in this experiment are transferable to other regions under certain conditions (Table 6). Internet availability is an important one, as the real-time collection of forecast indicators and rainfall data from remote locations requires reliable internet coverage. This was one of the reasons why we selected a peri-urban region as our study area. Furthermore, the indicators used by farmers to forecast the weather and climate will differ depending on the region/district studied and, therefore, need to be adjusted for each.
Results from the current study advance research on the development and application of WCIS for smallholder farmers. Our coproduction experiment also contributes to other ongoing studies and to mobile app development for smallholder farmers. It demonstrates how local or traditional forecasting knowledge can be harnessed in real time and combined with scientific model-based forecasts for Ada East District, Ghana [29]. Additionally, the study helps to examine and understand the motivation and barriers to the engagement of local farmers for the same district in a follow-up study (see Reference [66]). Moreover, the design lessons learned from this coproduction experiment, combined with related research outputs, will help to further optimize the design of the two-way information systems within a single app, which is now under development and provisionally called “FarmerSupport” (http://www.waterapps.net/en-us/ghana-updates/farmersupport-mobile-app-now-online/).
Defining a strategy to sustain the coproduction process was found to be a critical design principle (Table 6). In this regard, it is important to reflect on WCIS sustainability and inclusiveness. For example, together with local authorities, roadmaps that can be adapted to local needs can be developed for establishing coproduction processes even in the absence of external research-driven projects. In the present study, we sought, with the acquiesce of local stakeholders such as the district assembly, extension department, and farmers [67], to create a sustainable business model. This was another factor that prompted our selection of a target farming community in proximity to an urban market outlet. Similar initiatives could involve collaboration between farmers and social enterprises. Moreover, local enterprises could elaborate a win–win business model around the coproduction process, connecting with partners such as government institutions, universities, agricultural insurance companies, and nongovernmental organizations to ensure the sustainability of activities and outputs. However, this is not the only way to sustain the coproduction process. Prior research [53,68] found that climate-resilient field schools (CrFSs) provide a fruitful environment for the coproduction of location-specific knowledge such as weather and climate information for smallholder farmers. CrFSs involve multilevel institutional actors [53] that help to cover the costs of the coproduction process. However, barriers in terms of mismanagement and financial constraints need to be addressed for effective application of the farmer field school strategy [53].

5. Conclusions

This study evaluated an experimental coproduction process for ICT-based weather forecast information services developed with and for smallholder farmers in Ada East District, Ghana. It also identified several lessons for similar interventions in the future. In particular, our research yielded two main insights related to the value of coproduction and its implementation. Firstly, the research demonstrated that digital tools (smartphones and apps) and rainfall monitoring tools with simple interfaces, designed with and for smallholder farmers, can lead to useful and usable weather forecast information services. The tools employed offered a unique opportunity for farmers and researchers to collaborate, for real-time collection of local or traditional forecasts and data, and for processing and combining local knowledge with scientific model-based forecasts. The Ada East case study further demonstrated that coproduction of a WCIS can facilitate farmers’ access to and acceptance of weather and climate information and promote better understanding of forecast uncertainties, leading to improved farming decisions. However, longer-term changes in yields and livelihood assessments are needed to prove the real effectiveness of the coproduced WCIS. Our findings suggest that a coproduced information service is more likely to be accepted and used by vulnerable smallholder farmers in the study district.
Secondly, our study advanced understanding of design principles for a new generation of climate information services tailored for smallholder farmers. Coproduction of an ICT-based WCIS was found to require intensive collaboration between scientists and a dedicated group of farmers and extension agents. Capacity building was needed, alongside continuous monitoring and technical support during the design and testing phases. If a WCIS is built on both local and scientific forecast knowledge, it has more chance to be accepted, understood, and used by smallholder farmers. Integrating WCIS into agricultural policies and decision-making would further enhance the adaptive capacity of smallholder farmers in developing countries. These findings will also be of interest to the growing research community studying the integration of traditional forecasting systems into modern climate information services.

Supplementary Materials

The following are available online at https://www.mdpi.com/2073-4433/11/9/902/s1: Figure S1. Sample photos of the smartphones used by farmers and extension agents; Figure S2. Statistics on emojis shared in the WhatsApp group; Figure S3. Details on the integrated app developed under the Waterapps project (based on lessons from the present study), which is available on the Google Play store https://play.google.com/store/apps/details?id=com.spacewek.farmersupport; Table S1. List of the local forecast indicators for the daily rainfall forecast at Ada East district used in the WeatherApp (adapted from Reference [29]); Table S2. Farming decisions that the coproduced information helped to support. It gives the percentage of decisions that were more of interest by the 28 participants (22 farmers and six extension agents); Table S3. Significance of the results on the engagement, usability, usefulness, understanding, and decision improvement when considering a binomial distribution for the medium and high categories of responses (farmers); Table S4. Significance of the results on the usefulness, understanding and decision improvement when considering a binomial distribution for the medium and high categories of responses (extension agents); Table S5. Count of messages, pictures, and emojis exchanged via the WhatsApp group; Table S6. Analysis of the technical issues reported by age, gender, and literacy levels from a total of 92 technical issues recorded during the testing phase.

Author Contributions

Conceptualization, T.G., E.V.S., and F.L.; methodology, T.G. and E.V.S.; data collection and analysis, T.G. and R.S.; writing—original draft preparation, T.G.; writing—review and editing, T.G., R.S., E.V.S., F.L., G.K.-B., and S.P.; project administration, E.V.S., F.L., and G.K.-B. All authors read and agreed to the published version of the manuscript.

Funding

This research is part of the WATERAPPS project (http://www.waterapps.net/) and is funded by the Netherlands Organization for scientific research (NWO/WOTRO) under the Urbanizing Deltas of the World (UDW) program, grant number W 07.69.204.

Acknowledgments

This research was fully funded by the Netherlands Organization for Scientific Research (NWO/WOTRO) under the urbanizing deltas of the world program (UDW) and WaterApps (www.waterapps.net) project. Our sincerest gratitude goes to the farmers of Ada East District communities who contributed to local data collection and are the holders and custodians of this information. We also thank the Agriculture and Development Unit, Ada East, Ghana for their facilitation of the coproduction set-up.

Conflicts of Interest

The authors declare no conflict of interest.

References

  1. Shimeles, A.; Verdier-Chouchane, A.; Boly, A. Introduction: Understanding the challenges of the agricultural sector in Sub-Saharan Africa. In Building a Resilient and Sustainable Agriculture in Sub-Saharan Africa; Palgrave Macmillan: Cham, Switzerland; London, UK, 2018; pp. 1–12. [Google Scholar]
  2. Rockström, J.; Falkenmark, M. Agriculture: Increase water harvesting in Africa. Nature 2015, 519, 283. [Google Scholar] [CrossRef] [PubMed]
  3. Sultan, B.; Lejeune, Q.; Menke, I.; Maskell, G.; Lee, K.; Noblet, M.; Sy, I.; Roudier, P. Current needs for climate services in West Africa: Results from two stakeholder surveys. Clim. Serv. 2020, 18, 100166. [Google Scholar] [CrossRef]
  4. Sultan, B.; Gaetani, M. Agriculture in West Africa in the twenty-first century: Climate change and impacts scenarios, and potential for adaptation. Front. Plant Sci. 2016, 7, 1262. [Google Scholar] [CrossRef] [Green Version]
  5. Gbangou, T.; Sylla, M.B.; Jimoh, O.D.; Okhimamhe, A.A. Assessment of projected agro-climatic indices over Awun river basin, Nigeria for the late twenty-first century. Clim. Chang. 2018, 151, 445–462. [Google Scholar] [CrossRef] [Green Version]
  6. IPCC. Special Report on 1.5 °C; Jones, L., Dougill, A., Jones, R.G., Steynor, A., Eds.; IPCC: Geneva, Switzerland, 2019. [Google Scholar]
  7. Jalloh, A.; Nelson, G.C.; Thomas, T.S.; Zougmoré, R.B.; Roy-Macauley, H. West African Agriculture and Climate Change: A Comprehensive Analysis; International Food Policy Research Institute: Washington, DC, USA, 2013. [Google Scholar]
  8. Atta, S.; Ly, M.; Salack, S.; George, D.A. Adapting to climate variability and change in smallholder farming communities: A case study from Burkina Faso, Chad and Niger. J. Agric. Ext. Rural Dev. 2015, 7, 16–27. [Google Scholar]
  9. Yobom, O. Climate change and variability: Empirical evidence for countries and agroecological zones of the Sahel. Clim. Chang. 2020, 159, 365–384. [Google Scholar] [CrossRef]
  10. Gbangou, T.; Ludwig, F.; van Slobbe, E.; Hoang, L.; Kranjac-Berisavljevic, G. Seasonal variability and predictability of agro-meteorological indices: Tailoring onset of rainy season estimation to meet farmers’ needs in Ghana. Clim. Serv. 2019, 14, 19–30. [Google Scholar] [CrossRef]
  11. Cooper, P.; Dimes, J.; Rao, K.; Shapiro, B.; Shiferaw, B.; Twomlow, S. Coping better with current climatic variability in the rain-fed farming systems of sub-Saharan Africa: An essential first step in adapting to future climate change? Agric. Ecosyst. Environ. 2008, 126, 24–35. [Google Scholar] [CrossRef] [Green Version]
  12. Wani, S.P.; Rockström, J.; Oweis, T.Y. Rainfed Agriculture: Unlocking the Potential; CABI: Wallingford, UK, 2009; Volume 7. [Google Scholar]
  13. Vaughan, C.; Hansen, J.; Roudier, P.; Watkiss, P.; Carr, E. Evaluating agricultural weather and climate services in Africa: Evidence, methods, and a learning agenda. Wiley Interdiscip. Rev. Clim. Chang. 2019, 10, e586. [Google Scholar] [CrossRef] [Green Version]
  14. Masinde, M.; Bagula, A.; Muthama, N.J. The role of ICTs in downscaling and up-scaling integrated weather forecasts for farmers in sub-Saharan Africa. In Proceedings of the Fifth International Conference on Information and Communication Technologies and Development, Atlanta, GA, USA, 12–15 March 2012; pp. 122–129. [Google Scholar]
  15. Gbangou, T.; Ludwig, F.; van Slobbe, E.; Greuell, W.; Kranjac-Berisavljevic, G. Rainfall and dry spell occurrence in Ghana: Trends and seasonal predictions with a dynamical and a statistical model. Theor. Appl. Climatol. 2020. [Google Scholar] [CrossRef] [Green Version]
  16. van der Burgt, F.; van Pelt, S.; Lobbrecht, A. Mobile Weather Services for Small-Scale Farmers. 2018. Available online: https://www.weatherimpact.com/wp-content/uploads/2019/10/MobileWeatherServicesforSmallScaleFarmers_WeatherImpact.pdf (accessed on 1 July 2020).
  17. Vogel, J.; Letson, D.; Herrick, C. A framework for climate services evaluation and its application to the Caribbean Agrometeorological Initiative. Clim. Serv. 2017, 6, 65–76. [Google Scholar] [CrossRef]
  18. Buytaert, W.; Zulkafli, Z.; Grainger, S.; Acosta, L.; Alemie, T.C.; Bastiaensen, J.; De Bièvre, B.; Bhusal, J.; Clark, J.; Dewulf, A. Citizen science in hydrology and water resources: Opportunities for knowledge generation, ecosystem service management, and sustainable development. Front. Earth Sci. 2014, 2, 26. [Google Scholar] [CrossRef] [Green Version]
  19. Nyadzi, E.; Nyamekye, A.B.; Werners, S.E.; Biesbroek, R.G.; Dewulf, A.; Van Slobbe, E.; Long, H.P.; Termeer, C.J.; Ludwig, F. Diagnosing the potential of hydro-climatic information services to support rice farming in northern Ghana. NJAS Wagening. J. Life Sci. 2018, 86, 51–63. [Google Scholar] [CrossRef]
  20. Byerlee, D.; De Janvry, A.; Sadoulet, E.; Townsend, R.; Klytchnikova, I. World Development Report 2008: Agriculture for Development; The World Bank: Washington, DC, USA, 2008. [Google Scholar]
  21. Lemos, M.C.; Arnott, J.C.; Ardoin, N.M.; Baja, K.; Bednarek, A.T.; Dewulf, A.; Fieseler, C.; Goodrich, K.A.; Jagannathan, K.; Klenk, N. To co-produce or not to co-produce. Nat. Sustain. 2018, 1, 722–724. [Google Scholar] [CrossRef]
  22. Zebiak, S.E. International Conference on Climate Services-5—An Introduction; Elsevier: Amsterdam, The Netherlands, 2019. [Google Scholar]
  23. Vedeld, T.; Mathur, M.; Bharti, N. How can co-creation improve the engagement of farmers in weather and climate services (WCS) in India. Clim. Serv. 2019, 15, 100103. [Google Scholar] [CrossRef]
  24. CSP. What Are Climate Services? 2011. Available online: https://climate-services.org/about-us/what-are-climate-services/ (accessed on 2 March 2020).
  25. GFCS. Development and Delivery of Climate Services Research Dialogue. 2016. Available online: https://unfccc.int/files/science/workstreams/research/application/pdf/part2.1_wmo_dilley.pdf (accessed on 2 March 2020).
  26. Sarku, R.; Dewulf, A.; van Slobbe, E.; Termeer, K.; Kranjac-Berisavljevic, G. Adaptive decision-making under conditions of uncertainty: The case of farming in the Volta delta, Ghana. J. Integr. Environ. Sci. 2020, 17, 1–33. [Google Scholar] [CrossRef] [Green Version]
  27. Ingram, K.; Roncoli, M.; Kirshen, P. Opportunities and constraints for farmers of west Africa to use seasonal precipitation forecasts with Burkina Faso as a case study. Agric. Syst. 2002, 74, 331–349. [Google Scholar] [CrossRef]
  28. Nyadzi, E. Best of Both Worlds: Co-Producing Climate Services that Integrate Scientific and Indigenous Weather and Seasonal Climate Forecast for Water Management and Food Production in Ghana. Ph.D. Thesis, Wageningen University and Research, Wageningen, The Netherlands, 2020. [Google Scholar]
  29. Gbangou, T.; van Slobbe, E.; Ludwig, F.; Kranjac-Berisavljevic, G.; Paparrizos, S. Harnessing local forecasting knowledge on weather and climate in Ghana: Documentation, skills and integration with scientific forecasting knowledge. Weather Clim. Soc. 2020. under review. [Google Scholar]
  30. Radeny, M.; Desalegn, A.; Mubiru, D.; Kyazze, F.; Mahoo, H.; Recha, J.; Kimeli, P.; Solomon, D. Indigenous knowledge for seasonal weather and climate forecasting across East Africa. Clim. Chang. 2019, 156, 509–526. [Google Scholar] [CrossRef] [Green Version]
  31. Crane, T.A.; Roncoli, C.; Paz, J.; Breuer, N.; Broad, K.; Ingram, K.T.; Hoogenboom, G. Forecast skill and farmers’ skills: Seasonal climate forecasts and agricultural risk management in the southeastern United States. Weather Clim. Soc. 2010, 2, 44–59. [Google Scholar] [CrossRef]
  32. O’Grady, M.J.; Muldoon, C.; Carr, D.; Wan, J.; Kroon, B.; O’Hare, G.M. Intelligent sensing for citizen science. Mob. Netw. Appl. 2016, 21, 375–385. [Google Scholar] [CrossRef]
  33. Rutten, M.; Minkman, E.; van der Sanden, M. How to get and keep citizens involved in mobile crowd sensing for water management? A review of key success factors and motivational aspects. Wiley Interdiscip. Rev. Water 2017, 4, e1218. [Google Scholar] [CrossRef] [Green Version]
  34. Tinati, R.; Luczak-Roesch, M.; Simperl, E.; Hall, W. An investigation of player motivations in Eyewire, a gamified citizen science project. Comput. Hum. Behav. 2017, 73, 527–540. [Google Scholar] [CrossRef]
  35. Turreira-García, N.; Lund, J.F.; Domínguez, P.; Carrillo-Anglés, E.; Brummer, M.C.; Duenn, P.; Reyes-García, V. What’s in a name? Unpacking “participatory” environmental monitoring. Ecol. Soc. 2018, 23, 1–11. [Google Scholar] [CrossRef]
  36. Naab, F.Z.; Abubakari, Z.; Ahmed, A. The role of climate services in agricultural productivity in Ghana: The perspectives of farmers and institutions. Clim. Serv. 2019, 13, 24–32. [Google Scholar] [CrossRef]
  37. Aker, J.C. Dial “A” for agriculture: A review of information and communication technologies for agricultural extension in developing countries. Agric. Econ. 2011, 42, 631–647. [Google Scholar] [CrossRef]
  38. Aker, J.C.; Mbiti, I.M. Mobile phones and economic development in Africa. J. Econ. Perspect. 2010, 24, 207–232. [Google Scholar] [CrossRef] [Green Version]
  39. Zibi, G. The African mobile phone market: Beyond the boom phase, between the promise and uncertainty of maturity. Priv. Sect. Dev. 2009, 4, 3–6. [Google Scholar]
  40. Beza, E.; Steinke, J.; Van Etten, J.; Reidsma, P.; Fadda, C.; Mittra, S.; Mathur, P.; Kooistra, L. What are the prospects for citizen science in agriculture? Evidence from three continents on motivation and mobile telephone use of resource-poor farmers. PLoS ONE 2017, 12, e0175700. [Google Scholar] [CrossRef] [Green Version]
  41. Phillips, C.; Walshe, D.; O’Regan, K.; Strong, K.; Hennon, C.; Knapp, K.; Murphy, C.; Thorne, P. Assessing Citizen Science Participation Skill for Altruism or University Course Credit: A Case Study Analysis. Citiz. Sci. Theory Pract. 2018, 3, 6. [Google Scholar] [CrossRef]
  42. Field, C.B. Climate Change 2014–Impacts, Adaptation and Vulnerability: Regional Aspects; Cambridge University Press: Cambridge, UK, 2014. [Google Scholar]
  43. Addo, K.A.; Nicholls, R.J.; Codjoe, S.N.A.; Abu, M. A biophysical and socioeconomic review of the Volta Delta, Ghana. J. Coast. Res. 2018, 34, 1216–1226. [Google Scholar] [CrossRef] [Green Version]
  44. Nyadzi, E.; Werners, E.S.; Biesbroek, R.; Long, P.H.; Franssen, W.; Ludwig, F. Verification of Seasonal Climate Forecast toward Hydroclimatic Information Needs of Rice Farmers in Northern Ghana. Weather Clim. Soc. 2019, 11, 127–142. [Google Scholar] [CrossRef]
  45. Nyamekye, A.B.; Dewulf, A.; Van Slobbe, E.; Termeer, K. Information systems and actionable knowledge creation in rice-farming systems in Northern Ghana. Afr. Geogr. Rev. 2020, 39, 144–161. [Google Scholar] [CrossRef]
  46. Jost, C.; Kyazze, F.; Naab, J.; Neelormi, S.; Kinyangi, J.; Zougmore, R.; Aggarwal, P.; Bhatta, G.; Chaudhury, M.; Tapio-Bistrom, M.-L. Understanding gender dimensions of agriculture and climate change in smallholder farming communities. Clim. Dev. 2016, 8, 133–144. [Google Scholar] [CrossRef] [Green Version]
  47. Limantol, A.M.; Keith, B.E.; Azabre, B.A.; Lennartz, B. Farmers’ perception and adaptation practice to climate variability and change: A case study of the Vea catchment in Ghana. SpringerPlus 2016, 5, 830. [Google Scholar] [CrossRef] [PubMed] [Green Version]
  48. Zulkafli, Z.; Perez, K.; Vitolo, C.; Buytaert, W.; Karpouzoglou, T.; Dewulf, A.; De Bievre, B.; Clark, J.; Hannah, D.M.; Shaheed, S. User-driven design of decision support systems for polycentric environmental resources management. Environ. Model. Software 2017, 88, 58–73. [Google Scholar] [CrossRef] [Green Version]
  49. Tall, A.; Coulibaly, J.Y.; Diop, M. Do climate services make a difference? A review of evaluation methodologies and practices to assess the value of climate information services for farmers: Implications for Africa. Clim. Serv. 2018, 11, 1–12. [Google Scholar] [CrossRef]
  50. Collier, P.; Dercon, S. African agriculture in 50 years: Smallholders in a rapidly changing world? World Dev. 2014, 63, 92–101. [Google Scholar] [CrossRef]
  51. Sonwa, D.J.; Dieye, A.; El Mzouri, E.-H.; Majule, A.; Mugabe, F.T.; Omolo, N.; Wouapi, H.; Obando, J.; Brooks, N. Drivers of climate risk in African agriculture. Clim. Dev. 2017, 9, 383–398. [Google Scholar] [CrossRef]
  52. Bowden, A.; Ciesielska, M. Ecomuseums as cross-sector partnerships: Governance, strategy and leadership. Public Money Manag. 2016, 36, 23–30. [Google Scholar] [CrossRef]
  53. Chandra, A.; Dargusch, P.; McNamara, K.E.; Caspe, A.M.; Dalabajan, D. A study of climate-smart farming practices and climate-resiliency field schools in Mindanao, the Philippines. World Dev. 2017, 98, 214–230. [Google Scholar] [CrossRef]
  54. Musters, D. An Innovation Systems Approach to Examine the Organization of ICT-Based IPs for Extension Services in Ghana. Master’s Thesis, Wageningen University and Research, Wageningen, The Netherlands, 2017. [Google Scholar]
  55. Intelligence, G. The Mobile Economy Africa 2016; GSM Association: London, UK, 2016. [Google Scholar]
  56. Smith, D. Internet Use on Mobile Phones in Africa Predicted to Increase 20-Fold. Guardian 2014, 5. Available online: http://www.theguardian.com/world/2014/jun/05/internet-use-mobile-phones-africa-predicted-increase-20-fold (accessed on 1 July 2020).
  57. David-West, O. Esoko Networks: Facilitating agriculture through technology GIM Case Study 2011, B061. Available online: http://growinginclusivemarkets.org/media/cases/esoko_summary.pdf (accessed on 1 July 2020).
  58. Rao, K.; Hansen, J.; Njiru, E.; Githungo, W.N.; Oyoo, A. Impacts of Seasonal Climate Communication Strategies on Farm Management and Livelihoods in Wote, Kenya; CCAFS: Copenhagen, Denmark, 2015. [Google Scholar]
  59. Gertler, P.J.; Martinez, S.; Premand, P.; Rawlings, L.B.; Vermeersch, C.M. Impact Evaluation in Practice; The World Bank: Washington, DC, USA, 2016. [Google Scholar]
  60. Karpouzoglou, T.; Zulkafli, Z.; Grainger, S.; Dewulf, A.; Buytaert, W.; Hannah, D.M. Environmental virtual observatories (EVOs): Prospects for knowledge co-creation and resilience in the information age. Curr. Opin. Environ. Sustain. 2016, 18, 40–48. [Google Scholar] [CrossRef] [Green Version]
  61. Kniveton, D.; Visman, E.; Tall, A.; Diop, M.; Ewbank, R.; Njoroge, E.; Pearson, L. Dealing with uncertainty: Integrating local and scientific knowledge of the climate and weather. Disasters 2015, 39, s35–s53. [Google Scholar] [CrossRef] [PubMed]
  62. Tall, A.; Hansen, J.; Jay, A.; Campbell, B.; Kinyangi, J.; Aggarwal, P.K.; Zougmoré, R. Scaling up Climate Services for Farmers: Mission Possible. Learning from Good Practice in Africa and South Asia; CCAFS: Copenhagen, Denmark, 2014. [Google Scholar]
  63. Roncoli, C.; Ingram, K.; Kirshen, P. Reading the rains: Local knowledge and rainfall forecasting in Burkina Faso. Soc. Nat. Resour. 2002, 15, 409–427. [Google Scholar] [CrossRef]
  64. Roncoli, C.; Jost, C.; Kirshen, P.; Sanon, M.; Ingram, K.T.; Woodin, M.; Somé, L.; Ouattara, F.; Sanfo, B.J.; Sia, C. From accessing to assessing forecasts: An end-to-end study of participatory climate forecast dissemination in Burkina Faso (West Africa). Clim. Chang. 2009, 92, 433. [Google Scholar] [CrossRef]
  65. Kiptot, E.; Franzel, S.; Hebinck, P.; Richards, P. Sharing seed and knowledge: Farmer to farmer dissemination of agroforestry technologies in western Kenya. Agrofor. Syst. 2006, 68, 167–179. [Google Scholar] [CrossRef]
  66. Sarku, R.; Gbangou, T.; Dewulf, A.; Slobbe, E. Beyond ‘experts knowledge’: Locals and experts in a joint production of weatherApp and weather information for farming in the Volta Delta, Ghana. In Handbook of Climate Change Management; Springer Nature: New Delhi, India, 2020. [Google Scholar]
  67. EVOCA. Waterapps, Wageningen University, Partners Launch Apps to Transform Agricultural Landscape. 2019. Available online: https://citinewsroom.com/2019/06/wageningen-university-partners-launch-apps-to-transform-agricultural-landscape/ (accessed on 2 March 2020).
  68. Oxfam. Community-Based Climate Change Action Grants (CBCCAG) Program Activity Completion Report; Oxfam in The Philippines: Quezon City, Philippines, 2015. [Google Scholar]
Figure 1. Map of the study area in the Greater Accra Region, Ghana, showing the various communities of Ada East District [29].
Atmosphere 11 00902 g001
Figure 2. Codesign and testing of agrometeorological information services: methodological flowchart showing the cyclical and iterative process of knowledge development. Local data refer to farmers’ forecasts (based on locally used biophysical indicators) and scientific data refer to model-based forecasts. Digital technology includes information and communications technology (ICT; smartphones, apps, and the internet) used for knowledge exchange and collection of rainfall monitoring data.
Atmosphere 11 00902 g002
Figure 3. Age, education level, and gender of farmers and extension agents participating in coproduction experiment for weather and climate information in Ada East District, Ghana.
Atmosphere 11 00902 g003
Figure 4. Chronology of the coproduction work carried out in Ada East District, Ghana. Activities and methods for the 2017 rainy season, above the horizontal dashed line, are covered in previous studies, as part of the Waterapps project. They are, therefore, not included in the present study.
Atmosphere 11 00902 g004
Figure 5. The mobile applications and rain gauges used during the coproduction experiment. These included (a) a weather app used by farmers to collect real-time data on local forecast indicators and rainfall (see Table 2), (b) a WhatsApp group used by participants to share data on rainfall, as well as to disseminate both local and scientific forecasts in simple pie chart format and also to interact (see Table 2), and (c) manual rain gauges used by farmers to record rainfall amounts (see Table 2).
Atmosphere 11 00902 g005
Figure 6. Evolution of participants’ engagement based on their frequency of data collection and interaction via the digital and rain monitoring tools. Asterisks (* and **) indicate the significance of the results for the combined “medium and high engagement” category at, respectively, p < 0.05 and p < 0.01, based on a binomial distribution test.
Atmosphere 11 00902 g006
Figure 7. Usability of the digital and rain monitoring tools throughout the testing phase. “Not applicable (NA)” indicates participants who did not answer or dropped out of the experiment. Asterisks (*, **, and ***) indicate the significance of the results for the combined “somewhat and very easy” category at, respectively, p < 0.05, p < 0.01, and p < 0.001, based on a binomial distribution test.
Atmosphere 11 00902 g007
Figure 8. Farmers’ perceptions of the relevance or usefulness of the digital tools and weather forecast information and data shared compared to channels formerly used for dissemination of forecast data. “NA” indicates the share of participants who abstained from answering the question or dropped out of the experiment. Farmers were asked how useful the tools and information were, while extension agents were asked to confirm this usefulness. Various symbols (+, *, **, and ***) indicate the significance of the results for the combined “somewhat and highly relevant” category at, respectively, p < 0.1, p < 0.05, p < 0.01, and p < 0.001, based on a binomial distribution test.
Atmosphere 11 00902 g008
Figure 9. Perception of improvement in farmers’ decision-making, as well as understanding of forecast uncertainty and rainfall distribution, as compared to previous seasons. Farmers were asked if their decisions and understanding improved, while extension agents were asked if they perceived any such improvement. Asterisks (***) indicate the significance of the result for the combined “somewhat and highly improved” category at p < 0.001, based on a binomial distribution test.
Atmosphere 11 00902 g009
Table 1. Data collected and shared via the digital tools.
Digital ToolsData Collected and Shared
Weather app (collection)Daily biophysical local forecast indicators as observed and reported by farmers in their various locations
Daily rainfall observations as measured by farmers using the provided rain gauges
WhatsApp group (sharing)Daily local forecasts based on the processed and aggregated local forecast indicators [29]
Daily local forecasts derived from scientific sources (e.g., meteoblue) [29]
Daily rainfall observations as measured with the provided rain gauges
Table 2. Design aspects considered in coproduction of ICT-based digital and rain monitoring tools.
Digital ToolsFeaturesImportant Characteristics
Weather app
(for collection of daily observations on local forecast indicators and rainfall data)
ImagesImages for local forecast indicators were chosen and refined with farmers and presented on the app interface.
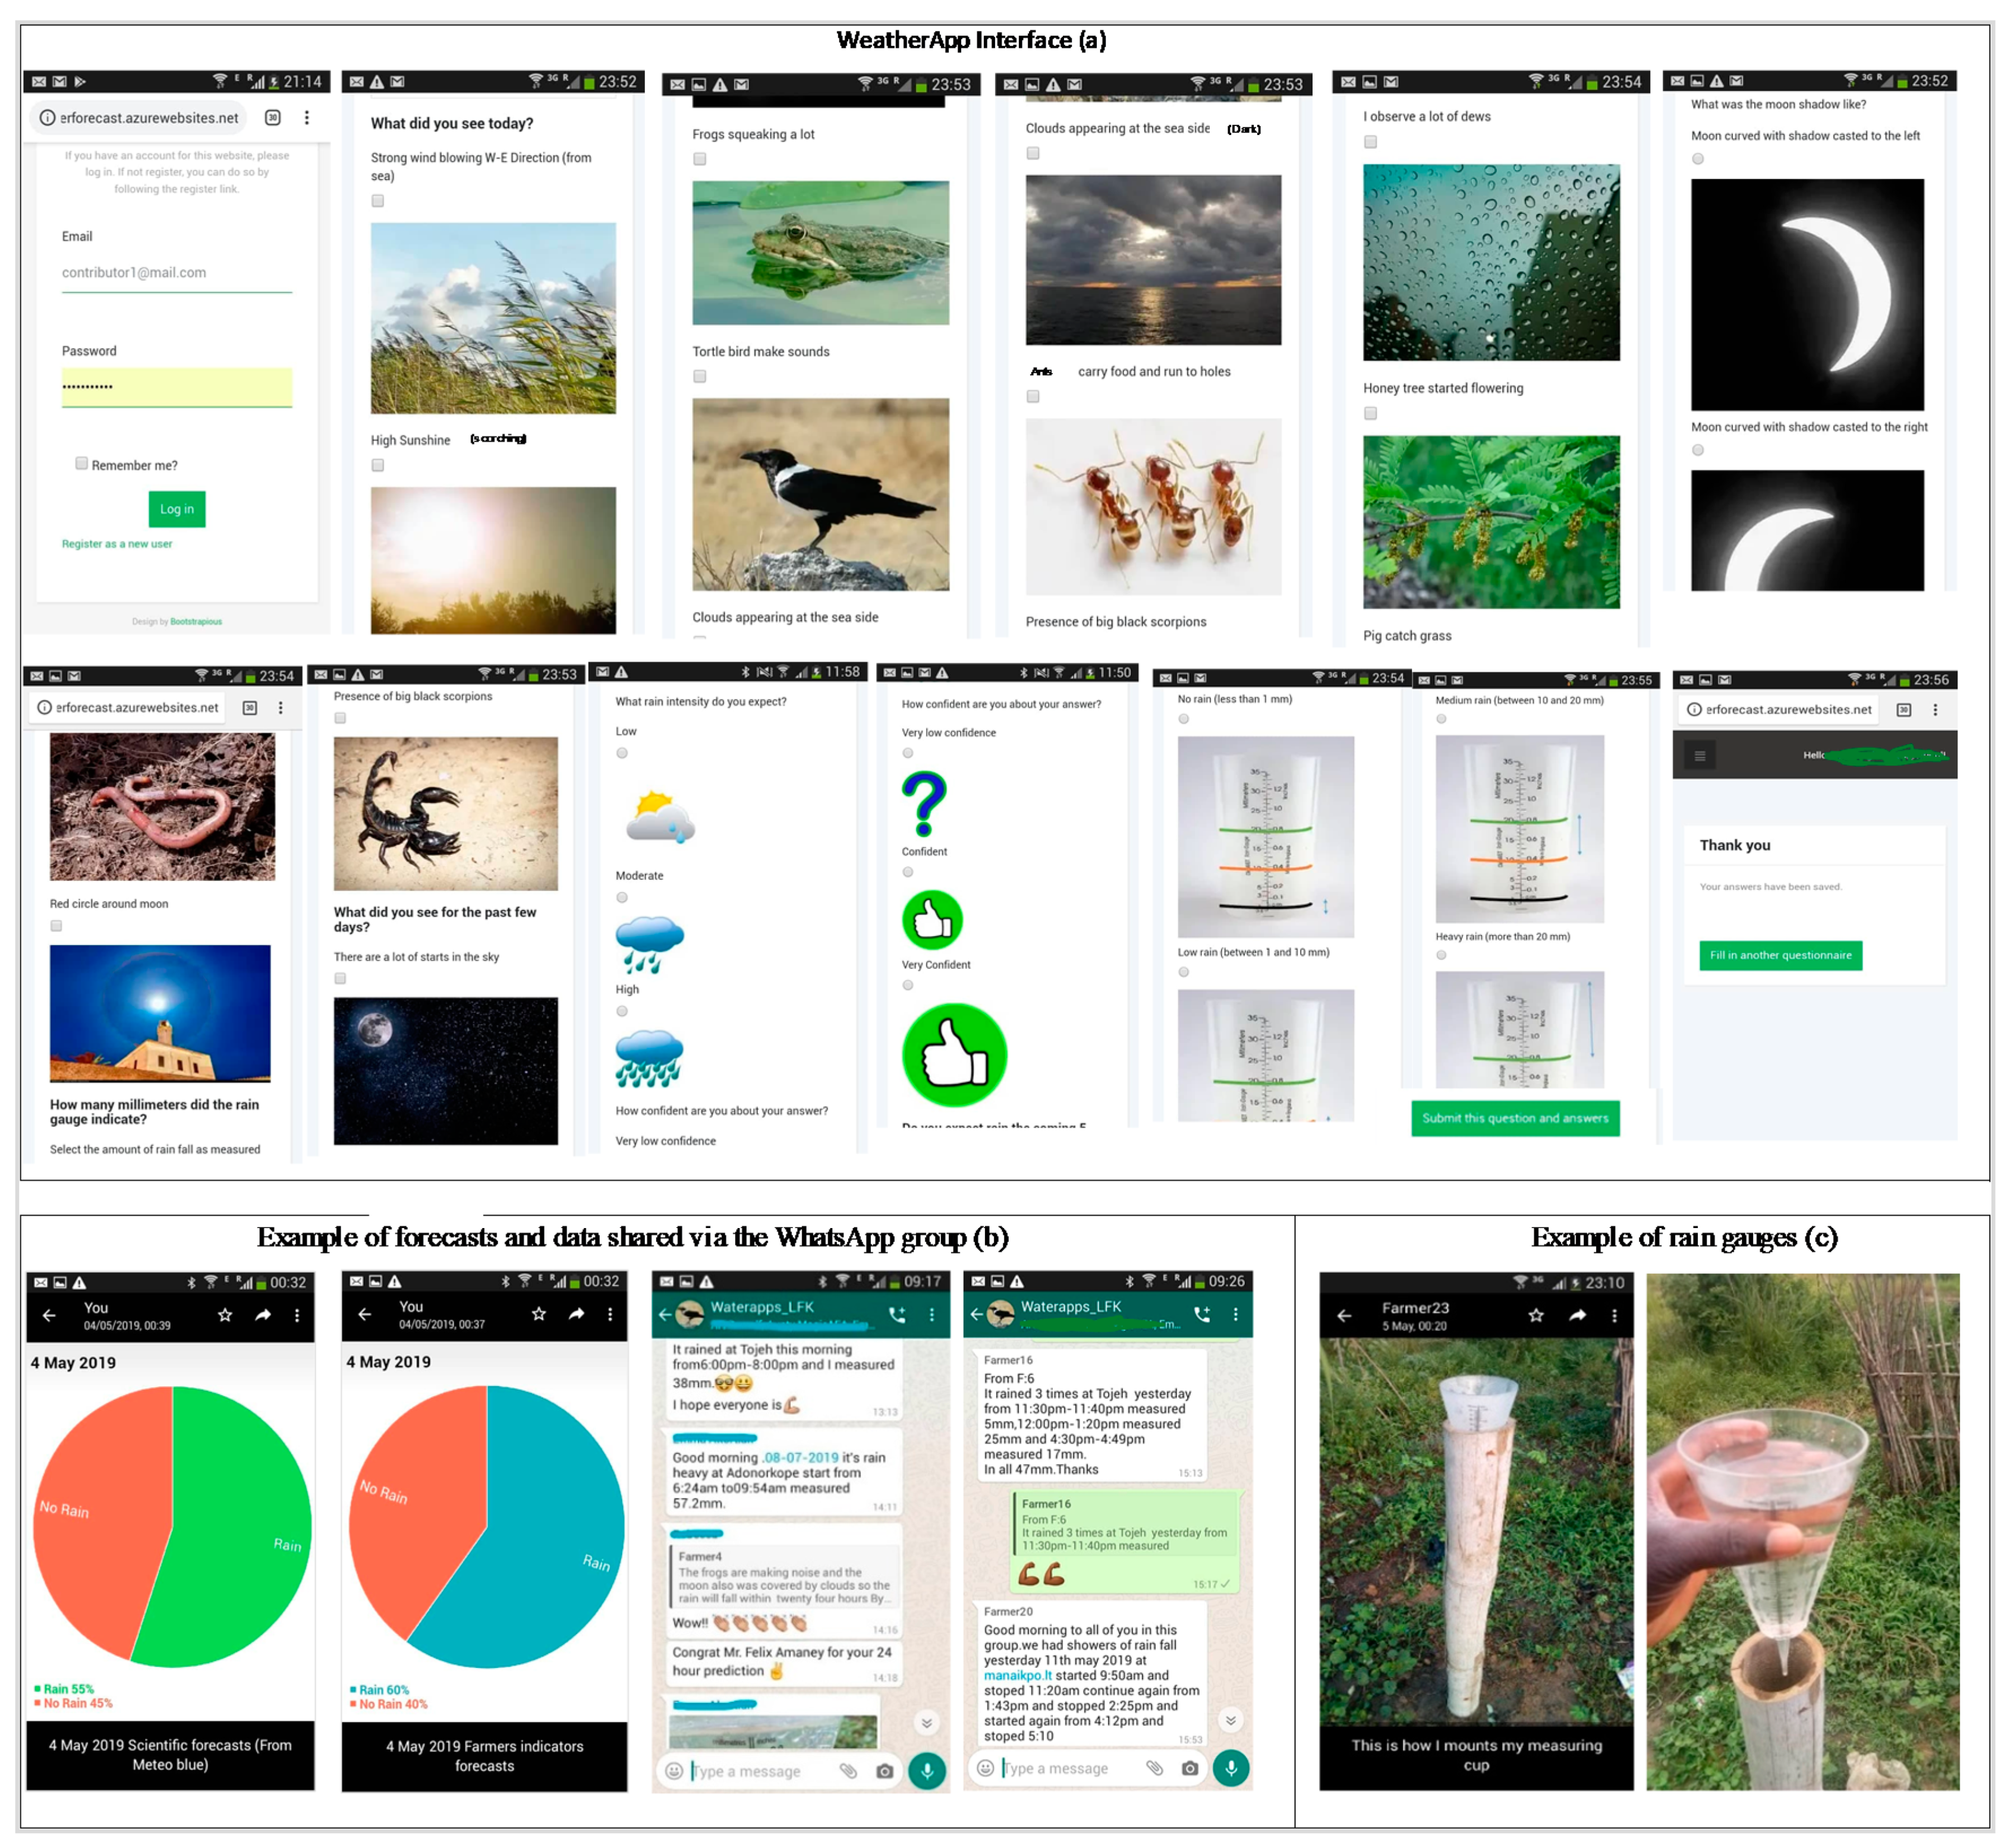
SymbolsSymbols were used for easy selection of options, such as heavy, light, low, or no rain and confidence levels (see Figure 5a).
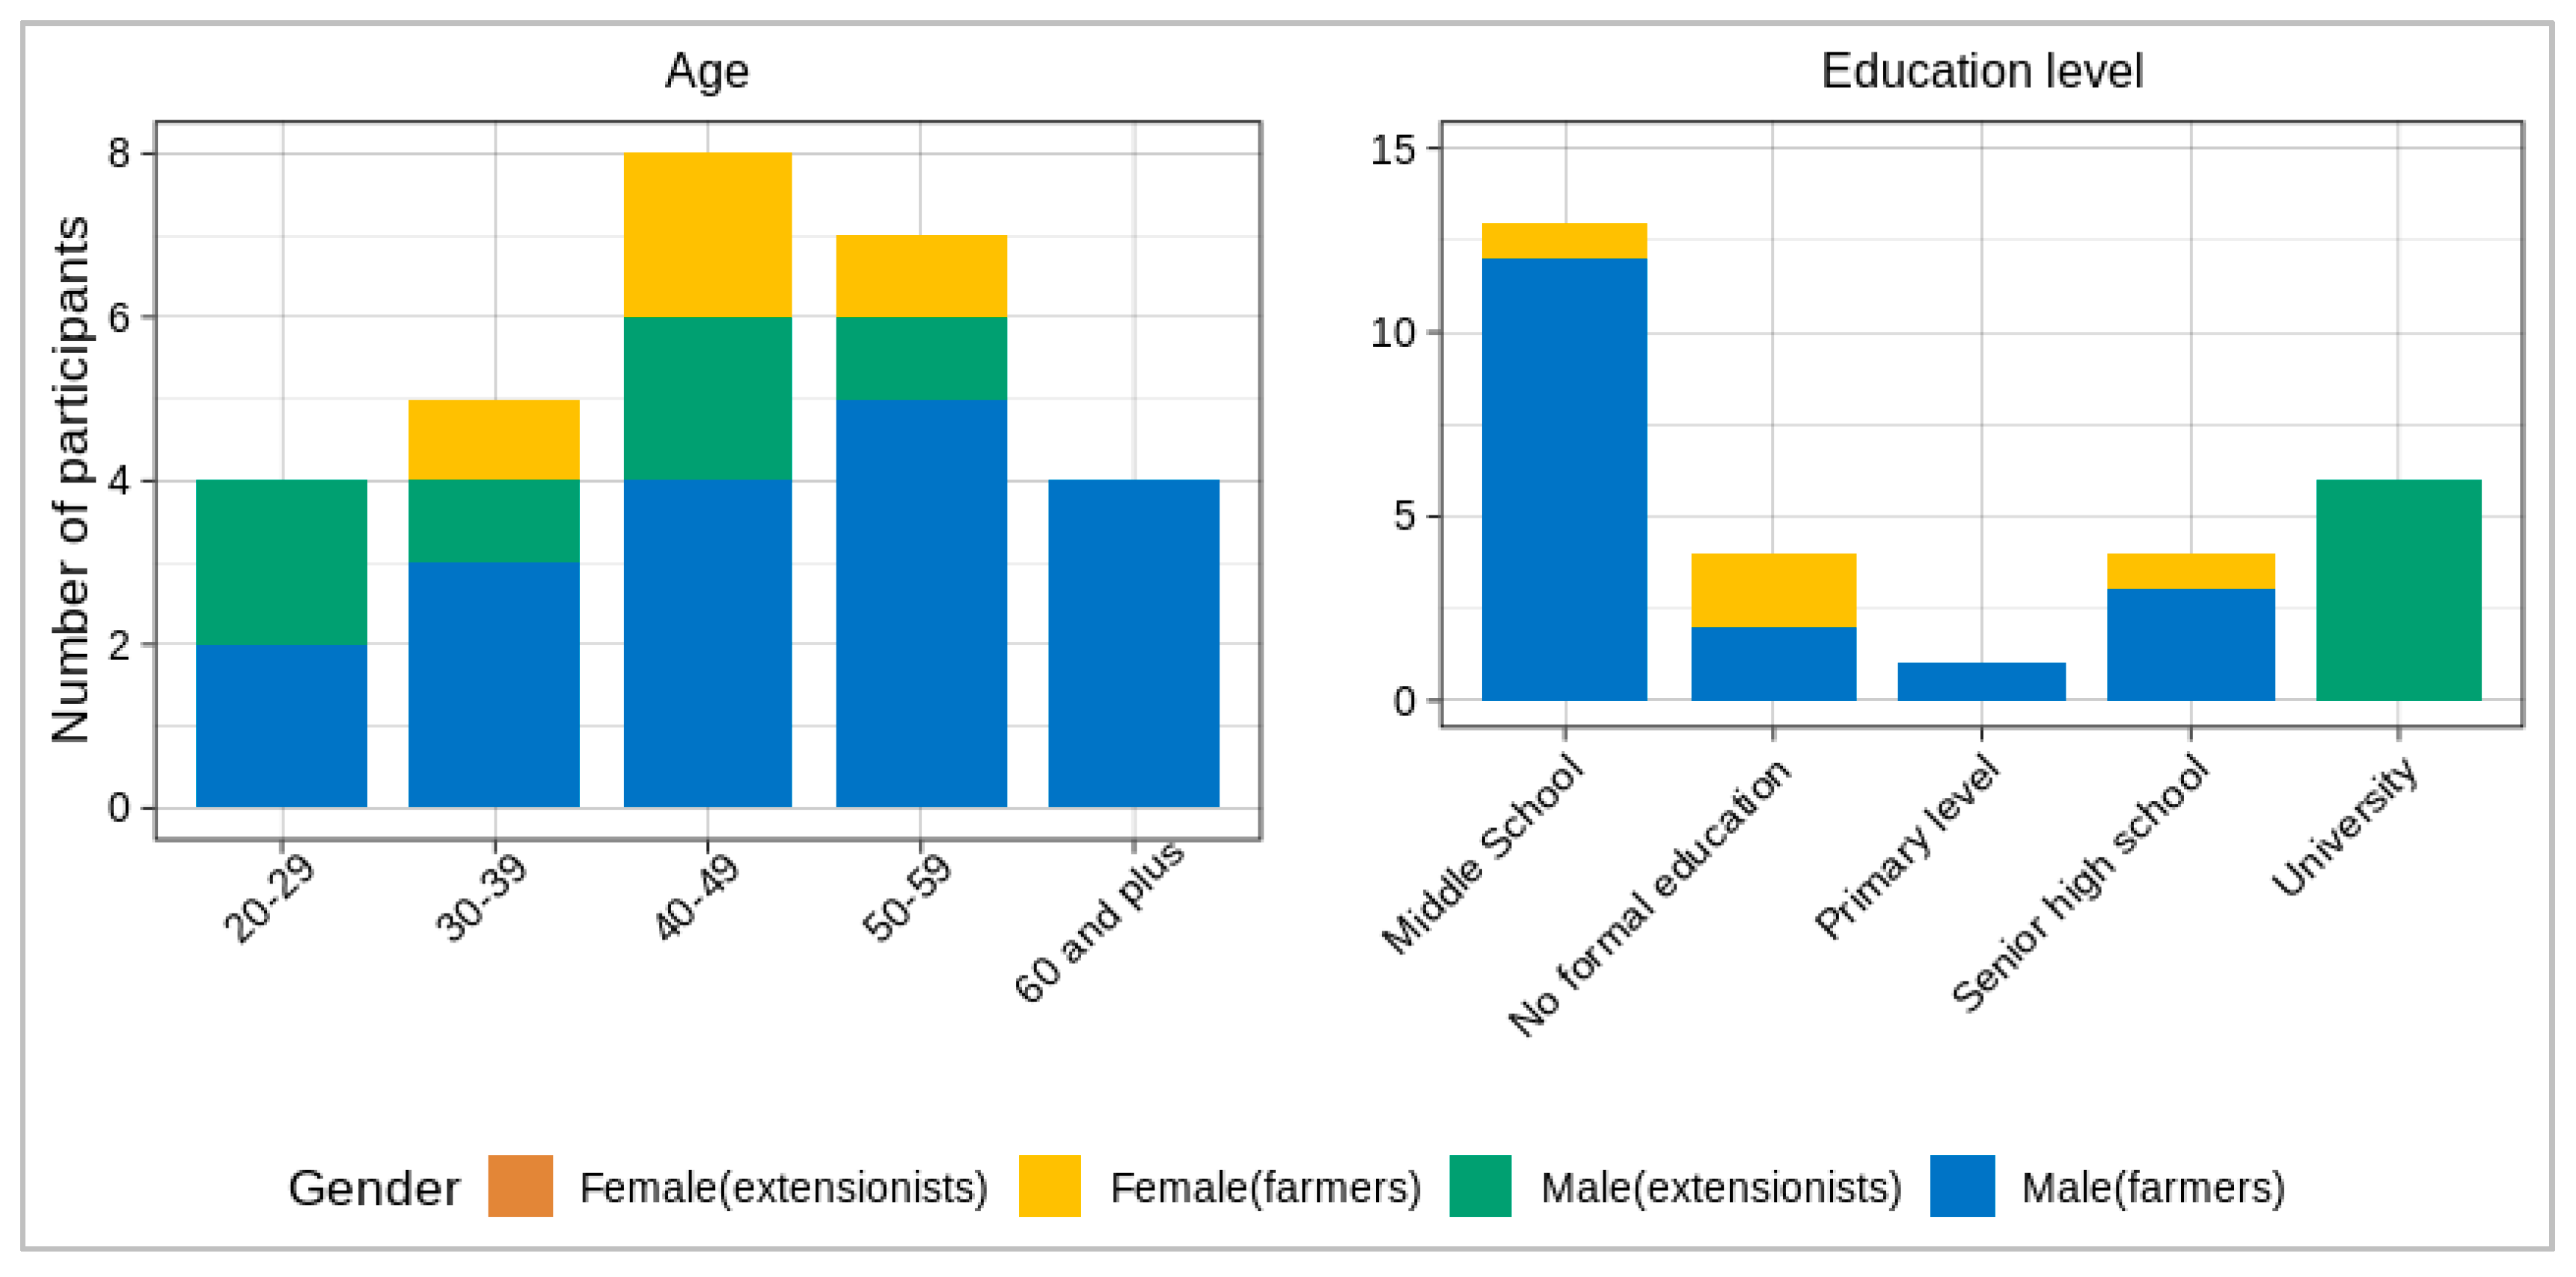
TextMost farmers could read (see socio-demographic details in Figure 3); thus, short phrases were used to describe, for example, signal indicators, rainfall levels, and farmer forecasts.
App manipulationThe app was designed for easy scrolling, selection, and submission of data, with a confirmation message sent upon successful submission. A training session helped farmers to quickly master it.
WhatsApp
(for sharing daily local and scientific forecasts, and daily rainfall data)
Forecast graphsTo illustrate the probabilistic nature of both local and scientific forecasts, simple pie charts were used to show the probability of, for example, rain or no rain (see Figure 5b).
TextChats among farmers, extension agents, and scientists required that each participant be able to read and write. Most farmers could do so. Low-literacy farmers were assisted by relatives at home.
AppmanipulationMost farmers had never used this app; thus, training was provided to help them find the app, launch it, and read and write messages.
Internet
(medium for transmitting digital weather forecasts and data)
Set-up and handlingInternet connections were preconfigured on each smartphone with a subscription from a local provider in Ghana. Farmers were trained in how to turn mobile data on and off.
Rain gauges
(for measuring daily rainfall amounts)
Set-up of manual rain gaugesAn experienced meteorologist from the Ghana Meteorological Agency trained farmers to set up conventional rain gauges on their farms or near their homes (Figure 5c).
Recording of daily rainfall amountsFarmers were trained to record daily rainfall amounts at 9:00 a.m. and to specify the start and end times and dates of each rainfall event
Reporting of daily rainfall amountsFarmers could report the data collected in several ways, including the weather app, WhatsApp, or a notebook (e.g., if internet service was unavailable or the telephone battery was dead).
Table 3. Numbers of farmers reached indirectly, via participants in the coproduction experiment (both farmers and extension agents).
FarmersExtension Agents
Number of participants in coproduction experiment226
Number of farmers with whom forecast information and/or data were shared.350+504+
Table 4. Observations from the monitoring and assistance activities during the testing phase (April–July 2019).
PeriodMonitoring and Technical Assistance Provided during the Testing PhaseObservations from the Monitoring and Assistance during the Testing Phase
Monthly/Weekly
  • Weekly coaching and support for farmers facing technical issues related to the digital tools (e.g., smartphone repairs, replacement of batteries and chargers, work-arounds for internet and app problems).
  • Monthly field visits to check the state of the rain gauges and issues with their set-up, data recording, and reporting (e.g., two broken gauges were replaced and reporting errors were corrected, such as emphasis on the need to specify times that rainfall events began and ended).
  • Renewing monthly mobile data subscriptions for each farmer.
  • In terms of workload, the field visits generated about one day of work per month for the scientists involved. Providing the weekly technical support/coaching generated about a half-day of work per week. Nonetheless, these monitoring and assistance activities were essential to ensure continuous functioning and good use of the tools and to safeguard the quality of the data collected.
  • Reliability of mobile internet service varied across the Ada East District, depending on the geographic location. As a result, some farmers struggled to send their data and interact with the group.
  • The WhatsApp group generated a lot of interaction between the farmers, extension agents and scientists. From 5 April to 17 July 2019, we counted 736 messages, 199 pictures (mainly forecast graphs), and 287 emojis; see illustration in Figure S1 and Table S5, Supplementary Materials).
  • Use of the two separate tools for data collection and group interaction, i.e., the weather app and WhatsApp, respectively, increased the workload in terms of the technical support needed. This set-up also meant that manual processing was required for both the local and scientific forecasts, which was an additional burden on the scientists.
  • A number of notable differences were observed between socio-demographic categories of farmers * (see supporting analyses in Table S6, Supplementary Materials):
    (a)
    Differences by age
    The younger farmers generally had fewer technical difficulties (difficulty ratio of 2.92) in using the tools, compared to older farmers (difficulty ratio of 5.7). Older farmers demonstrated good knowledge and awareness of local forecast indicators.
    (b)
    Differences by literacy level
    The more literate farmers were more adept at using the tools (difficulty ratio of 3.18) compared to the low-literate farmers (difficulty ratio of 5.4)
    (c)
    Differences by gender
    Although there were fewer female farmers (only 4) among the 22 farmer participants, female and male farmers were equally engaged participants (though no female farmers dropped out of the experiment), and women and men reported proportionally very similar levels of technical difficulty (difficulty ratios of 4.22 and 4.0 for male and female farmers, respectively).
April 2019
  • At Monitoring Workshop III (April 2019), we presented and discussed processes for the testing phase involving real-time data collection by farmers and interactions with the scientists:
    Together with the farmers, we learned and planned how they could integrate testing phase activities into their daily activities (e.g., time and frequency of submitting data such as on local forecast indicators and rainfall).
    Farmers expressed concerns regarding practical issues with the tools, which led us to plan the monthly and weekly monitoring and technical assistance activities listed above.
    Farmers could share rainfall data via the WhatsApp group and interact that way with the participating scientists, extension agents, and fellow farmers.
May 2019
  • During Monitoring Workshop IV (May 2019), we reflected on the use of the coproduction tools and introduced the sharing of both local forecasts and scientific model-based forecasts via the WhatsApp group:
    We determined that older and low-literacy farmers were having more difficulties and needed more technical assistance. We decided to pay more attention to them by providing more frequent coaching during the weekly and monthly activities listed above.
    A few farmers had unreliable internet coverage due to their remote location. We advised them to use a notebook to document rainfall data and, if required, local forecast indicators. They could then share the data at a later time when a more stable internet connection was available.
    Farmers were encouraged to interact more on the WhatsApp group, as this seemed to stimulate greater engagement in data collection and sharing.
June 2019
  • During Monitoring Workshop V (June 2019), we reflected on the use of the coproduction tools:
    Difficulties were similar to those identified at previous monitoring workshops, but with fewer technical challenges. Thus, we maintained the same procedures as in May.
July 2019
  • We maintained the same procedures as in June.
(*) These observations are based on expert (participant) observation during the workshops and analysis of technical issue reports.
Table 5. Recommended design criteria or principles (development phase) for creating an effective weather and climate information system (WCIS) with and for smallholder farmers, combining local and scientific-based forecasting knowledge.
Design Criteria Recommendations
(1) Goal of coproduction of a weather information serviceDefining the goal of the WCIS is important for design tailoring. The WCIS designed in our experiment used ICT-based tools and engagement with farmers, extension agents, and scientists to collect local forecasts and weather indicators (with rainfall data for validation), combined with scientific model-based forecasts and group interaction.
(2) User interface of the application (front-end and back-end design)The ICT-based tool should have a simple and clean design with emphasis on visualization. Consensus and visual design facilitate understanding by low-literacy farmers. Additional voice messages can be used to further facilitate farmers’ understanding. The two-way information sharing system (i.e., both sending and receiving data and forecasts) could be integrated within a single application that uses algorithms in the back-end design which automatically process and display forecasts.
(3) Capacity building of both farmers and research scientistsTraining is necessary to learn from farmers and ensure appropriate design, good usage of tools, and the quality of the data collected. Training can be delivered through workshop sessions with farmers.
(4) Monitoring and technical assistance during the development phaseDuring the development phase of the information service, monitoring and technical assistance are important to ensure appropriate use of tools and quality of the local forecast knowledge and data, as well as coaching to keep the participants motivated. Monitoring and technical assistance also helps in detecting problems and making the adjustments needed to solve the technical and non-technical issues that arise.
(5) Sample size of the coproduction participantsSample size is important. At least one farmer should be included from each community targeted. This will help achieve a good distribution of the dataset across the district or area considered. We also learned that availability, knowledge, and engagement are more important for the quality of data than having a large number of farmers. However, the coproduced information can be shared with a larger group of farmers in the district.
(6) Socio-demographic characteristics of the coproduction participantsWe learned that it is important to include both older and younger farmers in the coproduction process and to balance gender as much as possible. This facilitates knowledge harnessing, sharing, and transfer between generations. It is also important to include agricultural and meteorological extension agents in the coproduction process, as they are in contact with a large network of farmers and, thus, can boost sharing of the results.
Table 6. Recommended design criteria or principles (in the scaling-up phase) for creation of an effective weather and climate information system (WCIS) with and for smallholder farmers, combining local and scientific knowledge.
Design Criteria Recommendations
(1) Trade-off between
cost (investment) and quality of intervention
Costs are involved in the acquisition of tools (e.g., smartphones and rain gauges), in providing training sessions, and in monitoring and lending assistance to farmers to ensure appropriate usage of tools and the quality of data and forecasts. To optimize these investments, we recommend intensifying the coproduction intervention within a limited but representative group of farmers and extension agents (see notes on sample size and socio-demographic characteristics in Table 5). This will help ensure the quality of the data and its continuous improvement. The coproduced information can be made available and disseminated publicly in the targeted district.
(2) Dissemination of weather and climate informationThis case study found that extension agents played a key role in dissemination of weather forecast information, as they were in contact with a larger network of farmers. This demonstrates that both farmers and extension agents involved in the experiment can provide a base for sharing knowledge across the communities of the district.
(3) Transferability of the design criteria to other areasThe design principles can be applied to other areas where local or traditional forecasting knowledge exists and can be used to boost uptake of scientific model-based weather and climate information. However, internet coverage is essential for real-time data collection. Moreover, location-specific information needs have to be identified first. Moreover, local forecast indicators will vary from place to place, and need to be identified for each new target community.
(4) Sustainability and inclusivenessRegarding sustainability and inclusive development, it is important to reflect on the way forward with local authorities and to choose together an appropriate approach for scaling up. For example, as a follow-up to this study, we decided together with district authorities to create a business model for development of an app that combines the functionalities of the two apps used in this experiment. That app is now under development and provisionally called “FarmerSupport” (http://www.waterapps.net/en-us/ghana-updates/farmersupport-mobile-app-now-online/).
The coproduction process can be incorporated into the “farmer field school system”, which offers a location-specific environment for intensive, technically rigorous knowledge exchange [53]. Farmer field schools are often supported by a multilevel institutional platform that includes international, national, and sub-national actors. Hence, they can provide a setting and resources for farmers to coproduce and access weather and climate information and related agrometeorological services.

