Article

A National Audit of Typical Secondary School Provision of Physical Education, Physical Activity and Sports in the Republic of Ireland

by
Padraic Rocliffe
1,*,
Brendan T. O’ Keeffe
1,
Ian Sherwin
1,
Patricia Mannix-McNamara
2,3 and
Ciaran Mac Donncha
1
1
Department of Physical Education and Sport Sciences and Health Research Institute, University of Limerick, V94 T9PX Limerick, Ireland
2
School of Education, University of Limerick, V94 T9PX Limerick, Ireland
3
Faculty of Education, Western Norway University of Applied Sciences, Inndalsveien, 28, 5063 Bergen, Norway
*
Author to whom correspondence should be addressed.
Educ. Sci. 2023, 13(7), 699; https://doi.org/10.3390/educsci13070699
Submission received: 23 May 2023 / Revised: 30 June 2023 / Accepted: 6 July 2023 / Published: 9 July 2023

Abstract

:
Evaluating the extent of implementation and variation of typical school provision of physical education, physical activity and sports in the Republic of Ireland is a public health priority. Therefore, a national audit into the different levels of typical school provision of physical education, physical activity and sports was conducted. To date, this has not been evaluated. A cross-sectional, nationally representative sample of 112 secondary schools were included. A school provision of physical education, physical activity and sports evaluation index, validated via a concept mapping methodology, was utilized to measure variation of provision in the context of school personnel, curriculum, facilities and equipment, budget, partnerships, ethos and prioritization. A proposed grade for each indicator of provision was established using an internationally standardized grading system. Overall, physical education was the indicator with the highest national average grade (B−); physical activity was the indicator with the lowest national average grade (D+); while the indicator for sports received a C− grade. An overview of the national averages in terms of provision, paralleled with national and international comparisons and recommendations to support provision, is illuminated for each indicator. Future country comparison and benchmarking on key components of provision is envisaged.

1. Introduction

The importance of engaging in regular physical activity to optimize key health indicators such as obesity, high blood pressure and depression is widely acknowledged [1,2,3]. The World Health Organization’s physical activity recommendations advocate for at least an average of sixty-minutes of moderate-to-vigorous physical activity daily across the week for adolescents [4]. Despite this, prevalence of physical inactivity is high, with just 19% of adolescents globally meeting the aforementioned guidelines [5]. Further to this, physical inactivity is estimated to cost USD 27.4 billion annually [4]. Strategies to reduce physical inactivity include “The Global Action Plan for Physical Activity 2018–2030”, which targets a 15% reduction in the prevalence of physical inactivity by 2030 [6]. Nationally, the Republic of Ireland falls below the global average, with just 10% of adolescents meeting the physical activity guidelines [7]. Strategies to reduce physical inactivity include the National Physical Activity Plan for Ireland, which targets an increase of 1% per annum in the proportion of adolescents meeting the World Health Organization physical activity recommendations and a decrease of 0.5% per annum in the proportion who do not engage in weekly physical activity [8]. A key contribution toward lowering physical inactivity, noted in the recent National Physical Activity Plan review, was the development and implementation of “Get Active, Physical Education, Physical Activity and Sport for Children and Young People: A Guiding Framework” to oversee the promotion of physical activity via in-class and co-curricular school activities [9].
Adolescents spend a high proportion of their waking day in schools which consequently have been identified as a cost-effective investment and key contributor to engagement in physical activity for health [10]. Due to some empirical evidence supporting the impact of typical school provision of physical education, physical activity and sports on adolescent physical activity behaviors [11,12,13,14,15,16,17], wellbeing [18,19,20,21,22,23,24,25] and health [26,27,28,29,30,31,32,33,34], various strategies have been put forward to further utilize schools as primary vehicles to promote physical activity and health. The International Society for Physical Activity and Health’s (ISPAH) “Eight Investments that Work for Physical Activity” acknowledges a systems-based, whole-of-school approach to best practice and was devised in response to the both the aforementioned empirical evidence and the Global Action Plans targets to reduce physical inactivity [35]. Here, a whole-of-school approach is regarded as a key investment to provide maximal opportunities to engage in physical activity for health including physical education, extra-curricular activities, active classroom breaks, active recess, active transport and school sports. However, it must be acknowledged that while there is growing evidence to support a whole-of-school approach to promote physical activity, there are limited empirical studies that investigate variation in its provision; rather, components of a whole-of-school approach are often examined in isolation [10,35]. Therefore, examining a whole-of-school approach to typical school provision of physical education, physical activity and sports is paramount. The implementation of a whole-of-school approach is further embodied by the World Health Organizations guiding principles that include the concept of “Health Promoting Schools” [6]. A health-promoting school is considered “a school that is constantly strengthening its capacity as a healthy setting for living, learning and working” [36] (p. 1). Nationally, the concept of a health-enhancing school is the blueprint of key physical activity for health-promoting strategies to enhance overall quality of provision in the Republic of Ireland [37,38].
In the context of the current study, “typical” refers to what happens in most schools with no noticeable deviation from the norm. Provision “refers to the underpinning structures and activities involved in providing the physical education curriculum and opportunities for physical activity and sports participation in secondary schools” [11] (p. 3). The breadth and depth of provision reflects the available resources and alignment with the national curriculum and the ethos of the school. Within the framework of typical school provision of physical education, physical activity and sports, Sport Ireland’s Children’s Sport Participation and Physical Activity Study 2018 (CSPPA) highlights an array of shortfalls [7]. It is estimated that 23% of secondary schools met the Department of Education and Skills physical education requirements of 120 min per week. While this is a 13% increase from CSPPA 2010, it still falls significantly below the global average of 77% that adhere to implementation regulations for physical education [39]. Furthermore, CSPPA found a 10% reduction in adolescents who engaged in school sports, with 63% participating at least once a week and a 14% increase in adolescents who never participate in school sports. Similar trends were found on Ireland’s north and south report card for physical activity in children and youth that illuminated a decrease in extra-curricular activities from a Grade C− to a grade D with just 43% participating in school based extracurricular activities [40,41].
Despite the adoption of policy to potentiate positive impact regarding a systems-wide, whole-of-school approach to physical activity for adolescent health, paralleled with significant global and national investment, the extant literature suggests that adolescent physical activity levels remain low [4,9].Therefore, it is necessary to conduct a national, systems-wide evaluation of typical school provision of physical education, physical activity and sports that is underpinned by the following study objectives: (1) evaluate the extent of implementation and variation of typical school provision of physical education, physical activity and sports in the Republic of Ireland; (2) consider key findings in the context of national and international comparisons, implications and future recommendations; (3) provide government officials with a proof of concept for the national rollout of the provision evaluation index and evidence for modification of existing provision to potentiate positive impact; (4) provide an impetus for country comparison and benchmarking on key components of provision.

2. Methods

2.1. Participants

Research ethics approval for this study and the associated protocols was granted by the research ethics committee of the Faculty of Education and Health Sciences, University of Limerick, Ireland. A representative sample of 112 secondary schools (15% of the national total), were recruited via stratified random sampling based on school type (single sex boys, single sex girls, mixed-sex schools), size (small >300 pupils, medium 300–800 pupils, large >800 pupils), state demographic (Leinster, Munster, Connacht, Leinster) and social–economic status (DEIS status versus non-DEIS status). DEIS refers to the Delivery Equality of Opportunities in Schools. The physical education teacher from each school participated in completing the provision evaluation index. Participants were required to answer each item in the provision evaluation index to minimize non-response bias and subsequent missing values. All respondents for the participant sample remained anonymous; however, demographic details obtained included the school roll number which was necessary in order to implement a follow-up study to establish the impact of different levels of typical school provision of physical education, physical activity and sports on adolescent physical activity behaviors, health and wellbeing. Additional respondent demographic survey items included gender, employment status, qualifications, role and years teaching. The demographic profile associated with the participant sample is summarized in Table 1.

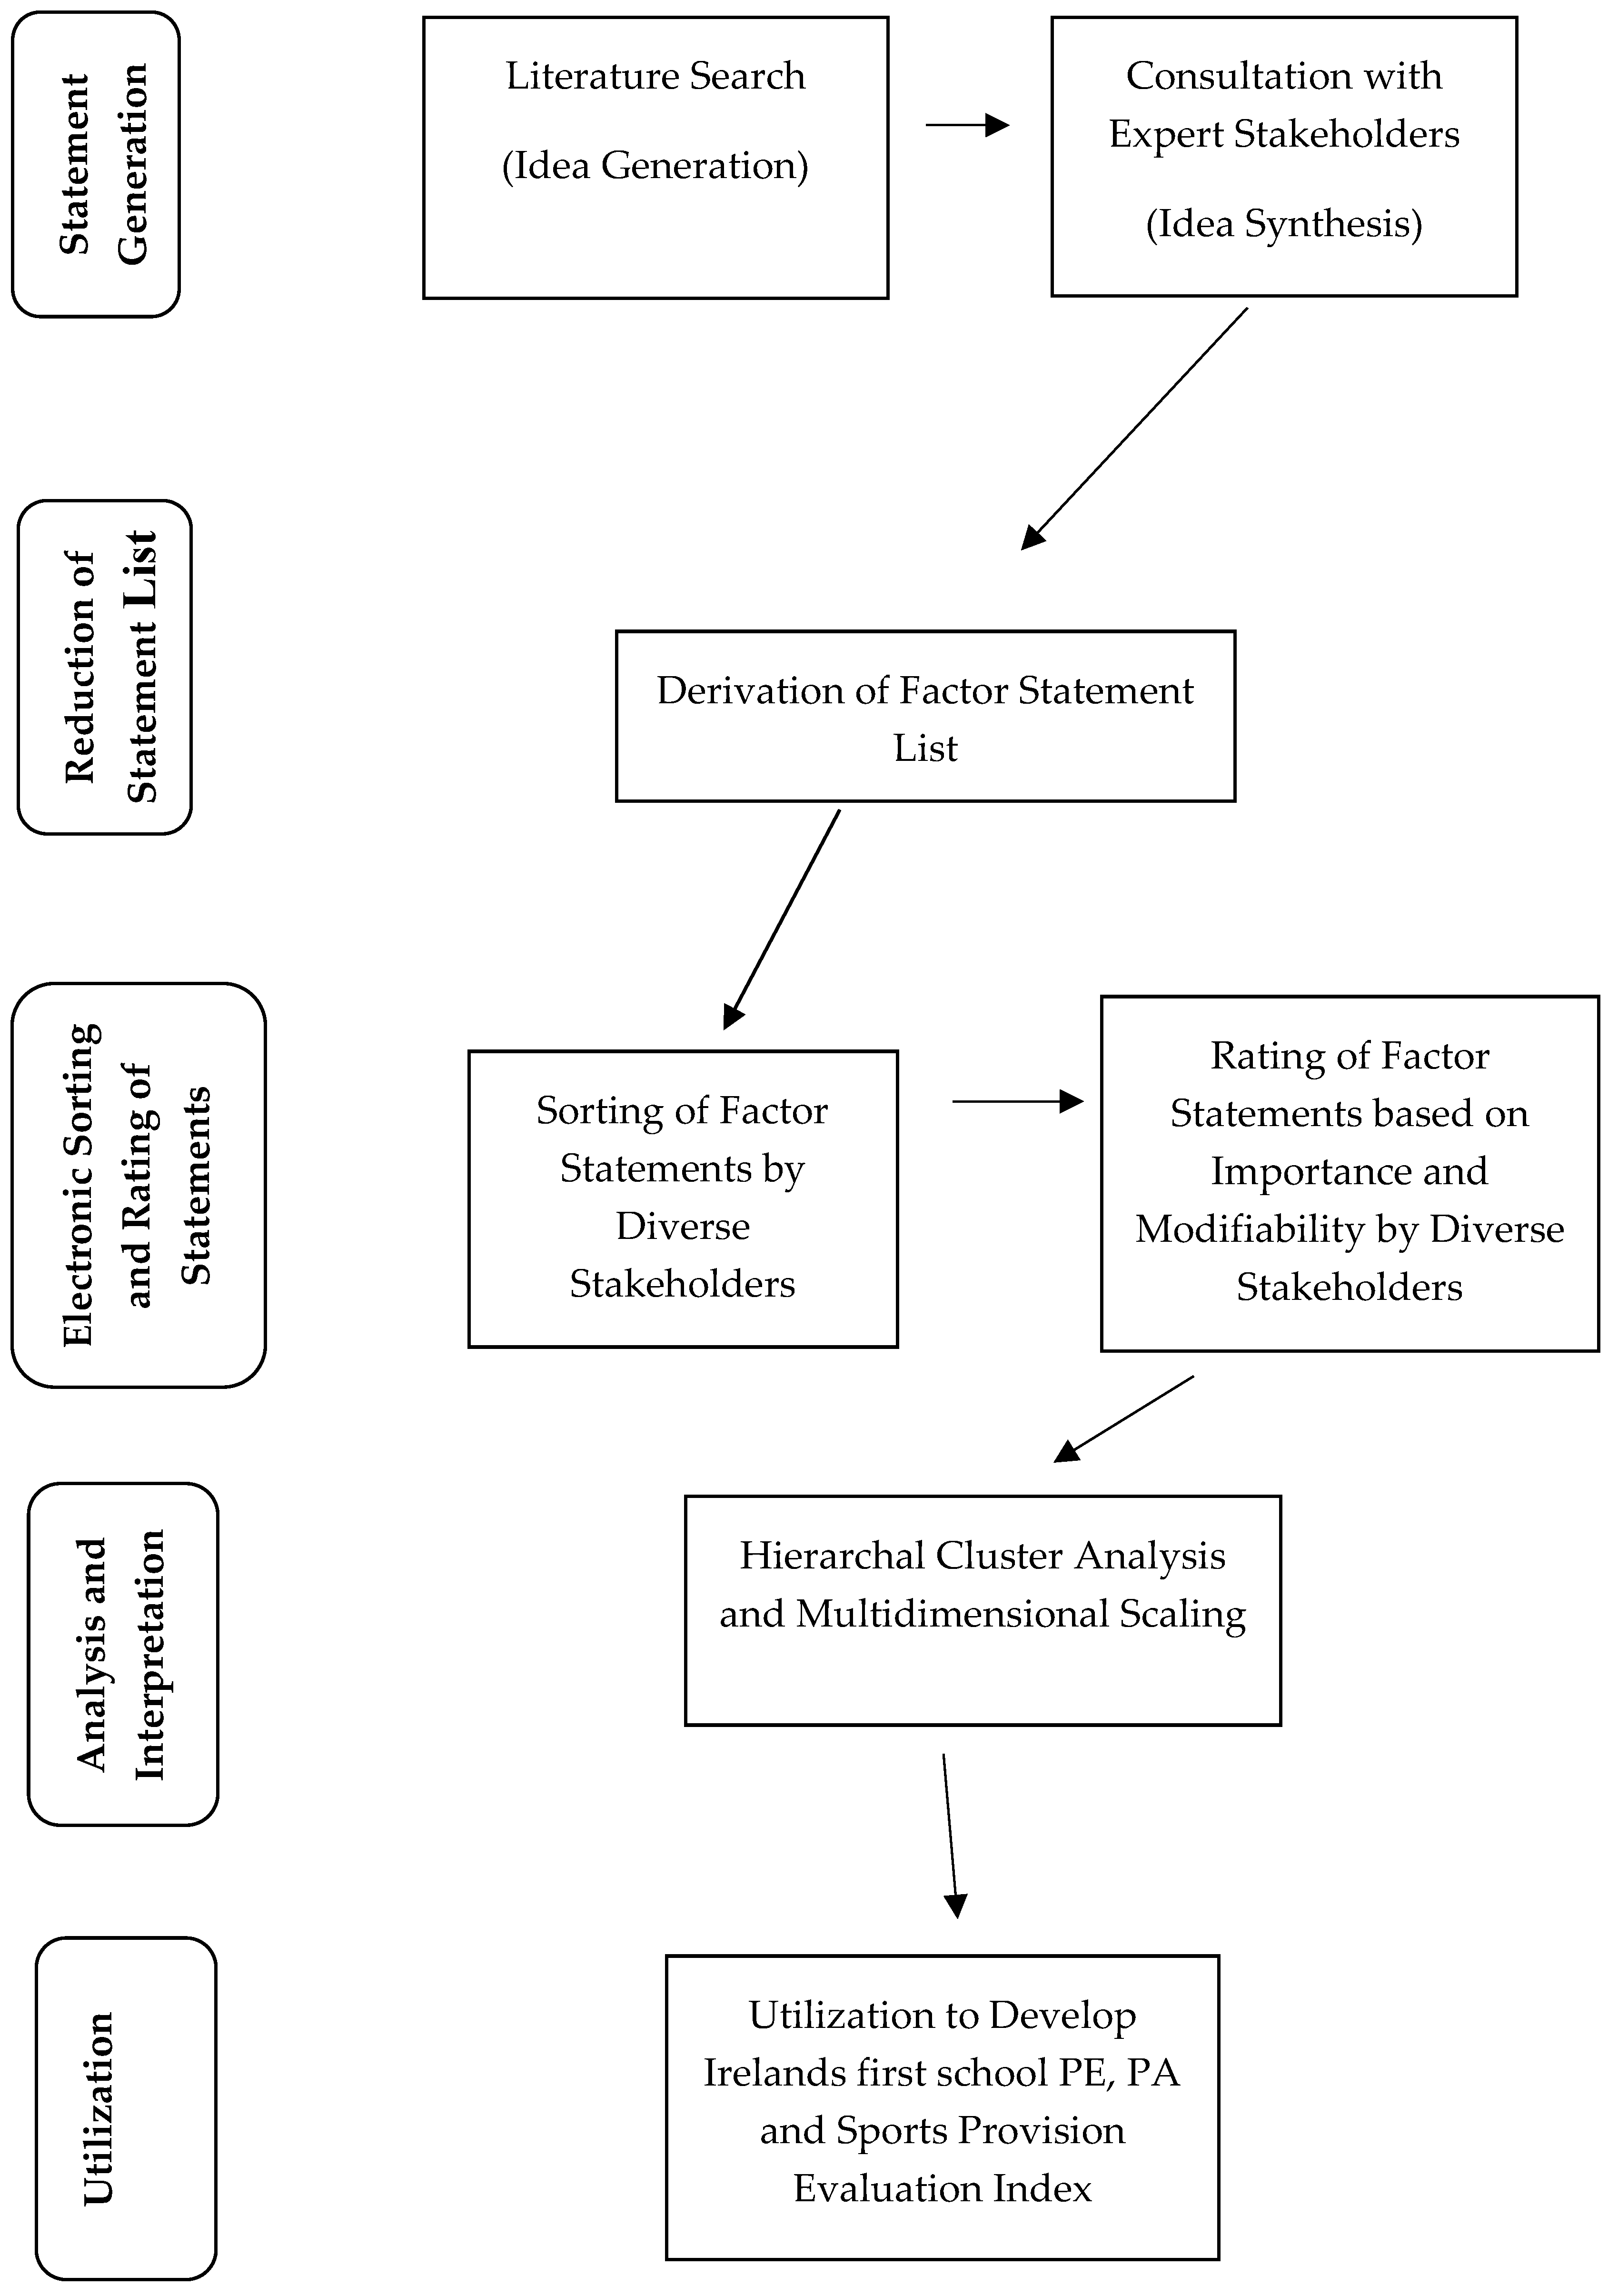
2.2. Development of the Provision Evaluation Index

A concept mapping methodology involving the generation of factors relevant to school physical education, physical activity and sports provision and their subsequent thematic and numeric rating and sorting was utilized to underpin the development of the provision evaluation index [42]. Concept mapping is a standardized procedure that initially requires expert stakeholders to engage in brainstorming exercises, idea generation and idea synthesis [43] to identify a comprehensive list of relevant factors underpinned by the topic of interest (e.g., factors which impact school physical education, physical activity and sports provision). Subsequent tasks require a larger group of participants to rate these factors based on importance and modifiability and sort these factors into clusters that are meaningful to them. Respondents were multi-disciplinary, including physical education teachers, school principals and support staff, undergraduate and postgraduate physical education students, and national and international experts in the field. The data acquired through the brainstorming, rating, and clustering of relevant factors underpinned by provision were essential to integrate multi-disciplinary stakeholder knowledge and experience into the conceptualization of the provision evaluation index.
A number of physical education, physical activity and sports indicators emerged from the concept mapping exercise that were then utilized as key components in the provision evaluation index. Each indicator evaluated school physical education, physical activity and sports provision including school, personnel, curriculum (physical education, physical activity and sports), facilities and equipment, budget, partnerships and ethos and prioritization. Provision evaluation index items included multiple choice, ordinal scale, interval scale, ratio scale and open- and close-ended question types. Participant response formats aligned with each question type. A detailed description of the methodological approach used to inform the development of the provision evaluation index can be found in Rocliffe et al. [44].
A review team of 10 participants with multi-disciplinary physical activity backgrounds piloted and evaluated the provision evaluation index in advance of utilizing it in the current study. The inclusion of the review team was strengthened by their level of expertise in the area of school physical education, physical activity and sports, and included head physical education teachers, undergraduate and postgraduate physical education students and experts in the field. A 5-point Likert scale (1 = unclear, 5 = clear) was utilized to evaluate each item based on representativeness, rateability and saturation of the topic area. In addition, the review team assessed the time to completion. Furthermore, the review team recorded comments on the relevancy and flow of the items. Aligning with thresholds underpinned by O’Keeffe et al., items with an evaluation score of below 3 were amended to enhance clarity or were completely removed [45]. The final draft of the provision evaluation index was approved by two authors (PR, CMD). Figure 1 illustrates the successive milestones in the group concept mapping methodology used to inform the development of the provision evaluation index. In addition, the provision evaluation index can be sourced via the Supplementary Files included in this manuscript.

2.3. Procedure

This cross-sectional study utilized Qualtrics online software to distribute the provision evaluation index. The Irish education system encompasses three tiers: primary school (aged 5–12), secondary school (aged 12–18) and third-level institutes (18+). In secondary schools, physical education is a requirement. In addition, the Department of Education and Skills advocates for two hours weekly physical education for secondary schools. As of 2022, there were 723 secondary schools registered in the Republic of Ireland. An invitation to participate, outlining the aims and objectives of the study, was circulated to the school principals in order to obtain consent. Second, the provision evaluation index web link was distributed to the head physical education teacher for completion during school time. Informed consent was embedded in the provision evaluation index web link and was indicated by checking the appropriate box. Participants were permitted to exit the provision evaluation index web link at any point should they have wished to depart the study. A total of four individual data collection points were conducted, one week apart, and the timeframe for completion was approximately 3 weeks for each school. Non-response bias was minimized where possible, utilizing a reminder email to participants in week two and three on each data collection point. The school roll number was utilized as a unique identifier code to track response rates and target non-responders.

2.4. Analysis

Complete responses were extracted from Qualtrics and uploaded to IBM Statistical Package for the Social Sciences 28 for analysis. For the purpose of this study, incomplete data were defined as having 10% or more of the provision evaluation index incomplete. Subsequently, all 112 data points were deemed complete for the analyses. Descriptive statistics including means and standard deviations were calculated for each indicator of provision. The higher the score, the higher the level of school physical education, physical activity and sports provision. Considering that the demographic profile of the participants consisted mostly of multiple groups of uneven sample sizes (school type, size, location), a one-way ANOVA with Tukey post hoc test was performed to examine the variation in demographic profile (independent variable) relative to the indicators of provision (dependent variable). Variables were examined for the existence of outliers. The impact of outlier removal was established by administering a one-way ANOVA with outliers included and all outliers removed. Some variation in F statistics and p values were noted; however, overall significance trends did not change. To respect the required assumptions for one-way ANOVA and also to moderate the impact on other assumptions (e.g., normality), it was deemed appropriate to remove the two most extreme outlier values from either end of the data distribution of each provision indicator. A Shapiro–Wilk test and Kolmogorov test was used to test for normality. In the case where the assumptions for normality were not met, a non-parametric Kruskal–Wallis test was used to confirm the conclusion of the one-way ANOVA. Homogeneity of variance was established using the Levene’s test of equal variances. In the case where the assumption of homogeneity of variance was violated, an equivalent Welch ANOVA was used and associated Games–Howell post hoc test. An independent t-test recorded variation in the demographic profile associated with DEIS status. The alpha level was set at p > 0.05. Aligning with thresholds underpinned by Harrington et al., a proposed grade for each indicator of provision was established using an internationally standardized grading system [40]. Grades from A to F (including “+” or “−”) were assigned to each indicator with an incomplete (“inconclusive”) grade being made available if there was incomplete, insufficient or inadequate information to assign a grade. A grade “A” indicated that we are succeeding with the provision of school physical education, physical activity and sports for a large majority of adolescents; a grade “B”, for well over half of adolescents; a grade “C”, for about half of adolescents; a grade “D”, for less than half of adolescents; and a grade “F”, with very few adolescents.

3. Results

3.1. Demographics

A total of 112 physical education teachers (47.3% male) from 112 secondary schools completed the provision evaluation index (15% of the national total). Respondents were representative of school size (25% small; 54.5% medium; 20.5% large), school type (18% girls; 16% boys; 66% mixed), state demographics (45% Leinster; 33% Munster; 16% Connacht, 5.4% Ulster) (Census, 2022) and social–economic status (24%), or what is referred to in the Republic of Ireland as DEIS status (Delivering Equality of Opportunities in Schools). The participant’s overall average teaching experience was 11.7 years (±8.9). Grades according to school physical education, physical activity and sports indicators are reported in Table 2.

3.2. Personnel: INC

Almost all schools had one full-time staff member (99.1%) or more contributing to physical education provision. A quarter of schools (27.7%) had zero full-time staff members contributing to school physical activity. Approximately one in ten schools (8.9%) had zero full-time staff members who contributed to school sports. A quarter of schools (26.8%) had 10 or fewer full time part time and voluntary personnel who contribute to physical education, physical activity and sports. Over a quarter of schools (28.6%) had at least one or more qualified teachers with no physical education specialization teaching physical education. Four in ten schools (38.4%) had at least one person without a teaching qualification involved in the provision of sports. Three quarters of schools (77.7%) indicated that qualified teachers with no physical education specialization were involved in the provision of extracurricular physical activity. Three in ten (29.5%) schools had at least one person without a teaching qualification involved in the provision of extracurricular physical activity. A total of 87.5% of qualified teachers with physical education specialization provided one or more extracurricular physical activities weekly. Three quarters of qualified teachers (73.2%) without physical education specialization offered one or more extracurricular physical activities weekly, and three in ten (29.5%) without any teaching qualification offered one or more extracurricular physical activities.

3.3. Curriculum: − (47.90%)

The three subscales that define the indicator on curriculum (physical education, physical activity and sports) are described below.

3.3.1. Physical Education: B#x2212; (63.73%)

The average physical education teacher-to-student ratio was 1 teacher to every 180.38 pupils. A total of 27.7% of schools implement Leaving Certificate physical education, while 51.8% have no plan to implement. Two thirds of schools last received a Department of Education physical education inspection 6–10 years (37.5%) or 11–15 years (31.3%) ago. Three in five schools (61.6%) indicated there was no formal classroom-based classroom assessment of Junior Cycle physical education, while just 12.5% indicated that there was formal classroom-based assessment of Senior Cycle physical education. A total of 75.9% of first years, 80.4% of second years, 87.5% of third years, 66.1% of fourth years, 89.3% of fifth years and 92% of sixth years failed to meet the Department of Education physical education recommendations (2 h weekly). Junior cycle physical education is compulsory for 99% of class groups, while Senior cycle physical education is compulsory in 86% of class groups. On average, 39% of schools indicated that 10% of more of senior cycle students did not regularly participate in physical education class. At least one in every three schools indicated that physical education did not enjoy a similar status to other subjects in the school (36.5%), and physical education classes were more likely to be cancelled than other subjects (38.4%). A detailed description of the physical education activities with the highest and lowest provision, and the range of activities provided, are summarized in Table 3. Figure 2 illustrates the percentage of pupils meeting the Department of Education physical education recommendations by year group.

3.3.2. Sports: − (42.79%)

Approximately one in ten schools (11.6%) charge their students a fee to engage in school sports. Regular collaboration between the schools’ sports teams and physical education department rarely or never took place in approximately one in ten schools (12.6%). A total of 43.8% of schools offered between 1–5 h of sport per week in comparison to 18.8% who offered 15 h of more per week. In terms of school sports competitions, 59.8% do not hold school sports competitions outside of school hours and 75.9% do not hold school sports competitions on the weekend. Almost one in three schools rarely or never catered for individuals with movement challenges in school sports competitions (30.3%). Two fifths of schools were awarded a grade D (29.7%) or F (10.7%) for junior cycle boys’ participation in school sports, and over half of schools were awarded a grade D (28.7%) or F (25%) for junior cycle girls’ participation in school sports. One in two schools were awarded a grade D (28.6%) or F (21.4%) for senior cycle boys’ participation in school sports, and almost three quarters of schools were awarded a grade D (25.9%) or F (46.4%) for senior cycle girls’ participation in school sports. A detailed description of the sports activities with the highest and lowest provision, and range of activities provided, are summarized in Table 3.

3.3.3. Physical Activity: D+ (37.19%)

Over half of schools (56.3%) rarely or never use physical activity in non-physical education subjects to facilitate learning, and a third of schools (38.4%) rarely or never implement break time activities. A total of 46.4% of schools rarely or never provide extracurricular physical activity in addition to physical education and sports. In total, 48.2% of schools indicated that they rarely or never promote active transport to and from school, and 83% rarely or never formally organize active transport. Over half of schools were awarded a grade D (12.5%) or F (40.2%) for junior cycle boys’ participation in school extracurricular physical activity, and two in three schools were awarded a grade D (20.7%) or F (47.3%) for junior cycle girls’ participation in school extracurricular physical activity. Two thirds of schools were awarded a grade D (19.7%) or F (45.5%) for senior cycle boys’ participation in school extracurricular PA, and almost three quarters of schools were awarded a grade D (14.3%) or F (60.7%) for senior cycle girls’ participation in school extracurricular physical activity. One in six schools (15.2%) offer 0 h of extracurricular physical activity weekly, while 57.1% of schools offered between 1–5 h per week, in comparison to 27.7% who offered more than 5 h per week.

3.4. Facilities and Equipment: C+ (58.95%)

One in five schools have a space of two badminton courts or less (21.4%), while 6.3% have no indoor spaces at all. Over one in two schools (56.3%) have at least one tarmacadam (i.e., uncovered stone surfaces used for physical activity) space, while 16.1% have no tarmacadam space at all. In total, 83% of schools indicated they had no athletics track and 54.5% have no outdoor all-weather surface. Similarly, over a quarter of schools (25.9%) have no grass pitch. Almost half of schools (45.5%) have no safe regulated ways for active transport, and a further two thirds of schools (66.1%) have no facilities to accommodate active transport. One in two schools (52.7%) were not permitted to use school facilities and equipment outside of school time. A total of 49.1% of school’s half the hall space during scheduled physical education with another physical education class. Almost two thirds of schools (62.5%) have no access to a swimming pool in their community, and almost one fifth of schools (18.8%) do not maintain their facilities and equipment on a regular basis.

3.5. Budget: C+ (58.95%)

Two fifths of schools feel the Republic of Ireland Department of Education budget attained is poor (18.8%) or inadequate (22.3%) and that the percentage allocated from the school towards physical education, physical activity, and sport is also poor (19.6%) or inadequate (19.6%). Similar statistics indicate schools feel that additional sources of the budget (non-department of education) are poor (18.8%) or inadequate (19.6%) and that the percentage allocated from the school towards physical education, physical activity and sport is also poor (18.8%) or inadequate (17.9%). For past investments made by the school in indoor facilities, almost a third of schools indicated that this is poor (9.8%) or inadequate (19.6%), while investment in outdoor facilities is also considered poor (16.1%) or inadequate (17.1%). Over one in every six schools deem investment in indoor equipment as poor (8.9%) or inadequate (7.1%), while one in every three schools found investment in outdoor equipment to be poor (24.1%) or inadequate (12.5%).

3.6. Partnerships: − (47.32%)

One in two schools (52.7%) indicated they rarely or never engage with parents to promote participation in school physical education, physical activity and sports. In the past five years, three in five schools indicated that support from the Department of Education (58.1%) and higher education institutions/research centres (61.6%) for continuous professional development to improve school physical education, physical activity and sport provision rarely or never took place. In the past five years, one in two schools indicated that support from national governing bodies with respect to contributing to teaching pupils during physical education (57.1%) and organizing extracurricular physical activity and sports events (47.3%) was rarely or never received. In the past five years, between 6 and seven out of 10 schools indicated that inter-school collaboration with respect to physical education (64.3%), physical activity (72.4%), sports (62.5%) facilities (71.4%) and equipment (76.8%) rarely or never took place.

3.7. Ethos and Prioritization of Physical Education, Physical Activity and Sports: C+ (58.41%)

Approximately one in five schools awarded themselves a grade D or F for the importance placed on participation and promotion of physical education (10.8%; 7.1%) and sports (8.1%; 8.9%). Approximately two in five schools awarded themselves a grade D (18.8%) or F (19.6%) for the importance placed on participation and promotion of physical activity. Almost a third of schools awarded themselves a grade D (22.4%) or F (8.9%) for the provision of accessible physical education opportunities for students with disabilities. One in every five schools awarded themselves a grade D or grade F for provision of indoor sport (14.3%; 8.9%), range of school sports (12.5%; 9.8%) and sports clubs for females (12.5%; 10.7%). Two in five schools awarded themselves a grade D (20.6%) or a grade F (19.6%) for the provision of active recess. Over three in five schools awarded themselves a grade D (19.6%) and F (43.8%) for the provision of active transport, and over half awarded themselves a grade D (22.3%) and grade F for (29.5%) for the provision of active classroom breaks.

3.8. Differences between School Demographic Variables for Each School Physical Education, Physical Activity and Sports Provision Indicator

Descriptive statistics including means and standard deviations for each indicator are included in Table 4. Significant main effects among the school demographic variables (independent) and indicators of school physical education, physical activity and sports provision scores (dependent) were established (Table 5). In 24 cases, a total of 9 significant main effects between school demographics and the indicators of provision scores were found. Significant differences within the variable on school size was found in all but one of the provision indicator scores and accounted for 55.5% of the total significant main effects. Table 5 and Table 6 provide further details on the significant differences between school demographic variables for each indicator of provision and associated Tukey post-hoc analysis.

4. Discussion

A national audit into the different levels of typical school provision of physical education, physical activity and sports in the Republic of Ireland is a public health priority. While the World Health Organization recommends a systems-wide, whole-school approach to physical activity promotion, to date, a systems-wide evaluation of the extent of implementation and variation of physical education, physical activity and sports has not been conducted. The provision evaluation index data, shown to be representative of a national sample (school type, school size, state demographics and social–economic status), are the first of its kind in the Republic of Ireland. Key findings from this study will be reflected upon in the following discussion. National and international comparisons, implications and recommendations will be illuminated.

4.1. Personnel

The quality of physical education teaching is associated with the qualifications of the school’s physical education personnel [46,47]. Appropriately qualified physical education personnel are trained to teach students a structured curriculum and “help them acquire the skills, knowledge, and dispositions necessary to be ‘wise consumers’ of physical activity” and sports [48] (p. 3). Worryingly, physical education is taught by qualified personnel with no physical education specialization in almost one third of schools in the current study. This is consistent with a national study in South Africa that found that in almost two thirds of school’s, physical education provision was facilitated by non-specialist personnel [49]. Therefore, it is considered that a high proportion of adolescents are not developing pertinent physical activity habits during physical education classes [50,51,52]. The costs associated with physical inactivity in adolescence that track into adulthood are estimated to reach 300 billion by 2030 and could be alleviated by appropriately delivered physical education classes [4]. While a shortage of teaching personnel is acknowledged in the Republic of Ireland, the Department of Education is accountable for policy development that ensures that physical education classes are taught by appropriately qualified teaching personnel. The Department of Education recently allocated 600 additional places on undergraduate primary education teaching courses [53]. Therefore, it is recommended that similar actions are taken to ensure physical education classes are taught by suitably qualified personnel.

4.2. Curriculum

4.2.1. Physical Education

Just 18% of Irish adolescents are reported to achieve the Department of Education physical education recommendations of two hours weekly. This finding indicates a decline compared to the numbers furnished in the recent report card on physical activity in the north and south of Ireland that found that 23% of adolescents achieved the aforementioned recommendations [41]. Comparatively, a cross-sectional study conducted on 98% of schools in England found that 83% met the recommendations of two hours weekly, indicating a 60% differentiation in comparison to their Irish counterparts [54]. Internationally, 77% of schools worldwide endorse physical education as a primary requirement [39]. In addition, 92.5% of schools in Ireland indicated that engagement in physical education class was compulsory. However, a gap between policy that advocates for the provision of physical education classes and practice that implements physical education classes is evident. This is illuminated in the Global Matrix 3.0 Physical Activity Report Card, with 74% of adolescents in the United Arab Emirates and 32% in South Africa failing to participate in physical education class [55]. Similarly, in the current study, just 27% of schools indicated that all adolescents regularly participate in physical education classes despite a high level already indicating that engagement in physical education was compulsory. Considering that lack of support and goal prioritisation are key barriers to policy implementation in schools, management may consider a top-down approach that addresses this gap by adequately facilitating the appropriate allocation of time and resources to meet the weekly physical education recommendations [56].
In the context of curriculum content, the current study underpinned basketball, athletics, badminton and soccer as high provision curricular activities, while swimming was consistently considered a low provision curricular activity. These findings concur with the report card on physical activity in the north and south of Ireland [41] and the Childrens Sport Participation and Physical Activity Study that found team game activities such as basketball and soccer were more prevalent in schools [7]. The Department of Education, higher education institutions and schools may consider regular, compulsory opportunities for continuous professional development for personnel to strengthen skills for the implementation of a wide variety of curricular activities [57]. The dearth of continuous professional development opportunities has been previously outlined in the results of current study.

4.2.2. Physical Activity

A near-universal consensus regarding low engagement in active transport to school exists in countries such as Wales (33%), Canada (46%), Uruguay (50.1%) and Australia (52%) [58,59,60,61]. This is consistent with the current study that found that almost half of schools rarely or never promote the concept of active transport to and from school, and in four out of five schools, active transport is rarely or never facilitated. In respect to other forms of school physical activity, the Global Matrix 4.0 physical activity report card from 57 countries consistently advocates for increasing physical activity opportunities via avenues such as extracurricular physical activities and active breaks [62]. Indeed, increasing the opportunities to be physically active is one of the most recurring priorities/themes reported by countries with the highest grades (e.g., Denmark, Finland, Japan, Hungary and Slovenia). However, the current study found that almost half of schools rarely or never provide extracurricular activities in addition to physical education and sports, and 38.4% rarely or never implement break time activities. While worldwide policies regarding the implementation of a whole-of-school, systems-based approach that includes active transport to school initiatives, extracurricular physical activity and active classroom breaks are becoming more frequent [8,35], it is acknowledged that gaps between policy and practice exist. A review of 16 studies examining barriers and facilitators to the implementation of physical activity in schools recommends “systems to monitor implementation performance” as a key strategy to overcome such barriers [56] (p. 51).

4.2.3. Sports

A total of 28.2% of schools were awarded a grade D and 25.8% awarded a grade F when asked to estimate the percentage of pupils participating in school sport activities. National comparisons are inconsistent with these findings suggesting that 63% (grade B) of adolescents participate in school sports weekly [7]. It must be noted that the respondents in the current study were from the perspective of the head physical education teacher. Comparatively, respondents in the CSSPA study included adolescent populations, which may account for some of the aforementioned variance. However, boys participating in school sports more often than their female counterparts is recognized as both a national and an international trend [7,63,64,65]. Similarly to physical education, team-based sports such as basketball and Gaelic football (and with the addition of athletics) were deemed high-provision activities which is a consistent trend nationally [7]. Furthermore, athletics is illuminated as one of the most popular high school sports in America, which corroborates the findings of the current study [63]. However, in order to serve the full range of activities envisioned under the physical education strands, considerably more time and resources are required. To this end, collaboration with sport specific development officers to introduce a full range of sports activities that are often less established in schools is recommended [66]. While school sports are considered to make a contribution toward physical activity levels, recommendations suggest a combination of school sports and other physical activity opportunities, e.g., physical education and active recess, to meet the physical activity guidelines [6,8,14,35,67].

4.3. Facilities and Equipment

Regularly maintaining physical education facilities and equipment helps preserve their quality [68]. Adolescents enrolled in schools with quality physical education facilities and equipment (e.g., a soccer field or athletics track) are more likely to participate in school physical education, physical activity and sports [68,69]. However, the current study reported that almost one in five schools do not regularly maintain their facilities and equipment. This is consistent with the worldwide survey on physical education that found that “physical education is challenged by the low or poor levels of maintenance of existing facilities” and equipment [39] (p. 22). Furthermore, one third of countries regard provision of equipment as below average [39], aligning with the overall grading for this indicator of succeeding in about half of adolescents. To this end, providing “conducive environments that translate into” higher quality provision of facilities and equipment via regular maintenance is recommended, and can be achieved through the medium of appropriate protocols that are actively implemented by school management [70] (p. 5). It is noteworthy that the facilities and equipment available in schools is also a key indicator of the activities that are provided and should be considered when strategizing the range of physical education, physical activity and sports activities implemented in schools [7].

4.4. Budget

The literature points to the correlation between insufficient school resources and low provision of school physical education, physical activity and sports [39,71,72]. These findings are consistent with the current study that reported two in five schools felt the budget attained from external sources such as the Department of Education or via internal school allocations for the provision of physical education, physical activity and sports was poor or inadequate. In addition, low scores for the indictor on school budget often corresponded with low overall scores for physical education, physical activity and sports provision. Notably, adequate funding for components of provision such as facilities and equipment and the development of collaborative partnerships greatly enhance the opportunities for physical activity in school that are recognised to track into adulthood [50] and reduce global health costs [73,74]. Thus, “an appropriate financial budget in line with curriculum implementation would be taken as imperative” for the adequate provision of school physical education, physical activity and sports [39] (p. 125). It is noteworthy that the maintenance of facilities and equipment considered in the previous indicator of provision is often correlated with school budget, which should be taken into consideration [75,76,77].

4.5. Partnerships

The development of collaborative partnerships is pertinent to improving both education and health in schools [78,79]. Cross-sectoral representation is essential to “accommodate broader life-long educational outcomes including healthy well-being and links with personal and social behaviour” [39] (p. 81). Despite this, the current study found insufficient links between school physical education, physical activity and sports and wider society, e.g., parents, the Department of Education, national governing bodies, research centres and inter-school partnerships. This is consistent with the international literature that reported as little as 27% of schools that have formal school partnerships supporting physical education, physical activity and sports provision and that “not enough co-operation between schools and sports organisations” exist [39,80] (p. 105). To facilitate the development of a broad range of school partnerships that stimulate the ethos of physical activity prioritization, the intermediary roles of schools and of physical education teachers should be first addressed via teacher education programs [81,82,83]. Thus, prospective teachers’ professional education should encompass familiarization training on the various collaborative partnerships, pathways and supports that can be realized via working with other experts and appropriately mentored volunteers [84]. Partnerships that foster a “strong collaborative cross-sectoral effort… ideally linked to national policy and targets in the area of physical activity” are most pertinent [7] (p. 94).

4.6. Ethos and Prioritization

School ethos is imperative when considering the extent to which school physical education, physical activity and sports are prioritized [73,85,86]. School physical education, physical activity and sports ethos can be nurtured via the provision of adequate facilities, equipment, budget, availability of staff and commitment of resources [7,87]. However, the current study calls attention to the low gradation (grade D and F) of many integral components of provision in the context of school ethos and prioritization, e.g., participation and promotion of physical education and sports, indoor and outdoor facilities and equipment, budget, active recess, active transport and active classroom breaks. This is consistent with qualitative research comprised of physical education teachers and senior school leaders that examined factors that shape the culture of physical education, reporting budget constraints, access to appropriate facilities and overall prioritization as key issues to impact the physical education culture within school [88,89,90].
Physical education has often been regarded as a minor subject in schools, with a greater emphasis often placed on grade-related subjects such as mathematics [91,92]. This is consistent with the postulation in the current study that one in three schools do not prioritize physical education to the same degree as other subject disciplines and therefore was more likely to be cancelled. However, the underlying implication in light of prioritizing curricular subjects over physical education classes is that it indicates little advancement in the context of academic achievements [93] in comparison to the positive effects that additional physical education time has on adolescent health without impacting academic endeavours [20,21,94,95,96]. Thus, adhering to physical education recommendations as a minimum requirement, with schools endeavouring to go beyond this minimum, is strongly recommended.

5. Conclusions

Evaluating the extent of implementation and variation of typical school provision of physical education, physical activity and sports is a public health priority. Therefore, a national audit into the different levels of typical school provision of physical education, physical activity and sports was conducted, and future country comparison and benchmarking on key components of provision is envisaged. The current study found persisting challenges such as the provision of physical education classes by non-specialist teachers, failure to attain the Department of Education physical education recommendations, lack of prioritization of physical education class and provision of curricular activities that do not serve the true range envisioned under the physical education strands. In addition, facilities and equipment that are not maintained are therefore lacking quality; there is a lack of financial resources both externally and via internal allocations directed towards provision; there are insufficient links between provision and wider society, e.g., parents, national governing bodies for sport and the Department of Education; and there is an absence of successful implementations of a wide variety of supplementary school physical activity opportunities that constitute a systems-based, whole-school approach; that is, active transport, active classroom breaks, active recess and extracurricular activities are key pillars of provision that are in need of intervention. Despite the adoption of a variety of policies that advocate for many components of school physical education, physical activity and sports provision, and, indeed, a systems-wide, whole-school approach to physical activity, paralleled with significant investment, a gap between policy and practice is evident. Future research should consider addressing such gaps via strategies that adequately prioritize and successfully implement the aforementioned pillars of school provision, namely, physical education, physical activity and sports effectively, for the betterment of adolescent health. Furthermore, the standardized framework for evaluation of school physical education, physical activity and sports using a validated provision evaluation index should facilitate future international comparisons to highlight best practice and indicators in need of addressing.

Strengths and Limitations

The current study is the first to conduct a systems wide evaluation on the key pillars of physical education, physical activity and sports provision in secondary schools in the Republic of Ireland. The sample is nationally representative of school type, size, state demographic and social–economic status. Therefore, the findings in the current study are generalizable to secondary schools nationwide. Data were collected via the school provision of physical education, physical activity and sports evaluation index, previously informed by a mixed-method group concept mapping approach that gathered, integrated and visually and numerically represented the composite thinking of a group of multi-disciplinary stakeholders into a conceptual framework. The concurrent examination of school physical education, physical activity and sports allowed for a thorough evaluation of national provision. Gradation via indicators of provision allows for benchmarking for future country comparisons. Lastly, suggested recommendations on each component of provision are provided.
However, there were some limitations. Data collected via the provision evaluation index are self-reported and subjective from the perspective of the head physical education teacher; therefore, the concept of participant bias cannot be ruled out. It must be noted that perspectives of adolescent populations were not included in this study. The Republic of Ireland is considered a high-income country [97]; therefore, while country comparisons are envisaged, comparisons with low-income countries may be problematic. Lastly, the cross-sectional nature of the current study limits the ability to measure cause and effect.

Supplementary Materials

The following are available online at https://www.mdpi.com/article/10.3390/educsci13070699/s1, School Physical Education, Physical Activity and Sports Provision Evaluation Index.

Author Contributions

Conceptualization, P.R. and C.M.D.; methodology, P.R. and C.M.D.; software, P.R. and C.M.D.; validation, P.R., C.M.D. and B.T.O.K.; formal analysis, P.R., C.M.D. and B.T.O.K.; investigation, P.R., and C.M.D.; resources, P.R., and C.M.D.; data curation, P.R. and C.M.D.; writing—original draft preparation, P.R., C.M.D., B.T.O.K., P.M.-M. and I.S.; writing—review and editing, P.R., C.M.D., B.T.O.K., P.M.-M. and I.S.; visualization, P.R. and C.M.D.; supervision, B.T.O.K., I.S., P.M.-M. and C.M.D.; project administration, P.R.; funding acquisition, P.R., C.M.D., P.M.-M. and B.T.O.K. All authors have read and agreed to the published version of the manuscript.

Funding

This research was funded by [Irish Research Council Postgraduate Scholarship] grant number [GOIPG/2022/555] And The APC was funded by [The Physical Education and Sport Sciences Department, University of Limerick].

Institutional Review Board Statement

The study was conducted in accordance with the Declaration of Helsinki, and approved by the Institutional Review Board (or Ethics Committee) of the University of Limerick (2021_12_24_EHS (ER) December 202l).” for studies involving humans.

Informed Consent Statement

Informed consent was obtained from all subjects involved in the study.

Data Availability Statement

All statistical data are presented within the manuscript and Supplementary Material.

Conflicts of Interest

The authors declare no conflict of interest.

References

  1. de Moraes AC, F.; Carvalho, H.B.; Siani, A.; Barba, G.; Veidebaum, T.; Tornaritis, M.; Molnar, D.; Ahrens, W.; Wirsik, N.; De Henauw, S.; et al. Incidence of High Blood Pressure in Children—Effects of Physical Activity and Sedentary Behaviors: The IDEFICS Study. Int. J. Cardiol. 2015, 180, 165–170. [Google Scholar] [CrossRef]
  2. An, R.; Shen, J.; Yang, Q.; Yang, Y. Impact of Built Environment on Physical Activity and Obesity among Children and Adolescents in China: A Narrative Systematic Review. J. Sport Health Sci. 2019, 8, 153–169. [Google Scholar] [CrossRef] [PubMed]
  3. McDowell, C.P.; Dishman, R.K.; Hallgren, M.; MacDonncha, C.; Herring, M.P. Associations of Physical Activity and Depression: Results from the Irish Longitudinal Study on Ageing. Exp. Gerontol. 2018, 112, 68–75. [Google Scholar] [CrossRef] [PubMed]
  4. World Health Organization. Global Status Report on Physical Activity; WHO Press: Geneva, Switzerland, 2022. [Google Scholar]
  5. Guthold, R.; Stevens, G.A.; Riley, L.M.; Bull, F.C. Global Trends in Insufficient Physical Activity among Adolescents: A Pooled Analysis of 298 Population-Based Surveys with 1·6 Million Participants. Lancet Child Adolesc. Health 2020, 4, 23–35. [Google Scholar] [CrossRef] [PubMed]
  6. World Health Organization. Global Action Plan on Physical Activity 2018–2030: More Active People for a Healthier World; WHO Press: Geneva, Switzerland, 2018. [Google Scholar]
  7. Woods, C.; Powell, C.; Saunders, J.; O’Brien, W.; Murphy, M.; Duff, C.; Farmer, O.; Johnston, A.; Connolly, S.; Belton, S. The Children’s Sport Participation and Physical Activity Study 2018 (CSPPA 2018); DCU Faculties and Schools: Dublin, Ireland, 2018. [Google Scholar]
  8. Department of Health Ireland. Get Ireland Active–The National Physical Activity Plan; Department of Health Ireland: Dublin, Ireland, 2016. [Google Scholar]
  9. Department of Health Ireland. Implementation Review of the National Physical Activity Plan; Department of Health Ireland: Dublin, Ireland, 2020. [Google Scholar]
  10. Hobin, E.; Erickson, T.; Comte, M.; Zuo, F.; Pasha, S.; Murnaghan, D.; Manske, S.; Casey, C.; Griffith, J.; McGavock, J. Examining the Impact of a Province-Wide Physical Education Policy on Secondary Students’ Physical Activity as a Natural Experiment. Int. J. Behav. Nutr. Phys. Act. 2017, 14, 98. [Google Scholar] [CrossRef] [Green Version]
  11. Rocliffe, P.; O’Keeffe, B.; Walsh, L.; Stylianou, M.; Woodforde, J.; García-González, L.; O’Brien, W.; Coppinger, T.; Sherwin, I.; Mannix-McNamara, P.; et al. The Impact of Typical School Provision of Physical Education, Physical Activity and Sports on Adolescent Physical Activity Behaviors: A Systematic Literature Review. Adolesc. Res. Rev. 2023, 1–27. [Google Scholar] [CrossRef]
  12. Mooses, K.; Pihu, M.; Riso, E.-M.; Hannus, A.; Kaasik, P.; Kull, M. Physical Education Increases Daily Moderate to Vigorous Physical Activity and Reduces Sedentary Time. J. Sch. Health 2017, 87, 602–607. [Google Scholar] [CrossRef]
  13. Aljuhani; Sandercock. Contribution of Physical Education to the Daily Physical Activity of Schoolchildren in Saudi Arabia. Int. J. Environ. Res. Public Health 2019, 16, 2397. [Google Scholar] [CrossRef] [Green Version]
  14. Frömel, K.; Svozil, Z.; Chmelík, F.; Jakubec, L.; Groffik, D. The role of physical education lessons and recesses in school lifestyle of adolescents. J. Sch. Health 2016, 86, 143–151. [Google Scholar] [CrossRef] [Green Version]
  15. Azlan, A.; Ismail, N.; Fauzi NF, M.; Talib, R.A. Playing Traditional Games vs. Free-Play during Physical Education Lesson to Improve Physical Activity: A Comparison Study. Pedagog. Phys. Cult. Sport. 2021, 25, 178–187. [Google Scholar] [CrossRef]
  16. Mayorga-Vega, D.; Martínez-Baena, A.; Viciana, J. Does School Physical Education Really Contribute to Accelerometer-Measured Daily Physical Activity and Non Sedentary Behaviour in High School Students? J. Sport. Sci. 2018, 36, 1913–1922. [Google Scholar] [CrossRef] [PubMed]
  17. Slingerland, M.; Borghouts, L.B.; Hesselink MK, C. Physical Activity Energy Expenditure in Dutch Adolescents: Contribution of Active Transport to School, Physical Education, and Leisure Time Activities. J. Sch. Health 2012, 82, 225–232. [Google Scholar] [CrossRef] [PubMed]
  18. Rocliffe, P.; Adamakis, M.; O’Keeffe, B.T.; Walsh, L.; Bannon, A.; García-González, L.; Chambers, F.; Stylianou, M.; Sherwin, I.; Mannix-McNamara, P.; et al. The Impact of Typical School Provision of Physical Education, Physical Activity and Sports on Adolescent Mental Health and Wellbeing: A Systematic Literature Review. Adolesc. Res. Rev. 2023. [Google Scholar]
  19. Lima, R.A.; Barros MV, G.; Bezerra, J.; Santos, S.J.; Monducci, E.; Rodriguez-Ayllon, M.; Soares, F.C. Universal School-based Intervention Targeting Depressive Symptoms in Adolescents: A Cluster Randomized Trial. Scand. Med. Sci. Sport. 2022, 32, 622–631. [Google Scholar] [CrossRef]
  20. Park, K.M.; Park, H. Effects of Self-Esteem Improvement Program on Self-Esteem and Peer Attachment in Elementary School Children with Observed Problematic Behaviors. Asian Nurs. Res. 2015, 9, 53–59. [Google Scholar] [CrossRef] [Green Version]
  21. Baena-Extremera, A.; Granero-Gallegos, A.; Del Mar Ortiz-Camacho, M. Quasi-Experimental Study of the Effect of an Adventure Education Programme on Classroom Satisfaction, Physical Self-Concept and Social Goals in Physical Education. Psychol. Belg. 2012, 52, 369. [Google Scholar] [CrossRef] [Green Version]
  22. Escartí, A.; Gutiérrez, M.; Pascual, C.; Marín, D. Application of Hellison’s Teaching Personal and Social Responsibility Model in Physical Education to Improve Self-Efficacy for Adolescents at Risk of Dropping-out of School. Span. J. Psychol. 2010, 13, 667–676. [Google Scholar] [CrossRef] [PubMed] [Green Version]
  23. Ruiz-Ariza, A.; Suárez-Manzano, S.; López-Serrano, S.; Martínez-López, E.J. The Effect of Cooperative High-Intensity Interval Training on Creativity and Emotional Intelligence in Secondary School: A Randomised Controlled Trial. Eur. Phys. Educ. Rev. 2019, 25, 355–373. [Google Scholar] [CrossRef]
  24. Luna, P.; Guerrero, J.; Cejudo, J. Improving Adolescents’ Subjective Well-Being, Trait Emotional Intelligence and Social Anxiety through a Programme Based on the Sport Education Model. Int. J. Environ. Res. Public Health 2019, 16, 1821. [Google Scholar] [CrossRef] [PubMed] [Green Version]
  25. Mastagli, M.; Malini, D.; Hainaut, J.P.; Van Hoye, A.; Bolmont, B. Summative assessment versus formative assessment: An ecological study of physical education by analyzing state-anxiety and shot-put performance among French high school students. J. Phys. Educ. Sport 2020, 20, 2220–2229. [Google Scholar] [CrossRef]
  26. Bielec, G.; Peczak-Graczyk, A.; Waade, B. Do Swimming Exercises Induce Anthropometric Changes in Adolescents? Issues Compr. Pediatr. Nurs. 2013, 36, 37–47. [Google Scholar] [CrossRef] [PubMed]
  27. Costigan, S.A.; Eather, N.; Plotnikoff, R.C.; Taaffe, D.R.; Pollock, E.; Kennedy, S.G.; Lubans, D.R. Preliminary Efficacy and Feasibility of Embedding High Intensity Interval Training into the School Day: A Pilot Randomized Controlled Trial. Prev. Med. Rep. 2015, 2, 973–979. [Google Scholar] [CrossRef] [Green Version]
  28. Santos, D.D.S.; de Oliveira, T.E.; Pereira, C.A.; Evangelista, A.L.; Cocalini, D.S.; Rica, R.L.; Rhea, M.R.; Simao, R.; Teixeira, C.V.L.S. Does a Calisthenics-Based Exercise Program Applied in School Improve Morphofunctional Parameters in Youth? J. Exerc. Psychol. 2015, 18, 52–61. [Google Scholar]
  29. Alonso-Fernández, D.; Fernández-Rodríguez, R.; Taboada-Iglesias, Y.; Gutiérrez-Sánchez, Á. Impact of a HIIT Protocol on Body Composition and VO2max in Adolescents. Sci. Sport. 2019, 34, 341–347. [Google Scholar] [CrossRef]
  30. Giannaki, C.D.; Aphamis, G.; Tsouloupas, C.N.; Ioannou, Y.; Hadjicharalambous, M. An Eight Week School-Based Intervention with Circuit Training Improves Physical Fitness and Reduces Body Fat in Male Adolescents. J. Sport. Med. Phys. Fit. 2016, 56, 894–900. [Google Scholar]
  31. Kojic, F.; Markovic, M.; Zivanovic, V.; Brankovic, D.; Obradovic, M.; Duric, S. Implementation of an unstable surface exercise program in physical education curriculum: Effects on strength and morphological features. Kinsi 2022, 28, 19–32. [Google Scholar] [CrossRef]
  32. Lo, K.-Y.; Wu, M.-C.; Tung, S.-C.; Hsieh, C.C.; Yao, H.-H.; Ho, C.-C. Association of School Environment and After-School Physical Activity with Health-Related Physical Fitness among Junior High School Students in Taiwan. Int. J. Env. Res. Public Health 2017, 14, 83. [Google Scholar] [CrossRef] [Green Version]
  33. Perez, T.D.N.; Gomes, F.B.; Carletti, L.; Perez, A.J.; Bordado, J.; Peralta, M.; Marques, A. Can School Sport Participation Increase Cardiorespiratory Fitness and Cardiorespiratory Response to Exercise? A Pilot Study in 14 and 15 Year Old Boys. Rev. Bras. De Prescricao E Fisiol. Do Exerc. 2022, 16, 73–80. [Google Scholar]
  34. Trajković, N.; Madić, D.; Milanović, Z.; Mačak, D.; Padulo, J.; Krustrup, P.; Chamari, K. Eight Months of School-Based Soccer Improves Physical Fitness and Reduces Aggression in High-School Children. Biol. Sport 2020, 37, 185–193. [Google Scholar] [CrossRef] [PubMed]
  35. International Society for Physical Activity and Health. Eight Investments that Work for Physical Activity; International Society for Physical Activity and Health: Champaign, IL, USA, 2020. [Google Scholar]
  36. World Health Organization. Making Every School a Health Promoting School–Global Standards and Indicators; WHO Press: Geneva, Switzerland, 2021. [Google Scholar]
  37. Bowles, R.; Chróinín, D.N.; Murtagh, E. Attaining the Active School Flag: How Physical Activity Provision Can Be Enhanced in Irish Primary Schools. Eur. Phys. Educ. Rev. 2019, 25, 76–88. [Google Scholar] [CrossRef]
  38. Department of Health Ireland. Get Active—Physical Education, Physical Activity and Sport for Children and Young People—A Guiding Framework; Department of Health Ireland: Dublin, Ireland, 2020. [Google Scholar]
  39. Hardman, K.; Murphy, C.; Routen, A.; Tones, S. Second World-Wide Survey of School Physical Education: Final Report; ICSSPE/CIEPSS, International Council of Sport Science and Physical Education: Berlin, Germany, 2014. [Google Scholar]
  40. Harrington, D.M.; Murphy, M.; Carlin, A.; Coppinger, T.; Donnelly, A.; Dowd, K.P.; Keating, T.; Murphy, N.; Murtagh, E.; O’Brien, W.; et al. Results From Ireland North and South’s 2016 Report Card on Physical Activity for Children and Youth. J. Phys. Act. Health 2016, 13, S183–S188. [Google Scholar] [CrossRef] [PubMed] [Green Version]
  41. Institute of Public Health. The 2022 Ireland North and South Report Card on Physical Activity for Children and Adolescents; Institute of Public Health: Belfast, UK, 2022. [Google Scholar]
  42. Rosas, S.R. Group Concept Mapping Methodology: Toward an Epistemology of Group Conceptualization, Complexity, and Emergence. Qual. Quant. 2017, 51, 1403–1416. [Google Scholar] [CrossRef]
  43. Kane, M.; Rosas, S. Conversations about Group Concept Mapping: Applications, Examples and Enhancements; SAGE: Los Angeles, CA, USA, 2018. [Google Scholar]
  44. Rocliffe, P.; O’Keeffe, B.T.; Mannix-McNamara, P.; MacDonncha, C. School-based physical education, physical activity and sports provision: A concept mapping framework for evaluation. Review. PLoS ONE 2023, 18, e0287505. [Google Scholar] [CrossRef]
  45. O’Keeffe, B.T.; MacDonncha, C.; Ng, K.; Donnelly, A. Health-Related Fitness Monitoring Practices in Secondary School-Based Physical Education Programs. J. Teach. Phys. Educ. 2019, 39, 59–68. [Google Scholar] [CrossRef] [Green Version]
  46. Redesigning Physical Education: An Equity Agenda in Which Every Child Matters, 1st ed.; Lawson, H.A. (Ed.) Routledge: London, UK, 2018. [Google Scholar] [CrossRef]
  47. O’Neil, K.; Richards KA, R. Breaking from Traditionalism: Strategies for the Recruitment of Physical Education Teachers. J. Phys. Educ. Recreat. Danc. 2018, 89, 34–41. [Google Scholar] [CrossRef]
  48. Johnson, T.G.; Turner, L. The Physical Activity Movement and the Definition of Physical Education. J. Phys. Educ. Recreat. Danc. 2016, 87, 8–10. [Google Scholar] [CrossRef]
  49. Burnett, C. A National Study on the State and Status of Physical Education in South African Public Schools. Phys. Educ. Sport Pedagog. 2021, 26, 179–196. [Google Scholar] [CrossRef]
  50. Telama, R.; Yang, X.; Viikari, J.; Välimäki, I.; Wanne, O.; Raitakari, O. Physical Activity from Childhood to Adulthood. Am. J. Prev. Med. 2005, 28, 267–273. [Google Scholar] [CrossRef] [PubMed]
  51. Bélanger, M.; Sabiston, C.M.; Barnett, T.A.; O’Loughlin, E.; Ward, S.; Contreras, G.; O’Loughlin, J. Number of Years of Participation in Some, but Not All, Types of Physical Activity during Adolescence Predicts Level of Physical Activity in Adulthood: Results from a 13-Year Study. Int. J. Behav. Nutr. Phys. Act. 2015, 12, 76. [Google Scholar] [CrossRef] [Green Version]
  52. Teixeira, P.J.; Carraça, E.V.; Markland, D.; Silva, M.N.; Ryan, R.M. Exercise, Physical Activity, and Self-Determination Theory: A Systematic Review. Int. J. Behav. Nutr. Phys. Act. 2012, 9, 78. [Google Scholar] [CrossRef] [Green Version]
  53. O’Kelly, M. Over 600 Extra Teacher Course Places in Next Two Years. RTE. Available online: https://www.rte.ie/news/education/2023/0327/1366488-schools-teacher-shortage/ (accessed on 27 March 2023).
  54. Greenfield JR, F.; Almond, M.; Clarke, G.P.; Edwards, K.L. Factors Affecting School Physical Education Provision in England: A Cross-Sectional Analysis. J. Public Health 2016, 38, 316–322. [Google Scholar] [CrossRef] [PubMed] [Green Version]
  55. Aubert, S.; Barnes, J.D.; Abdeta, C.; Abi Nader, P.; Adeniyi, A.F.; Aguilar-Farias, N.; Tenesaca, D.S.A.; Bhawra, J.; Brazo-Sayavera, J.; Cardon, G.; et al. Global Matrix 3.0 Physical Activity Report Card Grades for Children and Youth: Results and Analysis From 49 Countries. J. Phys. Act. Health 2018, 15, S251–S273. [Google Scholar] [CrossRef] [PubMed] [Green Version]
  56. Nathan, N.; Elton, B.; Babic, M.; McCarthy, N.; Sutherland, R.; Presseau, J.; Seward, K.; Hodder, R.; Booth, D.; Yoong, S.L.; et al. Barriers and Facilitators to the Implementation of Physical Activity Policies in Schools: A Systematic Review. Prev. Med. 2018, 107, 45–53. [Google Scholar] [CrossRef]
  57. Armour, K.M.; Yelling, M.R. Continuing Professional Development for Experienced Physical Education Teachers: Towards Effective Provision. Sport Educ. Soc. 2004, 9, 95–114. [Google Scholar] [CrossRef]
  58. Edwards, L.C.; Tyler, R.; Blain, D.; Bryant, A.; Canham, N.; Carter-Davies, L.; Clark, C.; Evans, T.; Greenall, C.; Hobday, J.; et al. Results From Wales’ 2018 Report Card on Physical Activity for Children and Youth. J. Phys. Act. Health 2018, 15, S430–S432. [Google Scholar] [CrossRef] [Green Version]
  59. ParticipACTION. Lost & Found: Pandemic-related challenges and opportunities for physical activity. In The 2022 ParticipACTION Report Card on Physical Activity for Children and Youth; ParticipACTION: Toronto, Canada, 2022. [Google Scholar]
  60. Brazo-Sayavera, J.; Fernandez-Gimenez, S.; Pintos-Toledo, E.; Corvos, C.; Souza-Marabotto, F.; Bizzozero-Peroni, B. Results from the Uruguay’s 2022 Report Card on Physical Activity for Children and Adolescents. J. Exerc. Sci. Fit. 2023, 21, 104–110. [Google Scholar] [CrossRef]
  61. Deakin University; Hesketh, K. 2022 Active Healthy Kids Australia Report Card on Physical Activity for Children and Young People; Deakin University: Geelong, Australia, 2022. [Google Scholar] [CrossRef]
  62. Aubert, S.; Barnes, J.D.; Demchenko, I.; Hawthorne, M.; Abdeta, C.; Abi Nader, P.; Sala, J.C.A.; Aguilar-Farias, N.; Aznar, S.; Bakalár, P.; et al. Global Matrix 4.0 Physical Activity Report Card Grades for Children and Adolescents: Results and Analyses From 57 Countries. J. Phys. Act. Health 2022, 19, 700–728. [Google Scholar] [CrossRef]
  63. Veliz, P.; Snyder, M.; Sabo, D. The State of High School Sports in America: An Evaluation of the Nations Most Popular Extracurricular Activity; Women’s Sports Foundation: New York, NY, USA, 2019. [Google Scholar]
  64. Deaner, R.O.; Geary, D.C.; Puts, D.A.; Ham, S.A.; Kruger, J.; Fles, E.; Winegard, B.; Grandis, T. A Sex Difference in the Predisposition for Physical Competition: Males Play Sports Much More than Females Even in the Contemporary U.S. PLoS ONE 2012, 7, e49168. [Google Scholar] [CrossRef]
  65. Drake, K.M.; Longacre, M.R.; MacKenzie, T.; Titus, L.J.; Beach, M.L.; Rundle, A.G.; Dalton, M.A. High School Sports Programs Differentially Impact Participation by Sex. J. Sport Health Sci. 2015, 4, 282–288. [Google Scholar] [CrossRef] [Green Version]
  66. Houlihan, B.; Lindsey, I. Network and Partnrships in Sports Development; Taylor & Francis Group: Abingdon, UK, 2008. [Google Scholar]
  67. Cradock, A.L.; Barrett, J.L.; Carter, J.; McHugh, A.; Sproul, J.; Russo, E.T.; Dao-Tran, P.; Gortmaker, S.L. Impact of the Boston Active School Day Policy to Promote Physical Activity among Children. Am. J. Health Promot. 2014, 28 (Suppl. 3), S54–S64. [Google Scholar] [CrossRef]
  68. Orunaboka, T.; Nwachukwu, E. Management of Physical Education Facilities, Equipment, and Supplies in secondary Schools in Nigeria: Issues and Challenges. J. Educ. Pract. 2012, 3, 43–47. [Google Scholar]
  69. Roset, E.N.; Candelon, Z.G.; Gandal, A.; Falle, J.A.; Calixtro, V. Sports Facilities and Equipment: Availability and Students Satisfaction in The Physical Education Class. Indones. J. Multidiscip. Res. 2022, 2, 377–380. [Google Scholar] [CrossRef]
  70. Enefu, S.M.; Okaforcha, C.C. Maintenance of School Facilities. In School Business Management: Theoretical and Practical Approach; University of Nigeria, Nsukka: Enugu, Nigeria, 2016. [Google Scholar]
  71. Hills, A.P.; Dengel, D.R.; Lubans, D.R. Supporting Public Health Priorities: Recommendations for Physical Education and Physical Activity Promotion in Schools. Prog. Cardiovasc. Dis. 2015, 57, 368–374. [Google Scholar] [CrossRef] [Green Version]
  72. Jenkinson, K.A.; Benson, A. Barriers to Providing Physical Education and Physical Activity in Victorian State Secondary Schools. Aust. J. Teach. Educ. 2010, 35, 1–7. [Google Scholar] [CrossRef] [Green Version]
  73. Morton, K.L.; Atkin, A.J.; Corder, K.; Suhrcke, M.; Sluijs, E.M.F. The School Environment and Adolescent Physical Activity and Sedentary Behaviour: A Mixed-studies Systematic Review. Obes. Rev. 2016, 17, 142–158. [Google Scholar] [CrossRef] [Green Version]
  74. Physical Activity and Health; Bouchard, C.; Blair, S.N.; Haskell, W.L. (Eds.) Human Kinetics: Champaign, IL, USA, 2007. [Google Scholar]
  75. Xaba, M.I. A Qualitative Analysis of Facilities Maintenance—A School Governance Function in South Africa. South Afr. J. Educ. 2012, 32, 215–226. [Google Scholar] [CrossRef]
  76. Judge, L.W.; Petersen, J.C.; Bellar, D.M.; Craig, B.W.; Cottingham, M.P.; Gilreath, E.L. The Current State of NCAA Division I Collegiate Strength Facilities: Size, Equipment, Budget, Staffing, and Football Status. J. Strength Cond. Res. 2014, 28, 2253–2261. [Google Scholar] [CrossRef]
  77. Asiyai, R. Assessing School Facilities in Public Secondary Schools in Delta State, Nigeria. Afr. Res. Rev. 2012, 6, 192–205. [Google Scholar] [CrossRef] [Green Version]
  78. Kolbe, L.J.; Allensworth, D.D.; Potts-Datema, W.; White, D.R. What Have We Learned From Collaborative Partnerships to Concomitantly Improve Both Education and Health? J. School Health 2015, 85, 766–774. [Google Scholar] [CrossRef] [Green Version]
  79. Wisconsin Department of Public Instruction (DPI). Wisconsin Success Stories—Active Schools; Wisconsin DPI: Madison, WI, USA, 2012. [Google Scholar]
  80. Hardman, K. Physical education in schools: A global perspective. Kinesiology 2008, 40, 5–28. [Google Scholar]
  81. Patte, M.M. Examining Preservice Teacher Knowledge and Competencies in Establishing Family-School Partnerships. Sch. Community J. 2011, 21, 143–159. [Google Scholar]
  82. Mutton, T.; Burn, K.; Thompson, I. Preparation for Family-School Partnerships within Initial Teacher Education Programmes in England. J. Educ. Teach. 2018, 44, 278–295. [Google Scholar] [CrossRef]
  83. Winn, J.; Blanton, L. The Call for Collaboration in Teacher Education. Exceptional 2017, 38, 1–10. [Google Scholar] [CrossRef]
  84. Sperka, L.; Enright, E. The Outsourcing of Health and Physical Education: A Scoping Review. Eur. Phys. Educ. Rev. 2018, 24, 349–371. [Google Scholar] [CrossRef]
  85. Hensch, M. Teacher Participation in Extracurricular Activities: The Effect on School Culture. Sch. Educ. Leadersh. Stud. Capstone Theses Diss. 2020. Available online: https://digitalcommons.hamline.edu/hse_all/4495 (accessed on 5 July 2023).
  86. Cale, L.; Harris, J.; Duncombe, R. Promoting Physical Activity in Secondary Schools: Growing Expectations, ‘Same Old’ Issues? Eur. Phys. Educ. Rev. 2016, 22, 526–544. [Google Scholar] [CrossRef] [Green Version]
  87. Fatou, N.; Kubiszewski, V. Are Perceived School Climate Dimensions Predictive of Students’ Engagement? Soc. Psychol. Educ. 2018, 21, 427–446. [Google Scholar] [CrossRef]
  88. Beni, S.; Fletcher, T.; Ní Chróinín, D. ‘It’s Not a Linear Thing; There Are a Lot of Intersecting Circles’: Factors Influencing Teachers’ Implementation of Meaningful Physical Education. Teach. Teach. Educ. 2022, 117, 103806. [Google Scholar] [CrossRef]
  89. Maher, A.J.; Fitzgerald, H.; McVeigh, J. Factors Influencing the Culture of Special School Physical Education: A Gramscian Critique. Eur. Phys. Educ. Rev. 2020, 26, 954–969. [Google Scholar] [CrossRef]
  90. Century, J.; Cassata, A. Implementation Research: Finding Common Ground on What, How, Why, Where, and Who. Rev. Res. Educ. 2016, 40, 169–215. [Google Scholar] [CrossRef]
  91. Lee, K.-C.; Cho, S.-M. The Korean National Curriculum for Physical Education: A Shift from Edge to Central Subject. Phys. Educ. Sport Pedagog. 2014, 19, 522–532. [Google Scholar] [CrossRef]
  92. Hayes, S.; Capel, S.; Katene, W.; Cook, P. An Examination of Knowledge Prioritisation in Secondary Physical Education Teacher Education Courses. Teach. Teach. Educ. 2008, 24, 330–342. [Google Scholar] [CrossRef]
  93. Trudeau, F.; Shephard, R.J. Physical Education, School Physical Activity, School Sports and Academic Performance. Int. J. Behav. Nutr. Phys. Act. 2008, 5, 10. [Google Scholar] [CrossRef] [PubMed] [Green Version]
  94. Sprengeler, O.; Buck, C.; Hebestreit, A.; Wirsik, N.; Ahrens, W. Sports Contribute to Total Moderate to Vigorous Physical Activity in School Children. Med. Sci. Sport. Exerc. 2019, 51, 1653–1661. [Google Scholar] [CrossRef] [Green Version]
  95. Materová, E.; Pelclová, J.; Gába, A.; Frömel, K. Surveillance of Physical Activity and Sedentary Behaviour in Czech Children and Adolescents: A Scoping Review of the Literature from the Past Two Decades. BMC Public Health 2022, 22, 363. [Google Scholar] [CrossRef]
  96. Uddin, R.; Salmon, J.; Islam SM, S.; Khan, A. Physical Education Class Participation Is Associated with Physical Activity among Adolescents in 65 Countries. Sci. Rep. 2020, 10, 22128. [Google Scholar] [CrossRef]
  97. Hamadeh, N.; Rompaey, C.V.; Matreau, E.; Eapen, S.G. New World Country Classifications by Income Level; 2022–2023. Available online: https://blogs.worldbank.org/opendata/new-world-bank-country-classifications-income-level-2022 (accessed on 7 June 2023).
Figure 1. Flowchart of the successive milestones in the group concept mapping methodology.
Education 13 00699 g001
Figure 2. Percentage of pupils meeting the department of education physical education guidelines of two hours weekly by year group.
Education 13 00699 g002
Table 1. Characteristics of Participants (n = 112).
GenderMale (n = 53; 47.3%)
Female (n = 59; 52.7%)
Employment StatusFull Time (n = 99; 88.4%)
Part Time/Job Share (n = 11; 9.8%)
Voluntary (n = 2; 1.8%)
QualificationsQualified Teacher with PE Specialization (n = 106; 94.6%)
Qualified Teacher with no PE specialization (n = 5; 4.5%)
No Teaching Qualification (n = 1; 0.9%)
RoleHead PE Teacher (n = 70; 62.5%)
PE Teacher (n = 41; 36.6%)
Support Staff (n = 1; 0.9%)
Table 2. Grades according to school physical education, physical activity and sports indicators.
IndicatorGrade
PersonnelINC
CurriculumC−
Physical EducationB−
SportsC−
Physical ActivityD+
Facilities/EquipmentC+
BudgetC+
PartnershipsC−
Ethos/PrioritizationC+
Notes: A is 81% to 100% (succeeding with school physical education, physical activity and sports with a large majority of adolescents); B is 61% to 80% (succeeding with school physical education, physical activity and sports with well over half of adolescents); C is 41% to 60% (Succeeding with school physical education, physical activity and sports with about half of adolescents); D is 21% to 40% (succeeding with school physical education, physical activity and sports with less than half of adolescents); F is 0% to 20% (succeeding with school physical education, physical activity and sports with very few adolescents); and INC is inconclusive (not enough data exist on this indicator).
Table 3. Provision of physical education and sports activities (n=112).
Junior Cycle Physical EducationSenior Cycle Physical EducationSports
High ProvisionHigh ProvisionHigh Provision
Basketball (97.3%)Basketball (87.5%)Basketball (89.3%)
Athletics (95.5%)Badminton (83.9%)Athletics (84.8%)
Badminton (91.1%)Soccer (82.1%)Gaelic Football (78.5%)
Low ProvisionLow ProvisionLow Provision
Swimming (17.9%)Swimming (18.8%)Tennis (17.9%)
Hurling (12.5%)Hurling (10.7%)Rounders (17%)
Camogie (8%)Camogie (6.3%)Martial Arts (8%)
Range of PE ActivitiesRange of PE ActivitiesRange of Sport Activities
16+ Activities (14.4%)16+ Activities (11.6%)11+ Sports (22.3%)
11–15 Activities (67%)11–15 Activities (34.8%)6–10 Sports (50%)
0–10 Activities (19.6%)0–10 Activities (53.6%)0–5 Sports (27.7%)
Notes: High Provision indicates the top three most popular curricular and sports activities; Low Provision indicates the bottom three least popular curricular and sports activities.
Table 4. Descriptive statistics by school demographics and indicators of provision scores.
NPersonnelCurriculum Facilities and EquipmentBudgetPartnerships School Ethos and Pioritization
School Type
Boys1839.92 ± 8.7785.50 ± 13.112.66 ± 3.6112.94 ± 3.3512.18 ± 2.3230.13 ± 8.90
Girls2033.00 ± 7.4787.90 ± 10.611.60 ± 3.1111.57 ± 3.4611.97 ± 3.3728.93 ± 5.43
Mixed7439.26 ± 10.2884.11 ± 11.8511.95 ± 3.5811.56 ± 3.6812.07 ± 2.9329.80 ± 7.30
School Size
Small2843.26 ± 11.0882.80 ± 10.3413.25 ± 3.9410.19 ± 3.6210.61 ± 2.4527.27 ± 7.82
Medium6137.48 ± 9.3784.88 ± 12.2812.19 ± 3.3011.64 ± 3.3911.99 ± 2.7429.52 ± 7.12
Large2334.20 ± 6.9587.91 ± 12.0710.00 ± 2.5514.10 ± 2.9814.12 ± 2.7833.19 ± 5.60
State Demographic
Connacht1840.59 ± 10.6384.52 ± 11.4213.11 ± 3.3910.88 ± 4.0012.50 ± 2.9629.38 ± 8.46
Munster3742.32 ± 9.9885.74 ± 14.8213.16 ± 3.5811.77 ± 3.6412.00 ± 3.3030.77 ± 7.88
Leinster5134.86 ± 8.1983.80 ± 9.4810.64 ± 3.0812.15 ± 3.4812.05 ± 2.8029.00 ± 6.71
Ulster634.94 ± 10.3092.83 ± 10.6413.16 ± 3.1211.50 ± 3.4011.39 ± 0.9229.97 ± 3.89
DEIS Status
Non DEIS8537.70 ± 9.8186.26 ± 12.0712.04 ± 3.5512.05 ± 3.4512.28 ± 3.0529.85 ± 6.86
DEIS2739.96 ± 9.9680.96 ± 14.1011.88 ± 3.3710.96 ± 3.9611.41 ± 2.3529.27 ± 8.42
Notes: DEIS; Delivering Equality of Opportunities in Schools. Means refer to overall numerical values scored for each indicator of provision. Higher scores indicate higher levels of school physical education, physical activity and sports provision for each specified indicator.
Table 5. Significant differences between school demographic variables for each school physical education, physical activity and sports provision indicator.
PersonnelCurriculumFacilities and
Equipment
BudgetPartnershipsSchool Ethos and Prioritization
School Type0.029 *0.4480.6340.3350.9770.827
School Size0.004 **0.3260.003 **<0.001 +<0.001 +0.015 **
State Demographic0.002 **0.3050.002 **0.6430.8730.738
DEIS Status0.3030.035 *0.8390.1710.1810.719
Notes: Significance (p < 0.05) * Significance (p < 0.01) ** Significance (p < 0.001) +; DEIS; Delivering Equality of Opportunities in Schools. School type (boys; girls; mixed), school size (large; medium; small), state demographic (Connacht; Munster; Ulster; Leinster), DEIS (DEIS; Non DEIS).
Table 6. Tukey post hoc analysis for each significant difference between school demographic variables for each school physical education, physical activity and sports provision indicator.
PersonnelCurriculumFacilities and
Equipment
BudgetPartnershipsSchool Ethos and
Prioritization of PE, PA and Sports
School TypeMixed > Girls
Boys > Girls
NSNSNSNSNS
School SizeSmall > Medium
Small > Large
NSSmall > Large
Medium > Large
Large > Small
Large > Medium
Large > Small
Large > Medium
Large > Small
State DemographicMunster > LeinsterNSConnacht > Leinster
Munster > Leinster
NSNSNS
DEIS StatusNSNon Deis > DeisNSNSNSNS
Notes: DEIS; Delivering Equality of Opportunities in Schools. School type (boys; girls; mixed), school size (large; medium; small), state demographic (Connacht; Munster; Ulster; Leinster), DEIS (DEIS; Non DEIS).
Disclaimer/Publisher’s Note: The statements, opinions and data contained in all publications are solely those of the individual author(s) and contributor(s) and not of MDPI and/or the editor(s). MDPI and/or the editor(s) disclaim responsibility for any injury to people or property resulting from any ideas, methods, instructions or products referred to in the content.

