
The Expression of RAAS Key Receptors, Agtr2 and Bdkrb1, Is Downregulated at an Early Stage in a Rat Model of Wolfram Syndrome

 , , , , and
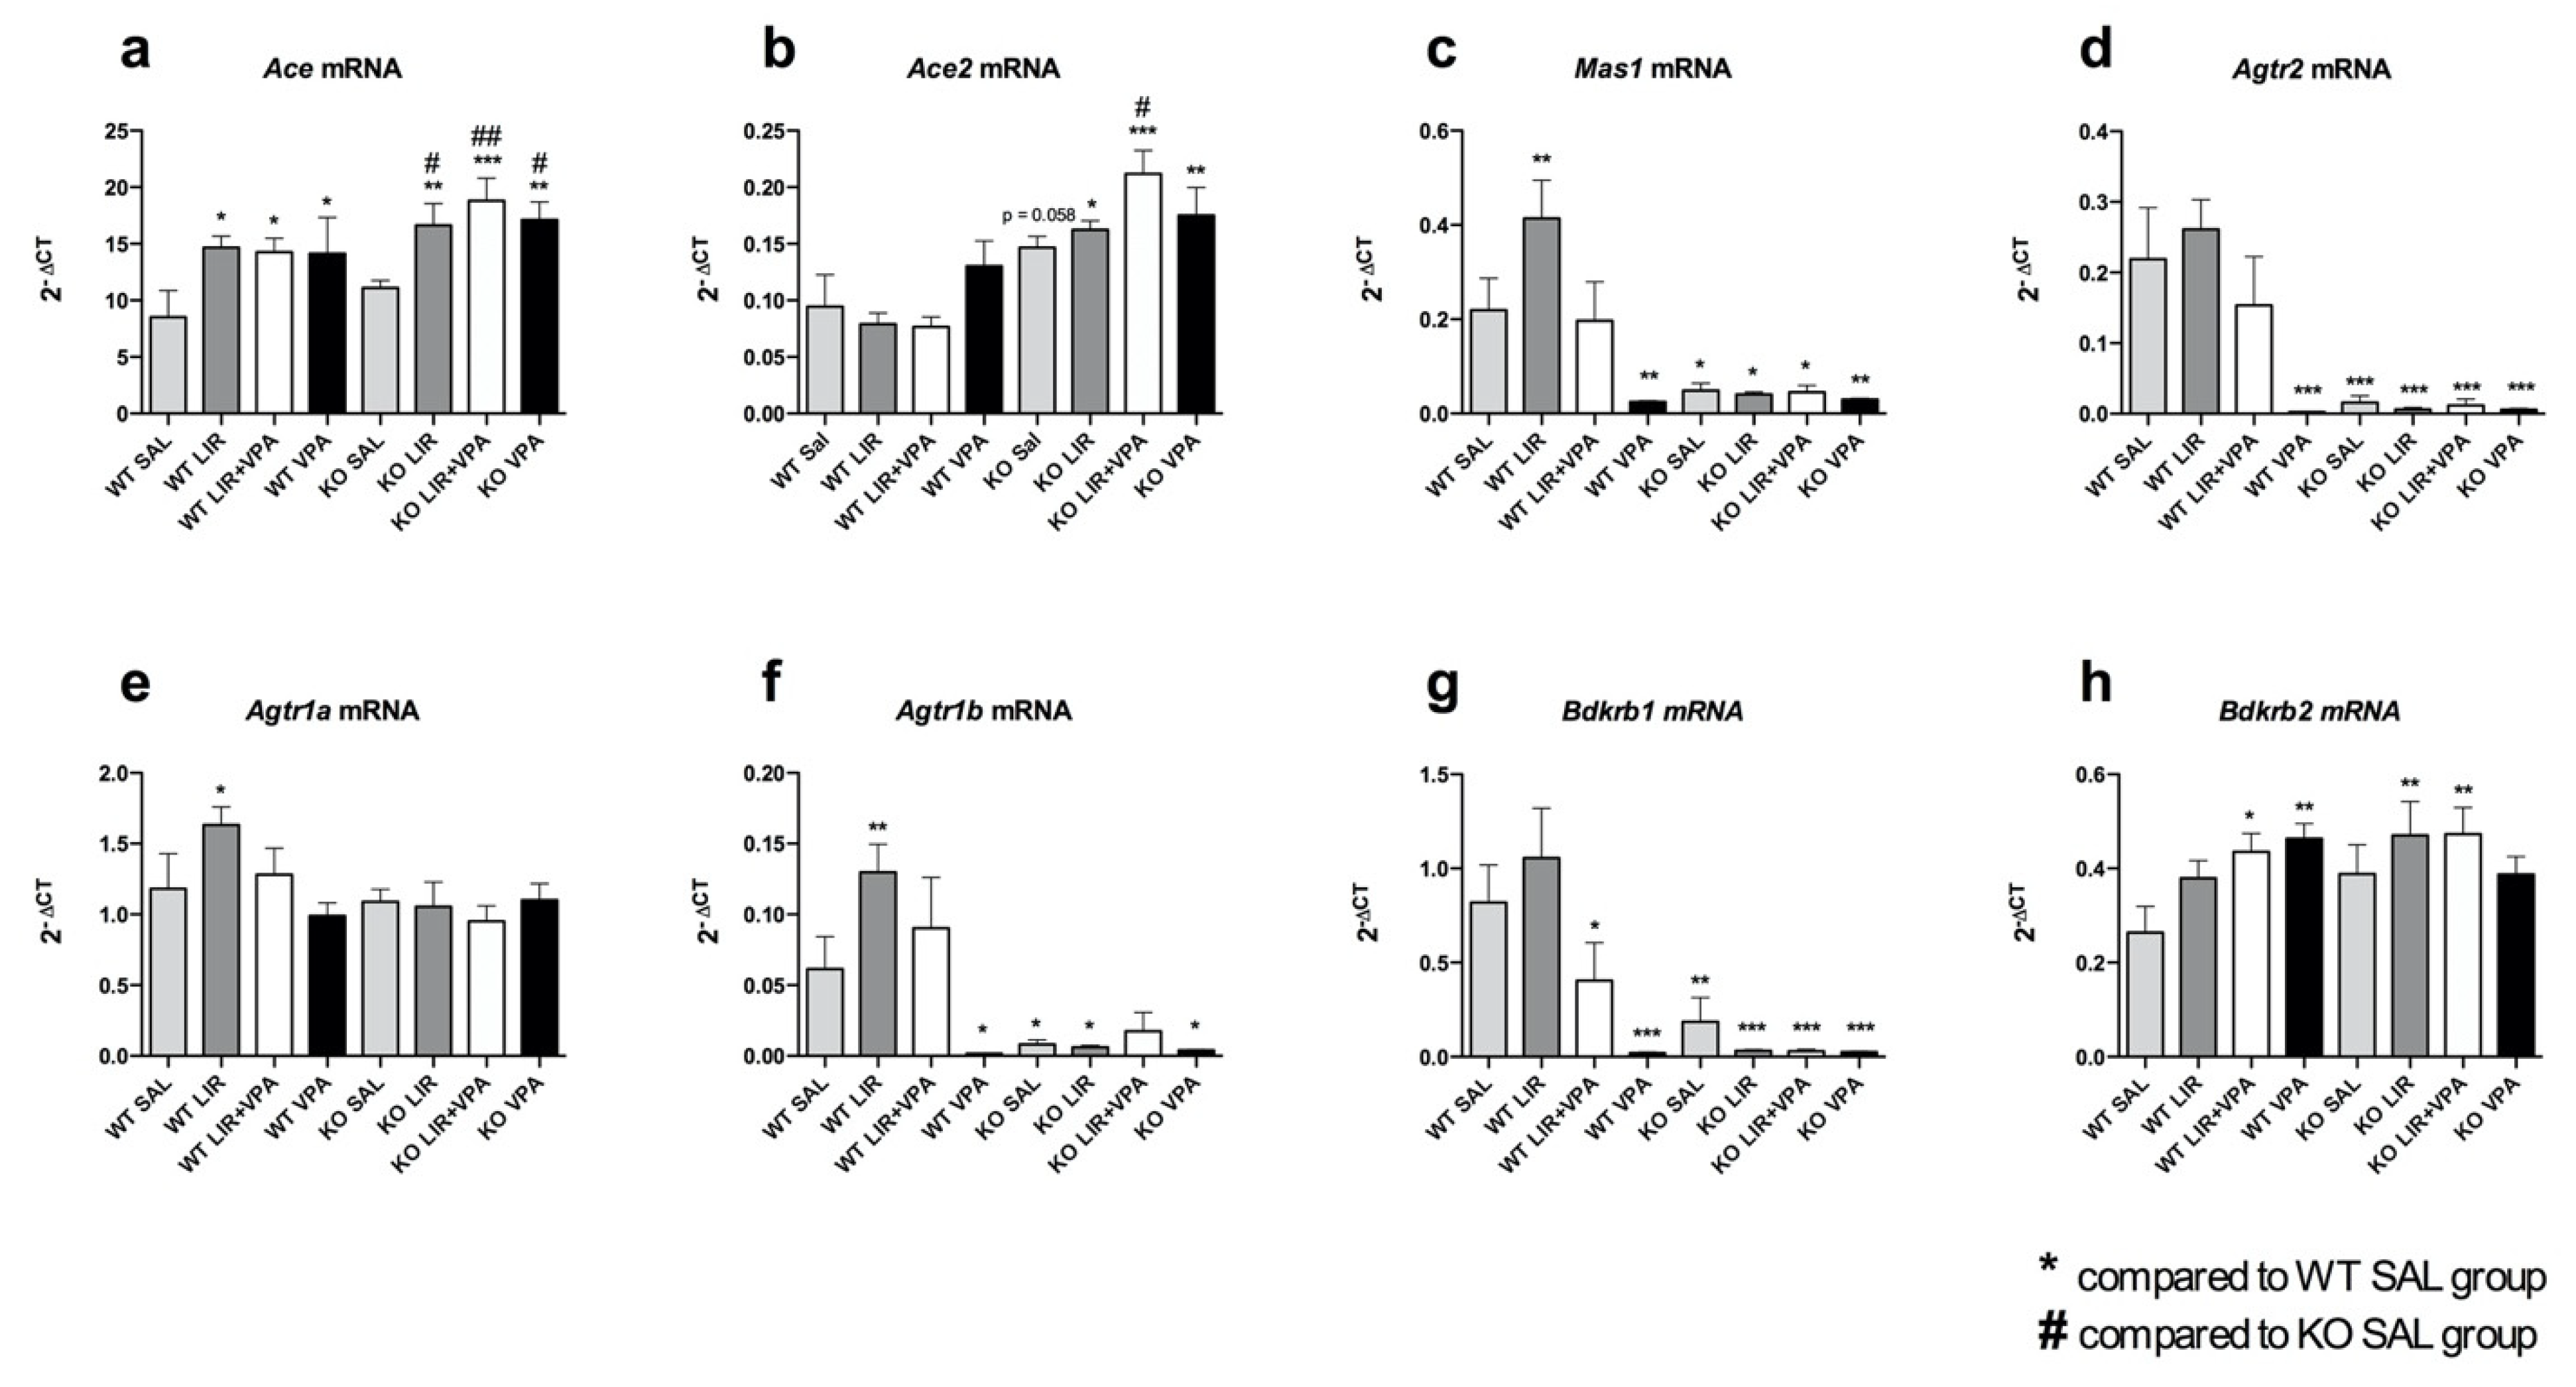
Abstract
:1. Introduction
2. Materials and Methods
2.1. Animals
2.2. Repeated Liraglutide and Valproate Treatment
2.3. Sample Collection
2.4. Cell Culture of Rat Primary Cortical Neurons
2.5. Transfection with Wfs1 SiRNA
2.6. RNA Isolation, cDNA Synthesis and Gene Expression Analyses
2.7. Peptide Level Determination from the Blood Serum
2.8. Na+ and K+ Level Detection from the Blood Serum
2.9. Statistical Analysis
3. Results
3.1. Agtr2, Agtr1b and Bdkrb1 Are Downregulated in a Rat Model of Wolfram Syndrome
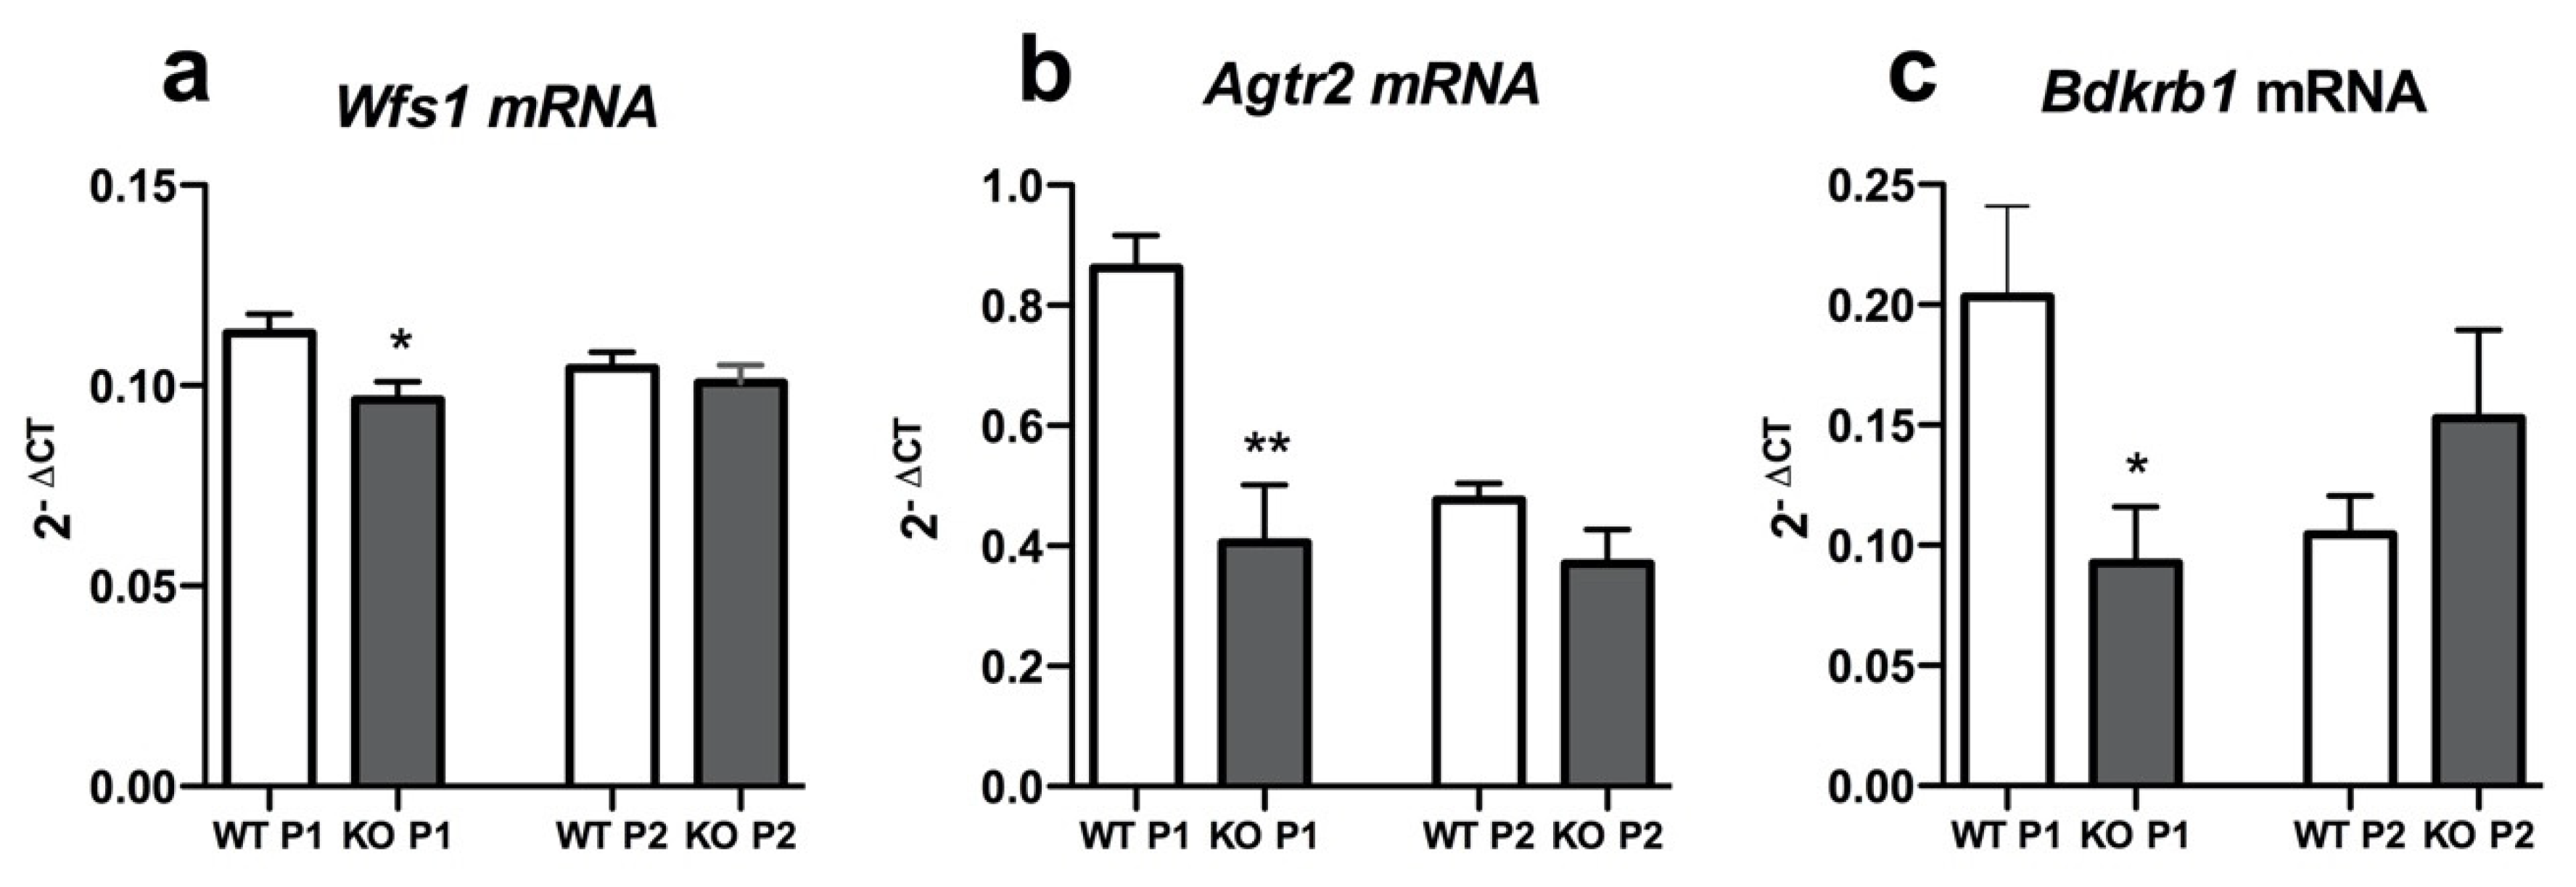
3.2. Agtr2 and Bdkrb1 Expression Is Downregulated in Primary Cortical Neurons of WS Rat
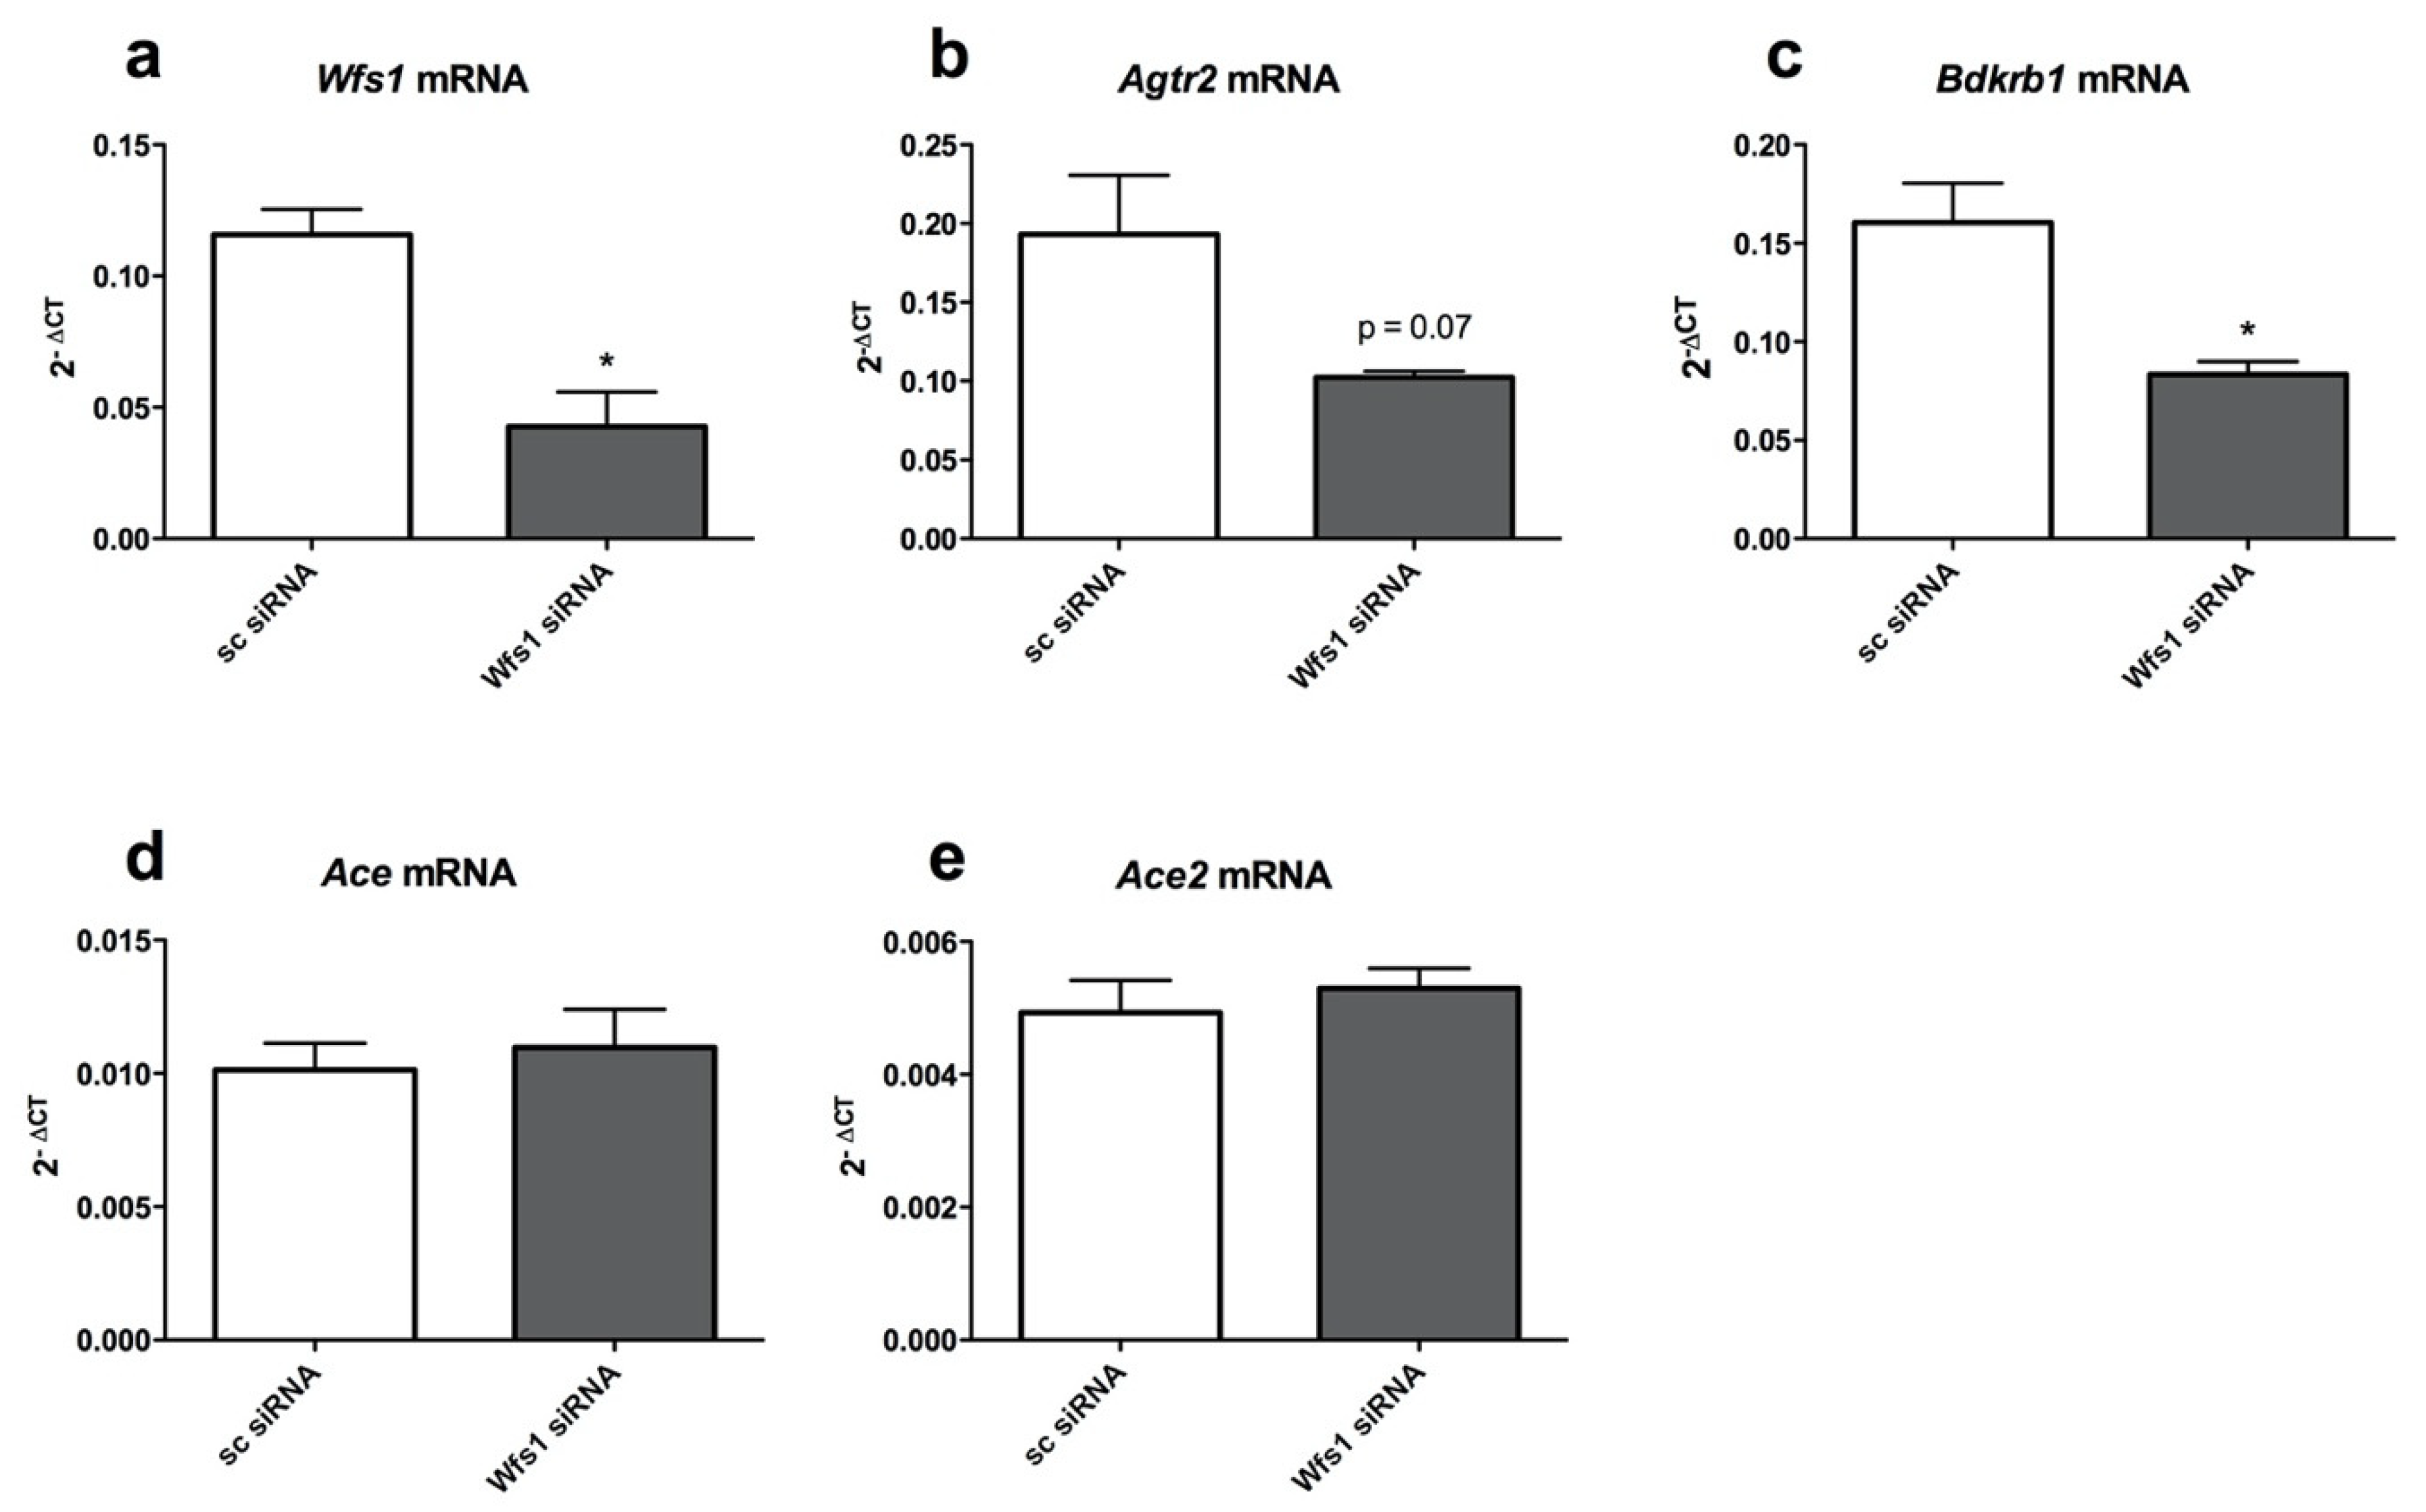
3.3. Agtr2 and Bdkrb1 Expression Is Downregulated in Wfs1 Knock-Down
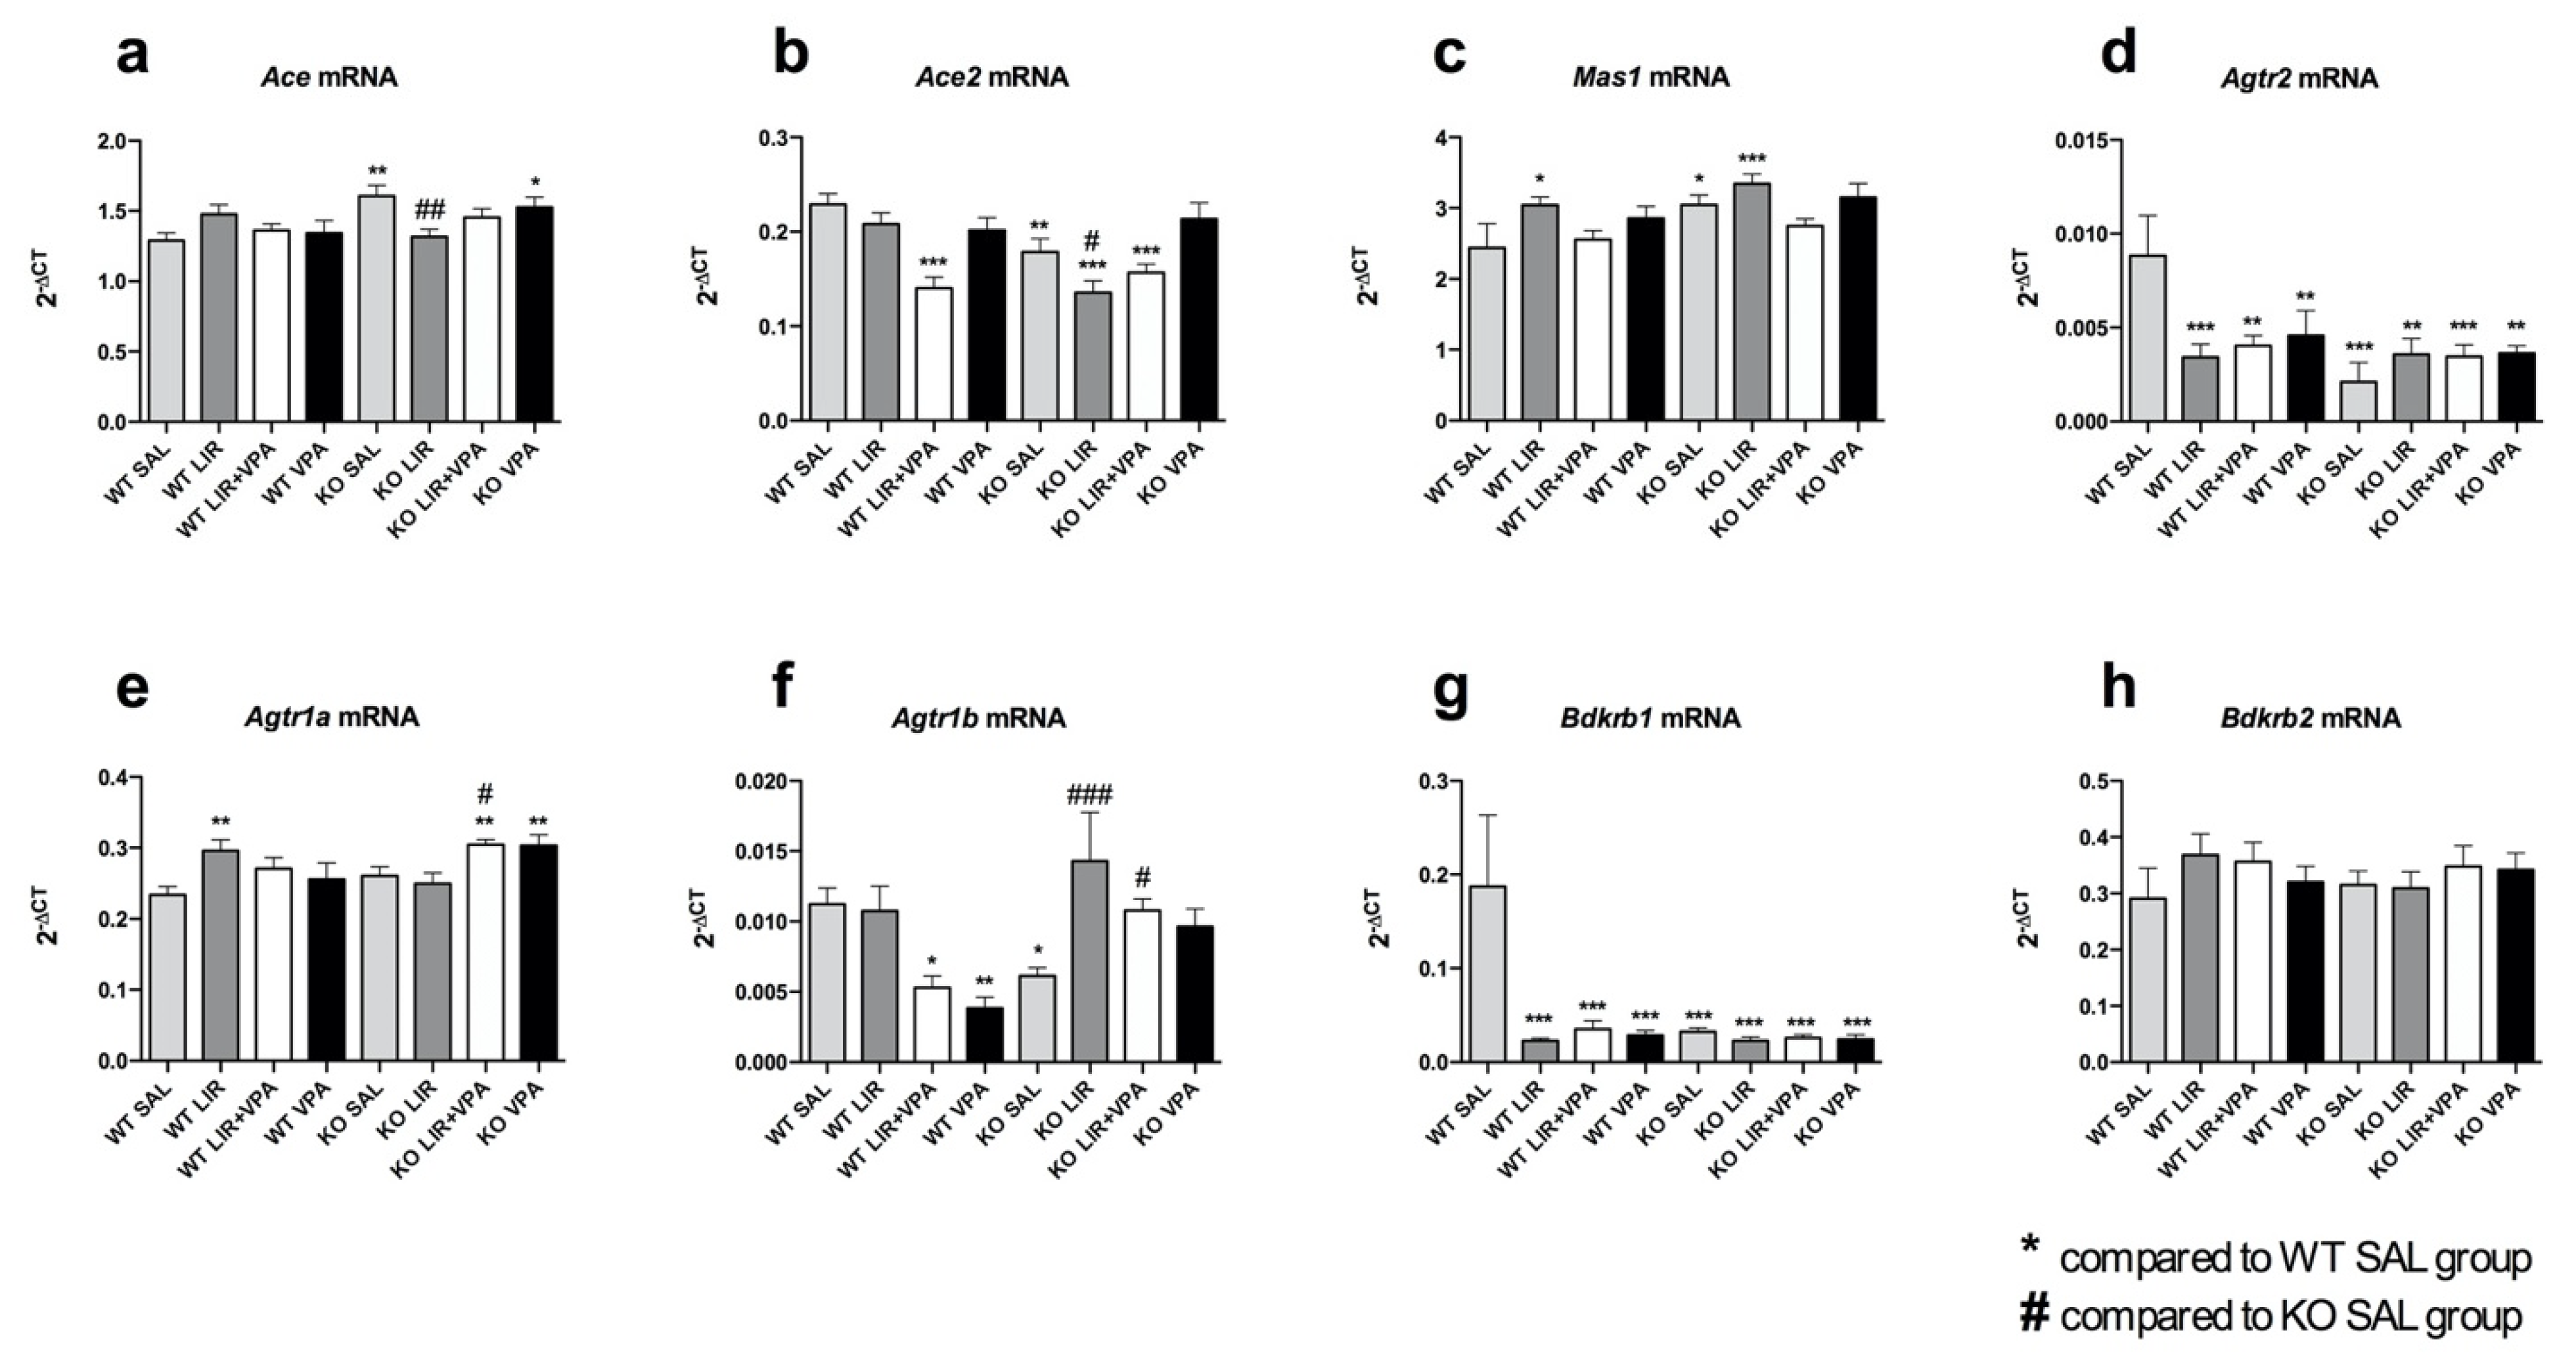
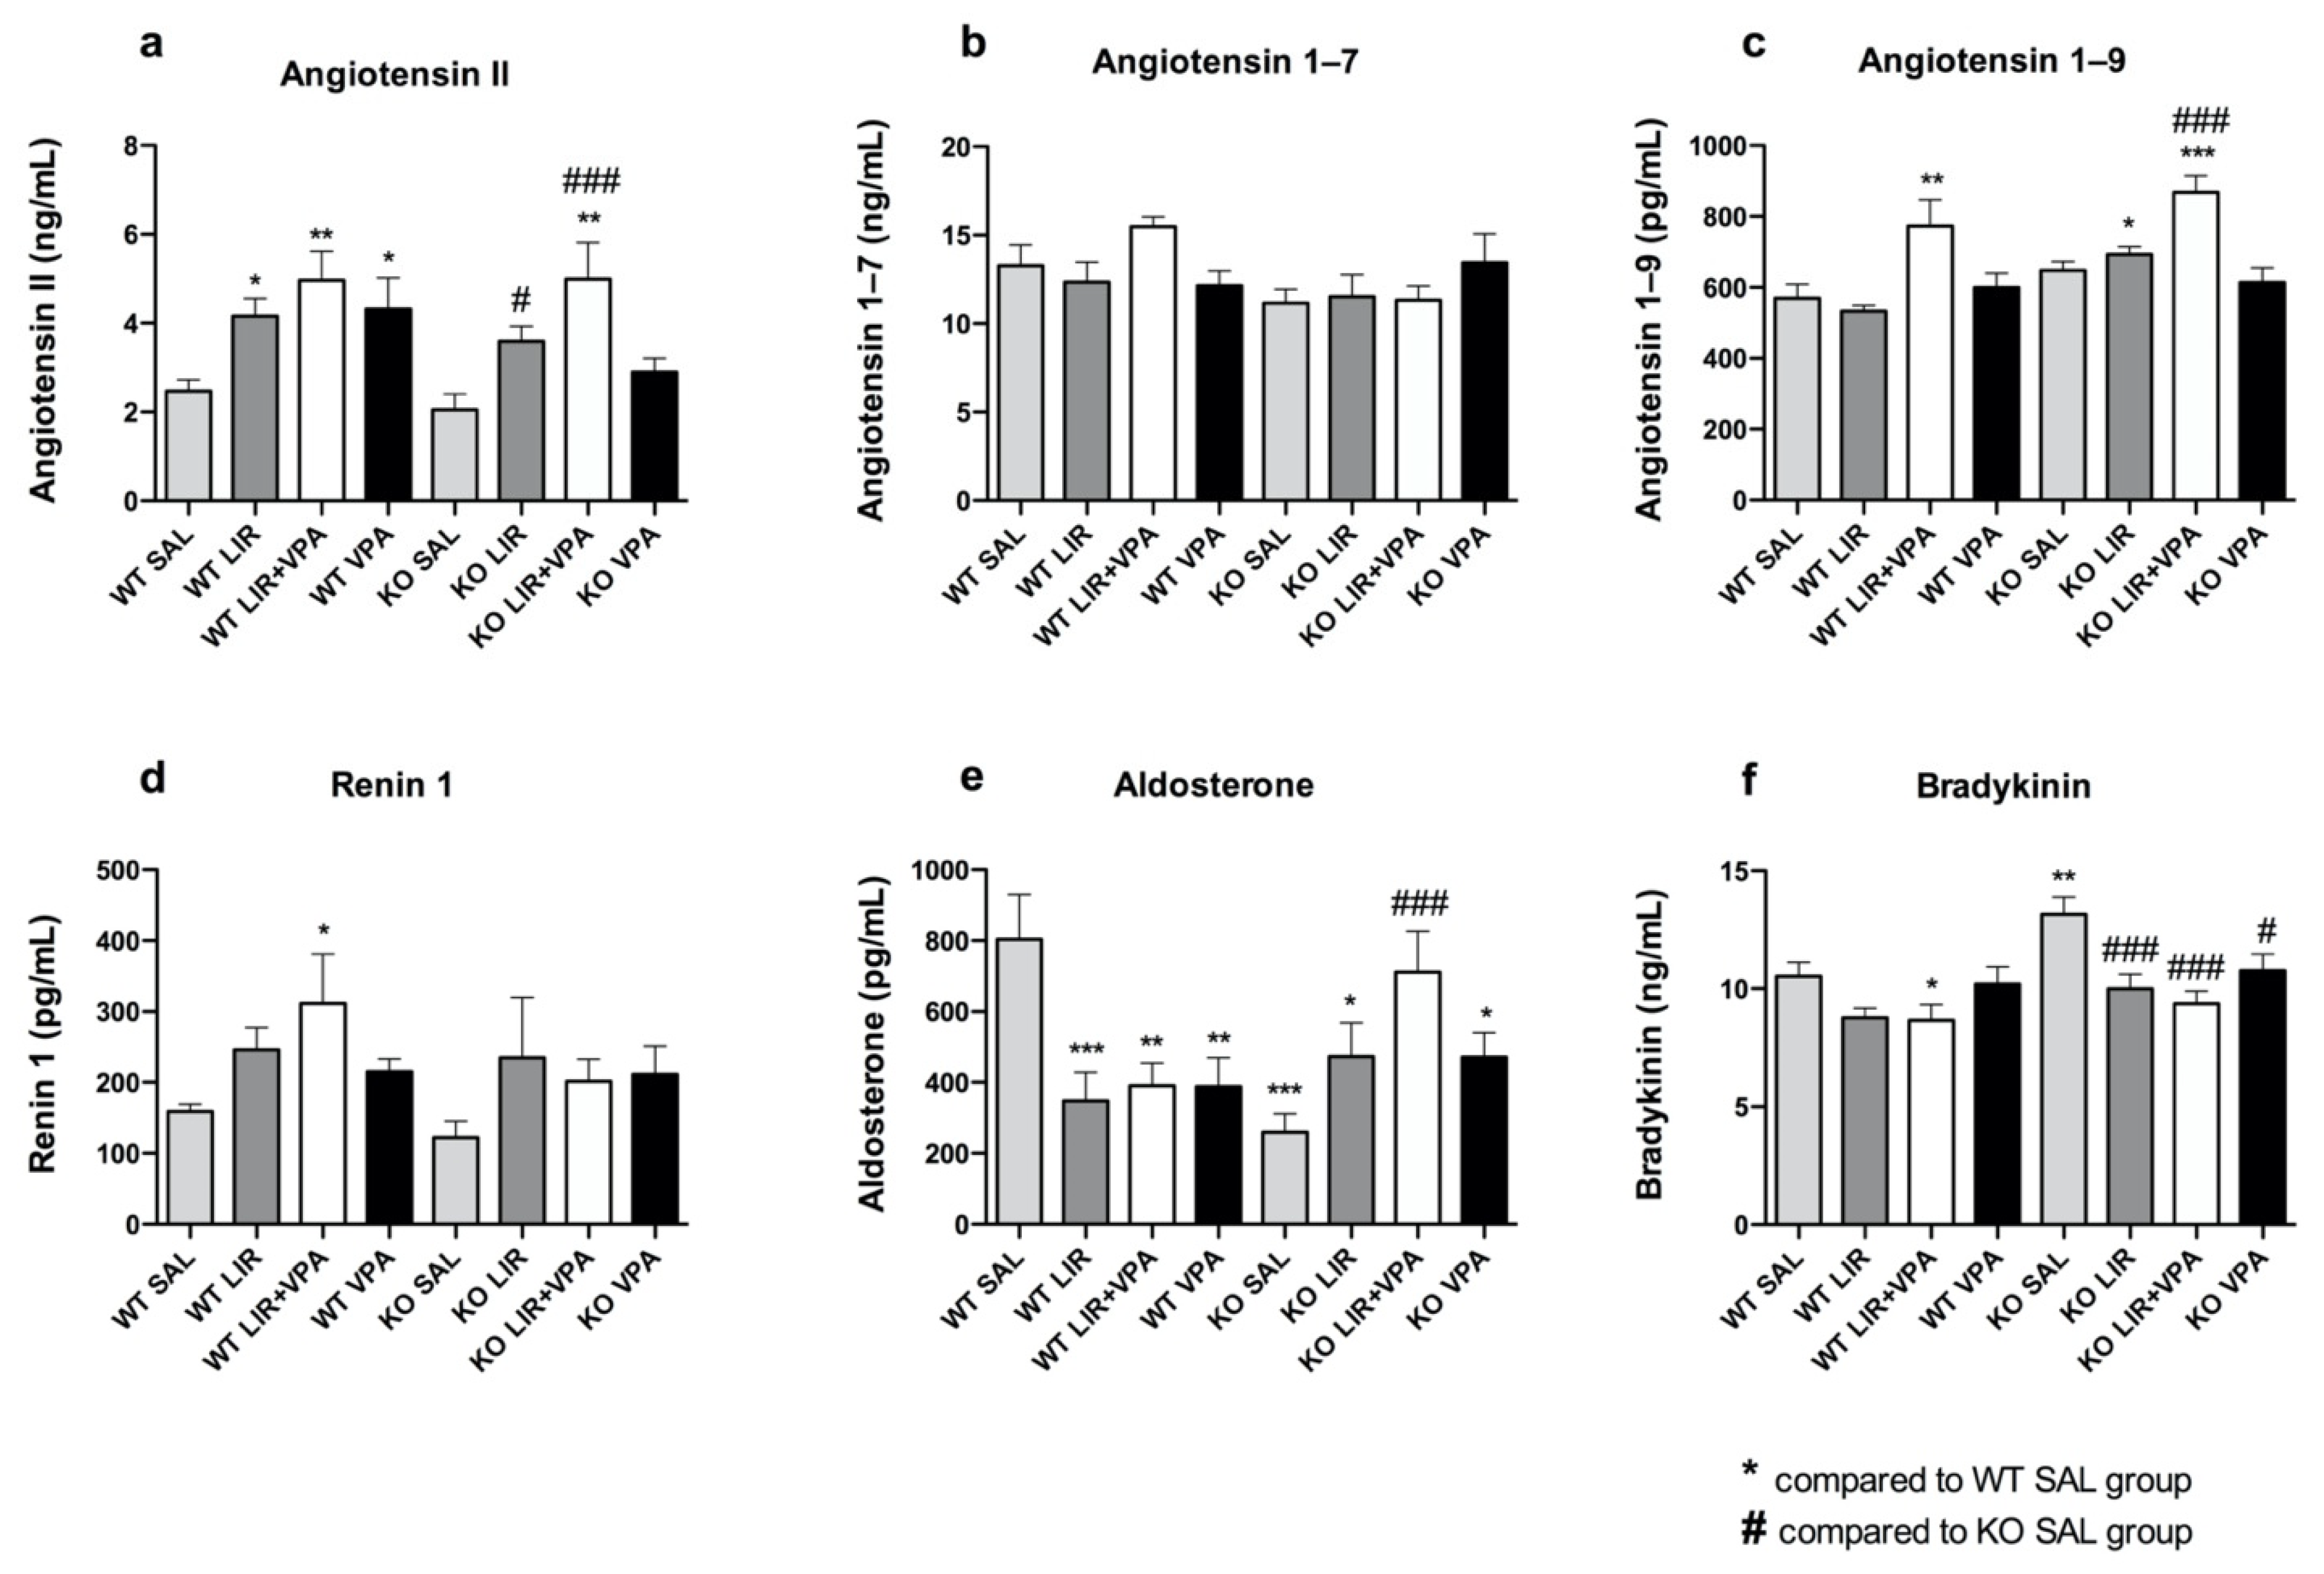
3.4. Liraglutide and VPA Have a Profound Effect on the Expression of RAAS Components
3.5. The Basal Level of Bradykinin Is Increased and Aldosterone Decreased in Wfs1 KO Rats
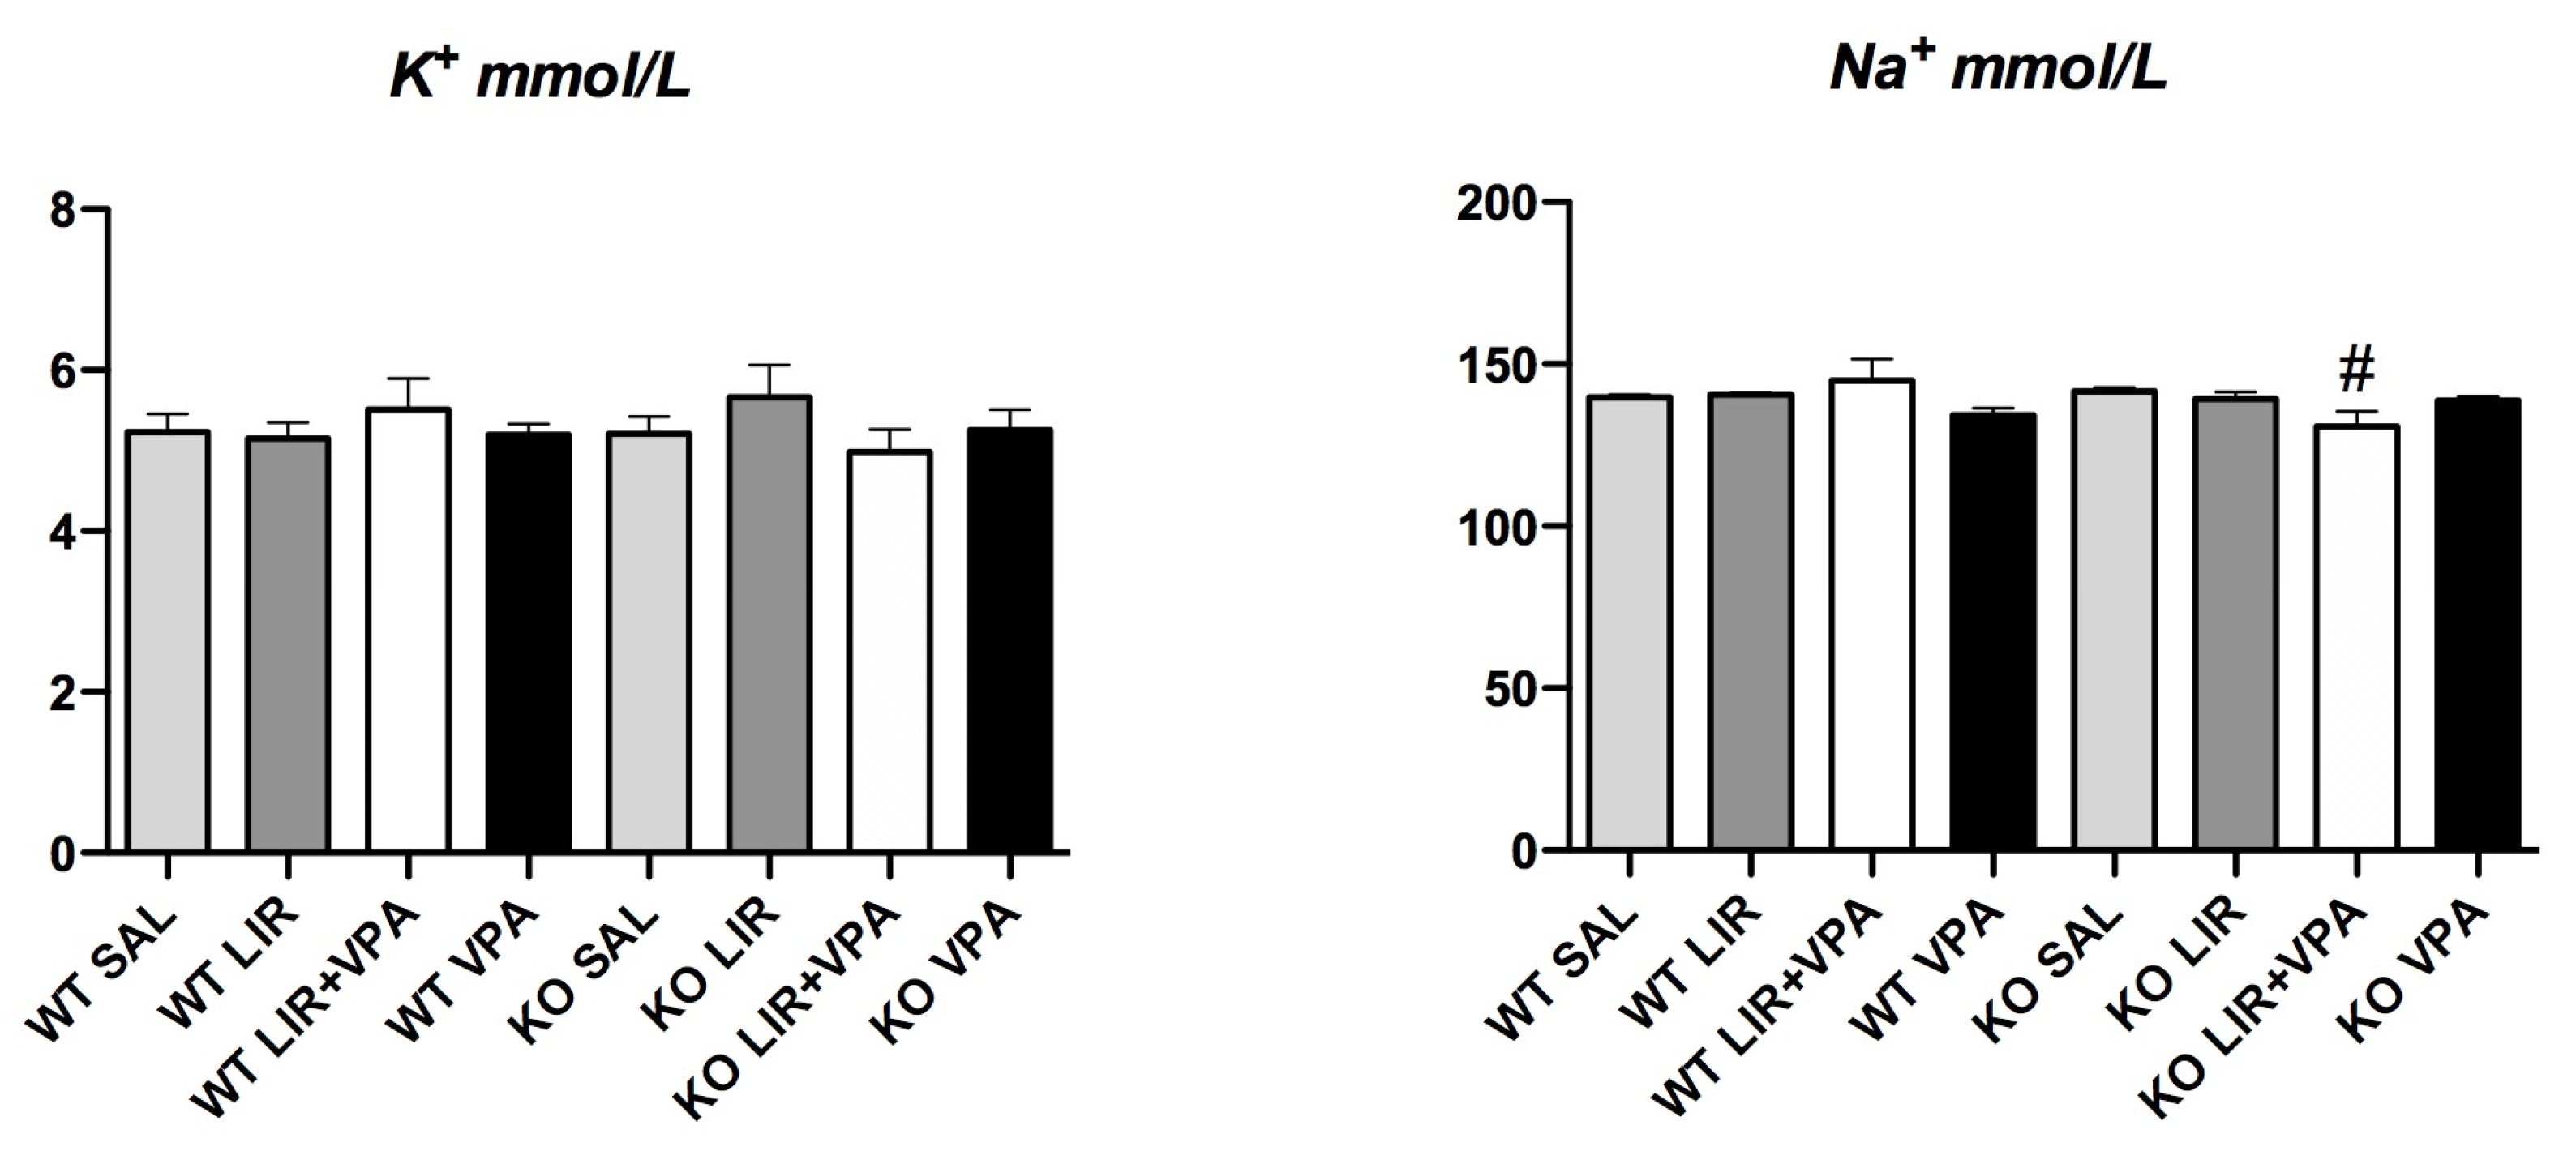
3.6. Genotype and Drug Treatment Had no Effect on Na+ and K+ Levels
4. Discussion
5. Conclusions
6. Limitations of the Study
Author Contributions
Funding
Institutional Review Board Statement
Informed Consent Statement
Data Availability Statement
Conflicts of Interest
References
- Barrett, T.G.; Bundey, S.E. Wolfram (DIDMOAD) Syndrome. J. Med. Genet. 1997, 34, 838–841. [Google Scholar] [CrossRef] [PubMed] [Green Version]
- Inoue, H.; Tanizawa, Y.; Wasson, J.; Behn, P.; Kalidas, K.; Bernal-Mizrachi, E.; Mueckler, M.; Marshall, H.; Donis-Keller, H.; Crock, P.; et al. A Gene Encoding a Transmembrane Protein Is Mutated in Patients with Diabetes Mellitus and Optic Atrophy (Wolfram Syndrome). Nat. Genet. 1998, 20, 143–148. [Google Scholar] [CrossRef]
- Plaas, M.; Seppa, K.; Reimets, R.; Jagomäe, T.; Toots, M.; Koppel, T.; Vallisoo, T.; Nigul, M.; Heinla, I.; Meier, R.; et al. Wfs1- Deficient Rats Develop Primary Symptoms of Wolfram Syndrome: Insulin-Dependent Diabetes, Optic Nerve Atrophy and Medullary Degeneration. Sci. Rep. 2017, 7, 10220. [Google Scholar] [CrossRef] [Green Version]
- Wajcberg, E.; Amarah, A. Liraglutide in the Management of Type 2 Diabetes. Drug Des. Dev. Ther. 2010, 4, 279–290. [Google Scholar] [CrossRef] [Green Version]
- Iepsen, E.W.; Torekov, S.S.; Holst, J.J. Liraglutide for Type 2 Diabetes and Obesity: A 2015 Update. Expert Rev. Cardiovasc. Ther. 2015, 13, 753–767. [Google Scholar] [CrossRef]
- Toots, M.; Seppa, K.; Jagomäe, T.; Koppel, T.; Pallase, M.; Heinla, I.; Terasmaa, A.; Plaas, M.; Vasar, E. Preventive Treatment with Liraglutide Protects against Development of Glucose Intolerance in a Rat Model of Wolfram Syndrome. Sci. Rep. 2018, 8, 10183. [Google Scholar] [CrossRef] [PubMed] [Green Version]
- Sedman, T.; Rünkorg, K.; Krass, M.; Luuk, H.; Plaas, M.; Vasar, E.; Volke, V. Exenatide Is an Effective Antihyperglycaemic Agent in a Mouse Model of Wolfram Syndrome 1. J. Diabetes Res. 2016, 2016, 9239530. [Google Scholar] [CrossRef] [Green Version]
- Kondo, M.; Tanabe, K.; Amo-Shiinoki, K.; Hatanaka, M.; Morii, T.; Takahashi, H.; Seino, S.; Yamada, Y.; Tanizawa, Y. Activation of GLP-1 Receptor Signalling Alleviates Cellular Stresses and Improves Beta Cell Function in a Mouse Model of Wolfram Syndrome. Diabetologia 2018, 61, 2189–2201. [Google Scholar] [CrossRef] [PubMed] [Green Version]
- Scully, K.J.; Wolfsdorf, J.I. Efficacy of GLP-1 Agonist Therapy in Autosomal Dominant WFS1-Related Disorder: A Case Report. Horm. Res. Paediatr. 2020, 93, 409–414. [Google Scholar] [CrossRef]
- Seppa, K.; Toots, M.; Reimets, R.; Jagomäe, T.; Koppel, T.; Pallase, M.; Hasselholt, S.; Mikkelsen, M.K.; Randel Nyengaard, J.; Vasar, E.; et al. GLP-1 Receptor Agonist Liraglutide Has a Neuroprotective Effect on an Aged Rat Model of Wolfram Syndrome. Sci. Rep. 2019, 9, 15742. [Google Scholar] [CrossRef]
- Seppa, K.; Jagomäe, T.; Kukker, K.G.; Reimets, R.; Pastak, M.; Vasar, E.; Terasmaa, A.; Plaas, M. Liraglutide, 7,8-DHF and Their Co-Treatment Prevents Loss of Vision and Cognitive Decline in a Wolfram Syndrome Rat Model. Sci. Rep. 2021, 11, 2275. [Google Scholar] [CrossRef] [PubMed]
- Kakiuchi, C.; Ishigaki, S.; Oslowski, C.M.; Fonseca, S.G.; Kato, T.; Urano, F. Valproate, a Mood Stabilizer, Induces WFS1 Expression and Modulates Its Interaction with ER Stress Protein GRP94. PLoS ONE 2009, 4, e4134. [Google Scholar] [CrossRef]
- Punapart, M.; Eltermaa, M.; Oflijan, J.; Sütt, S.; Must, A.; Kõks, S.; Schalkwyk, L.C.; Fernandes, C.; Vasar, E.; Soomets, U.; et al. Effect of Chronic Valproic Acid Treatment on Hepatic Gene Expression Profile in Wfs1 Knockout Mouse. PPAR Res. 2014, 2014, 349525. [Google Scholar] [CrossRef] [PubMed]
- Fonseca, S.G.; Ishigaki, S.; Oslowski, C.M.; Lu, S.; Lipson, K.L.; Ghosh, R.; Hayashi, E.; Ishihara, H.; Oka, Y.; Permutt, M.A.; et al. Wolfram Syndrome 1 Gene Negatively Regulates ER Stress Signaling in Rodent and Human Cells. J. Clin. Investig. 2010, 120, 744–755. [Google Scholar] [CrossRef] [Green Version]
- Batjargal, K.; Tajima, T.; Jimbo, E.F.; Yamagata, T. Effect of 4-Phenylbutyrate and Valproate on Dominant Mutations of WFS1 Gene in Wolfram Syndrome. J. Endocrinol. Investig. 2020, 43, 1317–1325. [Google Scholar] [CrossRef] [PubMed]
- Terasmaa, A.; Soomets, U.; Oflijan, J.; Punapart, M.; Hansen, M.; Matto, V.; Ehrlich, K.; Must, A.; Kõks, S.; Vasar, E. Wfs1 Mutation Makes Mice Sensitive to Insulin-like Effect of Acute Valproic Acid and Resistant to Streptozocin. J. Physiol. Biochem. 2011, 67, 381–390. [Google Scholar] [CrossRef]
- Romaní-Pérez, M.; Outeiriño-Iglesias, V.; Moya, C.M.; Santisteban, P.; González-Matías, L.C.; Vigo, E.; Mallo, F. Activation of the GLP-1 Receptor by Liraglutide Increases ACE2 Expression, Reversing Right Ventricle Hypertrophy, and Improving the Production of SP-A and SP-B in the Lungs of Type 1 Diabetes Rats. Endocrinology 2015, 156, 3559–3569. [Google Scholar] [CrossRef]
- Seppa, K.; Terasmaa, A.; Jagomäe, T.; Innos, J.; Vasar, E.; Plaas, M. Treatment with Valproate Downregulates the Agtr2 MRNA in Rat Lungs. bioRxiv 2020. [Google Scholar] [CrossRef]
- Ghadhanfar, E.; Alsalem, A.; Al-Kandari, S.; Naser, J.; Babiker, F.; Al-Bader, M. The Role of ACE2, Angiotensin-(1-7) and Mas1 Receptor Axis in Glucocorticoid-Induced Intrauterine Growth Restriction. Reprod. Biol. Endocrinol. 2017, 15, 97. [Google Scholar] [CrossRef] [Green Version]
- Perini, M.V.; Dmello, R.S.; Nero, T.L.; Chand, A.L. Evaluating the Benefits of Renin-Angiotensin System Inhibitors as Cancer Treatments. Pharmacol. Ther. 2020, 211, 107527. [Google Scholar] [CrossRef]
- Ribeiro-Oliveira, A.; Nogueira, A.I.; Pereira, R.M.; Boas, W.W.V.; Dos Santos, R.A.S.; Simões e Silva, A.C. The Renin-Angiotensin System and Diabetes: An Update. Vasc. Health Risk Manag. 2008, 4, 787–803. [Google Scholar]
- Labandeira-Garcia, J.L.; Rodríguez-Perez, A.I.; Garrido-Gil, P.; Rodriguez-Pallares, J.; Lanciego, J.L.; Guerra, M.J. Brain Renin-Angiotensin System and Microglial Polarization: Implications for Aging and Neurodegeneration. Front. Aging Neurosci. 2017, 9, 129. [Google Scholar] [CrossRef] [Green Version]
- Guimond, M.-O.; Gallo-Payet, N. The Angiotensin II Type 2 Receptor in Brain Functions: An Update. Int. J. Hypertens. 2012, 2012, 351758. [Google Scholar] [CrossRef] [Green Version]
- Ganten, D.; Marquez-Julio, A.; Granger, P.; Hayduk, K.; Karsunky, K.P.; Boucher, R.; Genest, J. Renin in Dog Brain. Am. J. Physiol. 1971, 221, 1733–1737. [Google Scholar] [CrossRef] [Green Version]
- Wright, J.W.; Harding, J.W. The Brain Renin–Angiotensin System: A Diversity of Functions and Implications for CNS Diseases. Pflugers. Arch. Eur. J. Physiol. 2013, 465, 133–151. [Google Scholar] [CrossRef]
- Leung, P.S.; Chappell, M.C. A Local Pancreatic Renin-Angiotensin System: Endocrine and Exocrine Roles. Int. J. Biochem. Cell Biol. 2003, 35, 838–846. [Google Scholar] [CrossRef]
- Schweda, F.; Friis, U.; Wagner, C.; Skott, O.; Kurtz, A. Renin Release. Physiology 2007, 22, 310–319. [Google Scholar] [CrossRef] [Green Version]
- Ames, M.K.; Atkins, C.E.; Pitt, B. The Renin-angiotensin-aldosterone System and Its Suppression. J. Veter. Intern. Med. 2019, 33, 363–382. [Google Scholar] [CrossRef] [PubMed] [Green Version]
- Santos, R.A.S.; Simoes e Silva, A.C.; Maric, C.; Silva, D.M.R.; Machado, R.P.; de Buhr, I.; Heringer-Walther, S.; Pinheiro, S.V.B.; Lopes, M.T.; Bader, M.; et al. Angiotensin-(1-7) Is an Endogenous Ligand for the G Protein-Coupled Receptor Mas. Proc. Natl. Acad. Sci. USA 2003, 100, 8258–8263. [Google Scholar] [CrossRef] [Green Version]
- Yue, X.; Basting, T.M.; Flanagan, T.W.; Xu, J.; Lobell, T.D.; Gilpin, N.W.; Gardner, J.D.; Lazartigues, E. Nicotine Downregulates the Compensatory Angiotensin-Converting Enzyme 2/Angiotensin Type 2 Receptor of the Renin–Angiotensin System. Ann. Am. Thorac. Soc. 2018, 15, S126–S127. [Google Scholar] [CrossRef]
- Hunley, T.E.; Tamura, M.; Stoneking, B.J.; Nishimura, H.; Ichiki, T.; Inagami, T.; Kon, V. The Angiotensin Type II Receptor Tonically Inhibits Angiotensin-Converting Enzyme in AT2 Null Mutant Mice. Kidney Int. 2000, 57, 570–577. [Google Scholar] [CrossRef]
- Lucius, R.; Gallinat, S.; Rosenstiel, P.; Herdegen, T.; Sievers, J.; Unger, T. The Angiotensin II Type 2 (AT2) Receptor Promotes Axonal Regeneration in the Optic Nerve of Adult Rats. J. Exp. Med. 1998, 188, 661–670. [Google Scholar] [CrossRef] [Green Version]
- Schmaier, A.H. The Plasma Kallikrein-Kinin System Counterbalances the Renin-Angiotensin System. J. Clin. Investig. 2002, 109, 1007–1009. [Google Scholar] [CrossRef]
- Girolami, J.-P.; Bouby, N.; Richer-Giudicelli, C.; Alhenc-Gelas, F. Kinins and Kinin Receptors in Cardiovascular and Renal Diseases. Pharmaceuticals 2021, 14, 240. [Google Scholar] [CrossRef] [PubMed]
- Hofman, Z.; de Maat, S.; Hack, C.E.; Maas, C. Bradykinin: Inflammatory Product of the Coagulation System. Clin. Rev. Allergy Immunol. 2016, 51, 152–161. [Google Scholar] [CrossRef] [Green Version]
- Ifuku, M.; Färber, K.; Okuno, Y.; Yamakawa, Y.; Miyamoto, T.; Nolte, C.; Merrino, V.F.; Kita, S.; Iwamoto, T.; Komuro, I.; et al. Bradykinin-Induced Microglial Migration Mediated by B1-Bradykinin Receptors Depends on Ca2+ Influx via Reverse-Mode Activity of the Na+/Ca2+ Exchanger. J. Neurosci. 2007, 27, 13065–13073. [Google Scholar] [CrossRef] [Green Version]
- Chen, Z.; Tan, F.; Erdös, E.G.; Deddish, P.A. Hydrolysis of Angiotensin Peptides by Human Angiotensin I-Converting Enzyme and the Resensitization of B2 Kinin Receptors. Hypertension 2005, 46, 1368–1373. [Google Scholar] [CrossRef] [PubMed] [Green Version]
- Pellacani, A.; Brunner, H.R.; Nussberger, J. Plasma Kinins Increase after Angiotensin-Converting Enzyme Inhibition in Human Subjects. Clin. Sci. 1994, 87, 567–574. [Google Scholar] [CrossRef] [PubMed]
- Hornig, B.; Kohler, C.; Drexler, H. Role of Bradykinin in Mediating Vascular Effects of Angiotensin-Converting Enzyme Inhibitors in Humans. Circulation 1997, 95, 1115–1118. [Google Scholar] [CrossRef]
- Luuk, H.; Koks, S.; Plaas, M.; Hannibal, J.; Rehfeld, J.F.; Vasar, E. Distribution of Wfs1 Protein in the Central Nervous System of the Mouse and Its Relation to Clinical Symptoms of the Wolfram Syndrome. J. Comp. Neurol. 2008, 509, 642–660. [Google Scholar] [CrossRef]
- Hofmann, S.; Philbrook, C.; Gerbitz, K.-D.; Bauer, M.F. Wolfram Syndrome: Structural and Functional Analyses of Mutant and Wild-Type Wolframin, the WFS1 Gene Product. Hum. Mol. Genet. 2003, 12, 2003–2012. [Google Scholar] [CrossRef] [Green Version]
- The Human Protein Atlas. Available online: https://www.proteinatlas.org/ (accessed on 21 February 2021).
- GeneCards—Human Genes. Gene Database. Gene Search. Available online: https://www.genecards.org/ (accessed on 21 February 2021).
- Fonseca, S.G.; Fukuma, M.; Lipson, K.L.; Nguyen, L.X.; Allen, J.R.; Oka, Y.; Urano, F. WFS1 Is a Novel Component of the Unfolded Protein Response and Maintains Homeostasis of the Endoplasmic Reticulum in Pancreatic Beta-Cells. J. Biol. Chem. 2005, 280, 39609–39615. [Google Scholar] [CrossRef] [PubMed] [Green Version]
- Takei, D.; Ishihara, H.; Yamaguchi, S.; Yamada, T.; Tamura, A.; Katagiri, H.; Maruyama, Y.; Oka, Y. WFS1 Protein Modulates the Free Ca(2+) Concentration in the Endoplasmic Reticulum. FEBS Lett. 2006, 580, 5635–5640. [Google Scholar] [CrossRef] [Green Version]
- Medlej, R.; Wasson, J.; Baz, P.; Azar, S.; Salti, I.; Loiselet, J.; Permutt, A.; Halaby, G. Diabetes Mellitus and Optic Atrophy: A Study of Wolfram Syndrome in the Lebanese Population. J. Clin. Endocrinol. Metab. 2004, 89, 1656–1661. [Google Scholar] [CrossRef] [PubMed] [Green Version]
- Fabbri, L.P.; Nucera, M.; Grippo, A.; Menicucci, A.; De Feo, M.L.; Becchi, C.; Al Malyan, M. Wolfram Syndrome. How Much Could Knowledge Challenge the Fate? A Case Report. Med. Sci. Monit. 2005, 11, CS40–CS44. [Google Scholar]
- Lynch, T. Family Reflections: Our Family’s Journey with Wolfram Syndrome. Pediatr. Res. 2020, 87, 608. [Google Scholar] [CrossRef] [Green Version]
- Cagalinec, M.; Safiulina, D.; Liiv, M.; Liiv, J.; Choubey, V.; Wareski, P.; Veksler, V.; Kaasik, A. Principles of the Mitochondrial Fusion and Fission Cycle in Neurons. J. Cell Sci. 2013, 126, 2187–2197. [Google Scholar] [CrossRef] [Green Version]
- Livak, K.J.; Schmittgen, T.D. Analysis of Relative Gene Expression Data Using Real-Time Quantitative PCR and the 2(-Delta Delta C(T)) Method. Methods 2001, 25, 402–408. [Google Scholar] [CrossRef] [PubMed]
- Sun, D.-P.; Lee, Y.-W.; Chen, J.-T.; Lin, Y.-W.; Chen, R.-M. The Bradykinin-BDKRB1 Axis Regulates Aquaporin 4 Gene Expression and Consequential Migration and Invasion of Malignant Glioblastoma Cells via a Ca2+-MEK1-ERK1/2-NF-ΚB Mechanism. Cancers 2020, 12, 667. [Google Scholar] [CrossRef] [PubMed] [Green Version]
- Tremblay, A.; Parker, K.L.; Lehoux, J.G. Dietary Potassium Supplementation and Sodium Restriction Stimulate Aldosterone Synthase but Not 11 Beta-Hydroxylase P-450 Messenger Ribonucleic Acid Accumulation in Rat Adrenals and Require Angiotensin II Production. Endocrinology 1992, 130, 3152–3158. [Google Scholar] [CrossRef] [PubMed]
- Lehoux, J.G.; Bird, I.M.; Rainey, W.E.; Tremblay, A.; Ducharme, L. Both Low Sodium and High Potassium Intake Increase the Level of Adrenal Angiotensin-II Receptor Type 1, but Not That of Adrenocorticotropin Receptor. Endocrinology 1994, 134, 776–782. [Google Scholar] [CrossRef] [PubMed]
- Clinicaltrials.gov. A Pivotal, International, Randomised, Double-Blind, Efficacy and Safety Trial of Sodium Valproate, in Paediatric and Adult Patients with Wolfram Syndrome; University of Birmingham: Birmingham, UK, 2020.
- Cui, Q.; Cui, C.; Huang, C.; Zhou, W.; Ji, X.; Zhang, F.; Wang, L.; Zhou, Y. AGTR2, One Possible Novel Key Gene for the Entry of 2019-NCoV into Human Cells. Preprints 2020, 2020020194. [Google Scholar] [CrossRef] [Green Version]
- Guo, X.; Shen, S.; Song, S.; He, S.; Cui, Y.; Xing, G.; Wang, J.; Yin, Y.; Fan, L.; He, F.; et al. The E3 Ligase Smurf1 Regulates Wolfram Syndrome Protein Stability at the Endoplasmic Reticulum. J. Biol. Chem. 2011, 286, 18037–18047. [Google Scholar] [CrossRef] [Green Version]
- Fourkiotis, V.G.; Hanslik, G.; Hanusch, F.; Lepenies, J.; Quinkler, M. Aldosterone and the Kidney. Horm. Metab. Res. 2012, 44, 194–201. [Google Scholar] [CrossRef]
- Luik, P.T.; Kerstens, M.N.; Hoogenberg, K.; Navis, G.J.; Dullaart, R.P.F. Low Plasma Aldosterone despite Normal Plasma Renin Activity in Uncomplicated Type 1 Diabetes Mellitus: Effects of RAAS Stimulation. Eur. J. Clin. Investig. 2003, 33, 787–793. [Google Scholar] [CrossRef]
- Colussi, G.; Catena, C.; Lapenna, R.; Nadalini, E.; Chiuch, A.; Sechi, L.A. Insulin Resistance and Hyperinsulinemia Are Related to Plasma Aldosterone Levels in Hypertensive Patients. Diabetes Care 2007, 30, 2349–2354. [Google Scholar] [CrossRef] [Green Version]
- Lastra-Lastra, G.; Sowers, J.R.; Restrepo-Erazo, K.; Manrique-Acevedo, C.; Lastra-González, G. Role of Aldosterone and Angiotensin II in Insulin Resistance: An Update. Clin. Endocrinol. 2009, 71, 1–6. [Google Scholar] [CrossRef]
- Wilkinson-Berka, J.L.; Suphapimol, V.; Jerome, J.R.; Deliyanti, D.; Allingham, M.J. Angiotensin II and Aldosterone in Retinal Vasculopathy and Inflammation. Exp. Eye Res. 2019, 187, 107766. [Google Scholar] [CrossRef] [PubMed]
- Yatabe, J.; Yoneda, M.; Yatabe, M.S.; Watanabe, T.; Felder, R.A.; Jose, P.A.; Sanada, H. Angiotensin III Stimulates Aldosterone Secretion from Adrenal Gland Partially via Angiotensin II Type 2 Receptor but Not Angiotensin II Type 1 Receptor. Endocrinology 2011, 152, 1582–1588. [Google Scholar] [CrossRef] [Green Version]
- Sedman, T.; Heinla, K.; Vasar, E.; Volke, V. Liraglutide Treatment May Affect Renin and Aldosterone Release. Horm. Metab. Res. 2017, 49, 5–9. [Google Scholar] [CrossRef] [PubMed]
- Heinla, K.; Vasar, E.; Sedman, T.; Volke, V. A GLP-1 Receptor Agonist Inhibits Aldosterone Release in Healthy Volunteers. Horm. Metab. Res. 2021, 53, 402–407. [Google Scholar] [CrossRef]
- Qadri, F.; Bader, M. Kinin B1 Receptors as a Therapeutic Target for Inflammation. Expert Opin. Ther. Targets 2018, 22, 31–44. [Google Scholar] [CrossRef]
- Kureková, S.; Plaas, M.; Cagalinec, M. Lack of Functional Wolframin Causes Drop in Plasmalemmal Sodium-Calcium Exchanger Type 1 Expression at Early Stage in Rat Model of Wolfram Syndrome. Gen. Physiol. Biophys. 2020, 39, 499–503. [Google Scholar] [CrossRef] [PubMed]
- La Morgia, C.; Maresca, A.; Amore, G.; Gramegna, L.L.; Carbonelli, M.; Scimonelli, E.; Danese, A.; Patergnani, S.; Caporali, L.; Tagliavini, F.; et al. Calcium Mishandling in Absence of Primary Mitochondrial Dysfunction Drives Cellular Pathology in Wolfram Syndrome. Sci. Rep. 2020, 10, 4785. [Google Scholar] [CrossRef] [PubMed]
- Diniz, C.R.A.F.; Casarotto, P.C.; Fred, S.M.; Biojone, C.; Castrén, E.; Joca, S.R.L. Antidepressant-like Effect of Losartan Involves TRKB Transactivation from Angiotensin Receptor Type 2 (AGTR2) and Recruitment of FYN. Neuropharmacology 2018, 135, 163–171. [Google Scholar] [CrossRef] [PubMed]
- Abadir, P.M.; Periasamy, A.; Carey, R.M.; Siragy, H.M. Angiotensin II Type 2 Receptor-Bradykinin B2 Receptor Functional Heterodimerization. Hypertension 2006, 48, 316–322. [Google Scholar] [CrossRef] [Green Version]
- Kleanthous, K.; Maratou, E.; Spyropoulou, D.; Dermitzaki, E.; Papadimitriou, A.; Zoupanos, G.; Moutsatsou, P.; Mastorakos, G.; Urano, F.; Papadimitriou, D.T. Lessons from Wolfram Syndrome: Initiation of DDAVP Therapy Causes Renal Salt Wasting Due to Elevated ANP/BNP Levels, Rescued by Fludrocortisone Treatment. Indian J. Pediatr. 2021, 88, 582–585. [Google Scholar] [CrossRef]
- Papadimitriou, D.T.; Spiteri, A.; Attilakos, A.; Papadimitriou, A. Cerebral Salt Wasting Complicated by Central Diabetes Insipidus and Growth Hormone Deficiency. Indian J. Pediatr. 2018, 85, 580–581. [Google Scholar] [CrossRef]


Publisher’s Note: MDPI stays neutral with regard to jurisdictional claims in published maps and institutional affiliations. |
© 2021 by the authors. Licensee MDPI, Basel, Switzerland. This article is an open access article distributed under the terms and conditions of the Creative Commons Attribution (CC BY) license (https://creativecommons.org/licenses/by/4.0/).
Share and Cite
Punapart, M.; Seppa, K.; Jagomäe, T.; Liiv, M.; Reimets, R.; Kirillov, S.; Kaasik, A.; Moons, L.; De Groef, L.; Terasmaa, A.; et al. The Expression of RAAS Key Receptors, Agtr2 and Bdkrb1, Is Downregulated at an Early Stage in a Rat Model of Wolfram Syndrome. Genes 2021, 12, 1717. https://doi.org/10.3390/genes12111717
Punapart M, Seppa K, Jagomäe T, Liiv M, Reimets R, Kirillov S, Kaasik A, Moons L, De Groef L, Terasmaa A, et al. The Expression of RAAS Key Receptors, Agtr2 and Bdkrb1, Is Downregulated at an Early Stage in a Rat Model of Wolfram Syndrome. Genes. 2021; 12(11):1717. https://doi.org/10.3390/genes12111717
Chicago/Turabian StylePunapart, Marite, Kadri Seppa, Toomas Jagomäe, Mailis Liiv, Riin Reimets, Silvia Kirillov, Allen Kaasik, Lieve Moons, Lies De Groef, Anton Terasmaa, and et al. 2021. "The Expression of RAAS Key Receptors, Agtr2 and Bdkrb1, Is Downregulated at an Early Stage in a Rat Model of Wolfram Syndrome" Genes 12, no. 11: 1717. https://doi.org/10.3390/genes12111717