
Quantitative Risk Assessment Methodology for Hydrogen Tank Rupture in a Tunnel Fire


1
Hydrogen Safety Engineering and Research Centre (HySAFER), University of Ulster, Shore Road, Newtownabbey BT37 0QB, UK
2
Efectis UK/Ireland, 307 Euston Road, London NW1 3AD, UK
*
Author to whom correspondence should be addressed.
Hydrogen 2022, 3(4), 512-530; https://doi.org/10.3390/hydrogen3040033
Submission received: 9 November 2022
/
Revised: 24 November 2022
/
Accepted: 28 November 2022
/
Published: 2 December 2022
Abstract
:This study presents a methodology of a quantitative risk assessment for the scenario of an onboard hydrogen storage tank rupture and tunnel fire incident. The application of the methodology is demonstrated on a road tunnel. The consequence analysis is carried out for the rupture of a 70 MPa, 62.4-litre hydrogen storage tank in a fire, that has a thermally activated pressure relief device (TPRD) failed or blocked during an incident. Scenarios with two states of charge (SoC) of the tank, i.e., SoC = 99% and SoC = 59%, are investigated. The risks in terms of fatalities per vehicle per year and the cost per incident are assessed. It is found that for the reduction in the risk with the hydrogen-powered vehicle in a road tunnel fire incident to the acceptable level of 10−5 fatality/vehicle/year, the fire-resistance rating (FRR) of the hydrogen storage tank should exceed 84 min. The FRR increase to this level reduces the societal risk to an acceptable level. The increase in the FRR to 91 min reduces the risk in terms of the cost of the incident to GBP 300, following the threshold cost of minor injury published by the UK Health and Safety Executive. The Frequency–Number (F–N) of the fatalities curve is developed to demonstrate the effect of mitigation measures on the risk reduction to socially acceptable levels. The performed sensitivity study confirms that with the broad range of input parameters, including the fire brigade response time, the risk of rupture of standard hydrogen tank-TPRD systems inside the road tunnel is unacceptable. One of the solutions enabling an inherently safer use of hydrogen-powered vehicles in tunnels is the implementation of breakthrough safety technology—the explosion free in a fire self-venting (TPRD-less) tanks.
1. Introduction
Many countries throughout the world are deploying hydrogen fuel cell vehicles (HFCV), including cars, buses, trucks, trains, watercrafts, and aircrafts. A fire incident such as a flammable liquid spill, hydrogen jet fire, or smouldering fire, could cause a hydrogen tank rupture. The onboard composite high-pressure tanks of the current design have a low fire resistance rating (FRR) of 4–8 min in gasoline/diesel/hydrogen fires with intensity HRR/A = 1–4 MW/m2 [1,2,3,4]. A vehicle incident in a confined space, such as a tunnel where a HFCV can be equally involved too, could escalate to a fire. In such cases there are high chances that an onboard hydrogen storage tank (in HFCV) could rupture catastrophically, bringing devastating consequences for life, property, and the natural and built environment. The severity of an incident and the value of risk will depend on the storage tank volume and pressure, tunnel, and traffic parameters.
While the models for the quantitative risk assessment (QRA) in tunnels [5] focus on the societal risk and fire safety measures in a tunnel, a QRA methodology considering all relevant safety issues, including a low-frequency high consequences scenario of onboard tank rupture in a tunnel fire, is still lacking. The study [6] has shown that the increase in the FRR of onboard storage is required to reduce the risk to the acceptable level of 10−5 fatality/vehicle/year [7,8,9]. The use of innovative engineering solutions such as explosion free in fire self-venting (TPRD-less) tanks is another approach.
The specific heat release rate of fire, HRR/A, directly affects the tank’s FRR [4]. The current standard tanks may withstand about 4–8 min in a fire, considering that the higher the HRR/A is, the shorter the FRR is. One of the reasons for the scatter of FRR values obtained in different laboratories found in the literature is the fire test protocol of GTR#13 [10] or R134 [11] with no specified control of HRR/A. Another factor directly influencing the FRR scattering is the variation in the tank wall thickness depending on the ratio of length over diameter, L/D. Some storage solutions that have to fit into certain space constraints, may include several elongated tanks in one compressed hydrogen storage system (CHSS), but of smaller volumes each. These would have a bigger L/D value, e.g., 9, and hence would have quite a low FRR due to the smaller diameter and thus the thinner composite overwrap. As a result of the authors’ numerical study on the performance of a 70 MPa “cigar”-shaped tank in a fire, it was assessed that its FRR is only 2 min. Another factor influencing the FRR is the tank’s state of charge (SoC). Driving a vehicle in-between the fuelling would always be characterised by the SoC below 100%. It was observed for the selection of 17 hydrogen-powered cars that the SoCs of onboard tanks before refuelling varied from 17% to 59% on average [12]. Hence, looking at the consequence analysis of a tank rupture, the SoC = 100% is deemed to represent a worst-case scenario, as such a tank would be storing the higher amount of energy of compressed gas than that at any lower SoC. The study [13] showed that with the decrease in SoC to a certain level, for example below 54%, the standard tank does not rupture in a fire, but leaks after the high-density polyethylene (HDPE) liner had been melted. This inherently safer feature of the HDPE liner is not attributable to polyamide (PA) liner due to the higher melting temperature of the latter.
The detailed comprehensive analysis of different hazards, including jet fires from thermally activated pressure relief devices (TPRD), possible pressure and thermal effects from deflagrations and detonations, and fragments travelling for tens of meters at a high speed after a tank rupture, are out of the scope of this study. This QRA study is performed to address what is “missing” in previous studies’ risks associated with the blast waves after a tank rupture in a tunnel. The developed QRA methodology in this work is demonstrated on a typical road tunnel, i.e., the Dublin tunnel [14], to calculate the blast wave decay and define hazard distances to human fatality, injury, and no-harm. The risk in terms of fatalities per vehicle per year and the cost per incident (accounting for the loss of human lives only) are assessed for tank rupture at a reduced SoC = 59% compared to the fully charged tank.
2. QRA Methodology for Hydrogen Tank Rupture in a Tunnel
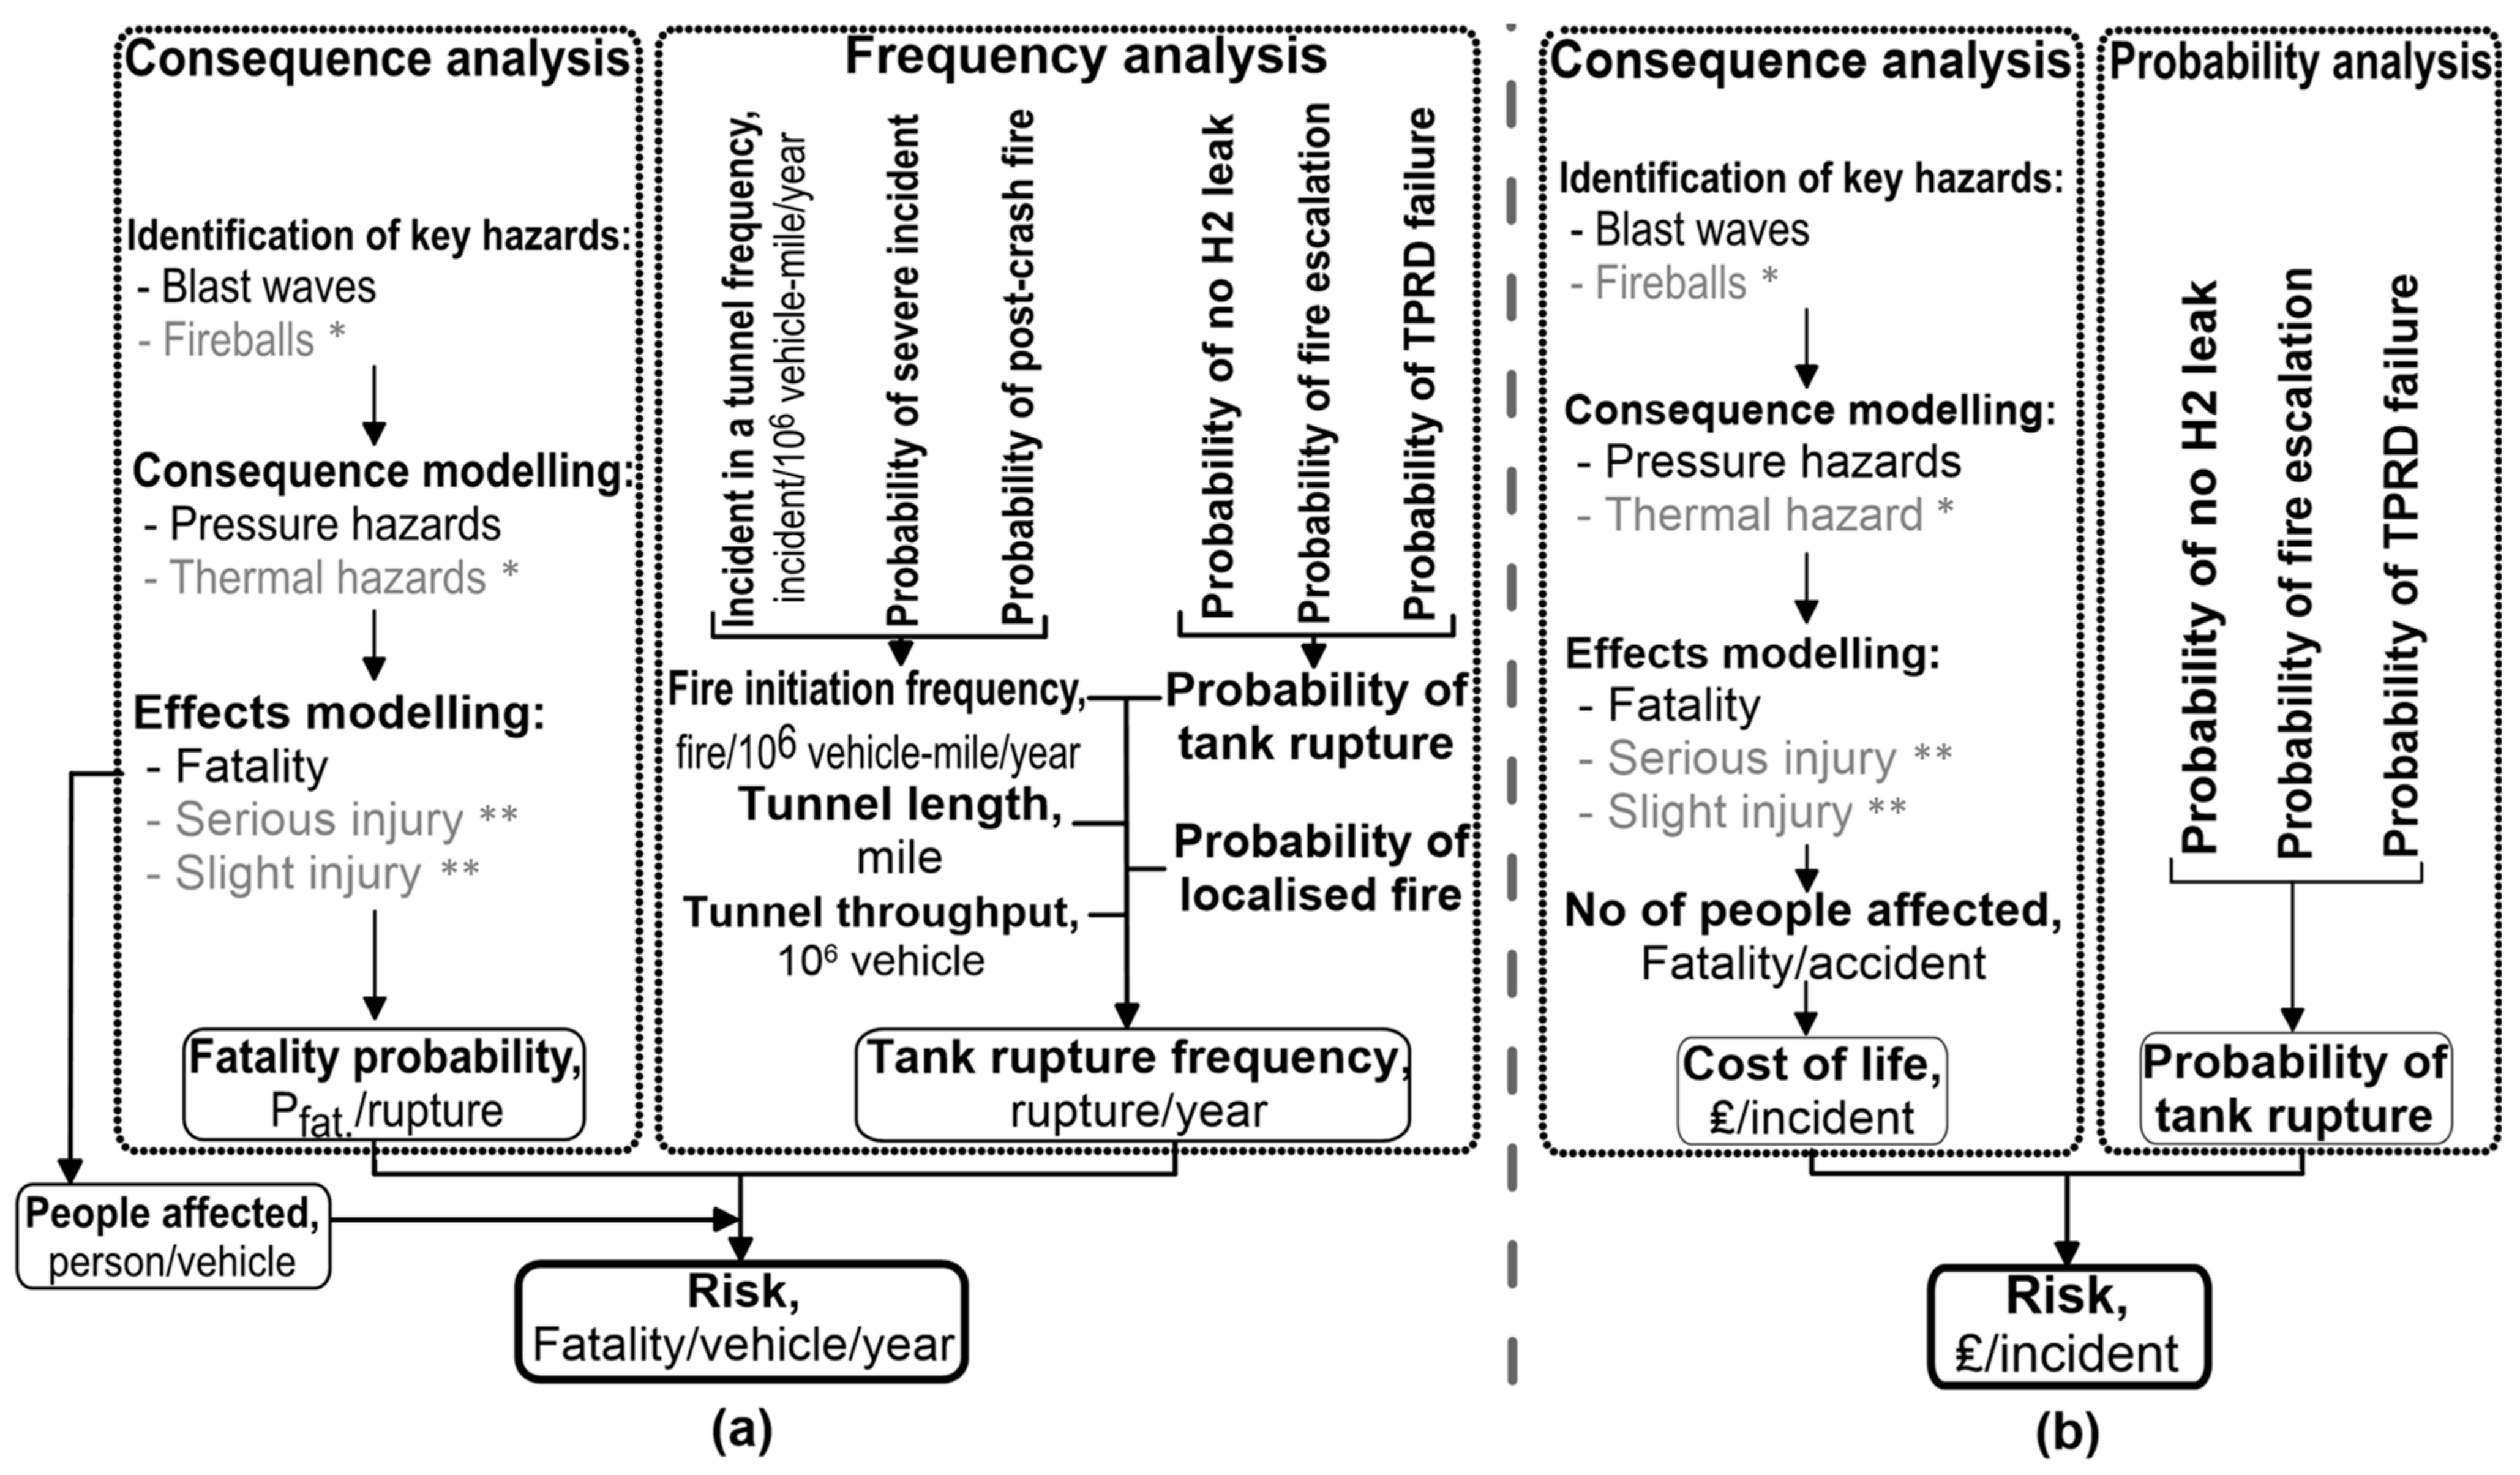
The QRA methodology diagram is provided in Figure 1. The annual risk in terms of fatalities per vehicle (Figure 1a) is evaluated using the consequence analysis of a catastrophic tank rupture and the annual frequency of tank ruptures inside road tunnels. Following an analogous consequence analysis procedure, the risk in terms of cost per incident (Figure 1b) is estimated via the probability of a tank rupture with an additional extension to account for the financial losses of human lives in the incident scenario.
The frequency analysis in Figure 1a includes the estimation of a tank rupture frequency (rupture/year) by multiplying the following parameters: the fire initiation frequency, the probability of tank rupture, tunnel parameters (i.e., tunnel length and tunnel throughput), and the probability of a localised fire mode (among all the fires occurred). Here, the fire initiation frequency is calculated by multiplying: the incident in a tunnel frequency, the severe incident probability and post-crash fire probability. The probability of a tank rupture includes the probability of no hydrogen leak (as no leak is considered before the tank rupture), following [15], the probability of the fire escalation and the TPRD failure probability.
There are no, and probably cannot be, any statistics on the probability of a localised fire type (in the sense of affecting or not the TPRD) among all fires. Indeed, each fire could be both a localised fire, e.g., when an edge of a liquid spill fire is affecting a CHSS, or a fire engulfing the CHSS. Moreover, the fire could start as localised due to a small initial portion of the combustion area and develop into engulfing fire (as per the GTR#13 fire test protocol). Examples of other sorts of localised fires include a smouldering fire [16,17,18], fire from a vehicle saloon, hydrogen fire from leaking after incident piping system, etc. Thus, in our study, we assume that half of all fires would affect the CHSS as an engulfing fire and half as a localised fire, i.e., the probability of a localised fire, , is assumed in this study as 0.5.
The first step in the consequence analysis in Figure 1a,b is the identification of the key hazards relevant to the incident scenario with a CHSS in a fire. The detailed comparative analysis of hazards different from tank rupture in fire, including jet fires, deflagrations, and projectiles emanating from a tank explosion, is out of the scope of this study. The hazards from fireballs after tank rupture are investigated in the HyTunnel-CS project [19,20] but no engineering correlations are available to be used for consequences analysis in QRA. The CFD assessment of fireball hazards is possible but is out of the scope of this paper that aims rather at the QRA methodology rather than the detailed consequences analysis of fireballs. The fireball is not taken into account in this study, but it is worth mentioning that it could propagate inside a tunnel with a velocity of up to 25 m/s behind the shock wave, as per simulations performed at Ulster University [19,20]. It has been concluded that the main pressure hazard is a blast wave from a tank rupture in a tunnel fire. This is the focus of our study.
The following step in the consequence analysis is the assessment of hazard distances where overpressures cause fatalities. To estimate the hazard distances due to a blast wave in a tunnel, the engineering correlation developed at Ulster University [21] is employed. The consequence analysis aims at the estimation of the fatality probability (/rupture) and the number of individuals affected by the blast wave, i.e., passengers of the vehicles (person/vehicle) within the fatality distance depending on the parameters of the CHSS and the tunnel. The risk in Figure 1a is shown for the units fatality/vehicle/year.
The risk in terms of cost per incident (Figure 1b) is estimated as a product of the financial loss due to the fatality (based on the people affected) and the tank rupture probability. The latter is calculated by multiplying the no hydrogen leak probability, the fire escalation probability (EP), and the TPRD failure probability. No losses from injury and property losses are accounted for in this study but can be easily added to the methodology if needed.
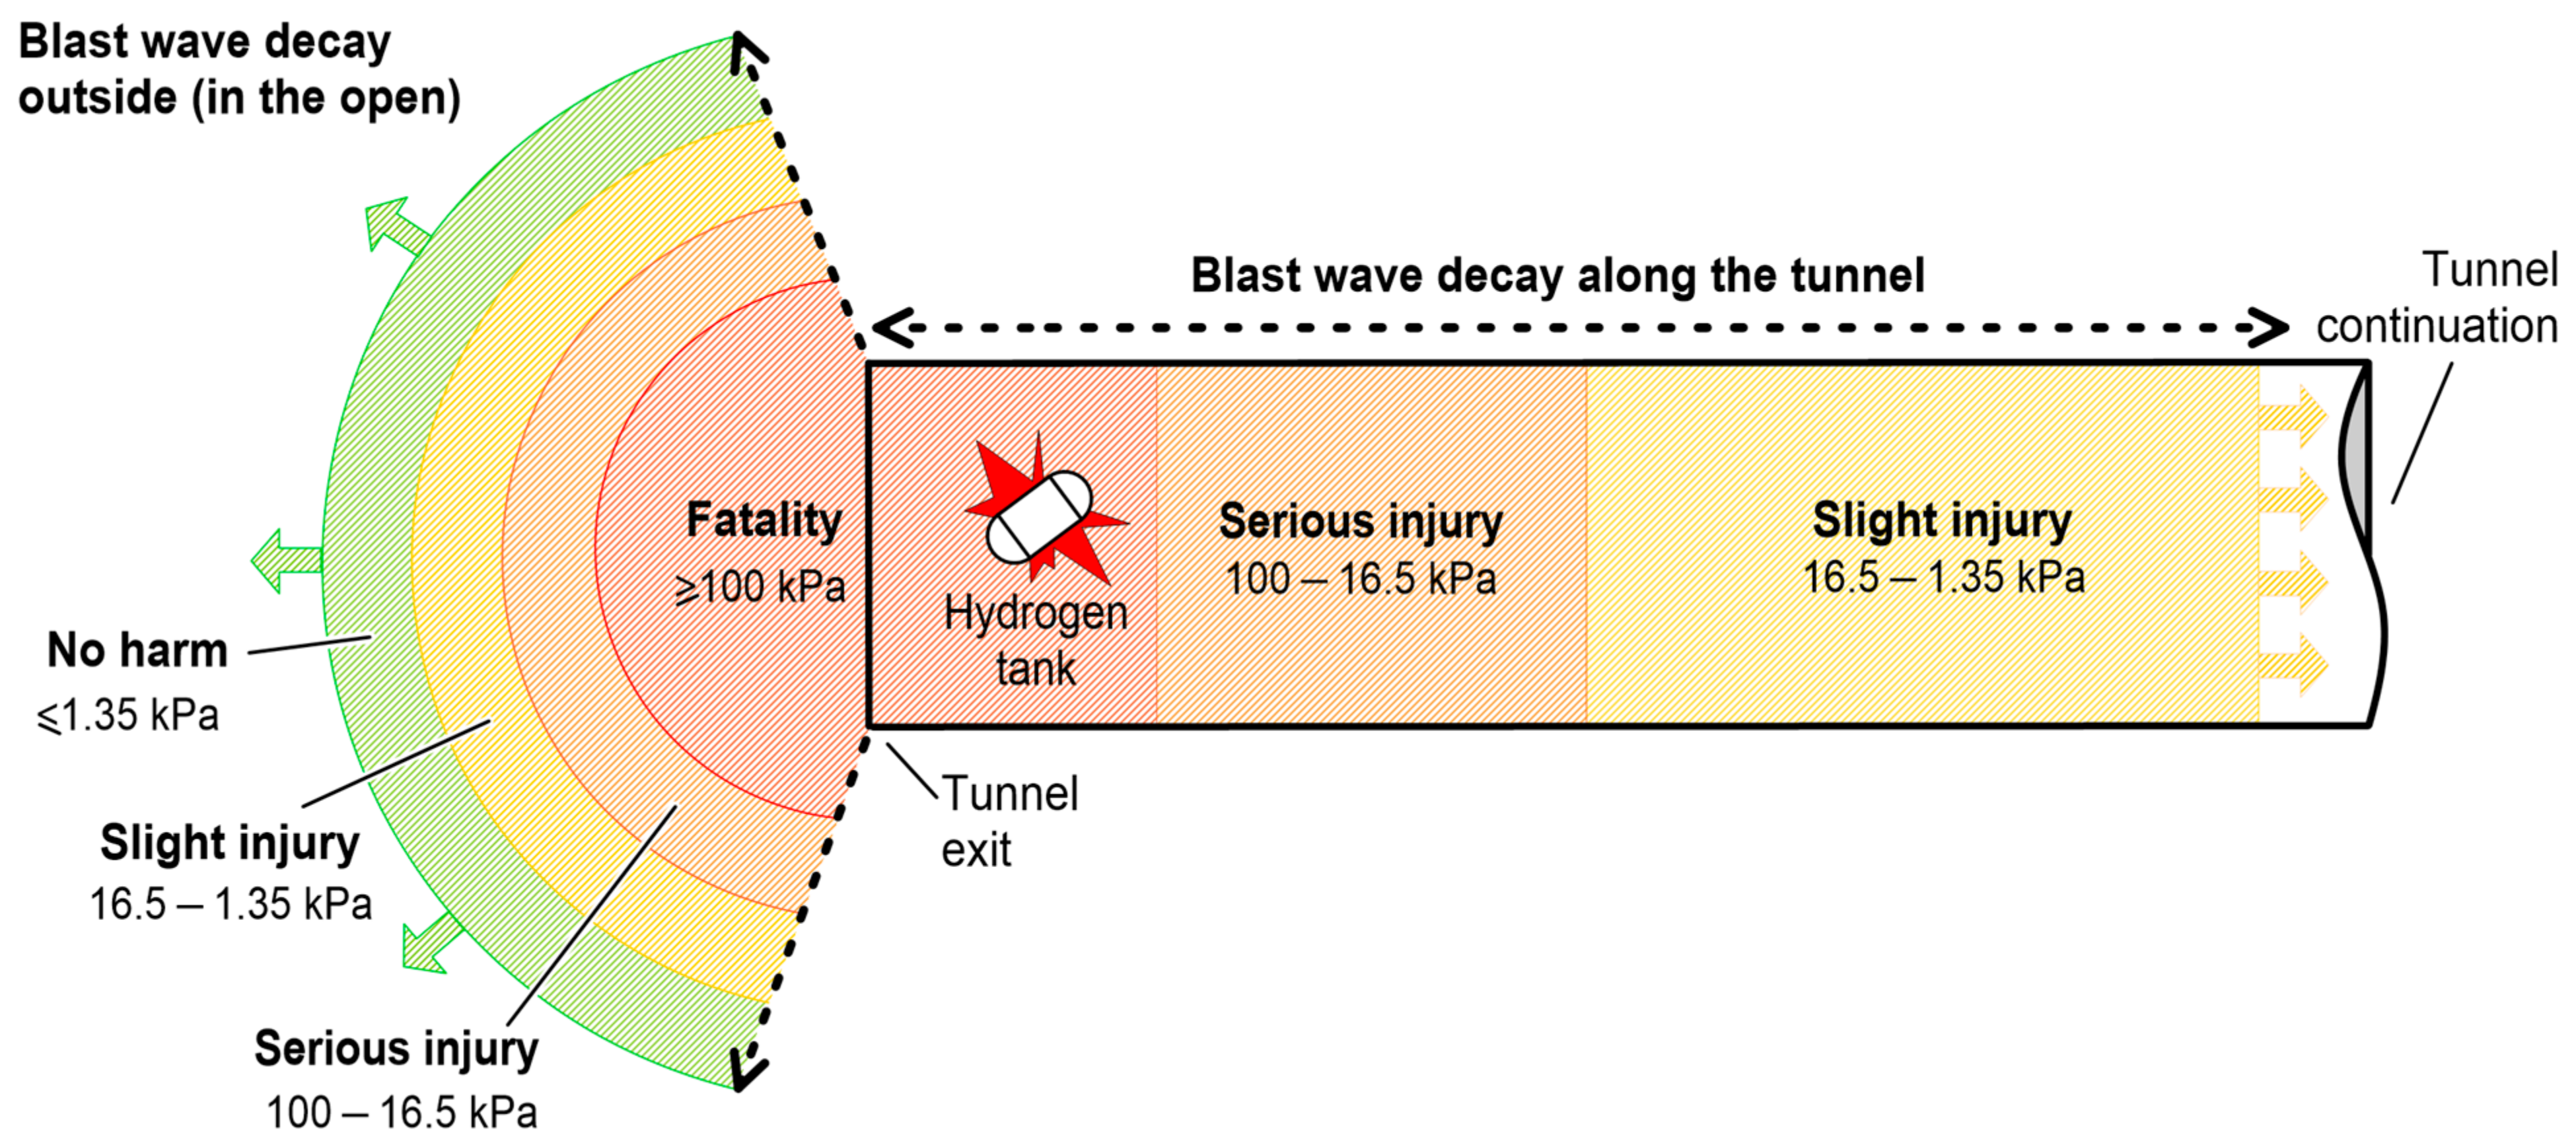
The main hazard after a tank rupture in a tunnel fire is the blast wave, which has little decay with distance along a tunnel due to the one-dimensional character of the problem compared to the significantly faster blast wave decay in three-dimensional open atmosphere conditions.
The impact on humans from blast wave overpressures in the tunnel that is adopted in our study for consequence analysis (see Figure 2) are based on the pre-defined harm criteria [22]:
The four zones in a tunnel are a result of dividing the spectrum of overpressures in the tunnel by the three overpressure thresholds, i.e., fatality (100 kPa), injury (16.5 kPa), and no-harm (1.35 kPa).
3. Methodology
The dimensions of the hypothetical tunnel suggested for this study are similar to those of the Dublin Tunnel 2.89 miles in length (4650 m), as extracted from the information on different tunnels in the UK and Ireland [14]. The tunnel has 2 tubes with 2 lanes each. Each tube has traffic travelling in the same direction on both lanes, but the direction in one tube is the opposite to the direction in another tube.
The most likely place for an accident to occur is 50 m from the tunnel exit/entrance. This can be supported by the studies on the crash rates inside the tunnels found elsewhere [23,24]. The scenario of the incident in the end of the tunnel was chosen for the paper for the reason of conservatism. It is suggested that in such cases all vehicles passing the tunnel and facing the exit will be forced to stop behind the incident (in the end of the tunnel). Hence, practically the entire tunnel length will be populated with vehicles and all of them would be subject to the hazards associated with the tank rupture. In the example of the QRA methodology application, the consequence analysis will be performed for 1 tube. The considered scenario is based on the following assumptions:
- An HFCV is trapped in a severe incident inside the tunnel, that has escalated into a fire. The vehicle has the CHSS consisting of two hydrogen tanks. The bigger tank of 62.4 L volume and NWP = 70 MPa (containing = 2.5 kg of hydrogen) [25] was subject to a fire with a subsequent rupture. The larger tank is chosen for the reason of conservatism. The rupture of one tank is assumed not to provoke the rupture of another tank, i.e., an isolated case of rupture of one tank is considered.
- The blast wave decay in the tunnel is estimated based on the formulation of a stand-alone tank rupture, i.e., no mechanical energy of compressed gas was spent on vehicle destruction and body frame translation [21]. This is justified by the observation that the blast wave strengths after ruptures of stand-alone and under-vehicle tanks are similar in the far-fields [26]. Most of the tunnel length represents a “far-field” distance from the tank rupture location.
- The car incident location is 50 m away from the tunnel tube exit and it blocks both lanes in the tube (as the direction of traffic on both lanes in the tunnel tube is the same). This causes all the vehicles, that have entered the tunnel, to stop inside and be unable to leave the tunnel. This means the affected tunnel length of (4650 − 50) m = 4600 m. There may be several scenarios with many combinations of the incident location and the number of vehicles stopped in the tunnel. An incident could happen in the middle of the tunnel (which is less likely, as per the literature [23,24]), blocking both lanes. Hence, all the vehicles after the incident location will leave the tunnel and only those vehicles inside the tunnel before an incident location are forced to stop and will be affected by the tank rupture consequences. In such cases, twice less of the vehicles/passengers will be in danger, compared to the scenario previously described (and suggested for this paper). Additionally, in order to demonstrate the value of the proposed methodology and risk mitigation strategy, the authors conducted F–N curve analysis using several rupture scenarios, including a rupture at the midway of the Dublin tunnel. It is worth mentioning that the consequences analysis for outside the tunnel is essentially the assessment of the people affected by the tank rupture in the open (similar to the work by authors [6]) and is out of scope of this study.
- Considering that the SoC of CHSS will normally be from 17% to 59% on average before refuelling [12], the value of SoC = 59% (equivalent to 35.5 MPa at 20 °C) is selected for the consequence analysis. The tank filled up to NWP = 70 MPa at 20 °C would have SoC = 99% (the SoC of 100% for such pressure is achieved at hydrogen temperature 15 °C). The SoC = 59% is considered as an attempt to approach a real incident scenario as close as possible.
Table 1 shows the mechanical, , and chemical, , energy fractions (1.8 and 0.052, respectively) contributing to the blast wave strength and calculated using [26].
Table 2 presents the parameters of the tunnel, number of cars, and the average number of people per car for this study.
3.1. Consequence Analysis
The tank rupture happens as a result of the exposure of the CHSS to a fire provided that both the safety barriers, i.e., TPRD activation by high temperatures, and putting out the fire fail. The sequence of events for an incident is as follows:
- (a)
- Fire due to the car incident;
- (b)
- TPRD failure to operate;
- (c)
- Failure of emergency operation;
- (d)
- Hydrogen tank rupture;
- (e)
- Blast wave.
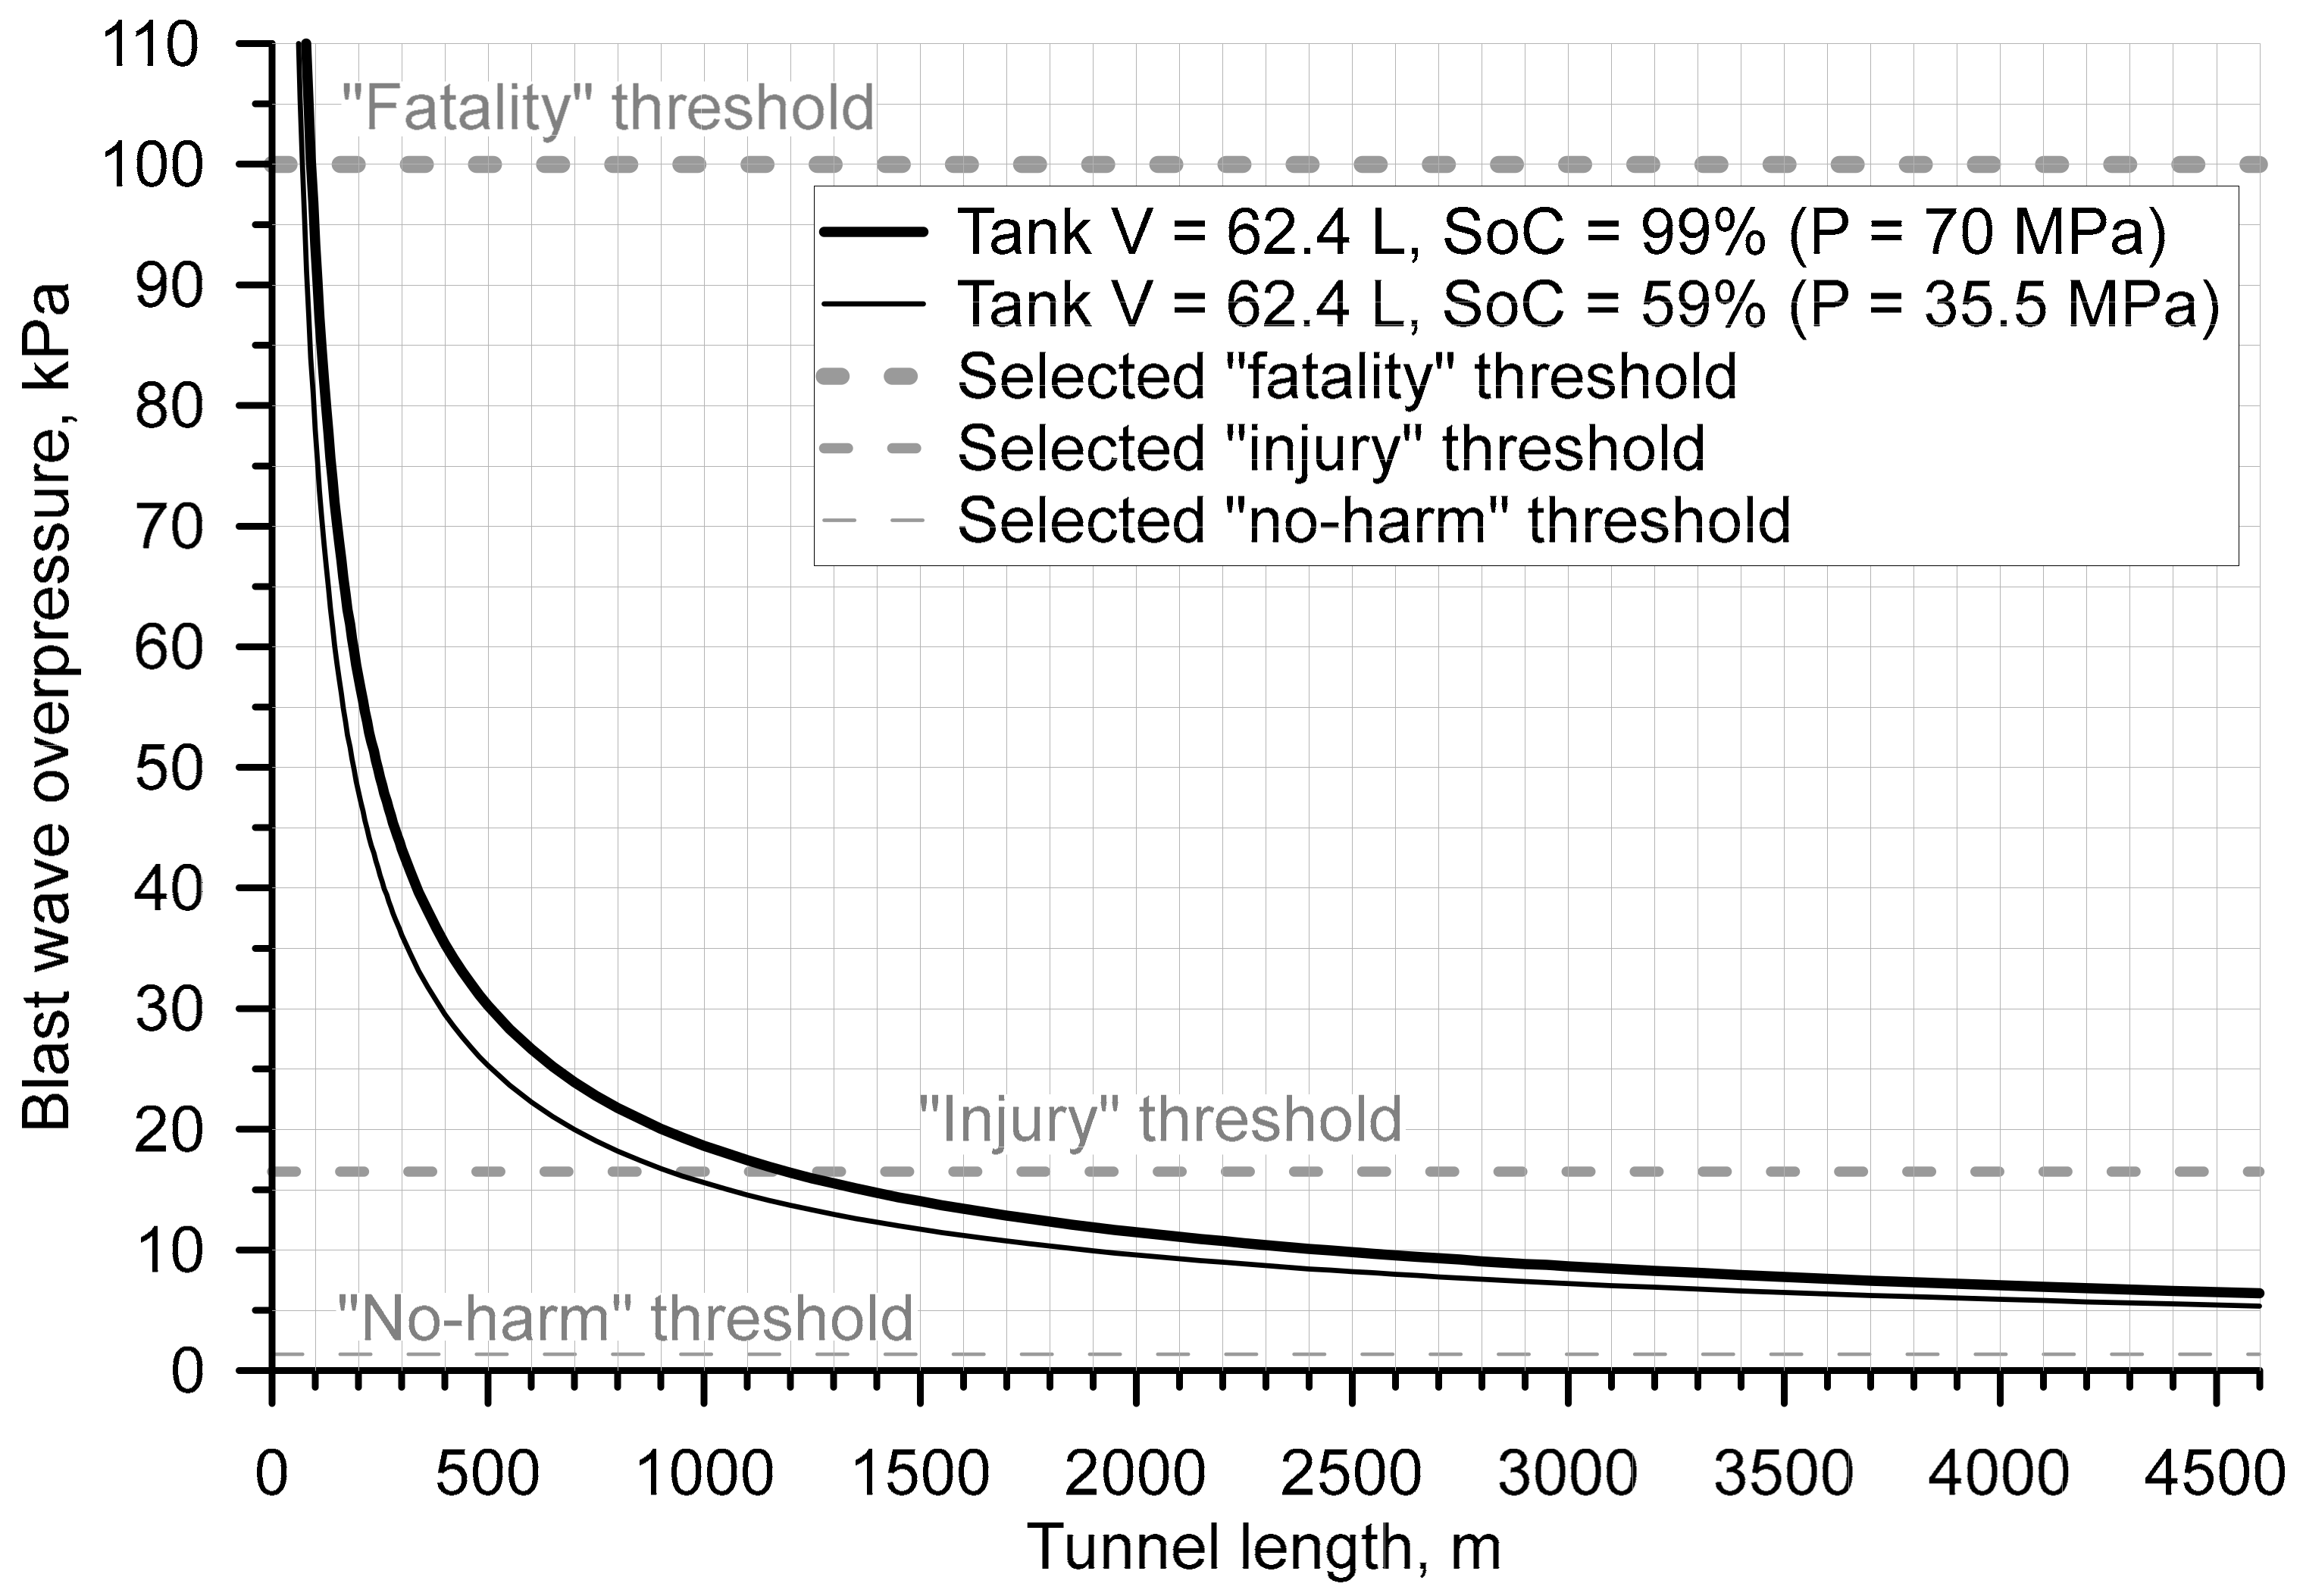
Experimental [29,30,31] and numerical [4,13,32,33] studies on the performance of hydrogen storage tanks in a fire, the consequences of tank rupture, and the mechanism of blast wave formation and decay have been carried out for the open atmosphere. Only partial data are available on high-explosive charges with the mass equivalent to that of trinitrotoluene (TNT). The TNT blast wave, on the other hand, differs from the blast wave generated by a hydrogen tank rupture in a fire, by the process of the release of chemical energy. The dimensionless correlation [21], which has been developed using simulations by a validated CFD model and recently validated against tank rupture in real tunnel experiments of CEA [34], is applied in this study to calculate the blast wave decay in the tunnel after the rupture of a 62.4 L, 70 MPa tank at SoC = 99% (70 MPa at 20 °C) and SoC = 59% (35.5 MPa at 20 °C). The dimensionless correlation [21] allows for consequence assessment for the rupture of any hydrogen tank in a fire inside a tunnel of any cross-section area, aspect ratio, and length. The calculated overpressure decay along the Dublin Tunnel is shown in Figure 3 together with three thresholds (fatality, injury, and no-harm).
The four hazard zones, i.e., fatality, serious injury, slight injury, and no harm due to a blast wave together are shown in Table 3.
For the tank rupture at SoC = 59%, the first 70 m of the tunnel extent (from the rupture location) is the fatality zone. The number of people affected in this zone is estimated as follows. Given the vehicle length of 4.5 m and the assumed gaps between vehicles of 5 m, the number of vehicles in 2 lanes (per the tube) within the fatality zone is [70 m/(4.5 m + 5 m)] × 2 = 15 (we assume that vehicles downstream of the incident location left the tunnel). Given the average number of passengers per vehicle is 1.55, the average number of people affected in the fatality zone per tank rupture is 15 × 1.55 = 23.25.
The cost of fatality, serious injury, and slight injury are GBP 1,336,800, GBP 207,200, and GBP 300, respectively, as per the UK’s Health and Safety Executive (HSE) guidance [35]. In this study, only the cost of fatality is accounted for in the risk calculations. By multiplying the single fatality cost by the number of fatalities, the cost of losses of people due to fatalities in an incident involving an HFCV inside the tunnel is calculated as 23.25 × GBP 1,336,800 = 31,080,600 GBP/incident. This value will change if a traffic incident happens at another location not 50 m from the tunnel portal as in the considered scenario. However, independent of location, it will be still 7 digits number.
3.2. Frequency Analysis
3.2.1. Frequency of the Initiating Fire Event
There is a small number of hydrogen-powered vehicles at the moment, compared to conventional fuel vehicles. There are no statistics on fire incidents with HFCVs. It is suggested in this study that the parameters relevant to assessing the frequency of initiating fire events associated with HFCVs are the same as for fossil fuel cars. The frequency of fires due to a vehicle incident in the tunnel was estimated using data [15,23,36]:
3.2.2. TPRD Failure Probability
There is no published information on the TPRD rate of failure for hydrogen-powered vehicles. The conservative characteristic number for the probability of unexpected mechanical failure of pressure relief devices (PRD) was suggested by the NPRD database [37] as 6.04 × 10⁻³. This value is used in the calculation of TPRD failure probability similar to Dadashzadeh et al. [6]. The FireComp project [38] suggested the TPRD failure probability in fire conditions as 0 for the engulfed fire and 0.5 for the localised fire. Hence, taking this into account, the failure probability of TPRD in our study can be calculated as (1 − 0) × (6.04 × 10−3) + 0 = 6.04 × 10⁻³ for the engulfing fire and (1 − 0.5) × (6.04 × 10−3) + 0.5 = 5.03 × 10⁻¹ for the localised fire. Although Dadashzadeh et al. [6] demonstrated that the highest risk for a hydrogen-powered vehicle on London roads is due to a localised fire; in this study, the risk for both localised and engulfing fires will be quantitatively assessed.
3.2.3. Escalation Probability
The likelihood of emergency actions failing to put out a fire, resulting in tank catastrophic rupture, also known as the escalation probability, EP, could be estimated by implementing a probit function, [39,40]:
To bypass the challenges of integrating equation (2) and calculating the standard deviation of the emergency reaction time value () to calculate =/ and the mean value of emergency response time ), the EP was expressed in the following form using the error function () following [41]:
Here, represents the probit function, earlier applied as the general equation in the probit analysis [39,40,42], which assumes log-normal distribution:
where the FRR is the time from fire initiation until the tank rupture in case of failed/blocked TPRD. In the study [40] the regression method was applied to determine and considering the data on emergency operations deployment. According to the authors, only in 10% of cases, the emergency operation procedures started in under 5 min and 90% of cases only in under 20 min. Hence, the failure probability for 5 min response time of emergency services is 90% and for 20 min response time is 10%. Using Equation (3) the probit function, , was obtained as 6.28 and 3.72 for 5- and 20-min response times, respectively. Utilising these values of , the and coefficients were obtained as = 9.25 and = −1.85 [6,40].
The probit function in a scenario involving a fire brigade reaching the incident with an FCEV, with a 90% failure probability for a 5 min response time and a 10% failure probability for a 20 min response time, may be represented as [6]:
3.2.4. Probability of a Tank Rupture
The tank rupture probability is calculated as:
Using the value of 9 × 10⁻¹ [15] for the “No H2 leak probability”, the tank rupture probability is obtained as = 5.03 × 10−1 × 6.57 × 10−1 × 9 × 10−1 = 2.97 × 10⁻¹.
3.2.5. Frequency of a Tank Rupture
Having already calculated the values of the fire initiation frequency, Equation (1), the probability of tank rupture, Equation (6), and the tank rupture frequency can be obtained as follows:
Hence, the tank rupture frequency for the considered incident scenario is: = 5.84 × 10⁻³ fire/106 vehicle-mile/year × 0.5 × 2.97 × 10−1 × 2.89 mile × 2.75 106 vehicle = 6.89 × 10⁻³ rupture/year.
3.2.6. Risk
The risk of fatality is calculated as:
Here, in Equation (8) we assume that the fatality probability, , for people affected by the blast wave in the fatality zone in the tunnel would be 1, as all the people in this zone would be subject to overpressure equal to or above the fatal overpressure threshold. The tank rupture frequency, , is obtained from Equation (7). The fatality probability strongly depends on a tank’s . The of an unprotected hydrogen tank in a realistic fire, e.g., gasoline/diesel spill fire source of = 1 MW/m2, is as low as 4–6 min. It can reach tens of minutes for the quite low = 0.2 MW/m2 [4].
4. QRA Results and Discussion
4.1. Effect of Tank FRR on the Risk in Terms of Annual Fatality Rate per Hydrogen-Powered Vehicle
The example of calculation of the risk in terms of the annual fatality rate is shown for a tank rupture in a localised fire, whereby the tank FRR is 8 min:
= = 1/rupture × 6.89 × 10⁻³ rupture/year × 23.25 fatality/vehicle = 1.6 × 10⁻¹ fatality/vehicle/year.
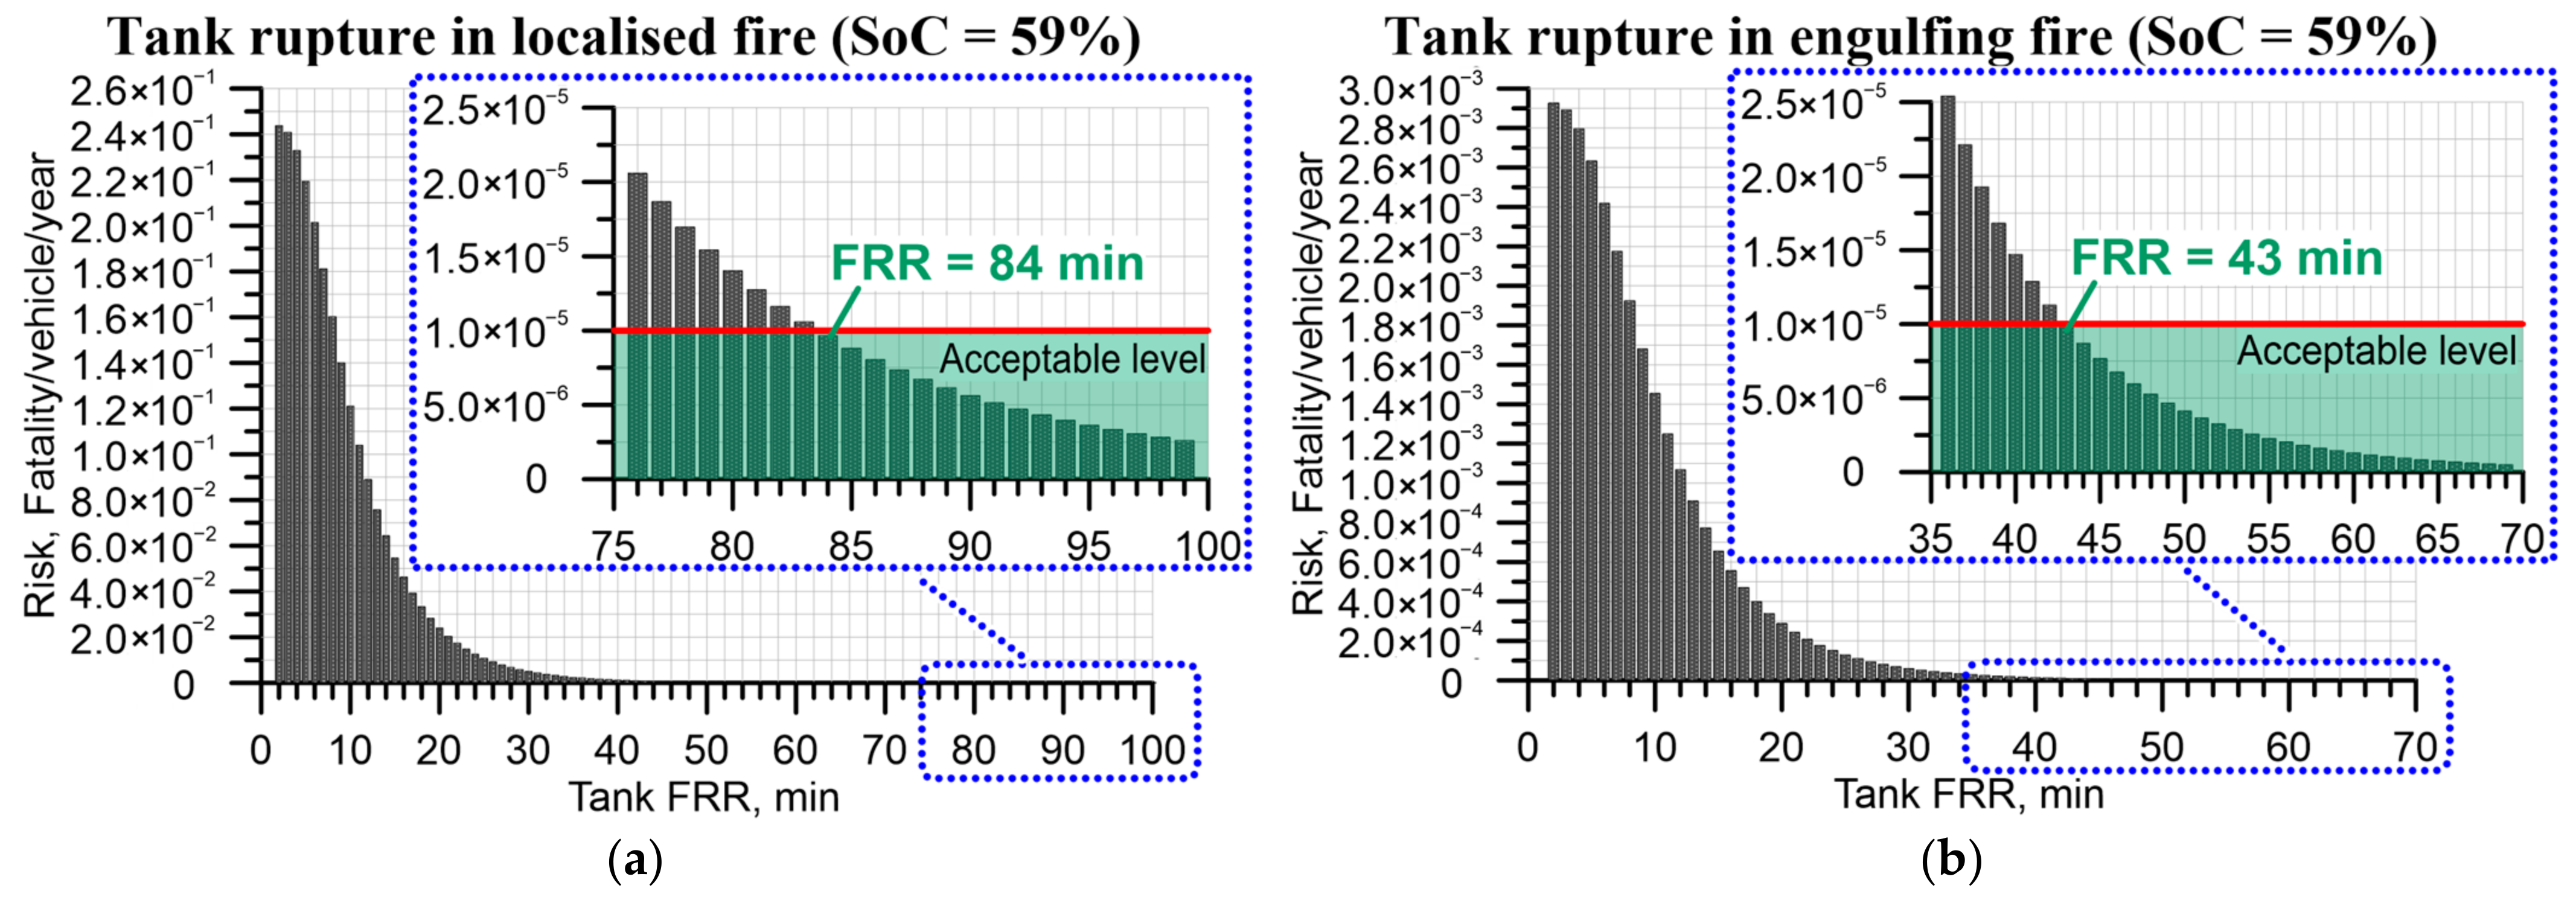
Figure 4a presents the calculated risk of fatality as a function of of the onboard hydrogen storage tank in a localised fire. The risk acceptance criteria for the third party (public) value were accepted as in previous studies 10−5 fatality/vehicle/year [7,8,9]. Figure 4b shows a similar risk as a function of the of the tank in an engulfing fire.
It can be seen in Figure 4a that for a hydrogen tank in a localised fire with = 8 min [43] the risk is 1.6 × 10⁻¹ fatality/vehicle/year, which is more than four orders of magnitude bigger than the acceptable level (shown with a red line and a green transparent filling under it in the secondary inserted graph with blue dotted frame). The risk for engulfing fire (Figure 4b) is lower for the same FRR = 8 min, i.e., 1.92 × 10⁻³ fatality/vehicle/year, yet unacceptable.
The risk in the case of a localised fire is significantly larger for tanks with FRR = 4 min associated with the tanks subject to hydrogen jet fires [44] or for FRR = 2 min for elongated conformable tanks with thinner walls (estimated by numerical experiments at Ulster University), being 2.44 × 10⁻¹ and 2.33 × 10⁻¹ fatality/vehicle/year, respectively. The increase in the tank for a localised fire reduces the fatality rate progressively, until the risk becomes below the acceptable level at = 84 min. Such FRRs for tank-TPRD systems without other protection measures seem hardly possible. The argument that fire will be extinguished before this time can exist but it can be easily negated by a tunnel fire of a much longer duration of up to a few days.
4.2. Effect of Tank FRR on the Risk in Terms of Costs
The example of the calculation of the risk in terms of cost per incident is shown for a tank rupture in a localised fire, whereby the tank FRR is selected as 8 min:
Figure 5 shows the risk in terms of the cost per incident. The monetary costs of an incident for the tank with FRR = 8 min totals 9.42M GBP/incident for localised (Figure 5a) and 111k GBP/incident for engulfing fire (Figure 5b), respectively.
The cost of an incident becomes very high when it comes to the aforementioned conformable tanks with FRR = 2 min, i.e., 14.1M GBP/incident for localised (Figure 5a) and 169k GBP/incident for engulfing fire (Figure 5b), respectively.
The monetary cost of an incident (based only on harm to people in this study not the effect of property loss), however, can be significantly reduced down to below GBP 300 (threshold cost of minor injury, according to HSE), but only if the can be as long as at least 91 min and 49 min for localised fire (Figure 5a) and engulfing fire (Figure 5b), respectively.
As there is an insignificant difference (9%) between FRR = 84 min and FRR = 91 min for localised fires (see Figure 4), the FRR = 84 remains a recommended threshold for this particular case of a storage tank and the tunnel, beyond which the risk is acceptable from the societal perspective, i.e., below an acceptable risk level of 10−5 fatality/vehicle/year.
One of the potential solutions to achieve such a prolonged FRR could be the use of intumescent paint. However, the available experimental studies, e.g., [43], have shown that the increase in FRR beyond 1.5 h would not be possible if the intumescent paint layer thickness is below about 1 cm, which is hardly acceptable due to the increased volume of the onboard storage tanks onboard of vehicles. Fortunately, the microleak-no-burst (µLNB) breakthrough safety technology for explosion free in fire self-venting (TPRD-less) Type IV tanks [45], conceived at Ulster University, has been successfully tested in several national and international projects. The TPRD-less technology allows manufacturing tanks with the same wall thickness as an original tank (using an HDPE liner; the use of a PA liner would require a somewhat increase in tank wall thickness, probably similar to the thickness of intumescent paint) with unprecedented safety features, i.e., the exclusion of the tank rupture in a fire and avoidance of the use of TPRDs as a potential source of failure.
4.3. Societal Risk: F–N Curve Results
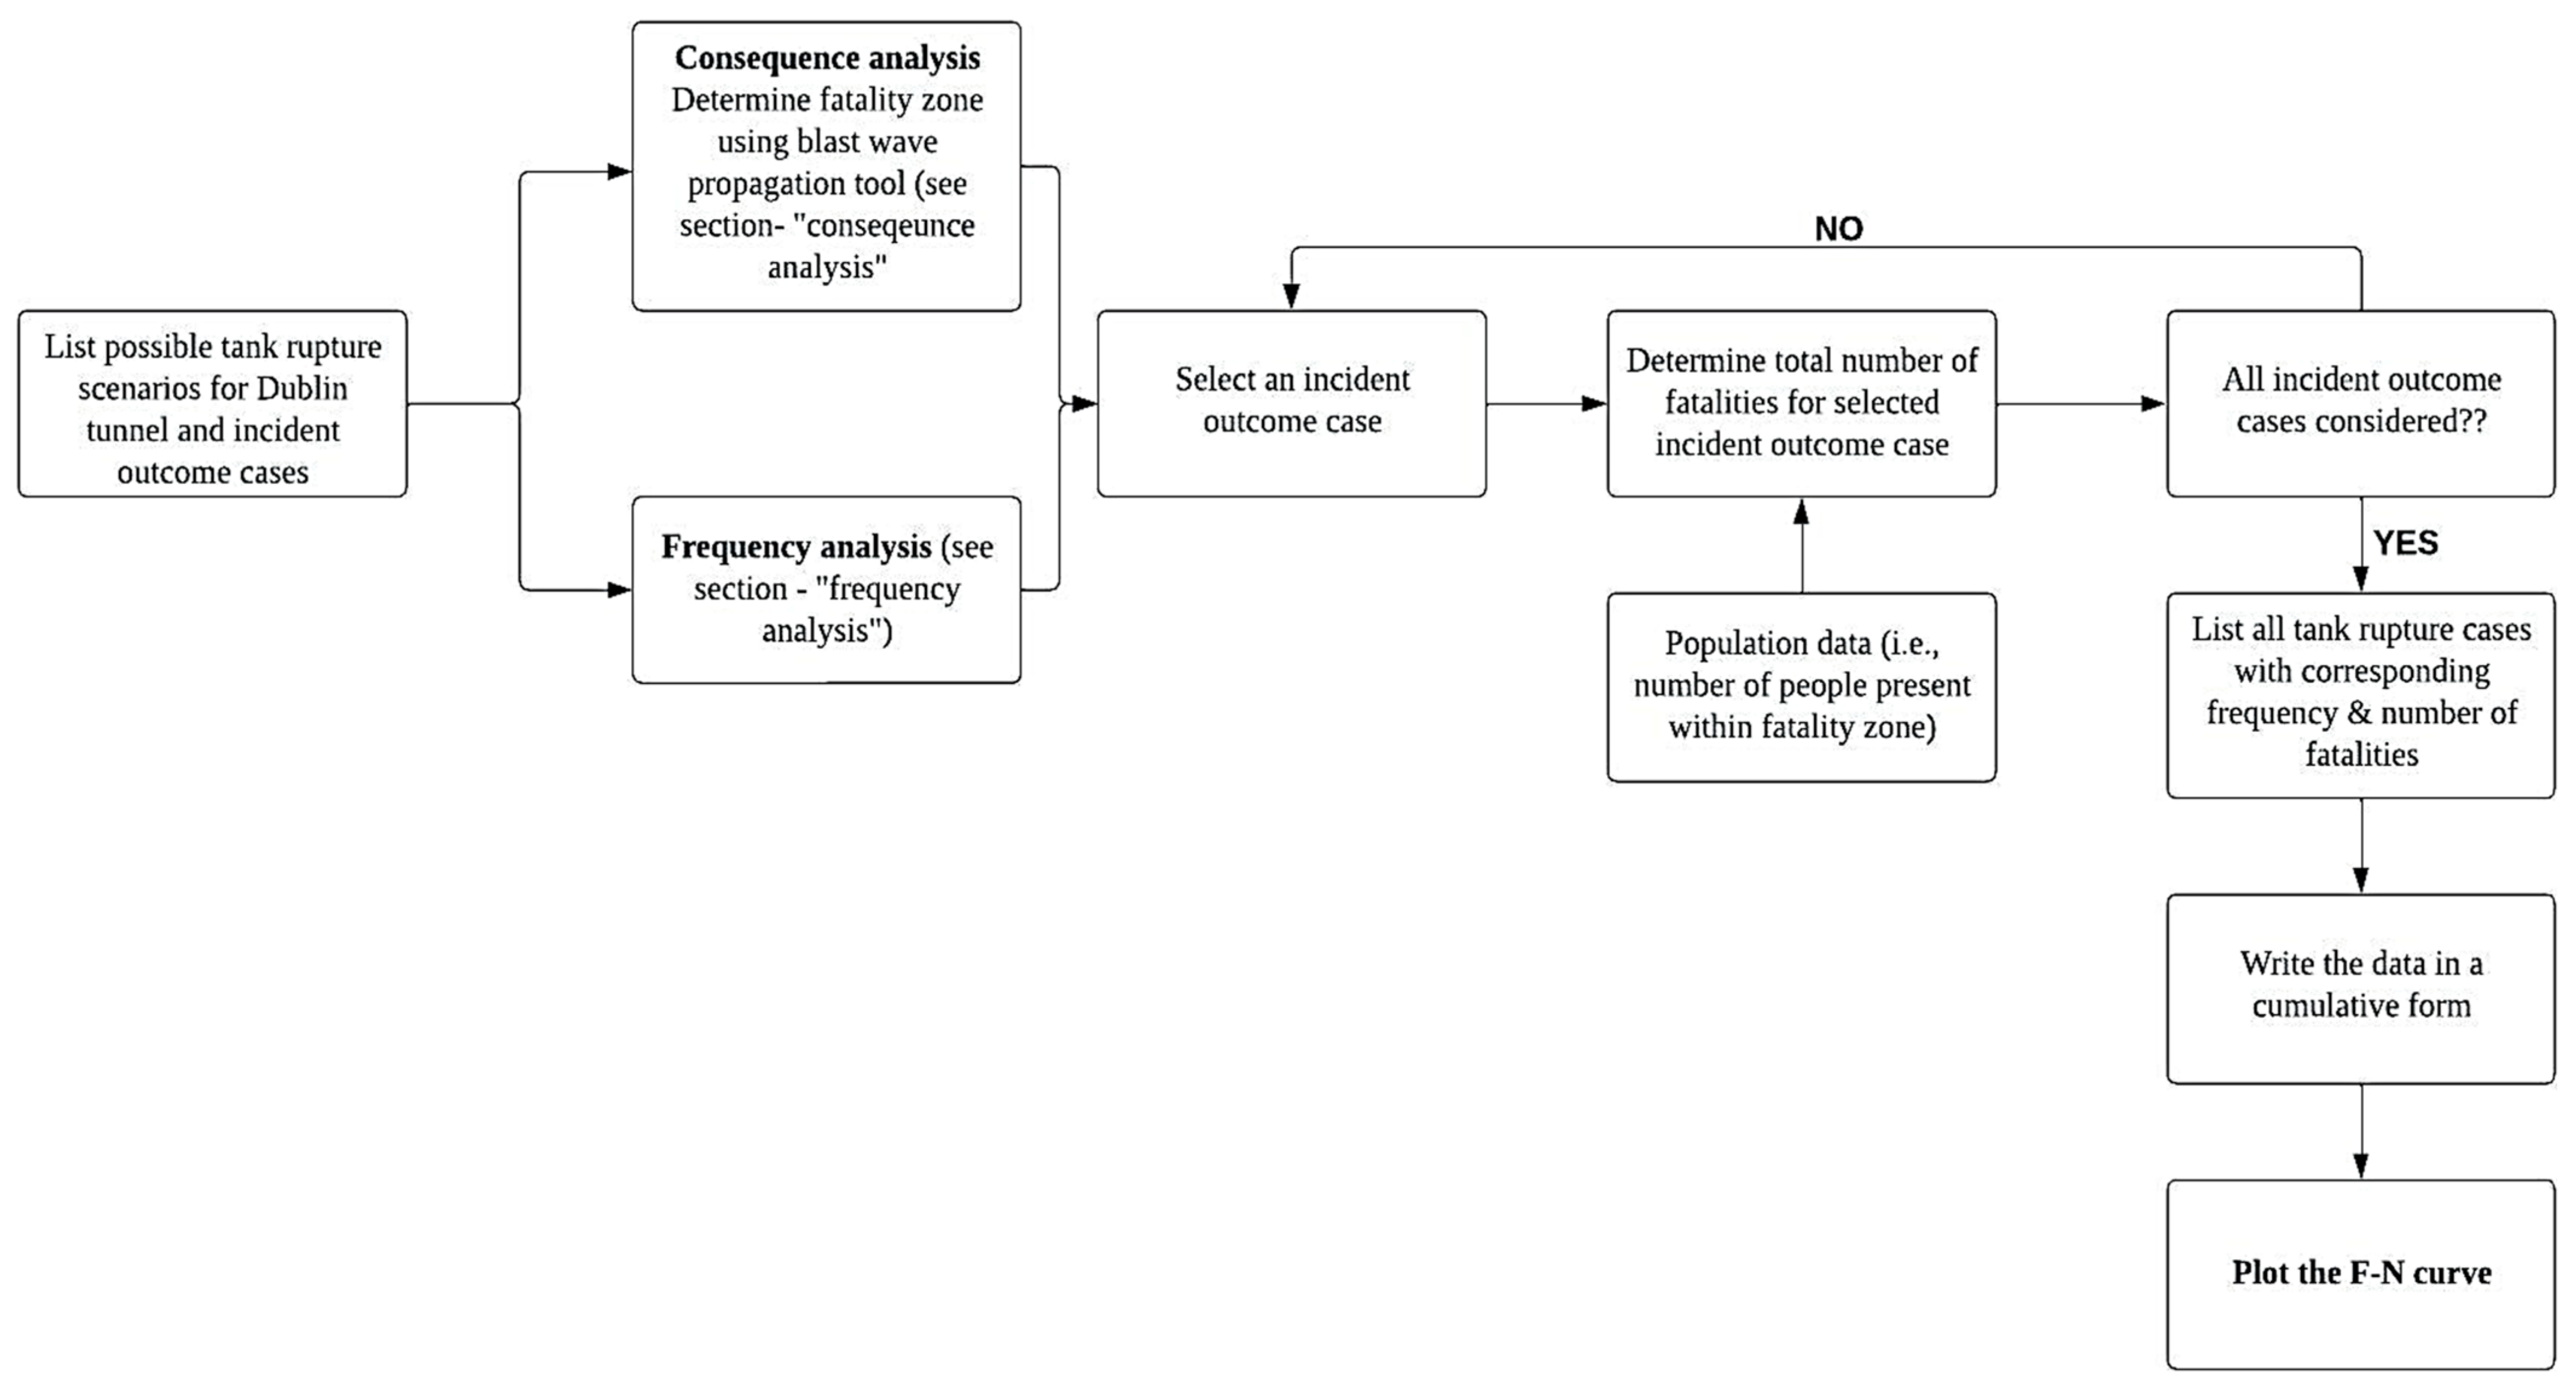
It is important to demonstrate the suggested mitigation measure’s validity for risk reduction to socially acceptable levels while taking into account all the potential tank rupture scenarios within the Dublin Tunnel, in addition to the incident scenario that was already investigated. For this purpose, the Frequency–Number of fatalities (F–N) curves show the overall risk level for different possible tank rupture incident outcomes. The F–N curve is the most common way in QRA studies to express a collective risk and the frequencies at which such multi-fatality events would be tolerated within socially acceptable criteria. The F–N curves are cumulative distributions that graphically relate the number of fatalities (N) in an incident to the occurrence frequency (F) causing the ‘N’ or more fatalities [46]. Such graphical representation of societal risk expands the risk indicators as they depict the likelihood of all possible incident scenarios with different severities of consequences, i.e., fatalities. At the same time, it proves the significance of the proposed mitigation measure for overall risk reduction [47]. Since the cumulative frequency values and the number of fatalities vary by several orders of magnitude, the logarithmic scales are typically used for F–N curves. The methodologies for building F–N curves have been extensively studied over the years for chemical industries [48]. A similar model for F–N curve generation based on the literature [48] has been developed in this section for analysing hydrogen tank rupture scenarios in tunnels (see Figure 6.).
The possible tank rupture cases considered for constructing the F–N curve in this section are detailed in Table 4.
The population data, i.e., people affected in each incident outcome case is used as the number of people present within the fatality zone obtained from “consequence analysis”. Finally, to build the F–N curve, a list of all incident outcome cases, corresponding frequencies and number of fatalities are compiled in the descending order of “N” such that the cumulative frequencies are determined for each case including the occurrence of that event and all events preceding it.
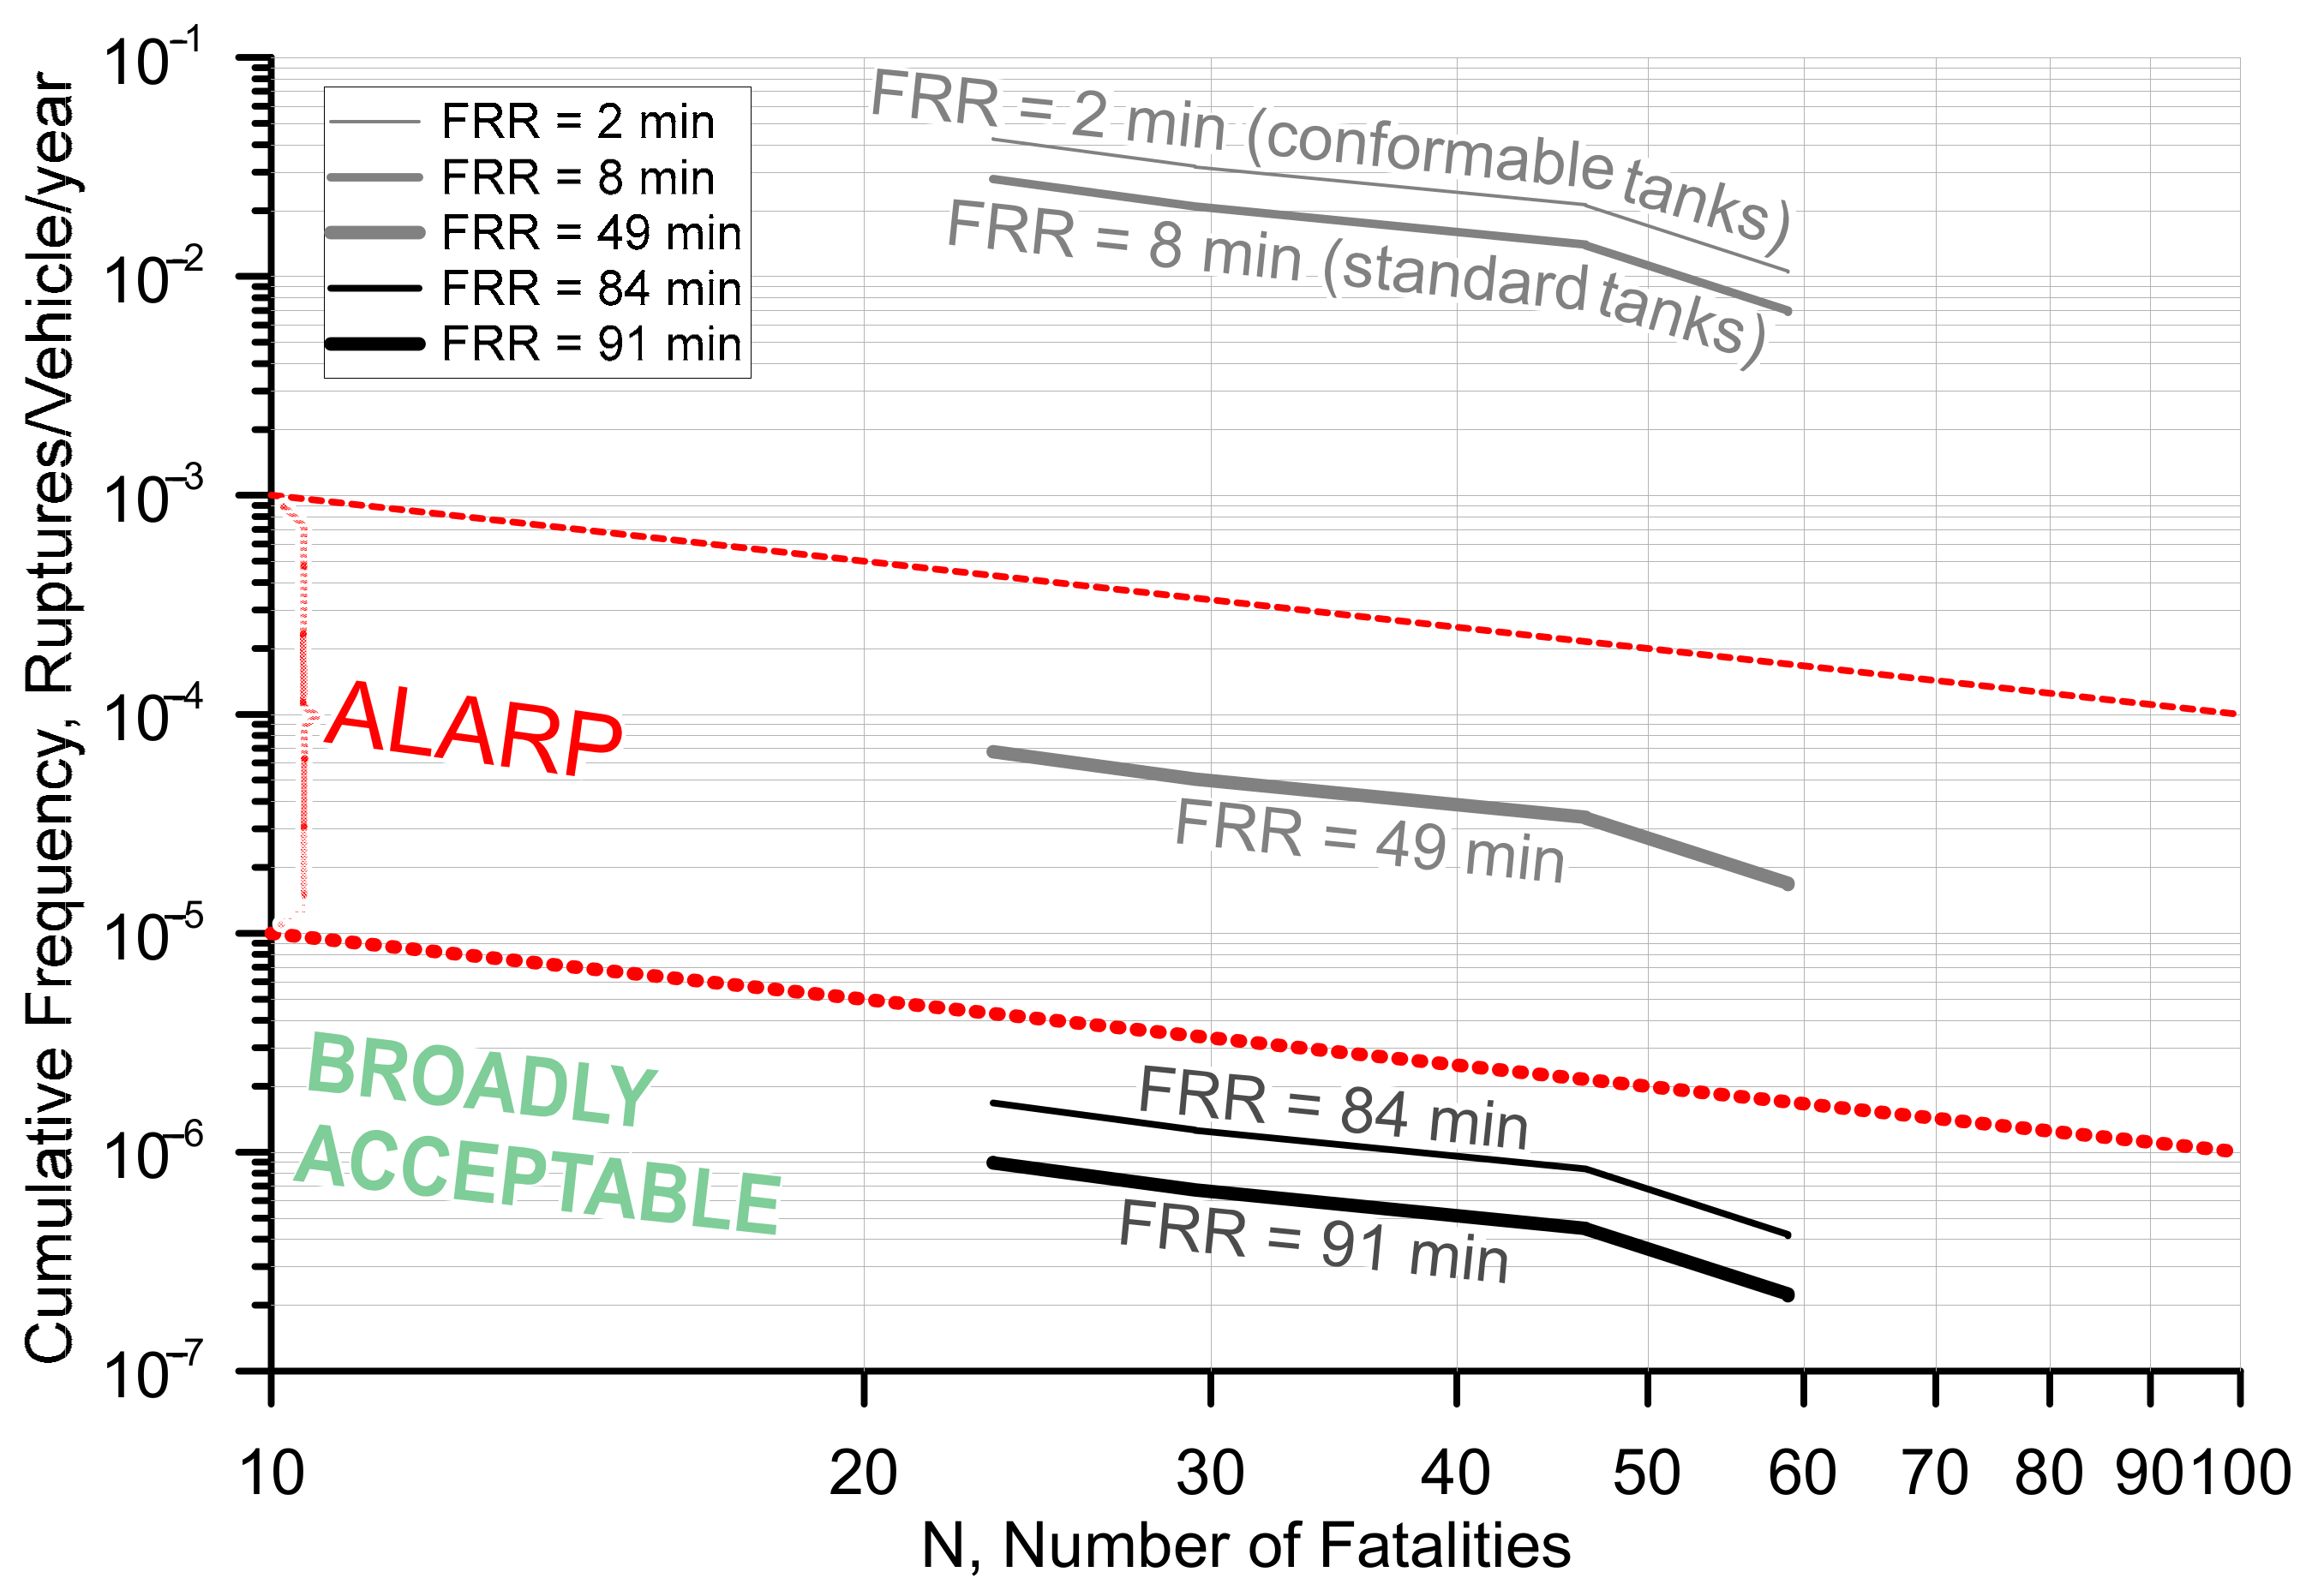
Figure 7 depicts the graphical representation of F–N curves, with the as low as reasonably practical (ALARP) level shown. The ALARP level typically denotes the minimum tolerable risk level required for society to accept hydrogen-powered vehicles, considering the hazards associated with onboard tank ruptures. The risk criterion for the ALARP level in the F–N curve was selected in this study following [49].
As can be seen in Figure 7, the societal risk associated with conformable tanks and standard tanks with FRR = 2 min and FRR = 8 min, respectively, is high and occurs in the region of intolerable risk level above ALARP. The increase in FRR to 49 min reduced the risk by almost three orders of magnitude within the ALARP region. The risk is reduced even further to a negligible (or broadly acceptable) level (below ALARP), as the tank FRR is increased to 84 min and even further to 91 min. This proves again the validity of the proposed risk reduction measures (“infinitely” increased tank FRR and the use of self-venting µLNB safety technology) for reducing the overall risk level of onboard hydrogen tank rupture in the road tunnel considering all potential incident outcome cases.
4.4. Sensitivity Analysis
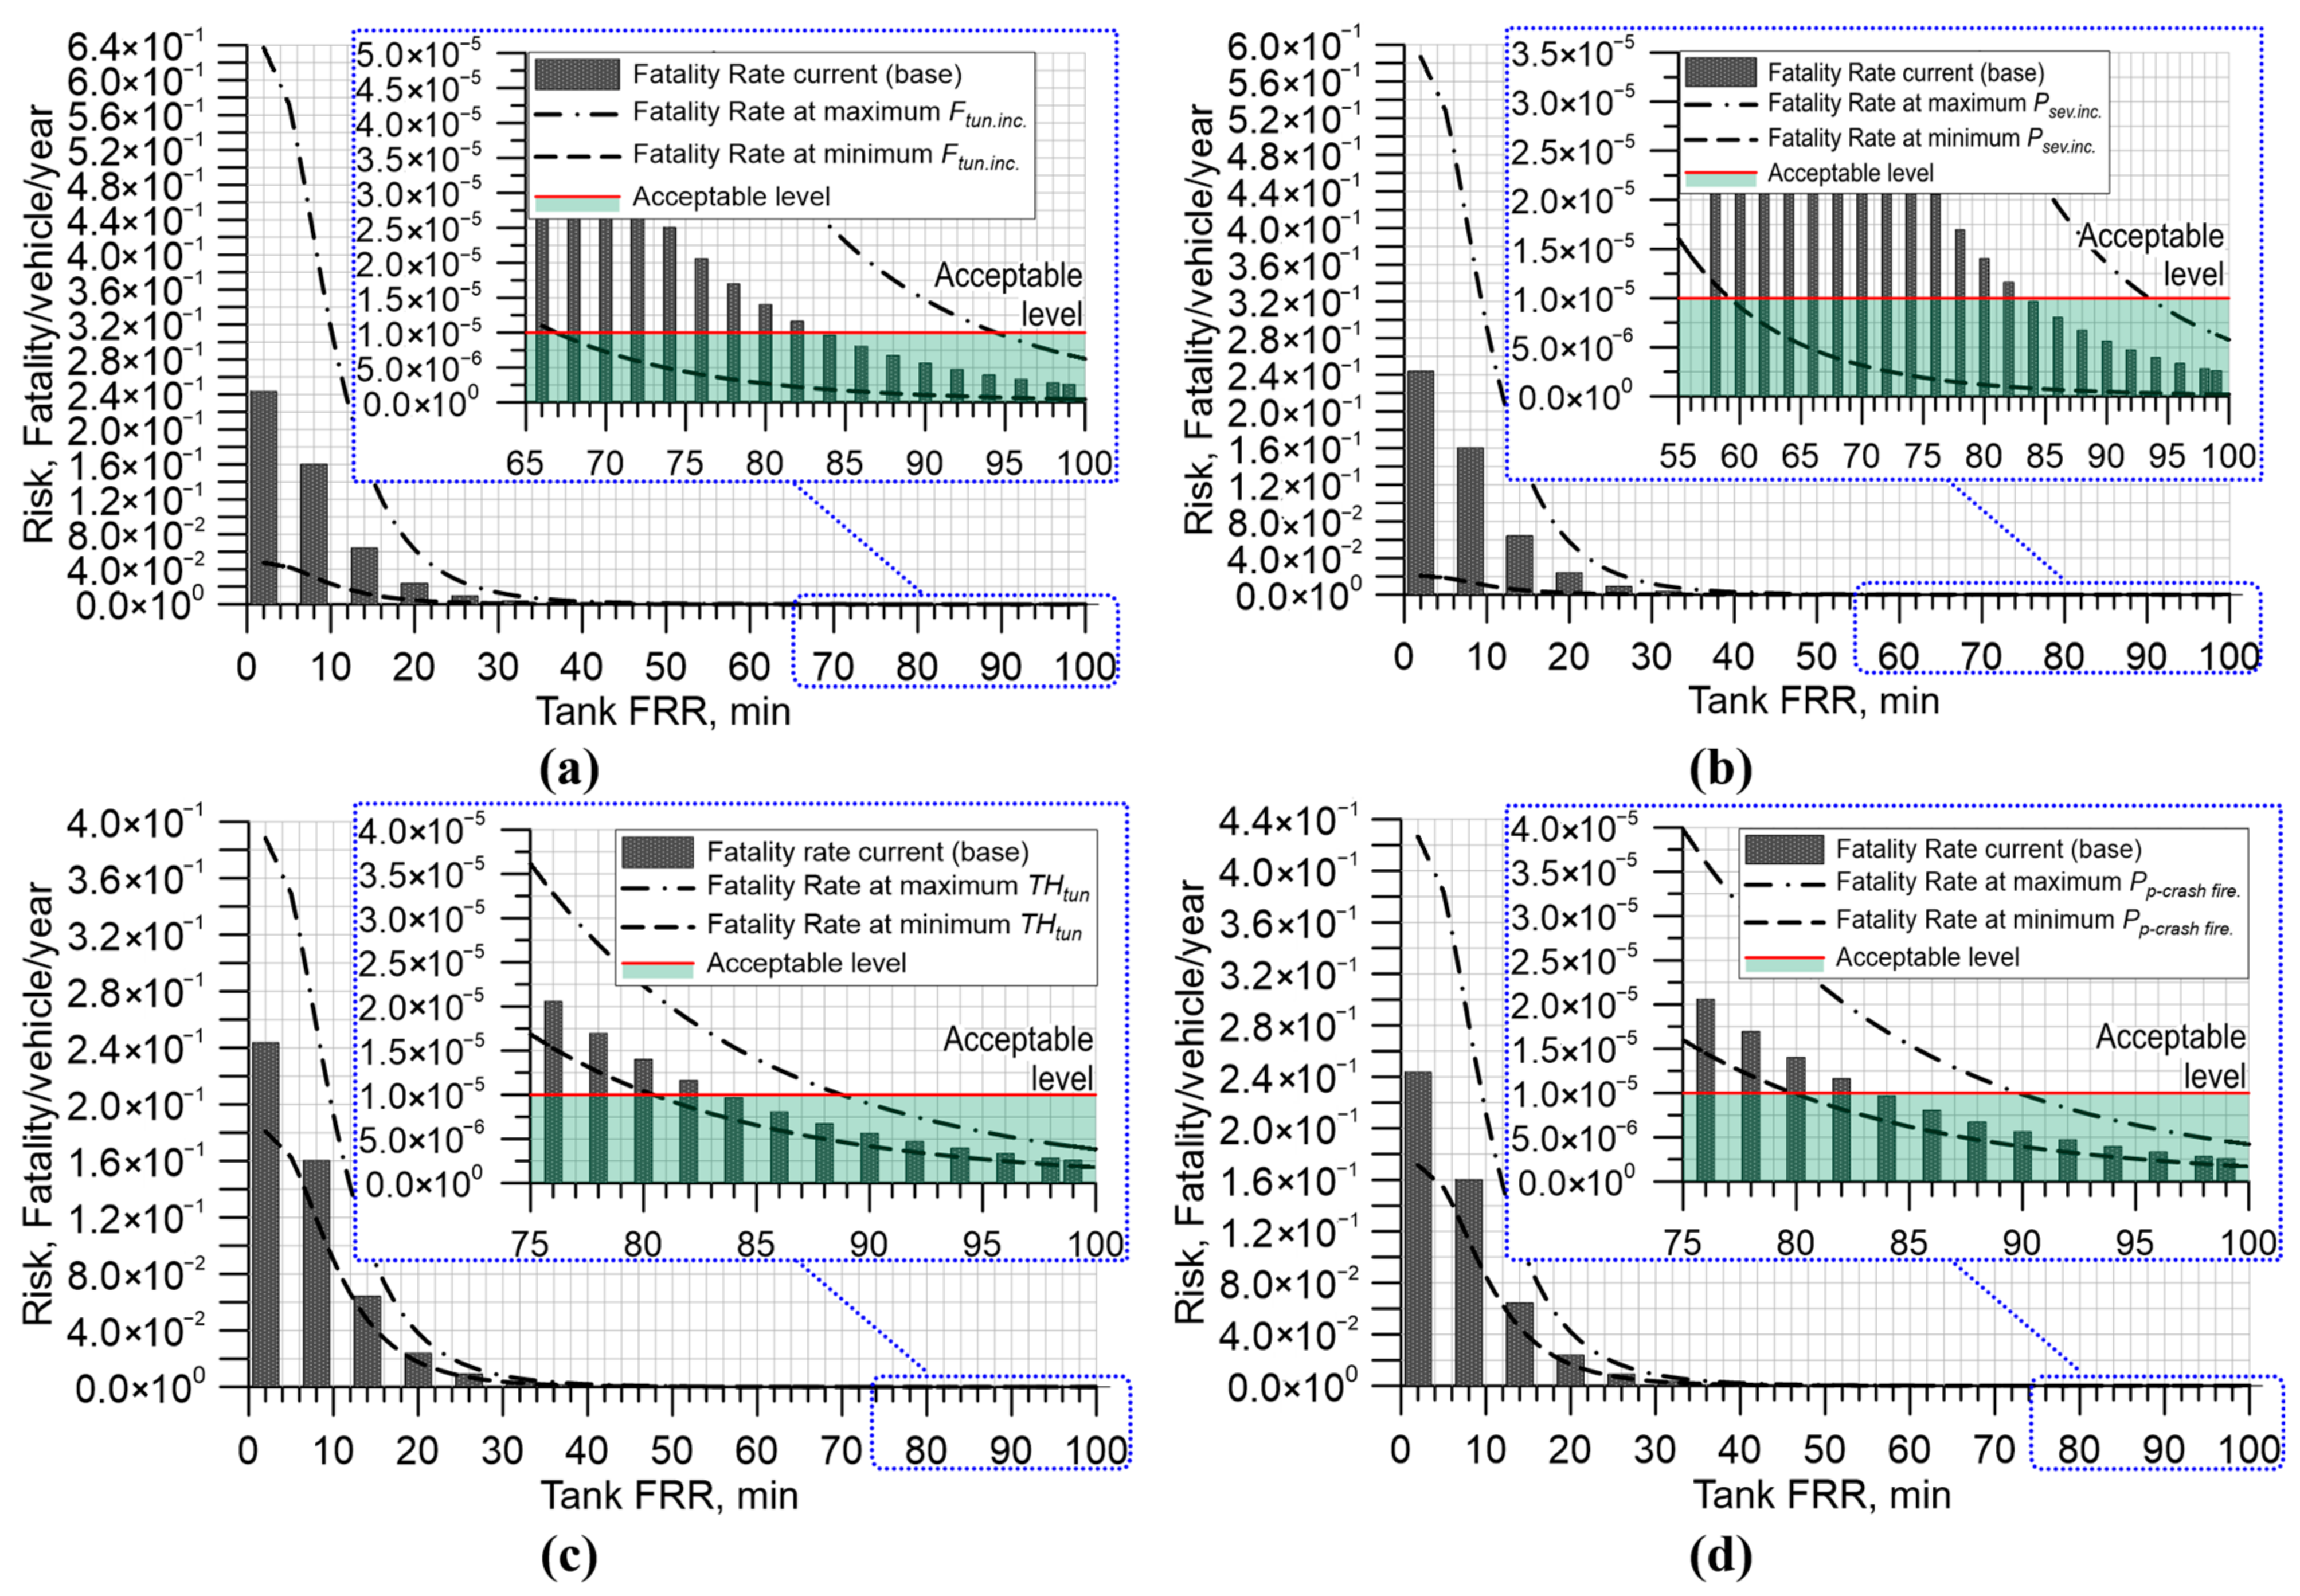
The analysis of the QRA model’s sensitivity to uncertainties resulting from probabilistic information produced and assumptions made in the absence of statistical data is necessary. In this study, the absence of statistical data for HFCVs, the type of fire resulting in a tank rupture, and the inherent uncertainty associated with the fire brigade’s response time to incidents are among the sources of uncertainty. The sensitivity of the proposed methodology to the uncertainty of selected input parameters is analysed. In this section, the sensitivity of the risk of the tank rupture to the traffic throughputs in the tunnels, frequencies of incidents inside tunnels, severe incident occurrence probabilities, and post-crash fire probabilities are assessed. The resulting risk (fatalities/vehicle/year) of hydrogen tank rupture for the particular scenario is calculated and presented as a function of the FRR by utilising the adjusted parameters [15,22] in the methodology. Table 5 provides the base value that was used in the proposed QRA methodology and the adjusted values used for sensitivity analysis for the aforementioned input parameters along with the FRR required to reduce the risk to socially acceptable levels for the adjusted values.
The risk (fatalities/vehicle/year) as a function of the FRR was assessed for these parameters for the tank rupture scenario of a localised fire at 50 m from the tunnel exit and compared to the previously calculated risk (see Figure 8).
The calculation results for deviations of input parameters observed from different road tunnels from across the world (Figure 8) clearly demonstrate that the unprotected standard and conformable hydrogen storage tanks with FRRs of 8 min and 2 min, respectively, provide the socially unacceptable risk level in the event of a hydrogen tank rupture inside a tunnel. An increased FRR of CHSS with TPRD and the use of alternative safety technologies that exclude a tank rupture in a fire is an effective safety measure for reducing and eliminating the risk of hydrogen-powered vehicle use in tunnels.
4.5. Sensitivity of Tank Rupture Risk—Fire Brigade Response Time
In this section, the authors have attempted to understand the inherent uncertainty of the fire brigade’s response time to road tunnel fire incidents and its effect on the risk of tank rupture. In the proposed methodology, the fire brigade response time plays a significant role in determining the fire escalation probability, , which affects the risk of hydrogen tank rupture in road tunnels. The benchmark data developed by Landucci et al. [40] was utilised in this work where the authors had developed a distribution that in 10% of the cases the brigade responds within 5 min and in 90% of the cases in only less than 20 min. However, it can be understood that not all road tunnel fires will fit within this benchmark distribution for brigade response time. It is also worth acknowledging that not in all cases the fire brigades will be able to respond within a safe time owing to several reasons including (but not limited to) the fire brigade’s distance from the fire location, a road being blocked during an incident, a delay in the detection and activation of fire alarms, potential time delays for reconnaissance and operations setup, and finally suppression time, which is highly dependent on the fire brigade team. Hence, in this section, the impact of uncertainty associated with the brigade response time on the risk of hydrogen tank rupture was evaluated. This was performed by developing new probit equations based on brigade response time distribution from past incident data for road tunnel fires. For this uncertainty analysis, the authors compiled incident information for which the data on brigade response time is available starting from the moment of fire detection to the time when a fire was declared extinguished by the fire brigade. Very severe cases of time delay in brigade responses such as in the case of the Nihon–Zaka tunnel fire (1979) [50] and the Mont Blanc Tunnel fire (1999) [51,52] which required almost 159 h and 53 h, respectively, for extinguishing and were excluded in this uncertainty analysis as response time distribution could not be developed without sufficient data points.
Table 6 presents detailed information on the response time distribution categorised into two groups to understand the sensitivity of response time on risk, corresponding data points used along with references, the calculation of new probit equation, and fire escalation probability.
The data used to develop the distribution of brigade response time were compiled from the following references [53,54,55]. For example, in Group 1, 19% of the analysed data points have a response time of under 5 min, while for the remaining 81% of the cases the tunnels the fires were responded to in less than 30 min. As a result, the failure probability for a 5 min response time is 81%, whereas for a 30 min response time it is 19%.
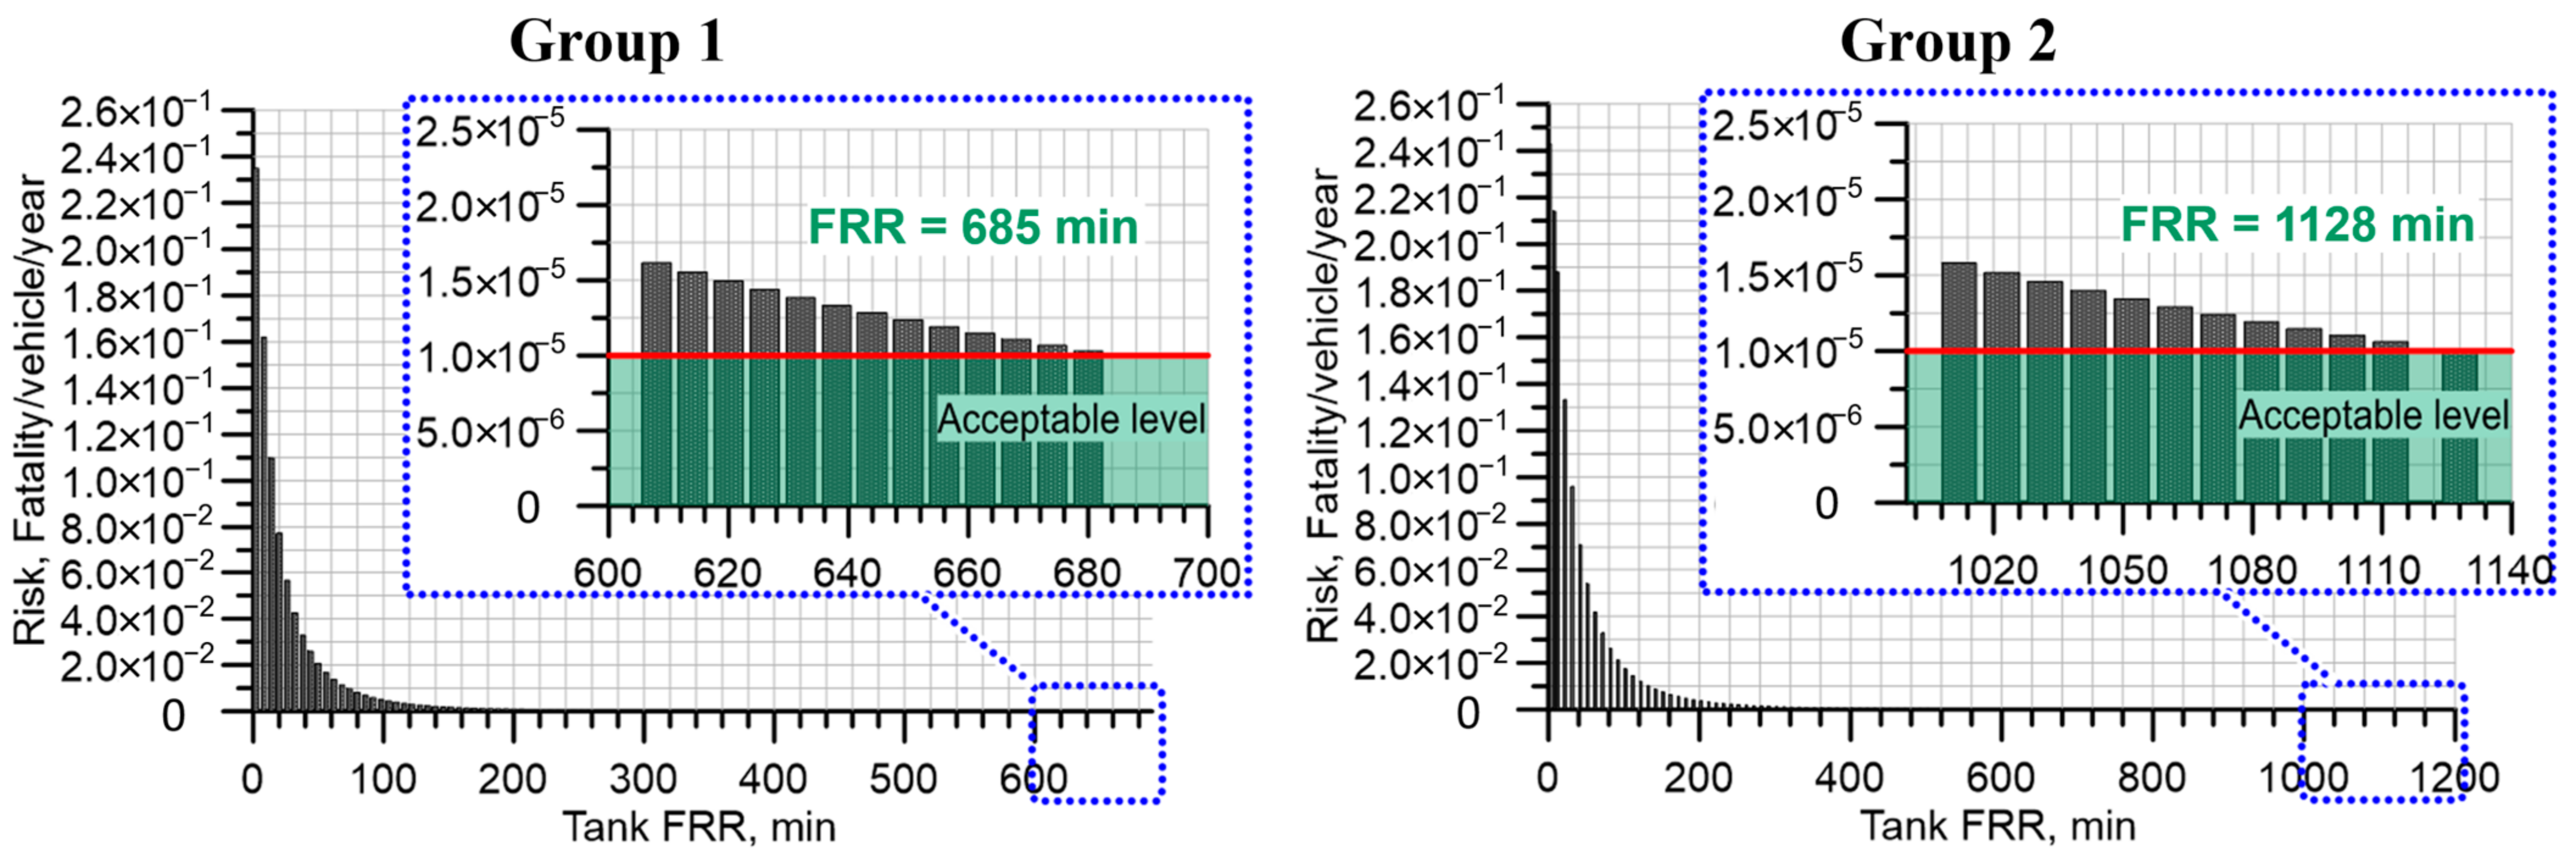
As mentioned before, it has to be acknowledged that not all tunnel fires can be responded to within an ideal time limit and hence it is essential to understand the influence of this parameter on the subjected risk. To understand the sensitivity of risk to fire brigade response time, the authors had represented the risk (fatalities/vehicle/year) as a function of the FRR based on the new probit equations following the same methodology presented in this paper. Figure 9 shows calculations for the same incident scenario of hydrogen tank rupture at 50 m from the tunnel exit due to a localised fire for tank SoC of 59% for both Group 1 and Group 2 (described in Table 6) response time distributions obtained from past incident data.
It is evident from this sensitivity analysis that the response time is critical in reducing the risk of tank rupture to an acceptable level. It is not realistically and practically possible to increase the FRR of CHSS with TPRD to such high values (in the case of TPRD failure or blockage in the incident), as shown in Figure 9 (685 min and 1128 min, i.e., 11 h 25 min and 18 h 48 min). For example, the FRR required for Group 1 response time distribution based on past incident data is nearly eight times higher than that required for the idealistic brigade response time, i.e., benchmark distribution used previously.
Hence, the authors emphasise the importance of the use of the breakthrough safety technology of explosion free in fire self-venting (TPRD-less) containers. The technology provides an unprecedented improvement in hydrogen storage safety level and excludes the risk of tank rupture irrespective of fire intensity and the fire brigade response time.
5. Conclusions
Considering previously unavailable knowledge on the hazards and associated risks of catastrophic hydrogen tank rupture in a tunnel fire, the significance of this study is in the developed QRA methodology and its demonstration on the example of the Dublin Tunnel. This empowers the stakeholders including the public by knowledge of the specific hazards and risks and elucidates the available prevention and mitigation strategies and engineering solutions.
The originality of the developed QRA methodology includes but is not limited to the application of the novel dimensionless correlation of the blast wave decay in a tunnel for an incident with a hydrogen-powered vehicle. The QRA for the road tunnel incident is demonstrated as a holistic analysis of the risk in terms of fatality/vehicle/year, including the sensitivity analysis, monetary losses, and the Frequency–Number of fatalities (F–N) curves. The pressure hazard to people in a tunnel due to the blast wave travel as a result of a hydrogen tank catastrophic failure in a fire and the linked risks are estimated in terms of fatalities per vehicle per year and cost per incident. The risks were assessed for the cases of a 62.4 L, NWP = 70 MPa hydrogen tank rupture in a fire with SoC = 99% and SoC = 59%. The frequency analysis is carried out by using existing statistical datasets for road tunnel incidents. The probability analysis resources provided by the Health and Safety Executive (HSE) in the UK were used to assess the risk in terms of costs per incident. By building F–N curves to analyse the degree of overall risk associated with different hydrogen tank rupture possibilities within the considered tunnel, it was consistently demonstrated that the FRR of standard high-pressure tanks represented the risk of an incident with ruptures of such tanks of several orders of magnitude above the acceptable level. At the same time, an increase in the FRR reduces the risk to the ALARP level and, depending on the safety technology applied, even below the acceptable risk criteria level.
The rigour of the research is supported by the use of related data from safety science and engineering sources. The described QRA methodology is applied to a fire in one of the tubes of a Dublin tunnel involving a hydrogen-powered vehicle with the aforementioned contemporary Type IV hydrogen storage tank. The QRA is based on statistics on car incidents and car fires in the UK. The cost of an incident was assessed using data from the HSE (UK). The increase in the FRR to 91 min reduces both risks to acceptable levels below 10−5 fatality/vehicle/year and the cost of minor injury of 300 GBP/incident. The competing technology to increase the FRR and exclude tank rupture in a fire is mentioned. The conservative values for the failure rate of PRD available from the industry and the European project FireComp are used as the TPRD failure frequency.
The results of the sensitivity analysis show that the efficient brigade response is crucial for reducing the risk of tank rupture in tunnels. As it was highlighted, the time of the brigade response to a fire incident can be delayed, especially in tunnels where the consequences are far more severe than in the open. It is impracticable to further increase FRR as a safety measure at such high-risk levels and any delay in the fire brigade’s response substantially increases the risk of a tank rupture by several orders of magnitude.
The authors are recommending the way out through the use of the ground-breaking safety technology of µLNB self-venting/TPRD-less tanks to eliminate the risk of tank catastrophic ruptures regardless of the potential time delays associated with fire brigade’s response time to tunnel incidents with hydrogen-powered vehicles.
Author Contributions
Conceptualization, M.D., V.M. and S.K.; methodology, M.D., S.K. and V.M.; software, M.D. and S.K.; formal analysis, M.D., S.K. and S.S.; investigation, S.K., M.D., S.S. and V.M.; resources, M.D., S.S. and S.K.; data curation, S.K. and M.D.; writing—original draft preparation, S.K., M.D. and S.S.; writing—review and editing, V.M., M.D. and S.S.; visualization, S.K. and S.S.; supervision, V.M., M.D. and S.K.; project administration, V.M.; funding acquisition, V.M. All authors have read and agreed to the published version of the manuscript.
Funding
This research was funded by the Engineering and Physical Sciences Research Council (EPSRC) of the UK for funding through the EPSRC Centre for Doctoral Training in Sustainable Hydrogen “SusHy”, grant number EP/S023909/1; SUPERGEN Hydrogen and Fuel Cell Hub project grant number EP/P024807/1; Fuel Cells and Hydrogen 2 Joint Undertaking (now Clean Hydrogen Joint Undertaking) for funding this research through the HyTunnel-CS project “Pre-normative research for safety of hydrogen driven vehicles and transport through tunnels and similar confined spaces”, grant number No.826193; SH2APED project “Storage of hydrogen: alternative pressure enclosure development” grant number No.101007182. This Joint Undertaking receives support from the European Union’s Horizon 2020 research and innovation programme, Hydrogen Europe, and Hydrogen Europe Research.
Institutional Review Board Statement
Not applicable.
Informed Consent Statement
Not applicable.
Data Availability Statement
Not applicable.
Conflicts of Interest
The authors declare no conflict of interest.
References
- Ingason, H.; Li, Y.Z. Spilled liquid fires in tunnels. Fire Saf. J. 2017, 91, 399–406. [Google Scholar] [CrossRef]
- Ingason, H.; Li, Y.Z.; Lönnermark, A. Tunnel Fire Dynamics; Springer: New York, NY, USA, 2015. [Google Scholar]
- Ingason, H.; Hammarström, R. Fire Test with a Front Wheel Loader Rubber Tyre; SP Report 2010:64; SP Technical Research Institute of Sweden: Boras, Sweden, 2010. [Google Scholar]
- Molkov, V.; Dadashzadeh, M.; Kashkarov, S.; Makarov, D. Performance of hydrogen storage tank with TPRD in an engulfing fire. Int. J. Hydrog. Energy 2021, 46, 36581–36597. [Google Scholar] [CrossRef]
- Ehrhart, B.D.; Brooks, D.M.; Muna, A.B.; LaFleur, C.B. Risk Assessment of Hydrogen Fuel Cell Electric Vehicles in Tunnels. Fire Technol. 2020, 56, 891–912. [Google Scholar] [CrossRef]
- Dadashzadeh, M.; Kashkarov, S.; Makarov, D.; Molkov, V. Risk assessment methodology for onboard hydrogen storage. Int. J. Hydrog. Energy 2018, 43, 6462–6475. [Google Scholar] [CrossRef]
- LaChance, J.; Houf, W.; Middletoon, B.; Fluer, L. Analyses to Support Development of Risk-Informed Separation Distances for Hydrogen Codes; SAND2009–0874; Sandia National Laboratories: Albuquerque, NM, USA, 2009. [Google Scholar]
- LaChance, J.; Tchouvelev, A.; Engebo, A. Development of uniform harm criteria for use in quantitative risk analysis of the hydrogen infrastructure. Int. J. Hydrog. Energy 2011, 36, 2381–2388. [Google Scholar] [CrossRef]
- Haugom, G.; Rikheim, H.; Nilsen, S. Hydrogen Applications. Risk Acceptance Criteria and Risk Assessment Methodology. In Proceedings of the European Hydrogen Energy Conference, Grenoble, France, 2–5 September 2003. [Google Scholar]
- UNECE. Global Registry. Addendum 13: Global technical regulation No. 13. In Global Technical Regulation on Hydrogen and Fuel Cell Vehicles; UNECE: Geneva, Switzerland, 2013. [Google Scholar]
- UNECE. Addendum 133–Regulation No. 134. In Uniform Provisions Concerning the Approval of Motor Vehicles and Their Components with Regard to the Safety-Related Performance of Hydrogen Fuelled Vehicles (HFCV); UNECE: Geneva, Switzerland, 2015. [Google Scholar]
- Mattelaer, V. Private Communication; Toyota Europe: Deeside, UK, 2020. [Google Scholar]
- Kashkarov, S.; Makarov, D.; Molkov, V. Performance of Hydrogen Storage Tanks of Type IV in a Fire: Effect of the State of Charge. Hydrogen 2021, 2, 386–398. [Google Scholar] [CrossRef]
- Road Tunnel Association (RTA). UK & Eire Road Tunnel Directory. 2019. Available online: http://www.rtoa.org.uk/Directory.html (accessed on 25 November 2022).
- Lafleur, C.; Bran-Anleu, G.; Muna, A.; Ehrhart, B.; Blaylock, M.; Houf, W. Hydrogen Fuel Cell Electric Vehicle Tunnel Safety Study; Sandia National Lab: Livermore, CA, USA, 2017. [Google Scholar]
- NJ. WATCH: Garbage Truck Explodes in Fireball, Rips Hole in Nearby House. NJCom. 2019. Available online: https://www.nj.com/mercer/2016/01/garbage_truck_explosion_damages_hamilton_house.html (accessed on 5 October 2022).
- Today. Caught on Camera: Natural-Gas Powered Garbage Truck Explodes. Today. 2016. Available online: https://www.today.com/video/caught-on-camera-natural-gas-powered-garbage-truck-explodes-609780803613 (accessed on 5 October 2022).
- A Garbage Truck Explosion Leaves Some Homes Damaged. 2016. Available online: https://www.youtube.com/watch?v=9lxMWxq5zJE (accessed on 5 October 2022).
- Rattigan, W.; Moodie, K.; Molkov, V.; Makarov, D.; Cirrone, D.; Shenstov, V.; Kashkarov, S.; Xu, Z.; Kuznetsov, M.; Venetsanos, A.; et al. Deliverable 4.3 Final Report on Analytical, Numerical and Experimental Studies on Explosions, Including Innovative Prevention and Mitigation Strategies. 2022. Available online: https://hytunnel.net/wordpress/wp-content/uploads/2022/09/HyTunnel-CS_D4.3_Final-report-on-analytical-numerical-and-experimental-studies-on-explosions.pdf (accessed on 6 October 2022).
- Makarov, D.; Cirrone, D.; Shentsov, V.; Kashkarov, S.; Molkov, V.; Xu, Z.; Kuznetsov, M.; Venetsanos, A.G.; Giannissi, S.G.; Tolias, I.C.; et al. Overview of first outcomes of PNR project HyTunnel-CS. In Proceedings of the International Conference on Hydrogen Safety (ICHS2021) “Safe Hydrogen for Net Zero”, Edinburgh, UK, 21–24 September 2021. [Google Scholar]
- Molkov, V.; Dery, W. The blast wave decay correlation for hydrogen tank rupture in a tunnel fire. Int. J. Hydrog. Energy 2020, 45, 31289–31302. [Google Scholar] [CrossRef]
- Kashkarov, S.; Li, Z.; Molkov, V. Blast wave from a hydrogen tank rupture in a fire in the open: Hazard distance nomograms. Int. J. Hydrog. Energy 2020, 45, 2429–2446. [Google Scholar] [CrossRef]
- Bassan, S. Overview of traffic safety aspects and design in road tunnels. IATSS Res. 2016, 40, 35–46. [Google Scholar] [CrossRef] [Green Version]
- Amundsen, F.H.; Ranes, G. Studies on traffic accidents in Norwegian road tunnels. Tunn. Undergr. Space Technol. 2000, 15, 3–11. [Google Scholar] [CrossRef]
- Yamashita, A.; Kondo, M.; Goto, S.; Ogami, N. Development of High-Pressure Hydrogen Storage System for the Toyota “Mirai”. SAE Int. 2015. [Google Scholar] [CrossRef]
- Molkov, V.; Kashkarov, S. Blast wave from a high-pressure gas tank rupture in a fire: Stand-alone and under-vehicle hydrogen tanks. Int. J. Hydrog. Energy 2015, 40, 12581–12603. [Google Scholar] [CrossRef]
- What Are the Average Dimensions of a Car in the UK? 2021. Available online: https://www.nimblefins.co.uk/cheap-car-insurance/average-car-dimensions (accessed on 12 October 2021).
- Average Car and Van Occupancy England 2002–2018 Statistic. Statista n.d. Available online: https://www.statista.com/statistics/314719/average-car-and-van-occupancy-in-england/ (accessed on 12 October 2021).
- Weyandt, N. Vehicle bonfire to induce catastrophic failure of a 5000-psig hydrogen cylinder installed on a typical SUV. In Southwest Research Institute Report for the Motor Vehicle Fire Research Institute; Motor Vehicle Fire Research Institute: Charlottesville, VA, USA, 2006. [Google Scholar]
- Weyandt, N. Analysis of Induced Catastrophic Failure of A 5000 psig Type IV Hydrogen Cylinder. In Southwest Research Institute Report for the Motor Vehicle Fire Research Institute; Motor Vehicle Fire Research Institute: Charlottesville, VA, USA, 2005. [Google Scholar]
- Zheng, J.; Bie, H.; Xu, P.; Chen, H.; Liu, P.; Li, X.; Liu, Y. Experimental and numerical studies on the bonfire test of high-pressure hydrogen storage vessels. Int. J. Hydrog. Energy 2010, 35, 8191–8198. [Google Scholar] [CrossRef]
- Molkov, V.; Cirrone, D.M.C.; Shentsov, V.; Dery, W.; Kim, W.; Makarov, D. Dynamics of blast wave and fireball after hydrogen tank rupture in a fire in the open atmosphere. Int. J. Hydrog. Energy 2021, 46, 4644–4665. [Google Scholar] [CrossRef]
- Shentsov, V.; Cirrone, D.M.C.; Makarov, D.; Molkov, V. Simulation of fireball and blast wave from a hydrogen tank rupture in a fire. In Proceedings of the 7th International Symposium on Non-equilibrium Processes, Plasma, Combustion, and Atmospheric Phenomena, Sochi, Russia, 2–7 October 2016; Torus Press: Sochi, Russia, 2016. [Google Scholar]
- Kudriakov, S.; Studer, E.; Bernard-Michel, G.; Bouix, D.; Domergue, L.; Forero, D.; Gueguen, H.; Ledier, C.; Manicardi, P.; Martin, M.; et al. Full-scale tunnel experiments: Blast wave and fireball evolution following hydrogen tank rupture. Int. J. Hydrog. Energy 2022, 47, 18911–18933. [Google Scholar] [CrossRef]
- UK Health and Safety Executive. Risk Management: Expert Guidance—Cost Benefit Analysis (CBA) Checklist n.d. Available online: https://www.hse.gov.uk/managing/theory/alarpcheck.htm (accessed on 16 September 2022).
- US DOT National Highway Traffic Safety Administration (NHTSA). Traffic Safety Facts 2015: A Compilation of Motor Vehicle Crash Data from the Fatality Analysis Reporting System and the General Estimates System; National Highway Traffic Safety: Washington, DC, USA, 2015.
- Reliability Analysis Center. Non Electronic Parts Reliability Data; Reliability Analysis Center: Rome, NY, USA, 1991. [Google Scholar]
- Saw, J.L.; Flauw, Y.; Demeestere, M.; Naudet, V.; Blanc-Vannet, P.; Hollifield, K.; Wilday, J. The EU FireComp Project and Risk Assessment of Hydrogen Composite Storage Applications using Bow-tie Analysis. In Proceedings of the Hazards, Edinburgh, UK, 24–26 May 2016; Volume 26. [Google Scholar]
- Landucci, G.; Gubinelli, G.; Antonioni, G.; Cozzani, V. The assessment of the damage probability of storage tanks in domino events triggered by fire. Accid. Anal. Prev. 2009, 41, 1206–1215. [Google Scholar] [CrossRef]
- Landucci, G.; Argenti, F.; Tugnoli, A.; Cozzani, V. Quantitative assessment of safety barrier performance in the prevention of domino scenarios triggered by fire. Reliab. Eng. Syst. Saf. 2015, 143, 30–43. [Google Scholar] [CrossRef]
- Papoulis, A. Probability, Random Variables, and Stochastic Processes, 3rd ed.; McGraw-Hill: New York, NY, USA, 1965. [Google Scholar]
- Finney, D.J. Probit Analysis, 3rd ed.; Cambridge University Press: Cambridge, UK, 1971. [Google Scholar]
- Makarov, D.; Kim, Y.; Kashkarov, S.; Molkov, V. Thermal Protection and Fire Resistance of High-Pressure Hydrogen Storage. In Proceedings of the 8th International Seminar on Fire & Explosion Hazards, Hefei, China, 25–28 April 2016. [Google Scholar]
- Halm, D.; Fouillen, F.; Laine, E.; Gueguen, M.; Bertheau, D.; Van Eekelen, T. Composite pressure vessels for hydrogen storage in fire conditions: Fire tests and burst simulation. Int. J. Hydrog. Energy 2017, 42, 20056–20070. [Google Scholar] [CrossRef]
- Molkov, V.; Makarov, D.; Kashkarov, S. Composite Pressure Vessel for Hydrogen Storage. WO 2018/149772 A1 23 August 2018. [Google Scholar]
- Aloqaily, A. Cross Country Pipeline Risk Assessments and Mitigation Strategies; Gulf Professional Publishing: Oxford, UK, 2018. [Google Scholar]
- Burgherr, P.; Hirschberg, S. A Comparative Analysis of Accident Risks in Fossil, Hydro, and Nuclear Energy Chains. Hum. Ecol. Risk Assess. Int. J. 2008, 14, 947–973. [Google Scholar] [CrossRef]
- Freeman, R.A. CCPS guidelines for chemical process quantitative risk analysis. Plant Oper. Prog. 1990, 9, 231–235. [Google Scholar] [CrossRef]
- Zhiyong, L.; Xiangmin, P.; Jianxin, M. Quantitative risk assessment on a gaseous hydrogen refueling station in Shanghai. Int. J. Hydrog. Energy 2010, 35, 6822–6829. [Google Scholar] [CrossRef]
- Kunishima, M.; Horikawa, K. The Fire Disaster in the Tokyo-Nagoya Nihon-zaka Tunnel 11 July 1979. Failure Knowledge Database/100 Selected Cases. 1980. Available online: http://www.shippai.org/fkd/en/hfen/HD1000132.pdf (accessed on 16 September 2022).
- Lacroix, D. The Mont Blanc tunnel fire. What happened and what has been learned. In Proceedings of the Fourth International Conference On Safety In Road And Rail Tunnels, Madrid, Spain, 2–6 April 2001. [Google Scholar]
- Kim, H.K.; Lönnermark, A.; Ingason, H. Effective Firefighting Operations in Road Tunnels; SP Sveriges Tekniska Forskningsinstitut: Borås, Sweden, 2010. [Google Scholar]
- Casey, N. Fire incident data for Australian road tunnels. Fire Saf. J. 2020, 111, 102909. [Google Scholar] [CrossRef]
- Beard, A.; Carvel, R. Handbook of Tunnel Fire Safety; ICE Publishing: London, UK, 2012. [Google Scholar] [CrossRef]
- Maevski, I. Design Fires in Road Tunnels—Transportation Research Board; National Academy of Sciences: Washington, DC, USA, 2011. [Google Scholar]
Figure 1.
The QRA methodology flowchart for HFCV in a tunnel: (a) risk in terms of fatality per vehicle per year; (b) risk in terms of monetary losses per incident. *—fireball and thermal hazards are excluded from consideration in this study due to the current unavailability of the tool for assessment of a fireball propagation inside tunnels; **—serious and slight injuries are excluded from consideration in this study; only fatalities are considered.

Figure 2.
Schematic representation of possible overpressure threshold locations inside and outside the tunnel, corresponding to hazard zones.
Figure 2.
Schematic representation of possible overpressure threshold locations inside and outside the tunnel, corresponding to hazard zones.

Figure 3.
Blast wave decay in the Dublin Tunnel for the 62.4 L tank for SoC = 99% and SoC = 59% (T = 20 °C).
Figure 3.
Blast wave decay in the Dublin Tunnel for the 62.4 L tank for SoC = 99% and SoC = 59% (T = 20 °C).

Figure 4.
Risk (fatality/vehicle/year) as a function of hydrogen storage tank FRR for 62.4 L tank rupture at SoC = 59%: localised fire (a) and engulfing fire (b).
Figure 4.
Risk (fatality/vehicle/year) as a function of hydrogen storage tank FRR for 62.4 L tank rupture at SoC = 59%: localised fire (a) and engulfing fire (b).

Figure 5.
Risk (GBP/incident) as a function of hydrogen storage tank FRR for 62.4 L tank rupture at SoC = 59%: localised fire (a) and engulfing fire (b).
Figure 5.
Risk (GBP/incident) as a function of hydrogen storage tank FRR for 62.4 L tank rupture at SoC = 59%: localised fire (a) and engulfing fire (b).

Figure 6.
Procedure for the calculation of societal risk: F–N curve.

Figure 7.
F–N curve—societal risk representation.

Figure 8.
Sensitivity analysis of different parameters on the risk of hydrogen tank rupture in road tunnel: (a)—tunnel incident frequency; (b)—the probability of occurrence of severe incident; (c)—annual throughput for Dublin tunnel; (d)—the probability of post-crash fires.
Figure 8.
Sensitivity analysis of different parameters on the risk of hydrogen tank rupture in road tunnel: (a)—tunnel incident frequency; (b)—the probability of occurrence of severe incident; (c)—annual throughput for Dublin tunnel; (d)—the probability of post-crash fires.

Figure 9.
Risk (fatality/vehicle/year) as a function of hydrogen storage tank FRR for 62.4 L tank rupture at SoC = 59% due to localised fire: Group 1 (left) and Group 2 (right).
Figure 9.
Risk (fatality/vehicle/year) as a function of hydrogen storage tank FRR for 62.4 L tank rupture at SoC = 59% due to localised fire: Group 1 (left) and Group 2 (right).


Table 1.
Portions of mechanical and chemical energies contributing to the blast strength after 62.4 L tank rupture in a fire for two different SoC.
Table 1.
Portions of mechanical and chemical energies contributing to the blast strength after 62.4 L tank rupture in a fire for two different SoC.
| Tank SoC, % | Storage Pressure, MPa | |||
|---|---|---|---|---|
| 99 | 70 | 13.6 | 15.6 | 29.2 |
| 59 * | 35.5 * | 8.1 * | 9.3 * | 17.4 * |
Note: * This SoC will be used for the consequence analysis in the methodology application example.
Table 2.
Tunnel and vehicle parameters and the average number of passengers per vehicle.
| Tunnel and Vehicle Parameters | Values | Units |
|---|---|---|
| Overall tunnel length [14] | 4650 | m |
| Tunnel cross-section area [21] | 39.5 | m2 |
| Tunnel length used in calculations | 4600 | m |
| Tunnel throughput [14] | 5.5 * | 106 vehicle |
| Car length (calculated average from [27]) | 4.5 | m |
| Length of the gap between cars (assumption) | 5 | m |
| The average number of passengers per vehicle [28] | 1.55 | person/vehicle |
Note: *—the throughput of 5.5 × 10⁶ vehicles is for two tubes of the tunnels; the throughput for one tube is 5.5 × 10⁶ vehicles/2 = 2.75 × 10⁶ vehicles and it will be used in this study.
Table 3.
Hazard zones from the blast wave after the tank rupture inside one tube of the tunnel.
| Harm to People | Blast Wave Hazard Zone for Tank Rupture at Different SoC | |
|---|---|---|
| Tank SoC = 99% (70 MPa, at 20 °C) | Tank SoC = 59% (35.5 MPa, at 20 °C) | |
| Fatality | 0–90 m | 0–70 m |
| Serious Injury | 90–1150 m | 70–900 m |
| Slight Injury | 1150–4600 m (end of the tunnel) | 900–4600 m (end of the tunnel) |
| No harm | Does not exist | Does not exist |
Table 4.
Tank rupture events, which are used for building the F–N curve.
| Tank SoC | Fire Mode | Hydrogen Tank Location |
|---|---|---|
| 59% | Localised fire | At 50 m from the tunnel exit |
| At the tunnel’s midway length | ||
| Engulfing fire | At 50 m from the tunnel exit | |
| At the tunnel’s midway length | ||
| 99% | Localised fire | At 50 m from the tunnel exit |
| At the tunnel’s midway length | ||
| Engulfing fire | At 50 m from the tunnel exit | |
| At the tunnel’s midway length |
Table 5.
Sensitivity analysis for selected input parameters.
| Parameter | Minimum | Base a | Maximum | ||||||
|---|---|---|---|---|---|---|---|---|---|
| Value | FRR, Min b | Value | FRR, Min b | Value | FRR, Min b | ||||
| Loc. Fire | Eng. Fire | Loc. Fire | Eng. Fire | Loc. Fire | Eng. Fire | ||||
| 5.00 × 10⁻³ | 60 | 26 | 5.94 × 10⁻² | 84 | 43 | 1.43 × 10⁻¹ | 94 | 50 | |
| 2.23 × 10⁻¹ | 80 | 41 | 3.17 × 10⁻¹ | 5.55 × 10⁻¹ | 90 | 48 | |||
| c | 2.04 × 10⁶ | 81 | 41 | 2.75 × 10⁶ | 4.38 × 10⁶ | 89 | 47 | ||
| d | 6.00 × 10⁻² | 67 | 32 | 3.10 × 10⁻¹ | 8.10 × 10⁻¹ | 95 | 51 | ||
Notes: a—The obtained (base) risks in the current study are shown in Figure 4; b—FRR for achieving the acceptable risk level, i.e., 10−5 fatalities/vehicle/year; c—Units for the annual tunnel throughput, , are 106 vehicles; d—Units for the frequency of incidents in a tunnel, , are incident/106 vehicle-mile/year.
Table 6.
Detailed calculations for uncertainty analysis based on incident data in real road tunnel fires [53,54,55].
| Group 1 | Group 2 | |||
|---|---|---|---|---|
| No. of data cases (tunnel fires) | 78 incidents | 110 incidents | ||
| Response time distribution | 19% cases | response time under 5 min | 5% cases | response time under 5 min |
| 81% cases | response time under 30 min | 95% cases | response time under 120 min | |
| Hence, failure probability: for 5 min response time—81%, for 30 min response time—19% | Hence, failure probability: for 5 min response time—95%, for 120 min response time—5% | |||
| Calculated probit function values a | 5.88 | —for 5 min | 6.6 | —for 5 min |
| 4.12 | —for 30 min | 3.36 | —for 120 min | |
| The new probit coefficients, and | ||||
| The new | = 7.46 − 0.98 × ln (8) = 5.422 | = 8.3 − 1.03 × ln (8) = 6.158 | ||
| ] = 6.635 × 10⁻¹ | ] = 8.766 × 10⁻¹ | |||
a—The value of the probit function, , can be calculated using Equation (4).
Publisher’s Note: MDPI stays neutral with regard to jurisdictional claims in published maps and institutional affiliations. |
© 2022 by the authors. Licensee MDPI, Basel, Switzerland. This article is an open access article distributed under the terms and conditions of the Creative Commons Attribution (CC BY) license (https://creativecommons.org/licenses/by/4.0/).
Share and Cite
MDPI and ACS Style
Kashkarov, S.; Dadashzadeh, M.; Sivaraman, S.; Molkov, V. Quantitative Risk Assessment Methodology for Hydrogen Tank Rupture in a Tunnel Fire. Hydrogen 2022, 3, 512-530. https://doi.org/10.3390/hydrogen3040033
AMA Style
Kashkarov S, Dadashzadeh M, Sivaraman S, Molkov V. Quantitative Risk Assessment Methodology for Hydrogen Tank Rupture in a Tunnel Fire. Hydrogen. 2022; 3(4):512-530. https://doi.org/10.3390/hydrogen3040033
Chicago/Turabian StyleKashkarov, Sergii, Mohammad Dadashzadeh, Srinivas Sivaraman, and Vladimir Molkov. 2022. "Quantitative Risk Assessment Methodology for Hydrogen Tank Rupture in a Tunnel Fire" Hydrogen 3, no. 4: 512-530. https://doi.org/10.3390/hydrogen3040033