Article

α2δ-4 and Cachd1 Proteins Are Regulators of Presynaptic Functions

1
Institute of Physiology, Medical University Innsbruck, 6020 Innsbruck, Austria
2
Division Physiology, Department of Pharmacology, Physiology and Microbiology, Karl Landsteiner University of Health Sciences, 3500 Krems, Austria
3
Department Pharmacology and Toxicology, University of Innsbruck, 6020 Innsbruck, Austria
4
Reading School of Pharmacy, University of Reading, Reading RG6 6UB, UK
5
Institute of Anatomy and Molecular Neurobiology, Westfälische Wilhelms-University, 48149 Münster, Germany
*
Author to whom correspondence should be addressed.
Int. J. Mol. Sci. 2022, 23(17), 9885; https://doi.org/10.3390/ijms23179885
Submission received: 7 July 2022 / Revised: 15 August 2022 / Accepted: 24 August 2022 / Published: 31 August 2022
(This article belongs to the Special Issue Calcium Handling 2.0)

Abstract

:
The α2δ auxiliary subunits of voltage-gated calcium channels (VGCC) were traditionally regarded as modulators of biophysical channel properties. In recent years, channel-independent functions of these subunits, such as involvement in synapse formation, have been identified. In the central nervous system, α2δ isoforms 1, 2, and 3 are strongly expressed, regulating glutamatergic synapse formation by a presynaptic mechanism. Although the α2δ-4 isoform is predominantly found in the retina with very little expression in the brain, it was recently linked to brain functions. In contrast, Cachd1, a novel α2δ-like protein, shows strong expression in brain, but its function in neurons is not yet known. Therefore, we aimed to investigate the presynaptic functions of α2δ-4 and Cachd1 by expressing individual proteins in cultured hippocampal neurons. Both α2δ-4 and Cachd1 are expressed in the presynaptic membrane and could rescue a severe synaptic defect present in triple knockout/knockdown neurons that lacked the α2δ-1-3 isoforms (α2δ TKO/KD). This observation suggests that presynaptic localization and the regulation of synapse formation in glutamatergic neurons is a general feature of α2δ proteins. In contrast to this redundant presynaptic function, α2δ-4 and Cachd1 differentially regulate the abundance of presynaptic calcium channels and the amplitude of presynaptic calcium transients. These functional differences may be caused by subtle isoform-specific differences in α12δ protein–protein interactions, as revealed by structural homology modelling. Taken together, our study identifies both α2δ-4 and Cachd1 as presynaptic regulators of synapse formation, differentiation, and calcium channel functions that can at least partially compensate for the loss of α2δ-1-3. Moreover, we show that regulating glutamatergic synapse formation and differentiation is a critical and surprisingly redundant function of α2δ and Cachd1.

1. Introduction

Voltage-gated calcium channels (VGCC) are multi-subunit protein complexes consisting of a pore-forming α1 and the auxiliary β and α2δ subunits, which are traditionally regarded as modulators of biophysical channel properties [1,2,3]. In the human genome, four genes (CACNA2D1-4) encode for four α2δ proteins (α2δ-1 to α2δ-4), which all are composed of a large glycosylated α2 peptide that is likely linked to a GPI membrane-anchored δ peptide [1,4]. In recent years, a number of studies have linked human α2δ genes to neurological and neuropsychiatric disorders, such as epilepsy, autism, schizophrenia, and anxiety disorders (reviewed [5,6]). Moreover, α2δ proteins were recently recognized as important regulators of synaptic functions, some of which may be independent of calcium channels. For example, α2δ-1 has been identified as a postsynaptic receptor for the glia-secreted thrombospondins which mediate excitatory synapse formation [7,8]. Loss of α2δ-2 was shown to affect cerebellar climbing fiber synapses [9] and postsynaptic calcium signaling function of cerebellar Purkinje neurons [10,11,12], as well as the structure and function of auditory hair cell synapses [10]. Moreover, in CNS neurons, α2δ-2 functions as a trans-synaptic organizer, recruiting postsynaptic GABAA receptors [11]. α2δ-3 is important for the formation of auditory nerve fiber synapses in mice [12], while invertebrate α2δ-3 homologues are required for the presynaptic development of motoneurons [13,14]. In contrast to α2δ-1, -2 and -3, which are highly expressed in the brain, the fourth isoform, α2δ-4, only shows very low expression levels in the cortex and hippocampus [15]. However, α2δ-4 is specifically expressed in the photoreceptor cells of the retina, where it mainly interacts with the CaV1.4 presynaptic L-type channel, and, importantly, is required for the proper organization of rod and cone photoreceptor synapses [16,17,18,19]. Recent studies also suggested a functional role of lowly expressed α2δ-4 in the brain. mRNA levels of α2δ-4 were increased in human hippocampal biopsies obtained from epileptic patients [20], and a recent study on knockout mice identified a role for α2δ-4 in cognitive and motor behavior [21].
A putative cache (Ca2+ channel and chemotaxis receptor) domain containing protein 1 (CACHD1) has been described as an α2δ-like protein, displaying structural similarities to members of the α2δ family and showing a wide expression in the CNS [22,23]. An expression study using rat and zebrafish illustrated that Cachd1 increases N-type calcium currents and surface expression and competes with α2δ-1 for binding to CaV2.2 [24]. Interestingly, upon co-expression, human CACHD1 also increased cell-surface localization of the CaV3.1 T-type channel [22], although T-type channels are not known to interact with auxiliary β and α2δ subunits [1]. Furthermore, overexpression of CACHD1 in hippocampal neurons caused a pronounced increase in T-type current-mediated spike firing [23]. The question of whether and how Cachd1 and α2δ-4 contribute to specific functions in neurons, which simultaneously express all α2δ isoforms, or whether they share functional redundancy with other α2δ isoforms, remains to be answered. Hence, considering that all α2δ subunits, including α2δ-4, have been linked to synapse formation, it is tempting to speculate that organizing synapse formation is a general feature of α2δ proteins.
By establishing an α2δ triple knockout/knockdown (TKO/KD) neuronal model system, we showed that the loss of presynaptic α2δ proteins leads to a severe defect in glutamatergic synapse formation and synaptic transmission. This striking phenotype could be rescued by the individual expression of the endogenous CNS isoforms α2δ-1, -2, and -3 [25]. In the present study, we aimed to examine the synaptic functions of α2δ-4 and the α2δ-like protein Cachd1. An analysis of surface expression revealed that α2δ-4 and Cachd1 can be targeted to the synaptic membrane, similar to α2δ-1 and α2δ-2, suggesting their involvement in specific synaptic functions. To investigate if mediating synaptogenesis is a general feature of α2δ proteins, we next examined the synaptogenic potential of α2δ-4 and Cachd1 in α2δ TKO/KD neurons. The expression of α2δ-4 and Cachd1 rescued synapse formation, presynaptic calcium channel clustering and presynaptic calcium transients in TKO/KD neurons. However, α2δ-4 and Cachd1 displayed subtle differences in their rescue abilities, suggesting distinct protein-specific synaptic functions. Indeed, α2δ-4 and Cachd1 differentially affected presynaptic calcium transients in wildtype neurons, where α2δ-4 showed reduced calcium signaling in comparison to Cachd1. Taken together, we provide the first evidence that α2δ-4 and Cachd1 have important synaptic roles in mediating glutamatergic synapse formation and differentially affecting presynaptic calcium transients.

2. Results

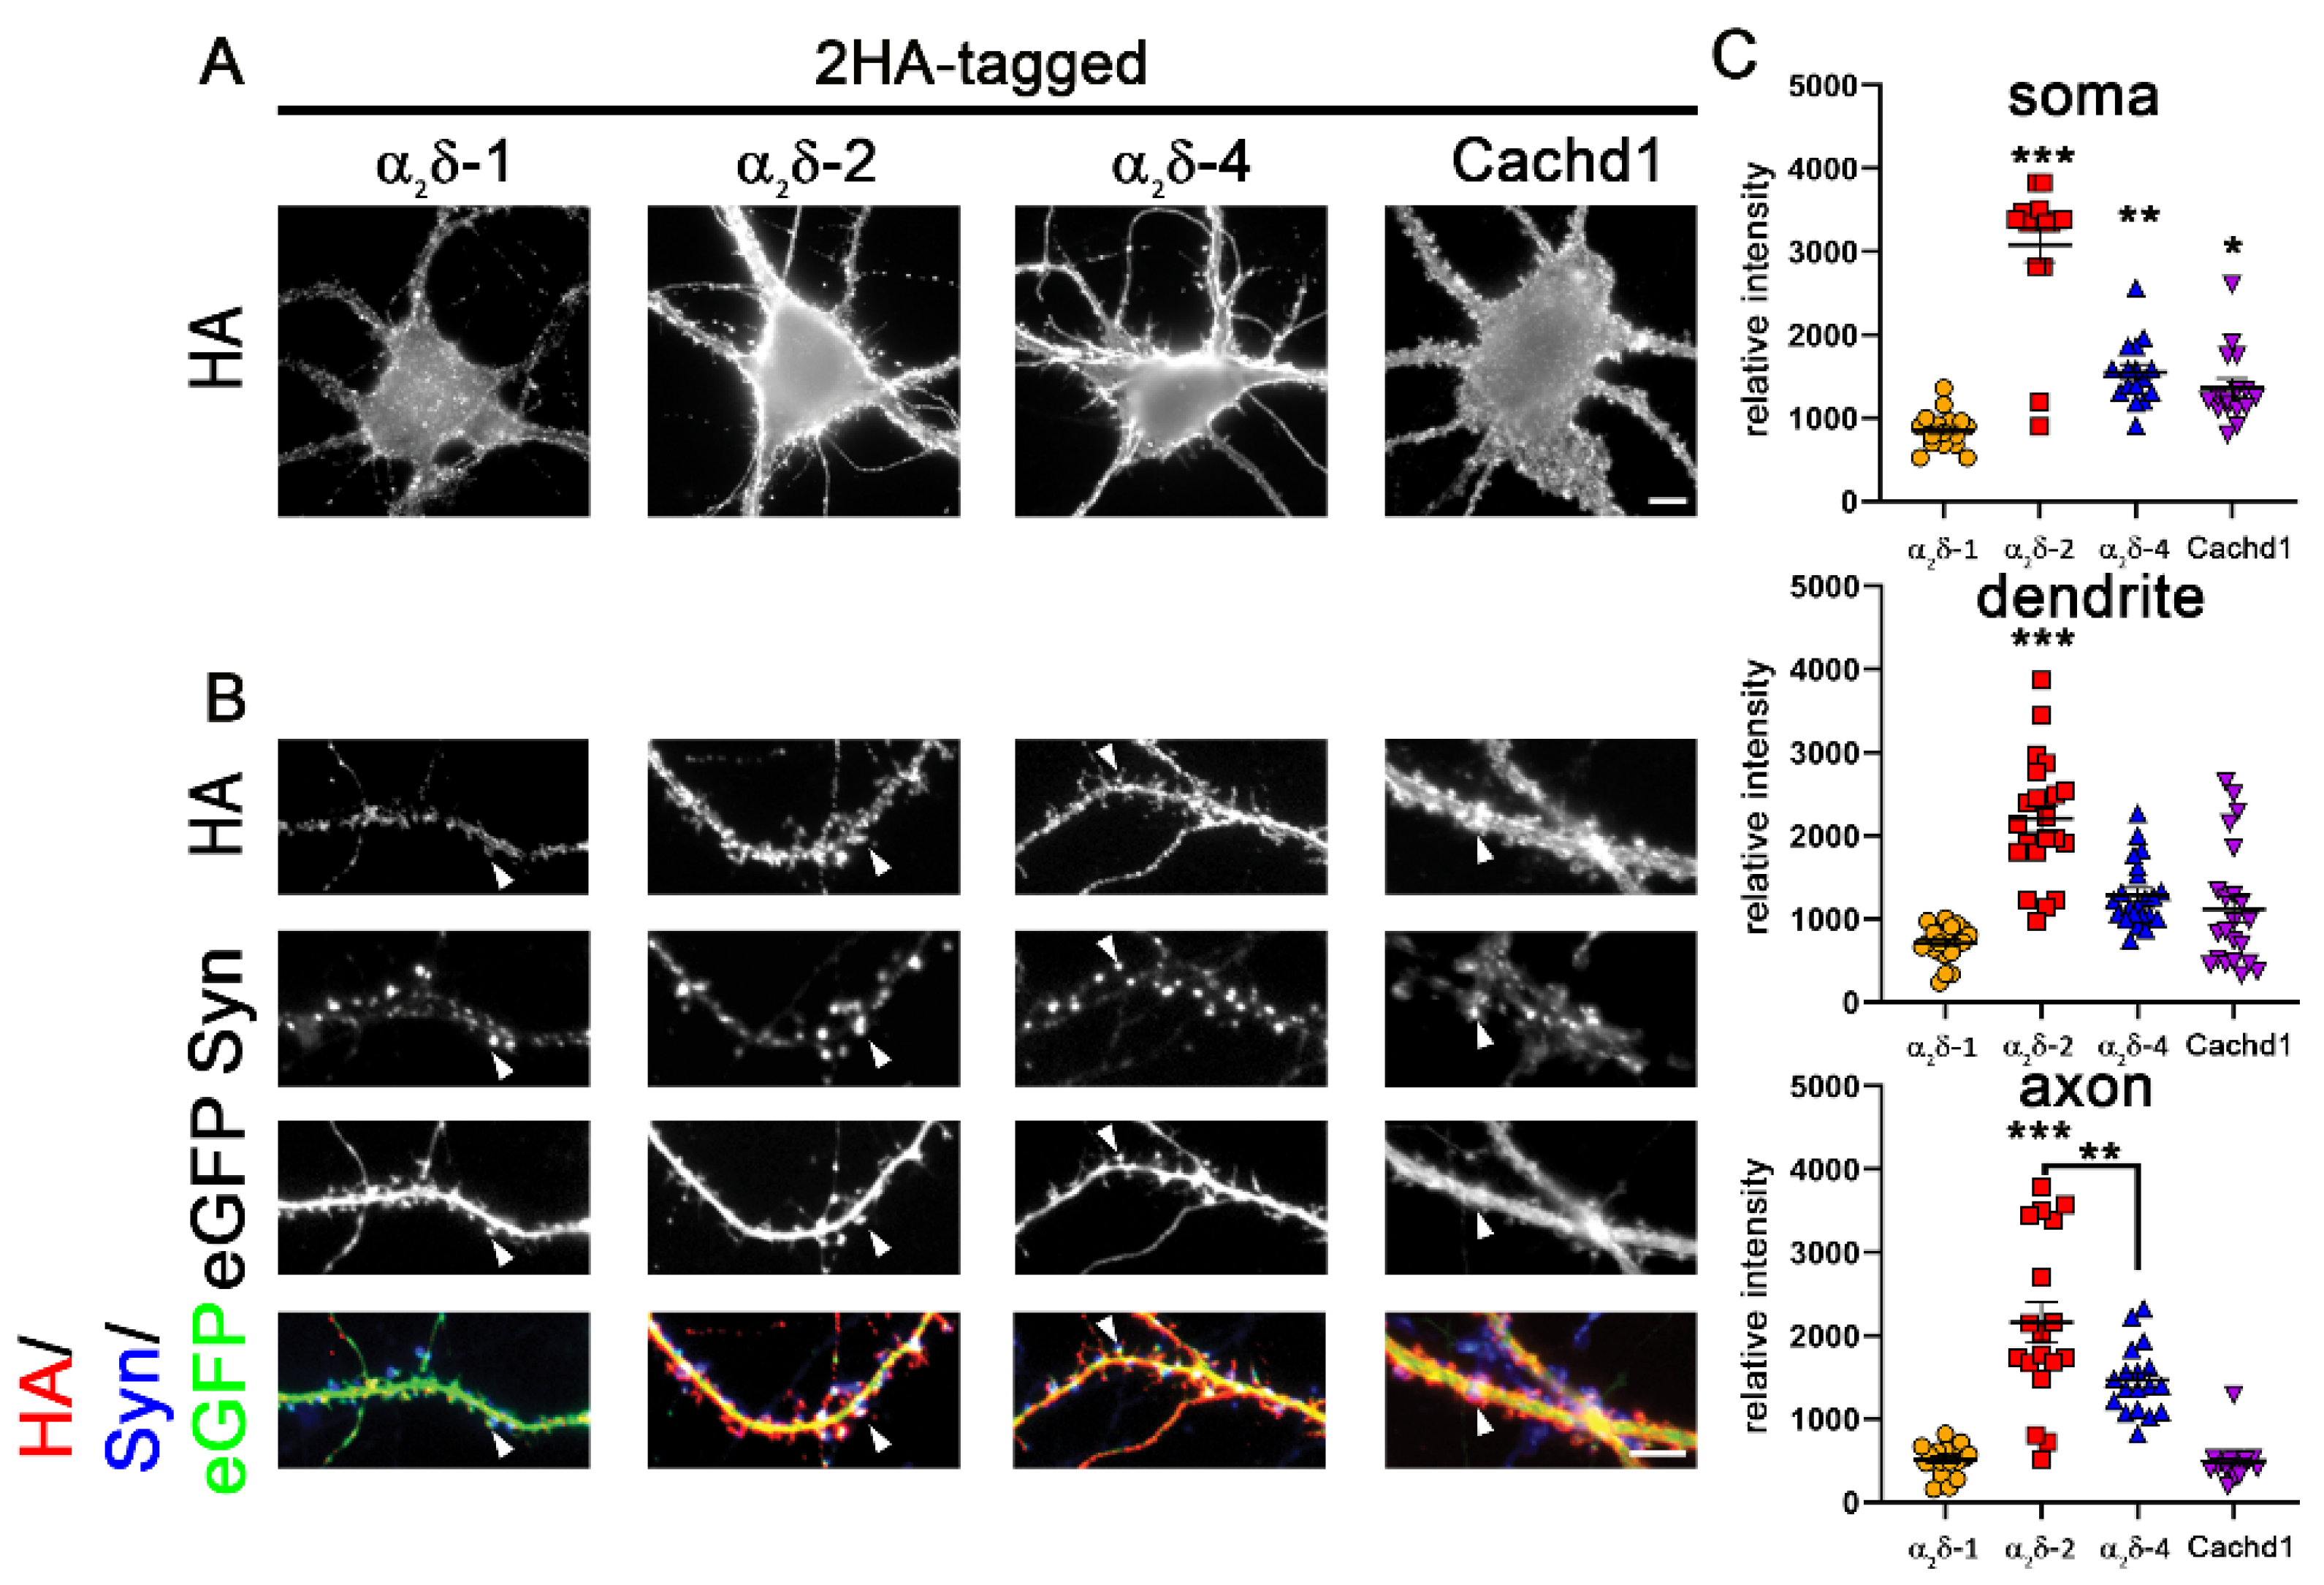
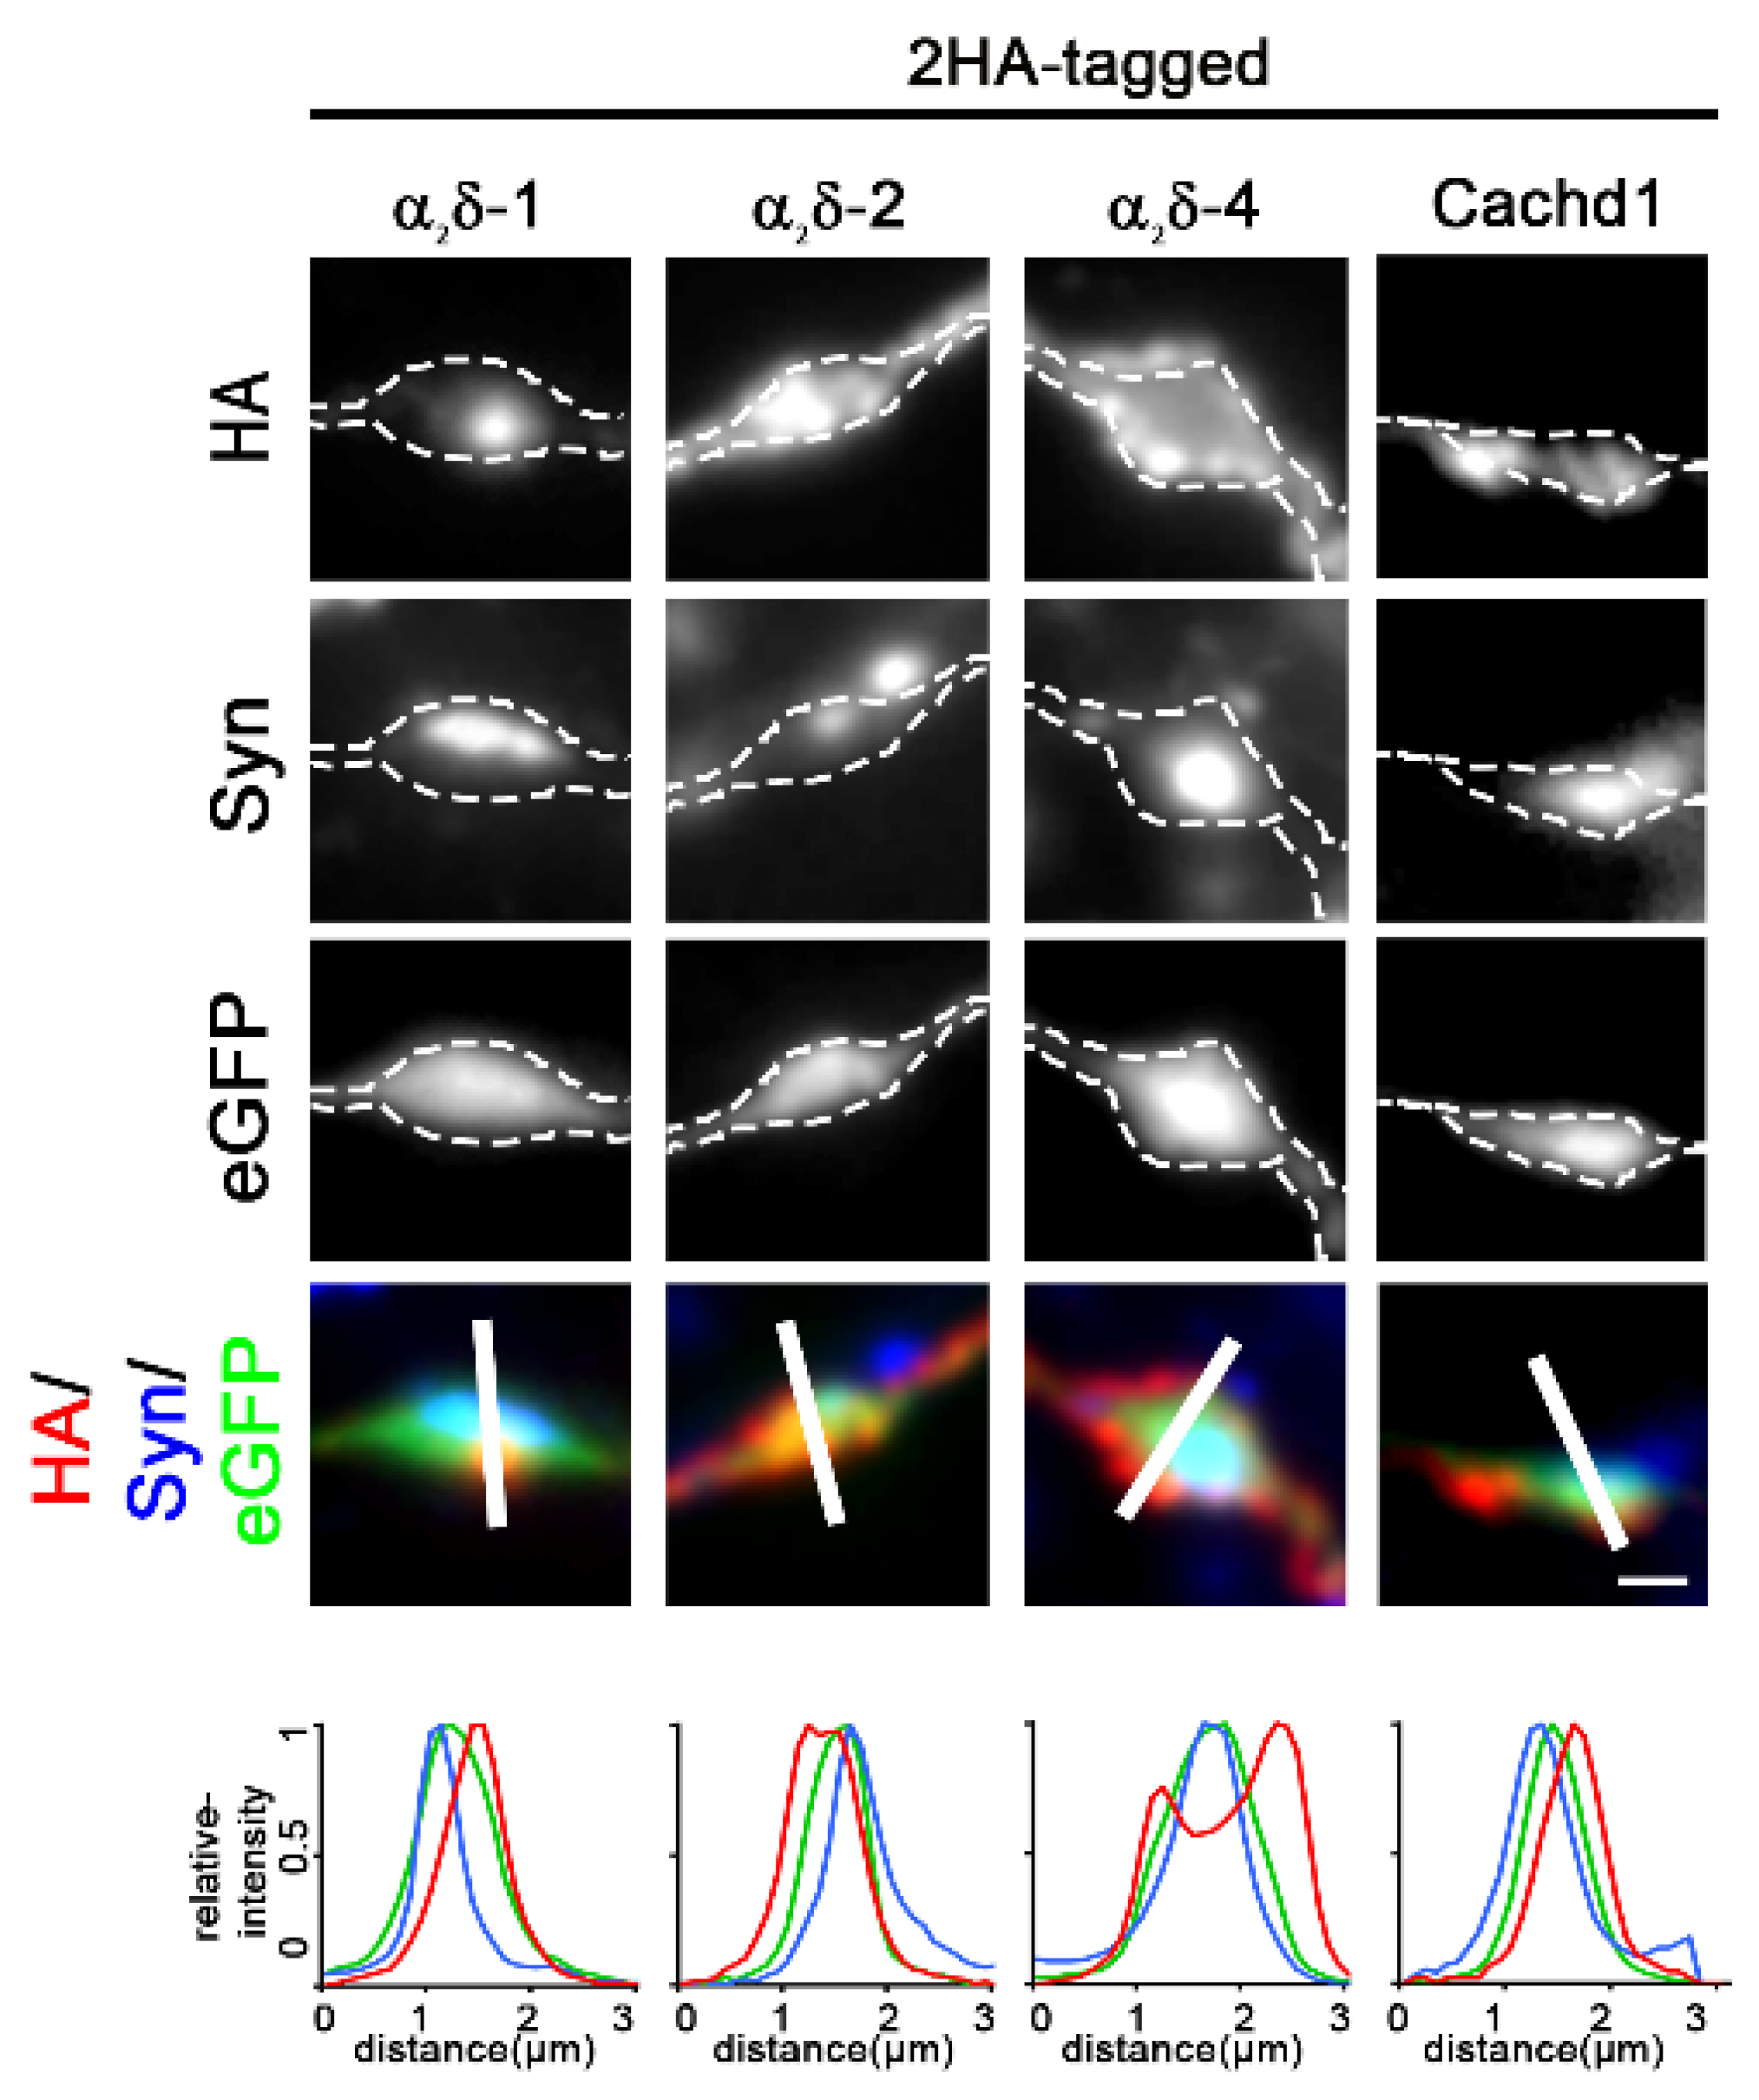
2.1. Epitope-Tagged α2δ-4 and Cachd1 Target to Presynaptic Terminals

The α2δ-like protein Cachd1 is strongly expressed in multiple brain areas including the hippocampus, cerebellum, and thalamus [22]. In contrast, CNS expression of α2δ-4 is very low in the hippocampus [15,20]. While the subcellular localization and synaptic roles of Cachd1 are largely unknown, the synaptic actions of α2δ-4 have been studied in photoreceptor cells using knockout mice [18]. Because neuronal α2δ proteins are critical regulators of synaptic transmission and synapse formation, in the present research, we studied whether Cachd1 and the retinal α2δ-4 subunit also are potential regulators of synaptic functions. As synaptic functions of proteins are normally associated with a synaptic localization, we first analyzed the subcellular distribution of Cachd1 and α2δ-4 by expressing HA-epitope-tagged proteins in primary cultured hippocampal neurons, as previously established [11,25,26,27]. To visualize the neuronal morphology, neurons were co-transfected with soluble eGFP [11,25,26,27]. Life cell labeling revealed that, similar to α2δ-1 and α2δ-2 isoforms [11,25], Cachd1 and α2δ-4 were strongly expressed on the surface of the cell soma (Figure 1A) and the dendrites including dendritic spines, opposite functional synapses which were identified by immunolabeling the presynaptic synapsin protein (Figure 1B, arrowheads). Quantification showed somato-dendritic expression levels of Cachd1 and α2δ-4 between the levels of α2δ-1 and α2δ-2, which showed the weakest and strongest surface expression, respectively, of all α2δ proteins (Figure 1C, soma and dendrite).
In general, the labelling intensities on the axonal surface were in line with the overall expression levels for all proteins (Figure 1C), although the axonal expression of Cachd1 was lower compared to those of soma and dendrites (Figure 1C, compare Cachd1 expression levels in soma, dendrite, and axon). Importantly, Cachd1 and α2δ-4 were also expressed in the presynaptic membrane (Figure 2). This is particularly evident in the upper panel of Figure 2, displaying HA labeling in the outlined presynaptic membrane (white dotted lines drawn around the eGFP signal). Remarkably, and like α2δ-2 [25], α2δ-4 showed a distinct peri-synaptic localization in the presynaptic membrane around the centrally located synapsin cluster (Figure 2, upper panel and linescan). Together, these data suggest that HA-tagged Cachd1 and α2δ-4 target presynaptic terminals upon expression in cultured hippocampal neurons, in line with previous suggestions of the CNS functions of both proteins [20,21,22].

2.2. α2δ-4 and Cachd1 Rescue Glutamatergic Synapse Formation

We previously established an α2δ triple knockout/knockdown model (TKO/KD) by combining classical double knockout (α2δ-3)/mutant (α2δ-2) mice with shRNA knockdown (α2δ-1) [25]. Presynaptic α2δ TKO/KD leads to a severe defect in glutamatergic synapse formation and synaptic transmission [25]. Importantly, this phenotype can be rescued by the individual expression of neuronal α2δ isoforms (α2δ-1, -2, and -3) [25]. Due to the severe synaptic defect, including the strong reduction of presynaptic synapsin and CaV2.1 expression, presynaptic calcium transients, and synaptic transmission (Figure 3 and Figure 4), TKO/KD neurons served as an ideal model for studying the synaptic functions and synaptogenic potential of homologously expressed α2δ proteins. Because Cachd1 and α2δ-4 can both target presynaptic terminals (Figure 2), we next tested whether their expression could also rescue glutamatergic synapse formation and function in α2δ TKO/KD neurons. Expression of α2δ-4 and Cachd1 in TKO/KD neurons significantly rescues presynaptic synapsin and CaV2.1 clustering to levels comparable to α2δ-1 (Figure 3A, representative images and line scans, Figure 3B,C). This suggests that α2δ-4 or Cachd1 can both rescue the severe TKO/KD phenotype by restoring the presynaptic expression of synaptic vesicle-associated proteins and calcium channels. This is in line with previous observations for α2δ-1, α2δ-2, and α2δ-3 isoforms [25].

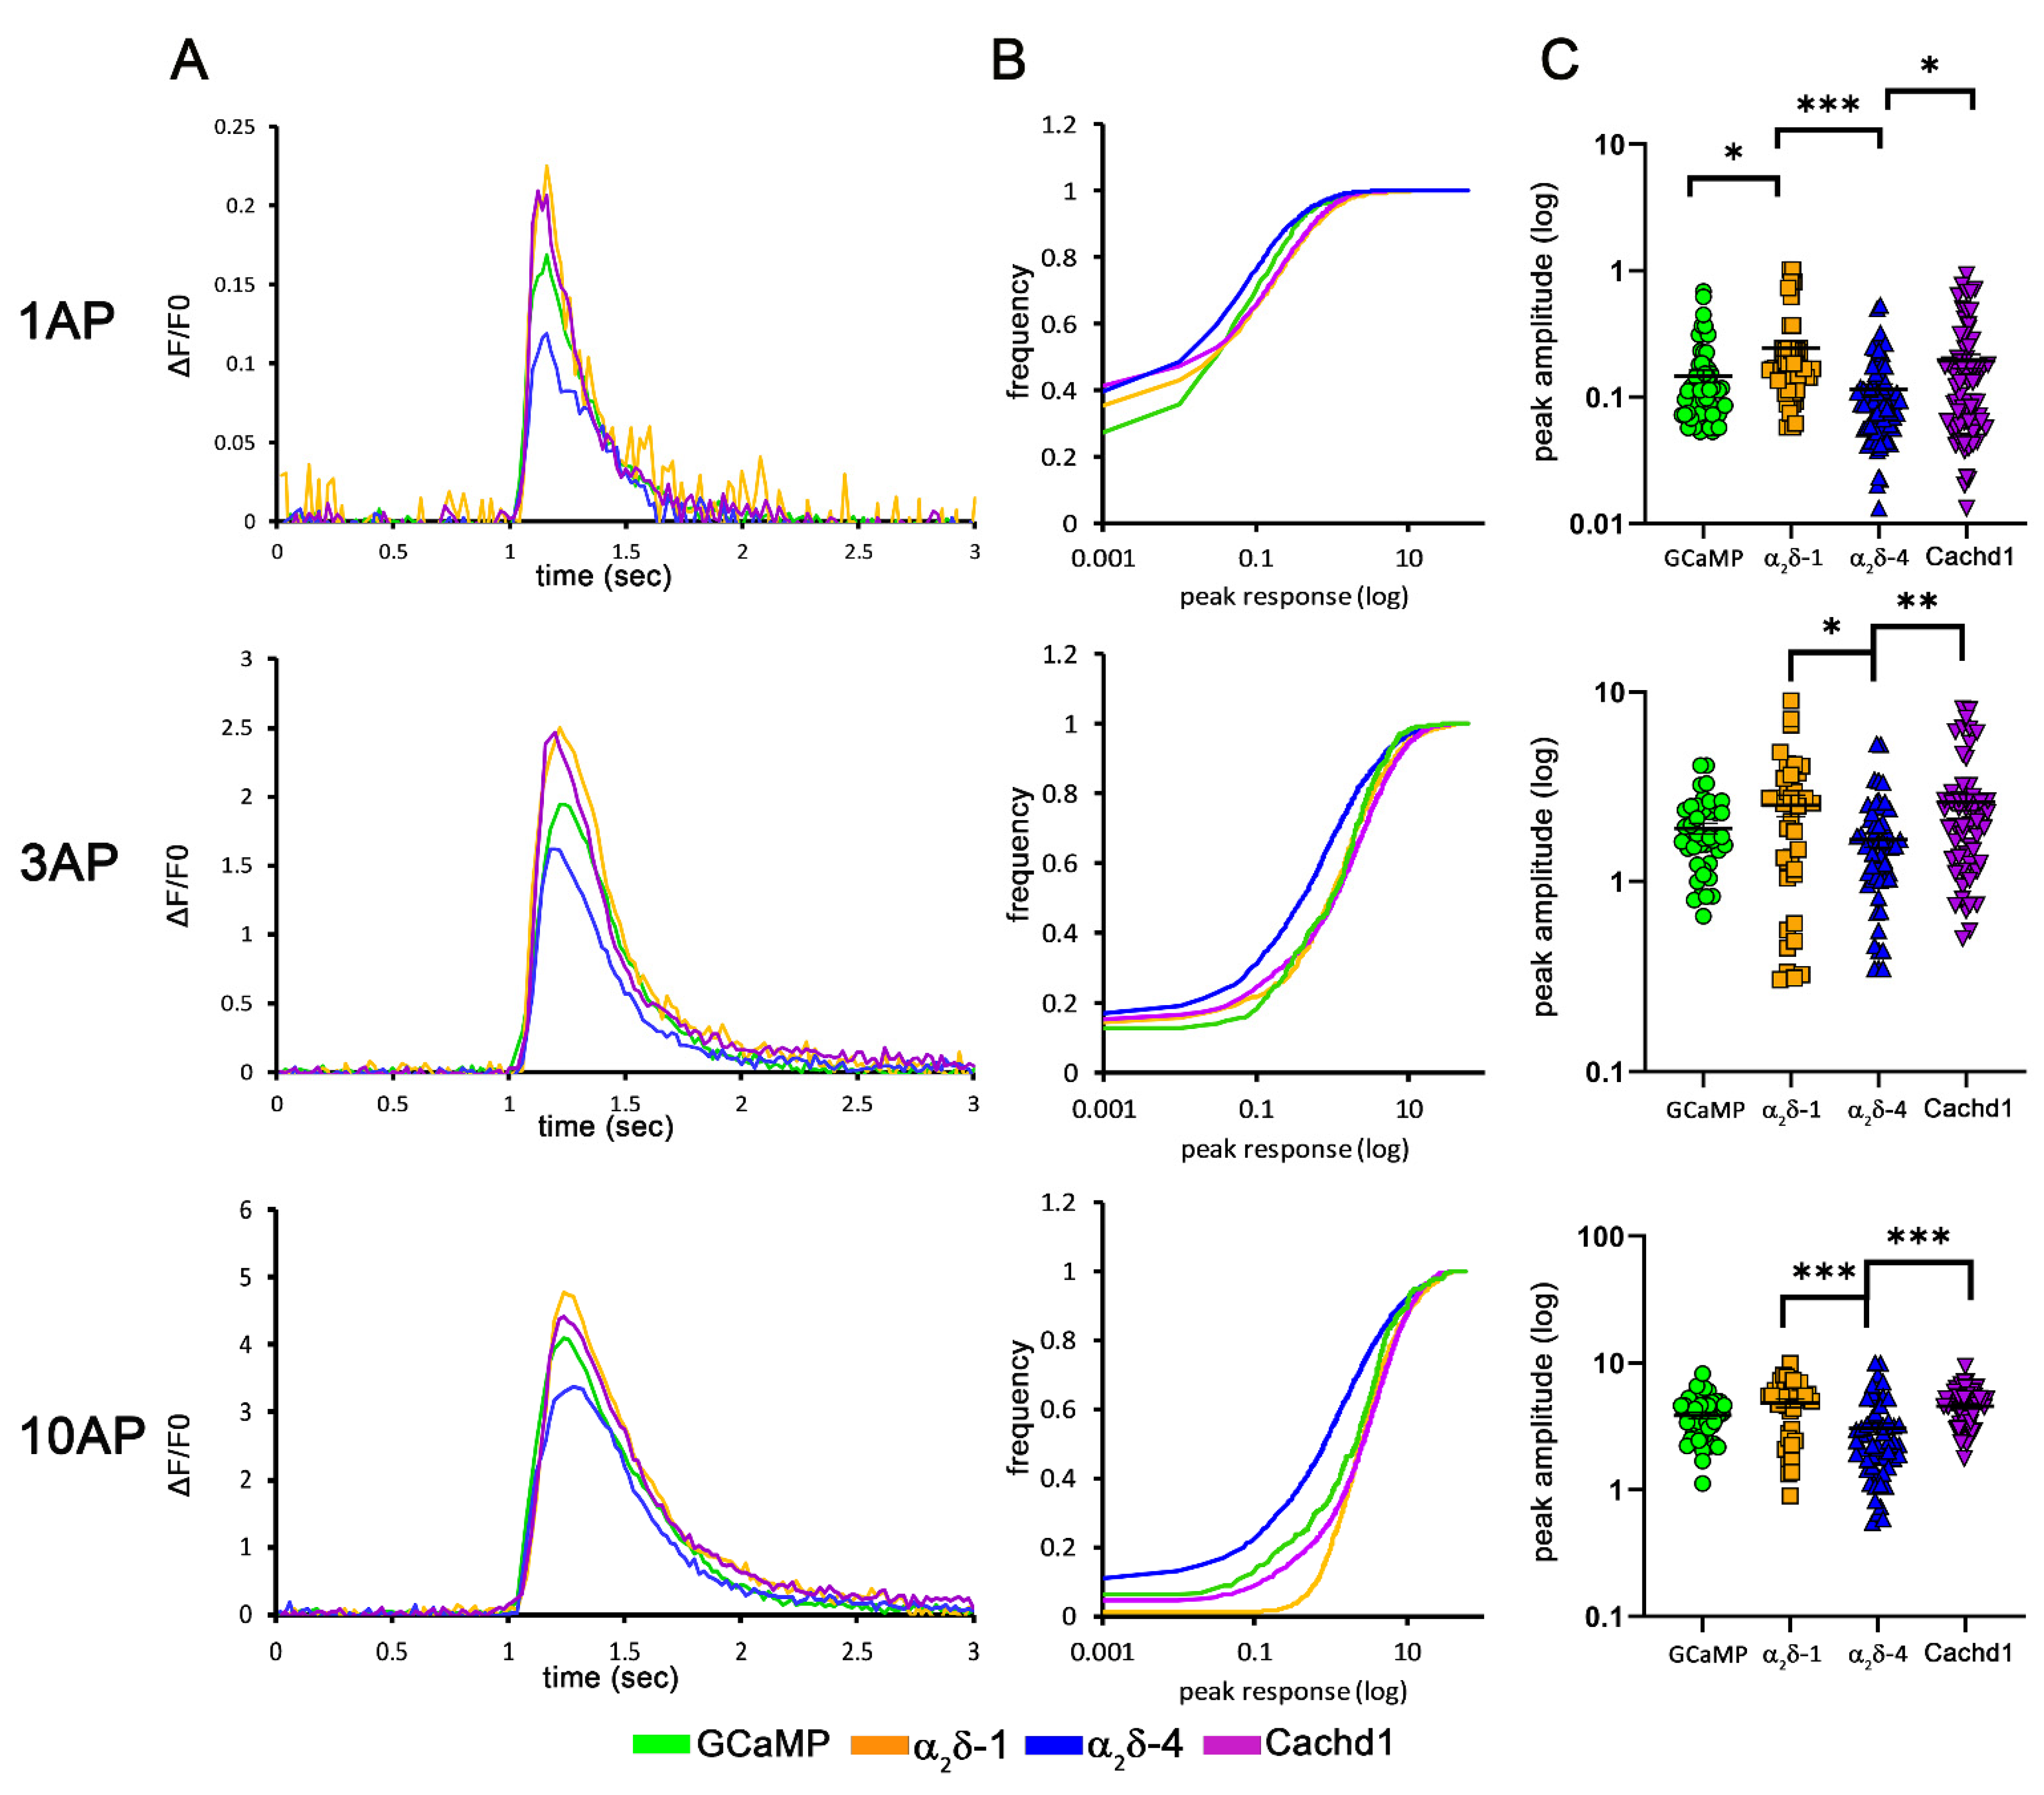
2.3. α2δ-4 and Cachd1 Restore Presynaptic Calcium Signaling in Triple Knockout Neurons

Restoring presynaptic differentiation in α2δ TKO/KD neurons by the expression of α2δ-4 and Cachd1 suggests a presynaptic rescue of the severe phenotype. Hence, we next analyzed whether this rescue effect was also reflected in other synaptic functions. To this end, we used calcium imaging with the genetically encoded and presynaptically targeted calcium sensor SynGCaMP6f [25,28] to test if synaptic calcium signaling could be completely or partially rescued by α2δ-4 and Cachd1. In line with previous results, a significant fraction of TKO/KD synapses failed to show calcium transients in response to stimulations with 1 action potential (AP), 3 APs, and 10 APs (Figure 4, black lines and symbols). This was particularly evident when plotting the cumulative frequency distribution of single synaptic responses (Figure 4B), which illustrated that 56, 37, and 34% of TKO/KD synapses showed no response to 1, 3, or 10 AP stimulations, respectively. In contrast, only 26% (1 AP), 12% (3 APs), and 5% (10 APs) of control synapses were non-responding (Figure 4, green lines and symbols). In line with previous observations, the expression of α2δ-1 rescued the peak amplitude of presynaptic calcium transients (Figure 4, orange lines). This was evident when analyzing the peak responses of all individual synapses (Figure 4B), as well as when plotting the means of synapses from all individual cells analyzed (Figure 4C). The expression of either α2δ-4 (Figure 4, blue lines) or Cachd1 (Figure 4, magenta lines) rescued presynaptic calcium transients to levels comparable to control (Figure 4, green lines) and α2δ-1 (Figure 4, orange lines), as evidenced by the similar means of all individual cells under all tested stimulation patterns (Figure 4C). Although not evident in the analysis of the means of all individual cells (Figure 4C), the peak amplitudes of presynaptic calcium transients of TKO/KD cells expressing α2δ-4 seemed to be slightly smaller compared to the rescue conditions with α2δ-1 and Cachd1 (Figure 4A, compare mean trances; Figure 4B, cumulative frequency distribution,). Furthermore, the fraction of non-responding synapses was significantly reduced (Chi-square test 1 AP: χ2 = 130.9, p < 0.0001; 3 AP: χ2 = 34.1, p < 0.0001; 10 AP: χ2 = 38.4, p < 0.0001) upon expression of Cachd1. For example, upon 1 AP stimulation, only 14% of synapses expressing Cachd1 were non-responding, while in synapses expressing α2δ-1 and α2δ-4, the non-responding fraction accounted for 37% and 45%, respectively (Figure 4B). A similar albeit not significant trend was seen upon stimulation with 3 and 10 APs. Taken together, these results demonstrate that all α2δ subunits and α2δ-like proteins could rescue presynaptic protein expression and calcium signaling in TKO/KD neurons, suggesting that they share redundant functions in synapse formation and differentiation. Moreover, the subtle differences between Cachd1 and α2δ-4 in terms of rescuing presynaptic calcium transients may be related to differences in their abilities to interact with presynaptic calcium channels.

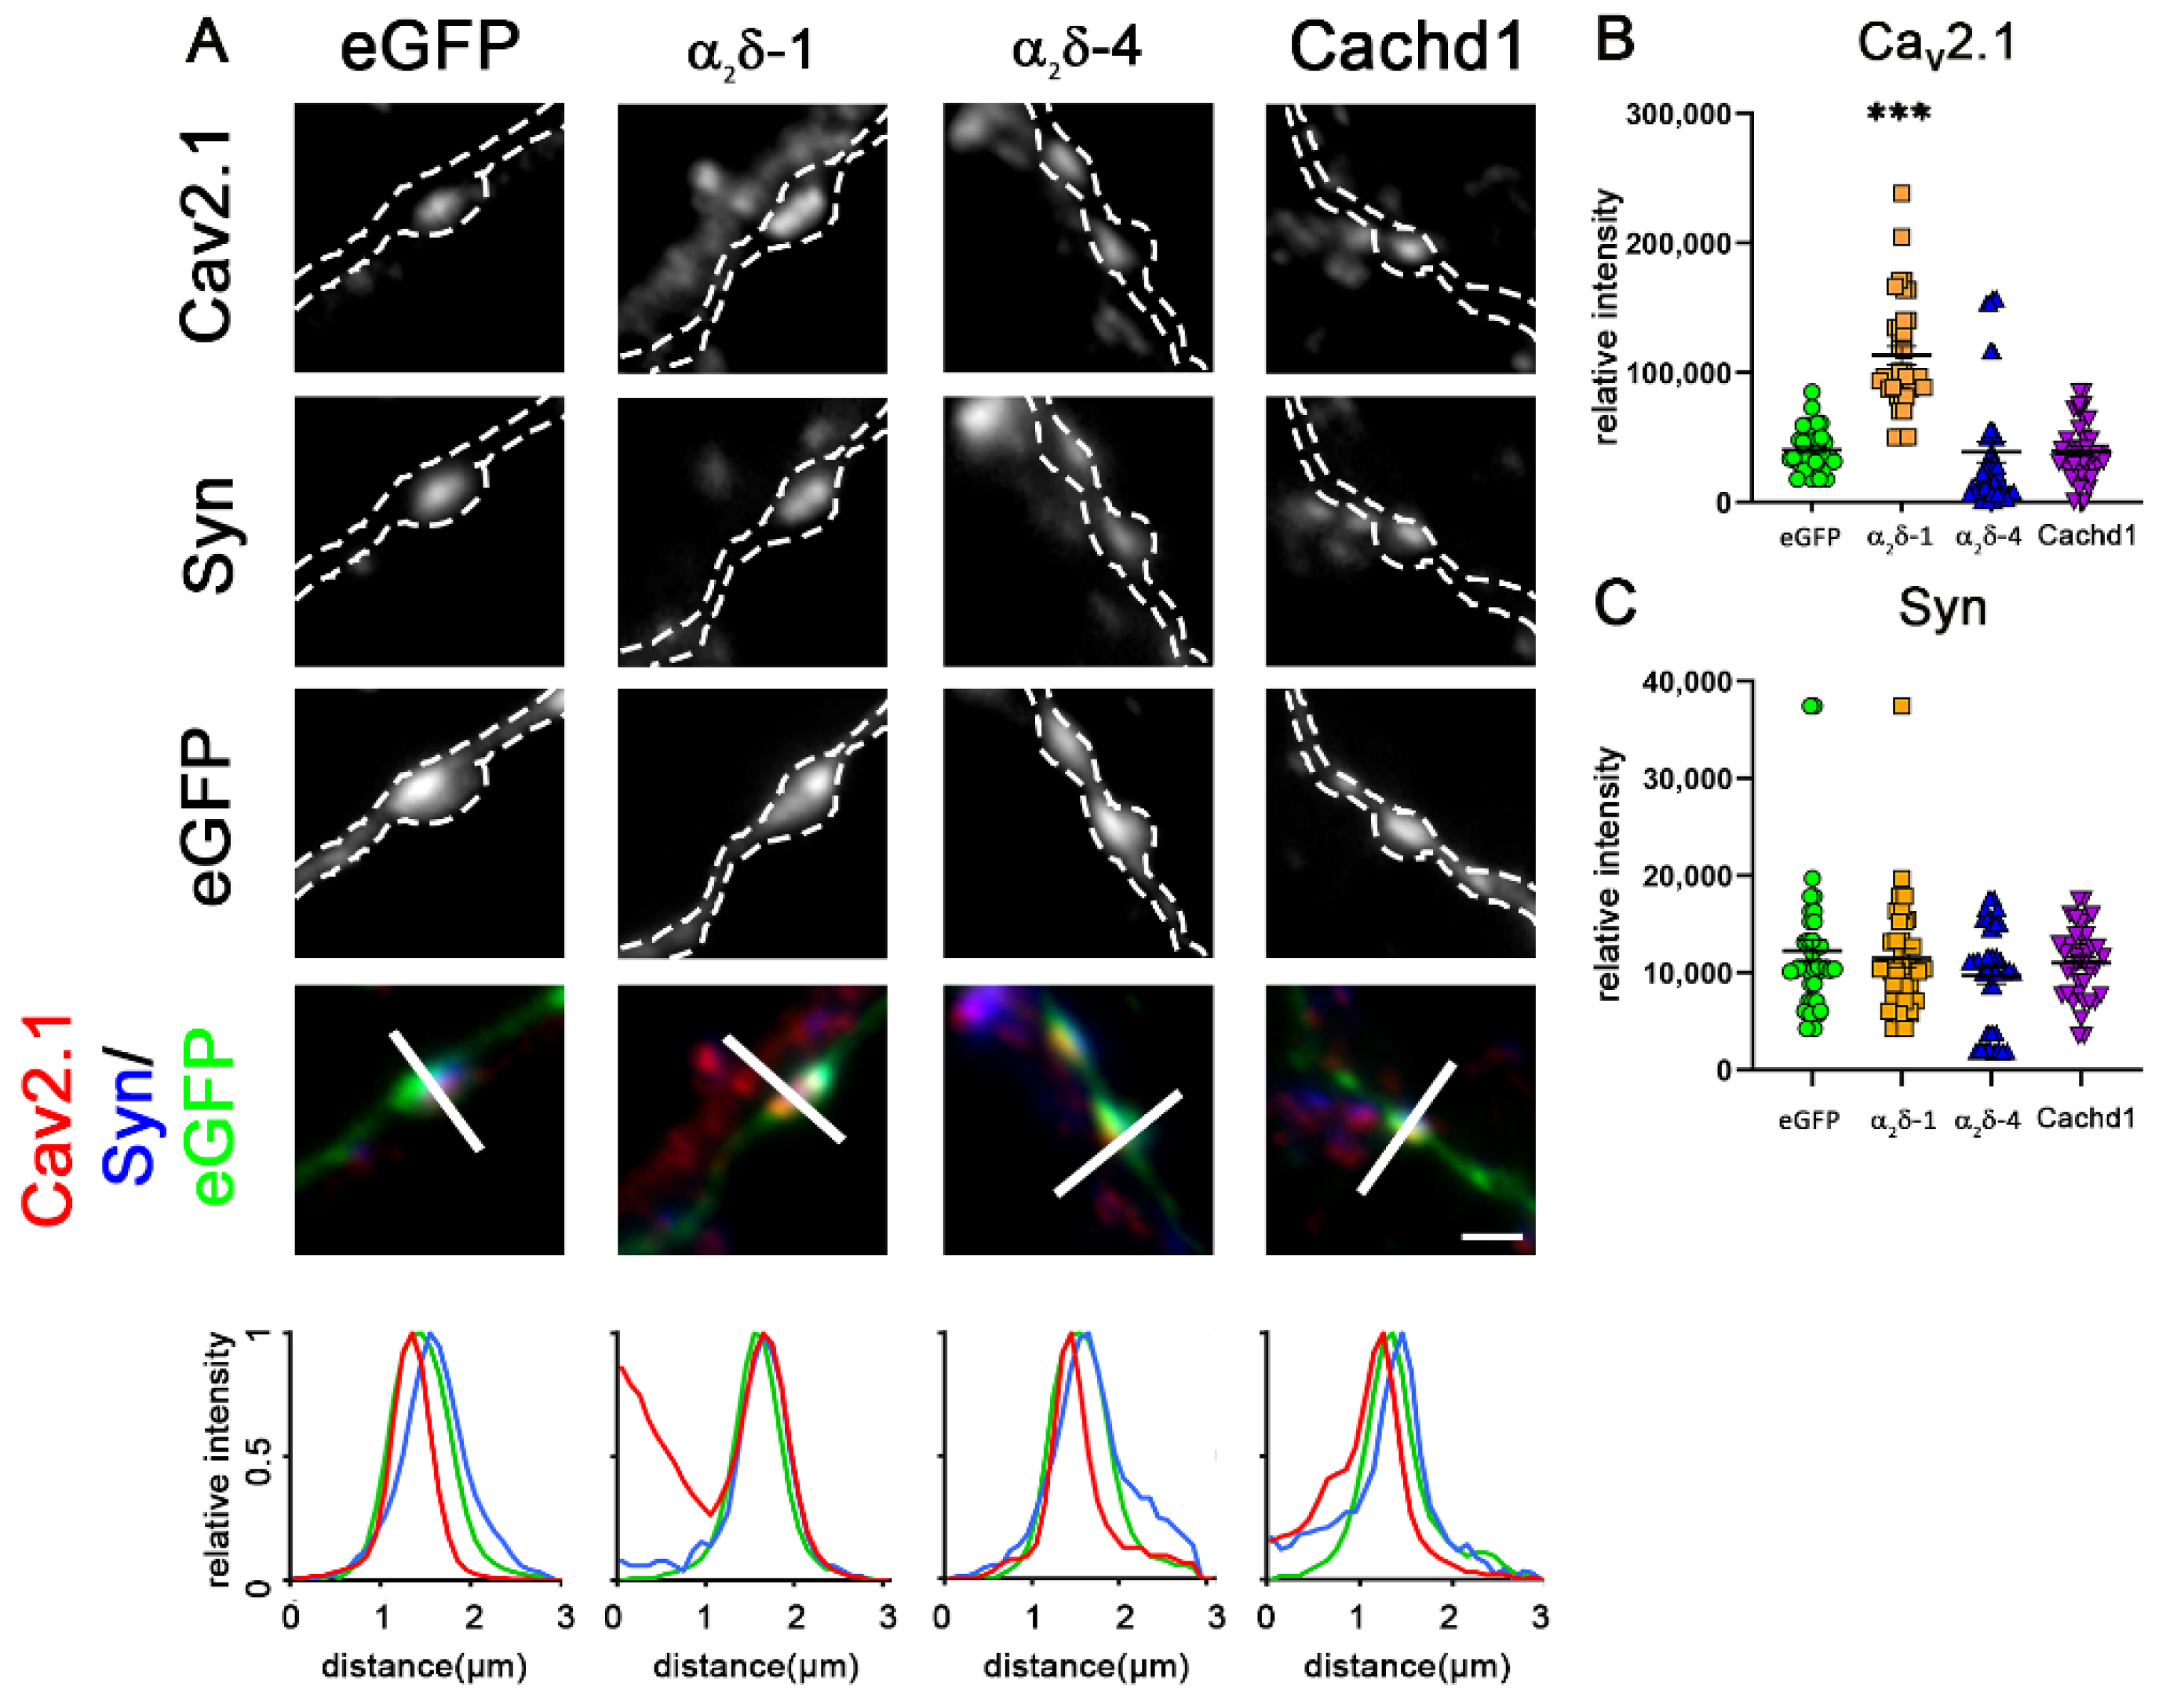
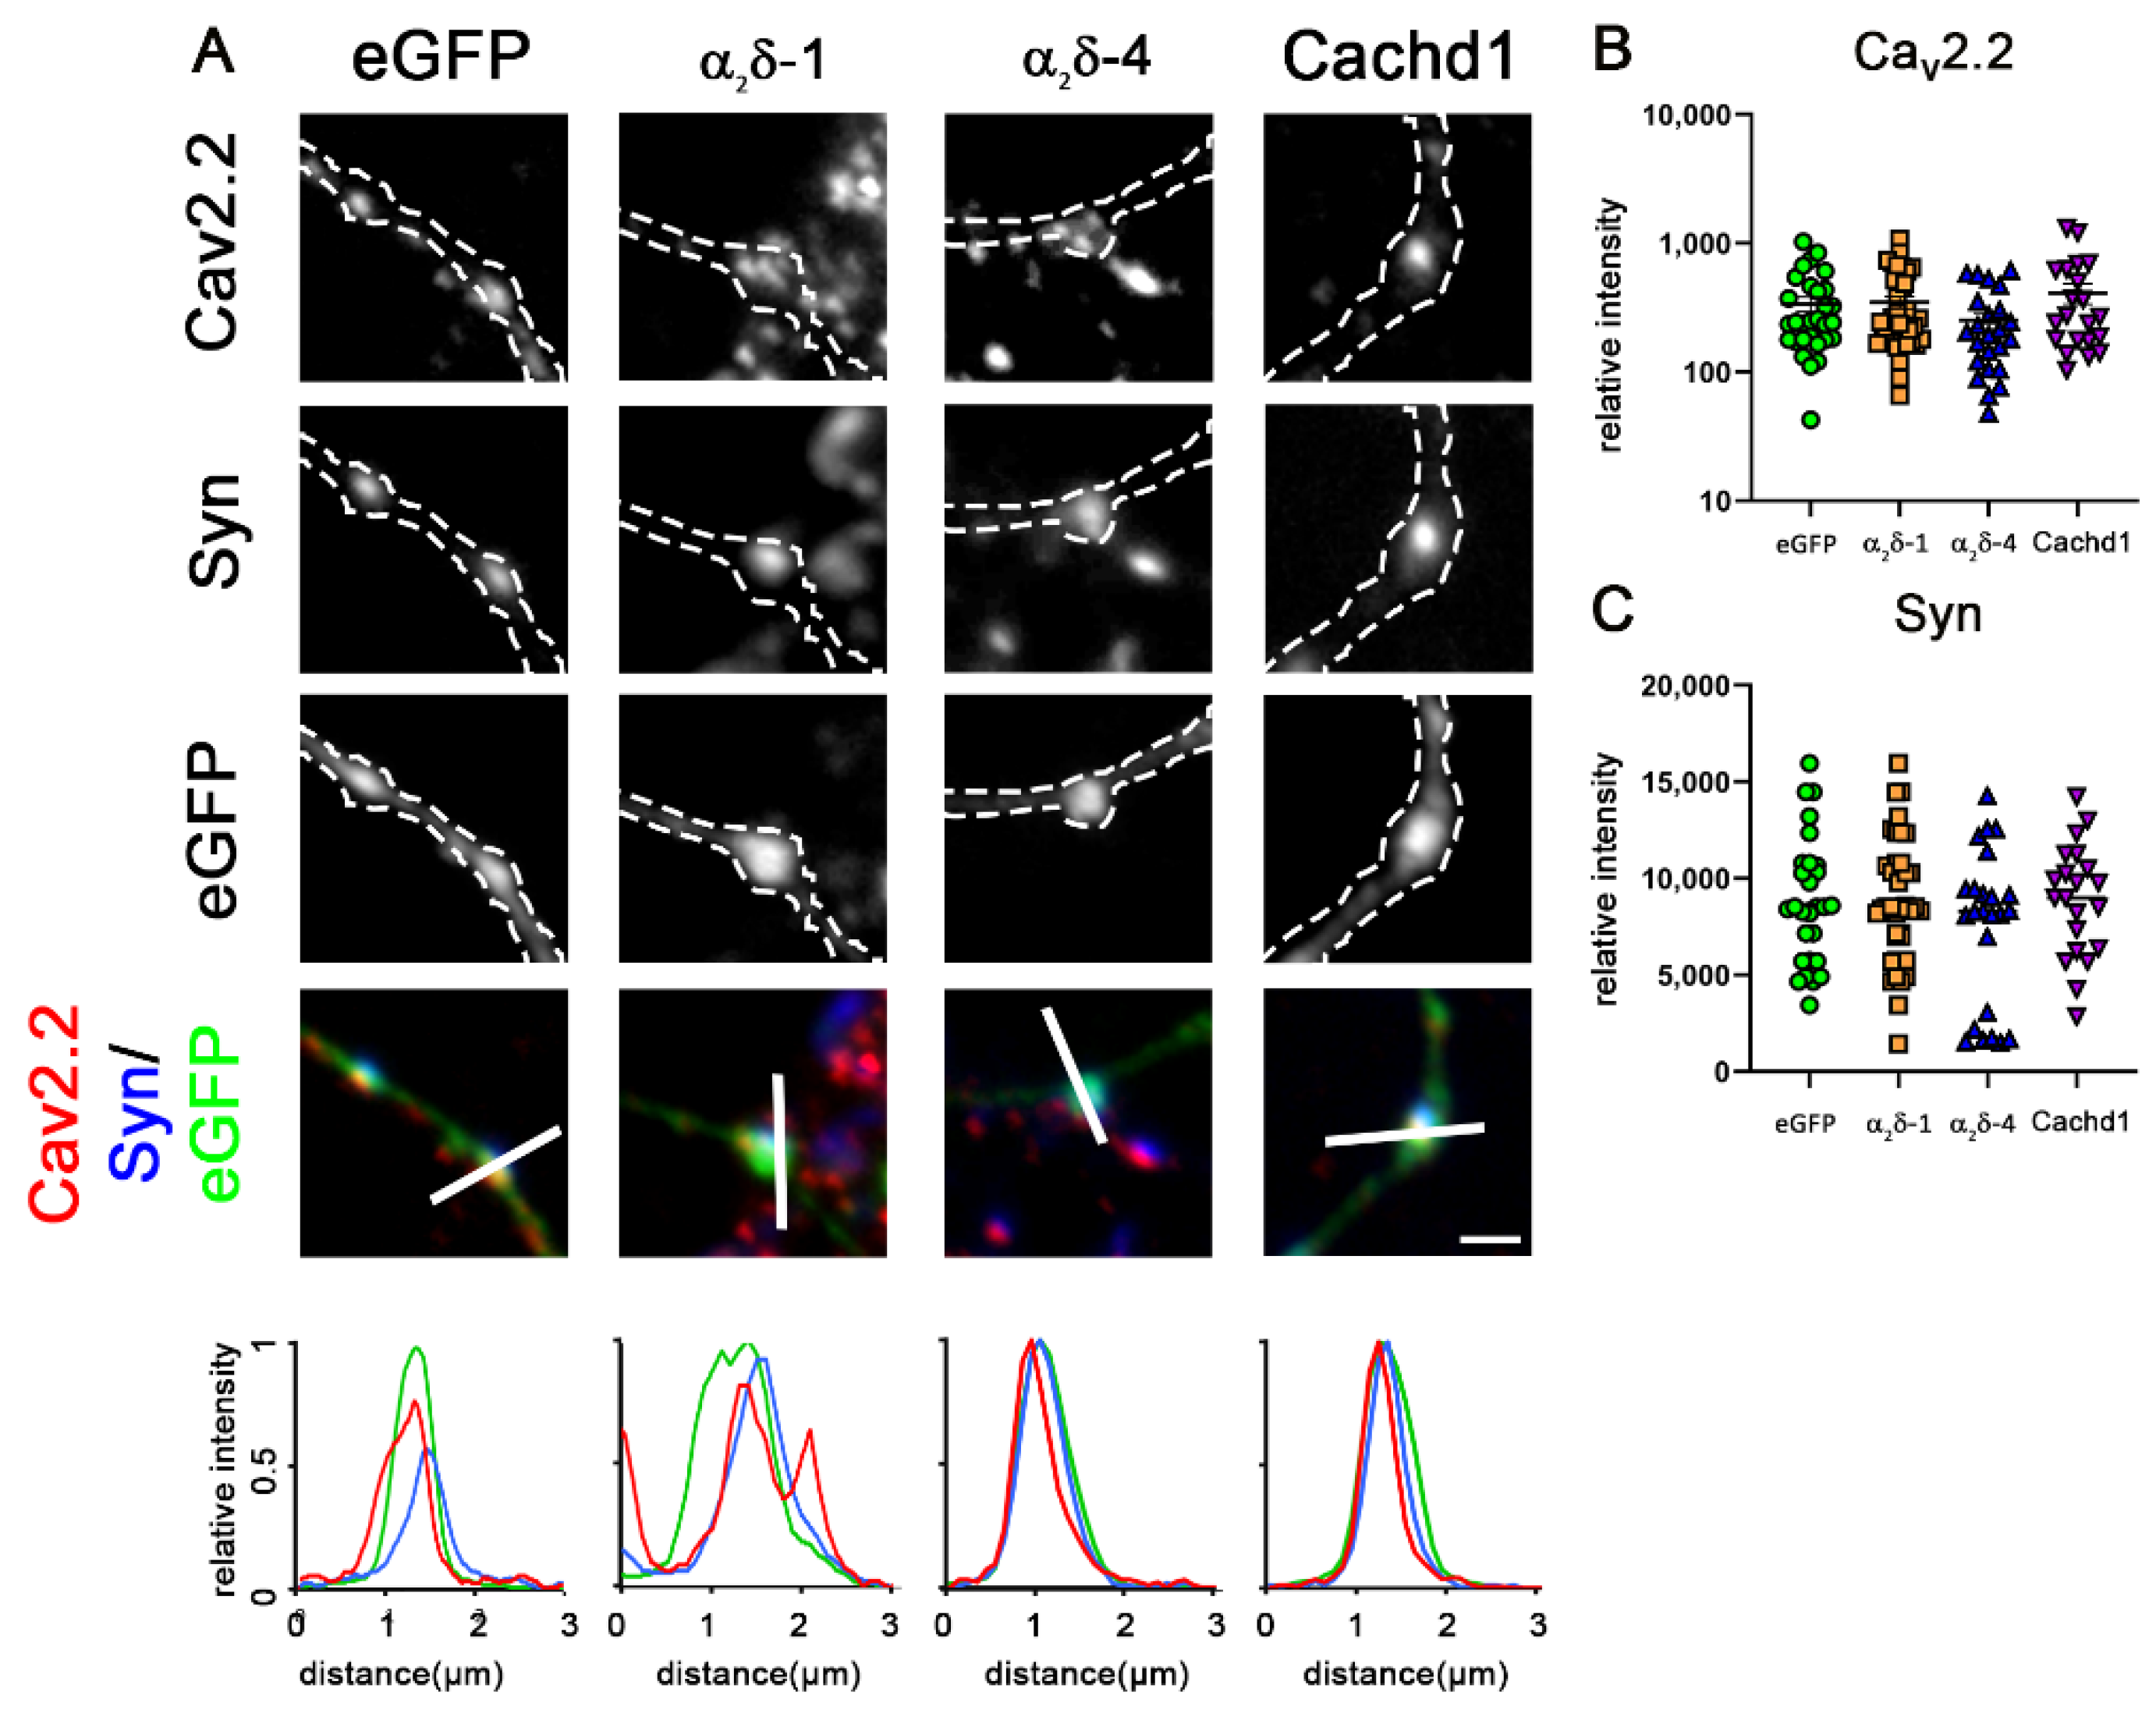
2.4. α2δ-4 and Cachd1 Do Not Increase Presynaptic CaV2.1 Abundance

The above data suggest that expression of individual α2δ subunits and Cachd1 is sufficient for the proper differentiation and function of glutamatergic synapses. Nevertheless, the differential effects on presynaptic calcium transients may suggest a subtle functional diversity. Therefore, we next studied the effect of ectopic expression of α2δ subunits and Cachd1 on presynaptic calcium channel abundance in wildtype hippocampal neurons. Overexpression of α2δ-1 induced a more than two-fold increase in the intensity of presynaptic endogenous CaV2.1 labelling compared to eGFP-only expressing control neurons (Figure 5A,B, eGFP and α2δ-1). This was in line with α2δ-1-mediated increases in CaV2.1 currents upon co-expression [29], and is further supported by the previous observation that the expression of α2δ-1 in hippocampal neurons increased the synaptic labelling intensity of CaV2.1 channels [30]. Contrary to α2δ-1, the overexpression of α2δ-4 or Cachd1 did not increase presynaptic clustering of endogenous CaV2.1 (Figure 5A,B). The α2δ-1-induced increase of presynaptic CaV2.1 was not caused by an overall effect of α2δ-1 on presynaptic bouton size, as no concomitant increase of synapsin labelling could be observed (Figure 5C). These results are consistent with previous observations showing the predominant interaction of α2δ-4 with CaV1.4 [17] instead of CaV2.1, and that Cachd1 had no effects on currents of heterologously expressed CaV2.1 [24]. Because Cachd1 was previously shown to increase CaV2.2 currents and cell surface expression upon heterologous co-expression [24], we next analyzed the synaptic expression levels of endogenous CaV2.2. In comparison to control (eGFP-only) neurons, we observed neither significant increases in presynaptic CaV2.2 nor synapsin abundance upon overexpression of α2δ-1, α2δ-4, and Cachd1 (Figure 6). Together, this shows that α2δ proteins differentially modulate the abundance of presynaptic calcium channels.

2.5. α2δ-4 and Cachd1 Do Not Affect Glutamatergic Synapse Composition

Because α2δ proteins differentially modulate the abundance of presynaptic calcium channels, and because specific α2δ isoforms and splice variants have previously been shown to strongly affect postsynaptic receptor abundance [10,31], we next sought to determine whether α2δ-1, α2δ-4, and Cachd1 would differentially modulate the molecular composition of glutamatergic synapses. Since the overexpression of a splice variant of α2δ-2 in excitatory glutamatergic neurons induces aberrant axonal wiring associated with a striking induction of mismatched synapses by recruiting exclusively postsynaptic GABAA-receptors subunits opposite glutamatergic presynaptic nerve terminals [11], we investigated the abundance of both glutamatergic and GABAergic proteins in glutamatergic synapses. To this end, we quantified the expression levels of pre- and postsynaptic proteins of excitatory glutamatergic (vGlut1, GluR1) and inhibitory GABAergic (vGAT, GABAA-R, Gephyrin) synapses upon overexpression of α2δ-1, α2δ-2-ΔE23, α2δ-4, and Cachd1, compared to eGFP-only as control. As previously demonstrated [11], the overexpression of an alternative splice isoform of α2δ-2 that lacks exon 23 (α2δ-2-ΔE23), and thereby forms an α-helix, induces the formation of mismatched synapses, identified by postsynaptic GABAA receptor clusters opposite vGlut1 positive terminals (Figure 7A,C, α2δ-2). However, neither overexpression of α2δ-1 and α2δ-4 nor of Cachd1 resulted in changes in the molecular composition of glutamatergic synapses (Figure 7A–F). As was expected for glutamatergic synapses, the quantification of labelling intensities confirmed a strong expression of presynaptic vGlut1 (Figure 7B) and postsynaptic AMPA-receptors (GluR1, Figure 7E) in synapses overexpressing α2δ-1, α2δ-4, and Cachd1. In contrast, and except for α2δ-2 (see above), components of GABAergic synapses were not expressed (vGAT, GABAA-R, gephyrin in Figure 7C,D,F), as was expected due to the presence of either exon 23 or a corresponding structural feature (extra loop). Moreover, in contrast to α2δ-3 [11], presynaptic bouton sizes were not affected by overexpression of α2δ-1, α2δ-2, α2δ-4, and Cachd1 (Figure 7G).

2.6. Differential Effects on Presynaptic Calcium Transients

So far, our experiments have shown that α2δ-1, α2δ-4, and Cachd1 differentially affect CaV2.1 channel density but have no effect on the molecular composition of glutamatergic synapses. Nevertheless, rescue experiments in α2δ TKO/KD neurons revealed subtle differences in the peak amplitudes of presynaptic calcium transients (Figure 4), even between conditions (α2δ-4 vs. Cachd1) showing similar effects on presynaptic calcium channel density. Hence, α2δ-1, α2δ-4, and Cachd1 may differentially modulate the function of presynaptic calcium channels beyond an exclusive effect on synaptic channel density. To gain insights into isoform differences in synapse-specific functions, we next analyzed the presynaptic calcium signals in wildtype neurons overexpressing the individual proteins. In this experimental setting, the overexpressed proteins compete with endogenously expressed α2δ subunits (α2δ-1 to -3) and Cachd1. We observed that α2δ-1, in contrast to a previous report [30], and Cachd1 overexpression led to a significant increase in the peak calcium amplitudes compared to control (1 AP) and α2δ-4 (1, 3, and 10 APs; Figure 8A). Overexpression of α2δ-4, however, resulted in the opposite effect, reducing calcium transients in response to all stimulation patterns (Figure 8A) in comparison to α2δ-1 and Cachd1 expressing neurons. These differences were noticeable in the mean traces (Figure 8A; ΔF/F0) and in the frequency distribution histogram (Figure 8B; left-shift of blue α2δ-4 curve along the X-axis), as well as in the means of all individual cells analyzed (Figure 8C). Taken together, our analysis of presynaptic calcium transients revealed differential effects of neurons over-expressing α2δ-1 and Cachd1 compared to α2δ-4. The observed effects are in line with the rescue potential of the severe synaptic phenotype in α2δ TKO/KD neurons (Figure 4). However, the effect on calcium transients cannot be fully explained by the modulation of the abundance of presynaptic CaV2.1 and CaV2.2 channels (Figure 5 and Figure 6), even though smaller transients in α2δ-4 expressing neurons match the slight, although not significant, tendency to reduce presynaptic calcium channel expression.

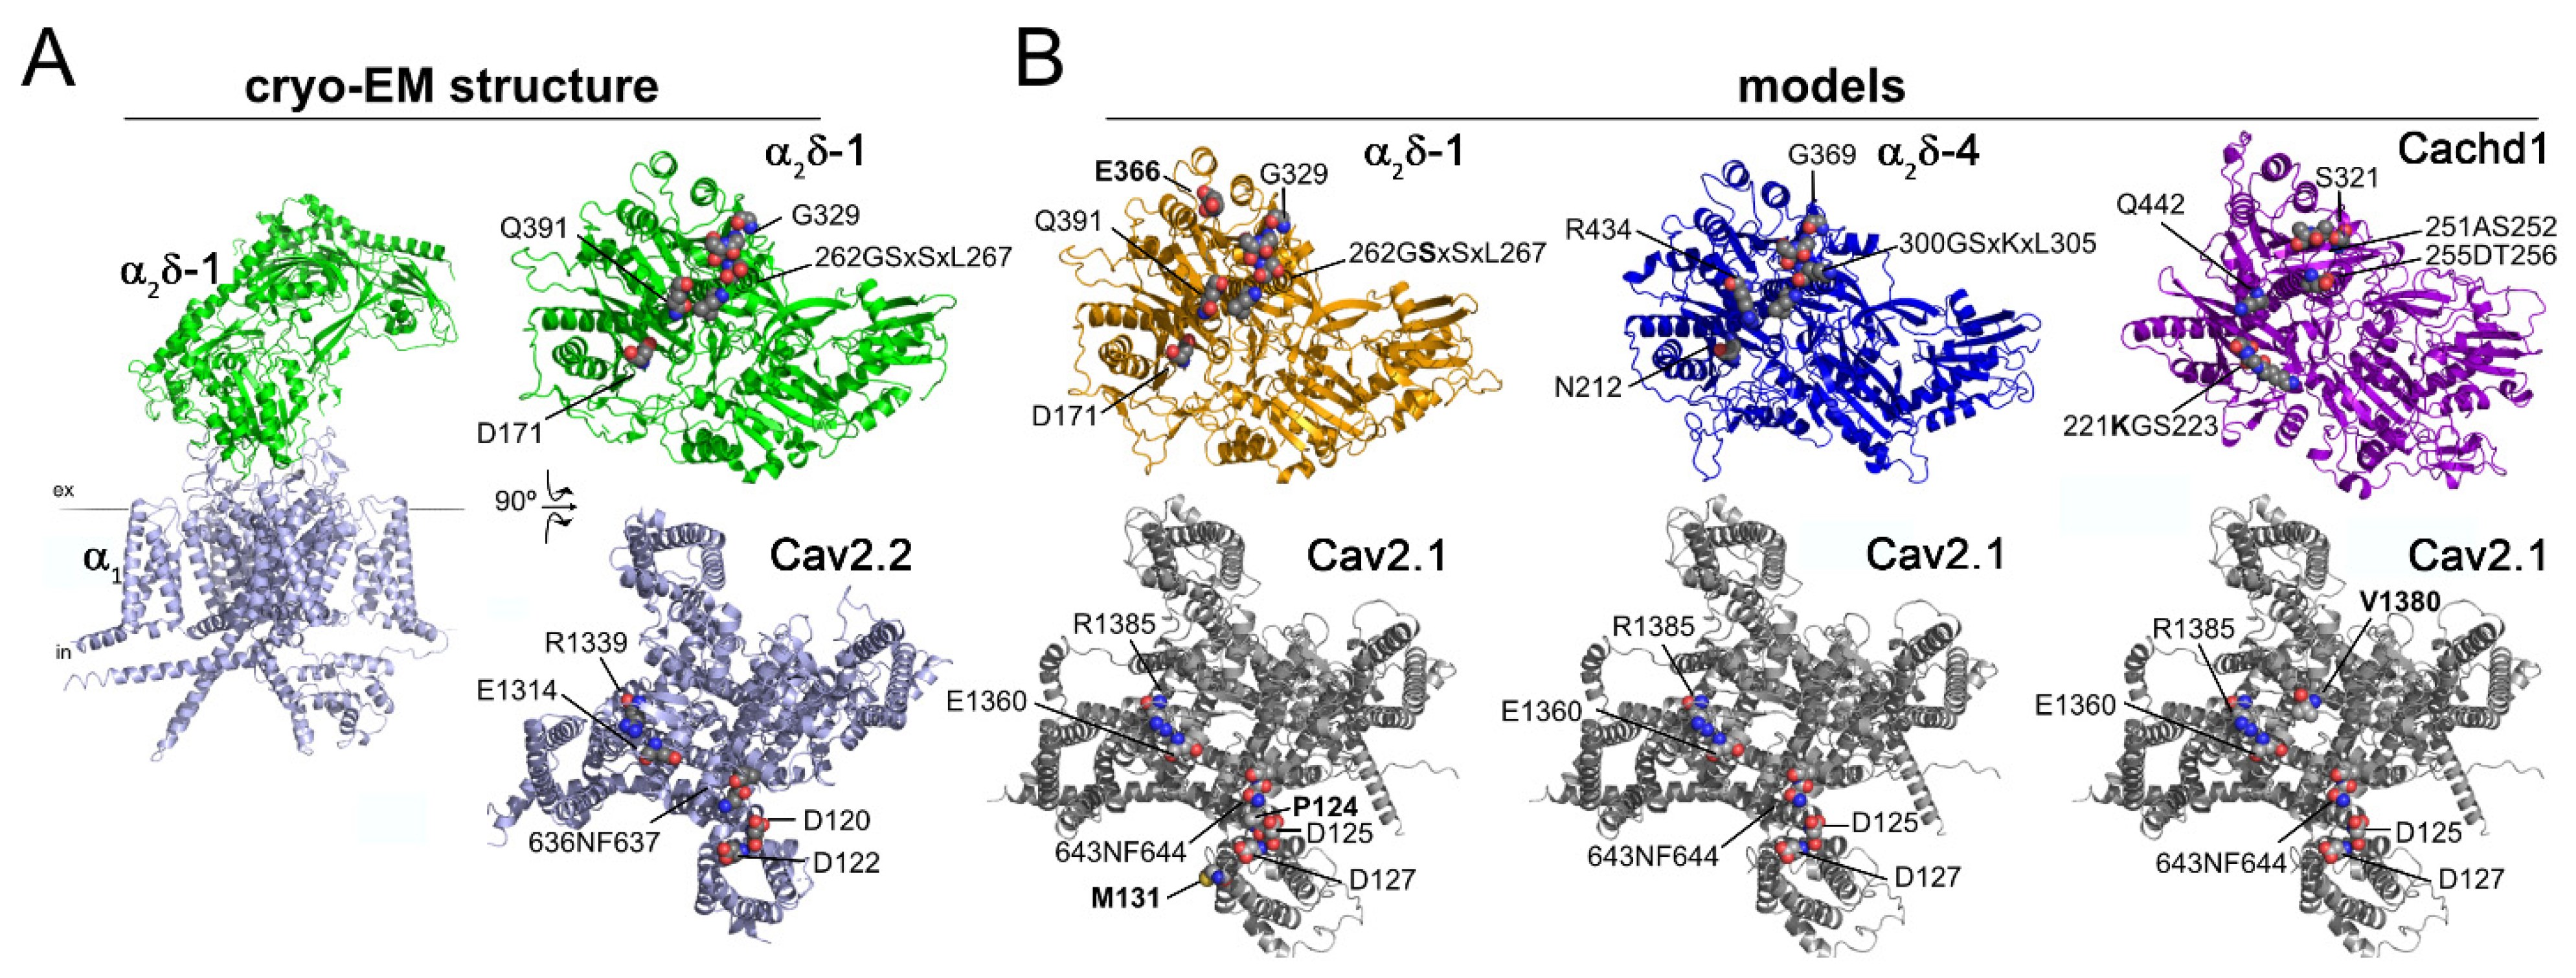
2.7. Structural Determinants for Protein–Protein Interactions of α2δ Subunits and Cachd1 with Pore-Forming α1 Subunits

Our experiments have shown, on the one hand, that α2δ-1, α2δ-4, and Cachd1 can all rescue the severe synaptic defect in α2δ TKO/KD neurons, and on the other hand, that they differentially modulate presynaptic calcium channel abundance and calcium transients. Some of the effects on presynaptic calcium transients may be related to the effect on regulating channel density (e.g., α2δ-1). However, the positive (Cachd1) and negative (α2δ-4) effects on presynaptic calcium transients cannot be consistently explained by the regulation of the density of the most abundant presynaptic calcium channels CaV2.1 and CaV2.2. Hence, α2δ-4 and Cachd1 may preferentially associate with other pore-forming subunits or mediate a negative effect by competing with endogenous α2δ subunit partners.
To better understand the structural features that might account for differences in the functionality between distinct α2δ isoforms and Cachd1, we performed structural homology modelling between the pore-forming CaV2.1 α1 subunit and α2δ-1, α2δ-4, and Cachd1. Using the previously published cryo-EM structure of human CaV2.2 complexed with α2δ-1 as a reference (Figure 9A, [32]) we modelled the interaction between the predicted AlphaFold structures of CaV2.1 with α2δ-1, α2δ-4, and Cachd1 (Figure 9B). Amino acid residues previously identified in the CaV2.2 complex, which are important for α1–α2δ interactions, were further analyzed for their conservation and interaction potential in the obtained CaV2.1 models. CaV2.2 forms a total of eight hydrogen bonds with α2δ-1. The interacting residues in CaV2.2 (Asp120, Asp122, Asn636, Phe637, Glu1314, and Arg1339) are conserved in CaV2.1 (Asp125, Asp127, Asn643, Phe644, Glu1360, and Arg1385) and, importantly, are also predicted interaction sites in all modelled complexes with α2δ-1, α2δ-4, and Cachd1. When CaV2.1 is complexed with α2δ-1, two additional hydrogen bonds between the backbone amides of Met131 and Pro124 of CaV2.1 are expected to form with Glu366 and S263 of α2δ-1. Also, the models predicted one additional hydrogen bond between the backbone oxide of V1380 of CaV2.1 and Lys221 of Cachd1. Taken together, there seems to be a conserved interaction pattern of Cav α1 subunits together with α2δ proteins. However, structural homology modelling suggests that the interaction strength of different α12δ complexes may be fine-tuned by additional interaction sites (hydrogen bonds). Hence, the models for the specific interactions tested (exclusively α2δ-1, α2δ-4, and Cachd1 were investigated) predicted that CaV2.1 would form the strongest interaction with α2δ-1, followed by Cachd1 and, finally, α2δ-4.

3. Discussion

Previously, it has been shown that the neuronal α2δ subunits α2δ-1, -2, and -3 regulate and modulate synapse formation, differentiation, and synaptic transmission [7,9,11,25]. Furthermore, the largely retinal α2δ-4 has been identified as an organizer of synaptic ribbons in photoreceptor cells [18]. Here, we have shown that regulating synapse formation and modulating synaptic functions is a general feature of all α2δ isoforms and of the α2δ-like protein Cachd1. First, α2δ-4 and Cachd1 can localize to presynaptic terminals in hippocampal neurons. Second, and similar to the most abundant neuronal α2δ proteins, the expression of both proteins can rescue the severe synaptic defect of α2δ TKO/KD neurons in terms of synapse differentiation, presynaptic calcium channel localization, and synaptic function. Third, rescuing presynaptic function by the expression of individual α2δ proteins resulted in subtle differences in the amplitude of presynaptic calcium transients. Similar differences were observed upon over-expression of these proteins in wildtype hippocampal neurons. These differences did not correlate with the α2δ-mediated increase in presynaptic calcium channel density. Hence, our data suggest that α2δ isoforms and Cachd1 differ in their ability to interact with presynaptic calcium channels. This was also reflected by distinctly matching charge distributions at the protein interaction surface between α1 and α2δ subunits and the number of predicted interaction sites. Taken together, all α2δ and α2δ-like proteins can regulate synapse formation, synapse differentiation, and synaptic function via a presynaptic mechanism. However, these effects can only partially be explained by calcium-channel dependent mechanisms.

3.1. Functional Redundancy of α2δ Proteins

To study the functions of individual channel subunits, it is pivotal to have a system that allows analyzing the effects of individual α2δ isoforms. However, this is complicated by the fact that hippocampal neurons simultaneously express three different isoforms [15]. Hence, here, we employed previously established α2δ subunit TKO/KD cultured hippocampal neurons as an expression system for α2δ isoforms and the α2δ-like protein Cachd1. α2δ TKO/KD neurons displayed a severe defect in presynaptic function and the formation and differentiation of glutamatergic synapses, as evidenced by strongly reduced presynaptic calcium transients, presynaptic calcium channel localization, presynaptic vesicle-associated proteins, and postsynaptic differentiation [25]. Expression of α2δ-4 and Cachd1 in TKO/KD neurons rescued the severe phenotype by restoring presynaptic CaV2.1 channel localization (Figure 3) and calcium signaling (Figure 4). Hence, α2δ-4 and Cachd1 can mediate presynaptic synapse formation and differentiation to a similar degree as the most abundant neuronal isoform, α2δ-1. The observations that each α2δ subunit (α2δ-1, -2, -3; [25]) and α2δ-4 and Cachd1 (this study) can rescue glutamatergic synapse formation and function in TKO/KD neurons, and that they can locate to presynaptic nerve terminals (Figure 2), strongly suggests that α2δ proteins mediate redundant presynaptic functions. Principally, the rescue of presynaptic function could be explained either by calcium channel-dependent or calcium channel-independent mechanisms. The facts that presynaptic calcium transients could effectively be restored in α2δ TKO/KD neurons by all α2δ proteins, and that the residues involved in the interaction with the α1 subunit of CaV2.1 were highly conserved between α2δ isoforms and Cachd1 (Figure 9) point to a channel-dependent mechanism. Furthermore, all expressed proteins also restored presynaptic CaV2.1 localization in α2δ TKO/KD neurons. In contrast to the rescue experiments, the consequences of α2δ protein over-expression on presynaptic calcium transients and calcium channel localization in wildtype hippocampal neurons seem to be more complex. The over-expression of α2δ-1 strongly increased presynaptic CaV2.1 abundance, while that of Cachd1 and α2δ-4 had no effect. Importantly, these differential effects on presynaptic CaV2.1 clustering were not related to the observed differences in neuronal surface expression (confer Figure 1). Presynaptic CaV2.2 expression, on the other hand, was not affected by any of the over-expressed proteins. Even though the over-expression of the proteins differentially modulated presynaptic calcium transients (see below), they altered neither the pre- and postsynaptic protein composition nor presynaptic bouton size (Figure 7). Together, this suggests that in addition to channel-dependent mechanisms, other channel-independent mechanisms are also involved in presynaptic functions.
The involvement of channel-independent mechanisms is also supported by other recent observations. First, Cachd1 preferentially complexes with T-Type channels [22], while α2δ-1/-2/-3 are likely associated with N-, P/Q-, and L-type channels in the CNS. α2δ-4 is the primary partner of the L-type channel CaV1.4 in retinal photoreceptor cells; however, its preferred α1 subunit in hippocampal neurons is elusive. Nevertheless, all investigated proteins were shown to be able to rescue presynaptic calcium transients (Figure 4) and CaV2.1 channel localization (Figure 3). Second, our previous findings suggest that the trans-synaptic regulation of synaptic wiring and postsynaptic GABAA-receptor accumulation by α2δ-2 depends on the lack of alternatively spliced exon 23, but not on the number of presynaptic calcium channels [11]. This was supported by our present observation that none of the expressed proteins (which, in contrast to α2δ-2, all include exon 23 or a similarly organized protein sequence (Cachd1)) affected postsynaptic GABAA-receptor abundance. Third, we have previously shown that glutamatergic synapse formation in α2δ TKO/KD neurons could be rescued by mutant α2δ constructs lacking the MIDAS motif, which is necessary for calcium current enhancement and channel trafficking [25]. Finally, a recent study demonstrated that synapse assembly is independent of presynaptic CaV2 channels and Ca2+ entry [33].

3.2. Differential Presynaptic Effects of α2δ-4 and Cachd1

In contrast to their apparent redundancy in rescuing glutamatergic synapse formation and function (see above), we observed α2δ isoform-specific differences. First, α2δ isoforms displayed differences in their overall expression on the neuronal surface (Figure 1). Second, they differentially affected presynaptic calcium transients, both in the rescue (Figure 4) and the over-expression (Figure 8) condition, even though the observed differences were rather subtle. Third, α2δ subunits differed in their ability to increase presynaptic CaV2.1 expression (Figure 5). Fourth, they differed slightly in their surface charges and the number of interacting residues with the α1 subunit (Figure 9).
All studied HA-tagged proteins are located in axons and synapses. Notably, Cachd1 and α2δ-4 also showed strong somato-dendritic surface expression (Figure 1C), which may reflect their preferential interaction with T-type or L-type channels, respectively. In presynaptic boutons, Cachd1 showed a similar distribution pattern to α2δ-1, whereas α2δ-4 was predominantly located in the perisynaptic membrane, as also observed for α2δ-2. Ultimately, and provided suitable antibodies or experimental tools are available, these expression patterns need to be confirmed by high resolution microscopy of the endogenously expressed proteins. α2δ-4 reduces presynaptic calcium transients upon over-expression in wildtype neurons (Figure 8) and shows a slightly reduced efficiency in rescuing the calcium transients in α2δ TKO/KD (Figure 4). In contrast, Cachd1 increases presynaptic calcium transients and rescues the TKO/KD phenotype, similarly to α2δ-1 (Figure 4 and Figure 8). Together, this may indicate that, like α2δ-1, Cachd1 specifically modulates active zone calcium channels upon over-expression, resulting in the observed increase of presynaptic calcium transients. In this context, it is noteworthy that Cachd1 can compete with α2δ-1 for binding to CaV2.2 upon heterologous expression [24]. On the other hand, the rescue experiments in the TKO/KD neurons excluded competition with endogenous α2δ isoforms. In these experiments, Cachd1 rescued presynaptic calcium transients, like α2δ-1. The perisynaptic expression of α2δ-4 indicated a less likely interaction with active zone channels, resulting in smaller calcium signals in the rescue experiments. The dominant-negative effect of α2δ-4 on the calcium signal in the over-expression condition may either result from structural interference with the function of wildtype proteins in and around the active zone or from competition with endogenous α2δ subunits for presynaptic channels. These mechanisms may induce a shift in the contribution of the different presynaptic calcium channels to the calcium transients. This hypothesis can be tested in the future via the sequential application of specific calcium channel antagonists.

3.3. Synaptic Roles of α2δ-4 and Cachd1

Our results provide a clear indication that, on the one hand, α2δ subunits are redundant regulators of synapse differentiation and function (see also [25]), and that, on the other hand, they differ in their modulation of presynaptic calcium channel abundance and calcium signaling. Until recently, α2δ-4 was considered to be an exclusive subunit of CaV1.4 channels in retinal photoreceptor cells. However, mutations in CACNA2D4 in patients with neurodevelopmental disorders [34,35,36] and increased α2δ-4 mRNA expression levels in the hippocampus after status epilepticus [20] suggest previously unrecognized functions in the brain. This is further supported by the fact that α2δ-4 knockout mice exhibit behavioral impairments in terms of cognitive and motor functions [21]. Given the extremely low expression of α2δ-4 in the hippocampus [15], α2δ-4 might be restricted to a specific and very small subpopulation of neurons in the brain [5]. The present study supports the possibility of more diverse neuronal functions of α2δ-4, as it proves, for the first time, that it can indeed modulate synaptic and calcium-channel dependent functions in classical CNS neurons. Unlike the well-studied synaptic functions of α2δ-4 in the retina, the synaptic functions of Cachd1 remain unclear. However, Cachd1 has recently been described as an in vivo target for the Alzheimer’s protease BACE1 and potentially also a γ-secretase [37]. Considering our present findings, and that Cachd1 was identified as a modulator of CaV3 activity [22], it may serve as a potential target in diseases such as epilepsy and pain.

3.4. Conclusions

The present study, together with recent findings ([11,22,25] and others), suggests redundant critical and specific modulatory functions of α2δ proteins. Hence, the question arises: why does our nervous system express several distinct proteins with partially overlapping functions? Evolutionarily, it has been suggested that auxiliary subunits were gradually added to the calcium channel complex [38]. Most probably, they evolved to add to the complexity of electrical signaling. This seems to account for their specific and crucial regulatory function, as, contrary to other auxiliary subunits, α2δ proteins were not lost during evolution. It is hence tempting to speculate that the number of α2δ proteins increased to keep up with the complexity of neuronal signaling and synaptic transmission. Therefore, the fine-tuning of synaptic transmission may depend on the parallel action of more than one type of α2δ protein interacting with more than one calcium channel isoform in single synapses. Even if it is experimentally challenging from today’s perspective, revealing these parallel and specific functions will ultimately contribute to our understanding of the origin of neurological diseases, particularly neurodevelopmental disorders.

4. Materials and Methods

4.1. Breeding and Genotyping Procedures

4.1.1. Animals

All animal procedures for wildtype BALB/c and α2δ mutant mice were performed at the Medical University, Innsbruck, in compliance with government regulations and were approved by the Austrian Federal Ministry of Education, Science and Research (license number bmbwf 2020-0.107.333). Mice were maintained at the central animal facility in Innsbruck under standard housing conditions with food and water available ad libitum on a 12 h light/dark cycle.

4.1.2. Breeding and Genotyping of Mutant Mice

WT and α2δ-2+/du and α2δ-3+/− mice were used for breeding procedures to obtain WT embryos and α2δ-2/3 double knockout p0-1 pups for primary neuronal cultures. The α2δ-3 knockout mice (α2δ-3−/−) (described in [11,25,31]) were generated by Deltagen (B6.129P2-Cacna2d3tm1Dgen; [39]), and α2δ-2du/du mice, as described in [40,41], were purchased from The Jackson Laboratory (Bar Harbor, ME, USA) and bred and genotyped as previously described [11,25,31].

4.2. Cell Culture and Transfection Procedures

Primary Cultures of Hippocampal Neurons for Fluorescence Imaging

Low-density hippocampal cultures were generated from 16.5- to 18-d-old embryonic BALB/c mice and p0-1 α2δ-2/3 double knockout mice as described previously [26,27,42]. Briefly, 2–8 hippocampi were dissected in cold Hank’s balanced salt solution (HBSS) following dissociation by 2.5% trypsin treatment and subsequent trituration. Dissociated neurons were plated at a density of ~100,000 cells/60 mm culture dish, on five 18 mm glass coverslips (#1.5; GML) coated with poly-l-lysine (Sigma-Aldrich, St. Louis, MO, USA). After attachment of neurons for 3–4 h, coverslips were transferred neuron-side down into a 60 mm culture dish containing a monolayer of glia. Neuros were maintained in serum-free neurobasal medium supplemented with Glutamax and B-27 (NBKO, all ingredients from Thermo Fisher Scientific, Waltham, MA, USA) changed weekly by a replacement of 1/3 of the volume. Glial proliferation was inhibited 3 days post plating with Ara-C (5 μM). On day in vitro (DIV) 6 neurons were transfected with plasmids using Lipofectamine 2000 (Thermo Fisher Scientific) as described previously [26]. The maximal DNA amount used for co-transfections totaled 1.5 μg of DNA at a 1:1:1 molar ratio. For presynaptic calcium measurements, neurons were used between DIV14 and 17, whereas immunolabelling experiments were conducted on neurons between DIV20 and 24.

4.3. Expression Vectors and Cloning Procedures

For live cell surface labelling, all α2δ subunit constructs and Cachd1 were tagged with a double HA-epitope at the N-terminus between the fourth and fifth amino acid after the predicted signal peptide cleavage site and for comparability cloned into a eukaryotic expression plasmid containing a neuronal chicken β-actin promoter, pβA, as described previously: pβA-α2δ-1 [11], pβA-2HA-α2δ-1 [11], pβA-α2δ-2-v1 [11], pβA-2HA-α2δ-2-v1 [11], pβA-α2δ-3 [11], pβA-eGFP-U6-shRNA-α2δ-1 [25], pHR-pβA-mCherry [11], pHR-pβA-mCherry-U6-shRNA-α2δ-1 [25], pSyn-GCaMP6f [28], pβA-eGFP [26,43].
pβA-Cachd1: The Cachd1 cDNA derived from mouse cortex was cloned into the pβA vector. Primer sequences were selected according to GenBank NM_198037.1. Briefly, the cDNA (nt 1–3867) of Cachd1 was amplified by PCR in three fragments: fragment 1 (nt 1–1366), fragment 2 (nt 1147–2892), and fragment 3 (nt 2707–3867). The forward primer used for amplifying fragment 1 introduced a HindIII site and the Kozak sequence (CCTACC) upstream the starting codon, while the reverse primer used for amplifying fragment 3 introduced a RsrII site after the stop codon. Fragments 1 and 2 were digested with HindIII/Bsu36I and Bsu36I/BamHI, respectively, and co-ligated into the corresponding HindIII/BamHI sites of the pβA vector, generating an intermediate construct. Fragment 3 was digested with BamHI/RsrII and finally ligated into the corresponding sites of the intermediate construct, yielding pβA-Cachd1.
pβA-2HA-Cachd1: Since it was predicted that the signal protein cleavage would be present at position 49 using SignalP 4.1, the 2HA tag followed by a TEV cleavage site was introduced into the pβA-Cachd1 between the third and fourth amino acid after the predicted signal peptide cleavage site. Briefly, the cDNA sequence of Cachd1 (nt 1–864) was PCR amplified with overlapping primers introducing the double HA tag and the TEV sequence in separate PCR reactions using pβA-Cachd1 as a template. The two separate PCR products were then used as templates for a final PCR reaction with flanking primers to connect the nucleotide sequences and the resulting fragment was then HindIII/SalI digested and ligated into the corresponding sites of pβA-Cachd1, resulting in a pβA-2HA-Cachd1 construct.
pβA-α2δ-4: The pIRES human CACNA2D4 cDNA encoding the α2δ-4 isoform was a gift from Niccolò Bacchi, [44]. In brief, the cDNA sequence encoding human α2δ-4 (EU832150) was first subcloned into the pβA vector [26,43] with two amino acid exchanges A to T at position 710 and E to G at position 1034. The cDNA sequence of α2δ-4 (nt 1–1565) was PCR amplified with a forward primer introducing a NotI site and the Kozak sequence (CCTACC) upstream of the starting codon. This fragment was then NotI/BglII digested and co-ligated with the BglII/SalI digested α2δ-4 cDNA and the NotI/SalI digested pβA vector, yielding pβA-α2δ4.
pβA-2HA-α2δ-4: Since a putative signal peptide was not predicted for α2δ-4, we used Signal P 4.0 to discriminate signal peptides from transmembrane regions [45]. The strongest prediction was that the signal peptide would comprise residues 1–68; therefore, the 2HA tag was introduced into pβA-α2δ-4 after residue I71. Briefly, the cDNA sequence of α2δ-4 (nt 1–1565) was PCR amplified with overlapping primers introducing the double HA tag in separate PCR reactions using pβA-α2δ-4 as a template. The two separate PCR products were then used as templates for a final PCR reaction with flanking primers to connect the nucleotide sequences. The resulting fragment was then NotI/BglII digested and ligated into the corresponding sites of pβA-α2δ-4, yielding pβA-2HA-α2δ-4.
Sequence integrity of all newly generated constructs was confirmed by sequencing (MWG Biotech, Martinsried, Germany).

4.4. High-Resolution Fluorescence Microscopy

Immunolabeling of permeabilized or live-cell-stained neurons was performed as described previously [11,25,26,27,43,46]. Neurons were fixed with 4% paraformaldehyde/4% sucrose (pF) in PBS for 20 min at room temperature, washed, and incubated for 30 min in 5% normal goat serum in PBS containing 0.2% bovine serum albumin (BSA) and 0.2% Triton X-100 (PBS/BSA/Triton), enabling membrane permeabilization. Primary antibodies (Table 1) were diluted in PBS/BSA/Triton, applied in a humidified chamber overnight at 4 °C and detected by fluorochrome-conjugated Alexa secondary antibodies incubated for 1 h at room temperature. For surface staining of HA-tagged α2δ constructs, transfected neurons were incubated with rat-anti-HA antibody in glia conditioned neurobasal medium for 10 min at 37 °C following rinsing in warm HBSS and fixation with pF for 10 min at room temperature. Subsequent washing and blocking steps as well as 1 h incubation with fluorochrome-conjugated secondary goat anti-rat Alexa Fluor 594 antibody were conducted with PBS and PBS/BSA, respectively. After washing and postfixation of cells in pF for 5 min, neurons were permeabilized by blocking with PBS/BSA/Triton and incubated with primary mouse-anti-synapsin antibody overnight at 4 °C and detected with goat-anti-mouse Alexa Fluor 350 antibody. Coverslips were mounted with DABCO (Agilent Technologies, Santa Clara, CA, USA) glycerol fluorescence mounting medium. Hippocampal cultures were typically viewed with an Olympus BX53 microscope (Olympus, Tokyo, Japan) using a 60 × 1.42 numerical aperture (NA) oil-immersion objective lens and 14-bit grayscale images were recorded with a cooled CCD camera (XM10; Olympus) using cellSens Dimension software (Olympus) and further analyzed in MetaMorph software (Molecular Devices, San Jose, CA, USA). Images of randomly selected well differentiated positively transfected cells and transfected axons forming synapses with untransfected dendrites were acquired with the same exposure and gain settings for all conditions within an experiment for quantification analysis. Overly saturated neurons (based on eGFP and mCherry levels in presynaptic calcium measurements) were excluded from analysis and only cells with medium to low eGFP or mCherry expression were selected for further analysis. Figures were assembled in Adobe Photoshop CS6 using linear adjustments to correct black level and contrast.

Antibodies

Details on antibodies used within this study are given in Table 1.

4.5. Image Analysis and Quantification

4.5.1. Colocalization of Synaptic Proteins

To determine the synaptic localization of HA-tagged α2δ subunits and Cachd1, as well as of presynaptic (synapsin, vGAT, vGLUT1, CaV2.1) and postsynaptic proteins (GABAAR subtypes, gephyrin, GLUR1), the “line scan” function was applied in MetaMorph (Molecular Devices) [47]. Average fluorescence intensities of respective signals (green-A488, blue-A350 and red-A594) were measured along a line of 3 μm length, followed by background subtraction, and plotted in Microsoft Excel.

4.5.2. Quantification of Fluorescent Clusters in Single Boutons

To analyze the effects of α2δ subunits or Cachd1 expression in glutamatergic synapses on synapse composition and protein expression, images from triple-fluorescence labeled neurons were acquired in the eGFP (green), GABAARα1 (red), and vGlut1 (blue) channels as described [11]. Images were analyzed with a custom programmed and semi-automated MetaMorph journal (Molecular Devices), as described previously [11,25], with a slight modification. Briefly, eGFP and vGlut1 images were superimposed, eGFP/vGlut1-positive varicosities (putative glutamatergic synapses) were randomly chosen as regions of interest (ROIs), and a background region was selected for background subtraction. Axonal varicosities were defined as prominent swellings with higher fluorescence signals compared to the adjacent axonal stem after thresholding the image. Subsequently, GABAAR, and vGlut1 grayscale images were measured without thresholding to avoid potential cut-off of the fluorescent signal. By applying the “shrink region to fit” tool, automatic boundaries were drawn according to the threshold enabling only colocalized clusters to be analyzed and selected ROIs were then transferred from the eGFP image to the GABAAR and vGlut1 images to measure fluorescent intensities. For the individual synapses in each of the channels, the following parameters were detected in a blinded manner: eGFP threshold area as a measure for bouton size and average and integrated fluorescence intensities providing information on the size and intensity of clusters. In the same manner, the expression of synapsin and CaV2.1 was conducted.

4.5.3. Quantification of Live Cell Surface Expression

To measure the intensity of live cell-stained HA-tagged constructs, the fluorescent intensities were determined by measuring the fluorescent intensity along a thresholded axon, dendrite, and the cell soma.

4.5.4. Quantification Analysis

Analyses of all experiments were conducted with Microsoft Excel. Mean values of individual cells from two to three independent culture preparations were calculated and plotted in Graphpad Prism 8. The CaV2.1 and synapsin values in the rescue experiment were additionally normalized to the rescue control and log-transformed.

4.6. Calcium Imaging

A GCaMP6f version coupled to synaptophysin driven by a synapsin promotor was applied as described in [25,28]. Calcium imaging was conducted as described previously [25]. Briefly, to examine presynaptic Ca2+ influx, primary neurons were transfected at DIV6 with pβA-SynGCaMP6f and, as indicated, additional plasmids (pHR-βA-mCherry-U6-shRNA-α2δ-1, pβA-mCherry, pβA-α2δ-1, pβA-α2δ-4, pβA-Cachd1) were co-transfected. Then, 8–11 days post transfection, coverslips were mounted in a recording chamber, placed on an inverted microscope (Olympus IX71, 60x, 1.42 NA PlanApo objective), and superfused at 1.0–1.5 mL/min with bath solution (temperature 32 °C), containing (in mM): NaCl 145, KCl 3, MgCl2 1.5, CaCl2 2, glucose 11, HEPES 10; pH 7.3 adjusted with NaOH. The bath solution contained 10 μM 6-cyano-7-nitroquinoxaline-2,3-dione (CNQX), 25 μM D, L-2-amino-5-phosphonovaleric acid (AP5), and 10 μM bicuculline to suppress postsynaptic signaling. All chemicals were obtained from Sigma (St. Louis, MO, USA), except for CNQX, AP5 and bicuculline (Tocris). As described [28], a stimulation electrode, built by two platinum wires of 10 mm length with 10 mm distance, was positioned with a micromanipulator (MPC-200, Sutter Instrument, Novato, CA, USA) and neurons were stimulated with 50 Hz trains of 1, 3 and 10 current pulses (1 ms, 55 mA). Ca2+ transients were visualized and recorded (20 ms exposure time, frame rate 50 Hz, 200 frames, binning 2: 0.215 μm per pixel) with a CMOS camera (Orca Flash4.0, Hamamatsu, Japan), using a halogen lamp light source (HXP 120) in the green channel (excitation: 470/40 nm, emission: 525/50 nm). Image recordings were controlled by Micromanager software (Visitron Systems, Puchheim, Germany). As a baseline reference, 50 frames were recorded before the stimulus train was triggered.

Data Analysis

Recordings were quantified in FIJI/ImageJ (National Institute of Health, Bethesda, MA, USA) as described previously [25]. Briefly, 22 ROIs per recorded cell were drawn around mCherry positive presynaptic boutons using the plugin ‘Time Series Analyzer V3′ with an AutoROI diameter of 10 pixels. The regions were subsequently used in the green SynGCaMP6f recordings to measure the fluorescence changes, removing the background signal with the commonly used “Subtract Background” tool of ImageJ (employing a “rolling ball” algorithm with a radius of 20 pixels ≈ 4.3 μm). The mean of the four highest fluorescence pixels was calculated for each ROI at each frame by applying a self-made macro [28], and further analysis was done in Microsoft Excel. To obtain mean sample traces, the changes in fluorescence as ΔF/F0 were calculated for each ROI, and the 22 synapses per cell were averaged. Statistical analysis was performed on the maxima of cells in Graphpad Prism 8, as indicated. Cumulative frequency distributions were obtained by calculating the maximal response (ΔF/F0) by averaging five frames of the peak signal for every single synapse in Microsoft Excel. For each condition and stimulation, a cumulative histogram with defined class sizes was calculated, and values were normalized to the number of synapses per condition. Data were plotted as peak response (log) against the frequency (%) starting at 0.01, as signals below this threshold were indistinguishable from noise and, therefore, considered as non-responding.

4.7. Homology Modeling

To obtain homology models of the individual α12δ complexes, the predicted AlphaFold models of mouse CaV2.1 (AlphaFold identifier: AF-P97445-F1), mouse α2δ-1 (AF-O08532-F1), human α2δ-4 (AF-Q7Z3S7-F1), and mouse Cachd1 (AF-Q6PDJ1-F1) were superposed onto the published cryo-EM CaV2.2 complex structure (PDB code: 7miy) in PyMOL (The PyMOL Molecular Graphics System, Version 2.3.2. Schrödinger, LLC, New York, NY, USA). Improper surface interactions within the complexes required minor remodeling of α2δ-4 and Cachd1, performed in Coot [48], whereby all bond restraints were retained. Complex interface areas and interactions were analyzed using the PDBePISA server [49] and PyMOL. The long intracellular loops of the CaV2.1 α1 subunit were shortened for clearer illustrations. PyMOL was used to prepare the figures.

Author Contributions

Conceptualization, C.A., G.J.S. and G.J.O.; methodology, C.A., C.E., M.C., S.M.G. and G.J.O.; software, C.E., S.M.G. and M.M.; validation, C.A. and G.J.O.; formal analysis, C.A., C.E. and G.J.O.; investigation, C.A. and C.E.; resources, M.C., M.M. and G.J.O.; data curation, C.A. and G.J.O.; writing—original draft preparation, C.A., C.E. and G.J.O.; writing—review and editing, C.A., C.E., M.C., S.M.G., G.J.S., M.M. and G.J.O.; visualization, C.A., C.E. and G.J.O.; supervision, G.J.O.; project administration, C.A. and G.J.O.; funding acquisition, M.C., M.M. and G.J.O. All authors have read and agreed to the published version of the manuscript.

Funding

This research was funded by the Austrian Science Fund (FWF) grant number (DOC30-B30, and J3682-B12), the Gesellschaft für Forschungsförderung Niederösterreich (NFB), grant number (LSC19-017), and the Deutsche Forschungsgemeinschaft, grant number (SFB 1348 TP A03). The APC was funded by the Austrian Science Fund (FWF).

Institutional Review Board Statement

The animal study protocol was approved by the Austrian Federal Ministry of Education, Science and Research (license number bmbwf 2020-0.107.333, date of approval 3 September 2020).

Informed Consent Statement

Not applicable.

Data Availability Statement

Data is contained within the article and raw data presented in this study are available upon request.

Acknowledgments

This work is part of the Ph.D. thesis of C.A. We thank Sandra Demetz, Irene Mahlknecht, and Nicole Kranebitter for excellent technical support; Anja Beierfuß and her team for animal care.

Conflicts of Interest

The authors declare no competing financial interest.

References

  1. Dolphin, A.C. Calcium Channel Auxiliary α2δ and β Subunits: Trafficking and One Step Beyond. Nat. Rev. Neurosci. 2012, 13, 542–555. [Google Scholar] [CrossRef] [PubMed]
  2. Felix, R.; Gurnett, C.A.; de Waard, M.; Campbell, K.P. Dissection of Functional Domains of the Voltage-Dependent Ca2+ Channel Alpha2delta Subunit. J. Neurosci. 1997, 17, 6884–6891. [Google Scholar] [CrossRef] [PubMed]
  3. Catterall, W.A. Voltage-Gated Calcium Channels. Cold Spring Harb. Perspect. Biol. 2011, 3, a003947. [Google Scholar] [CrossRef] [PubMed]
  4. Calderón-Rivera, A.; Andrade, A.; Hernández-Hernández, O.; González-Ramírez, R.; Sandoval, A.; Rivera, M.; Gomora, J.C.; Felix, R. Identification of a Disulfide Bridge Essential for Structure and Function of the Voltage-Gated Ca2+ Channel α2δ-1 Auxiliary Subunit. Cell Calcium 2012, 51, 22–30. [Google Scholar] [CrossRef] [PubMed]
  5. Ablinger, C.; Geisler, S.M.; Stanika, R.I.; Klein, C.T.; Obermair, G.J. Neuronal α2δ Proteins and Brain Disorders. Pflügers Arch.-Eur. J. Physiol. 2020, 472, 845–863. [Google Scholar] [CrossRef]
  6. Andrade, A.; Brennecke, A.; Mallat, S.; Brown, J.; Gomez-Rivadeneira, J.; Czepiel, N.; Londrigan, L. Genetic Associations between Voltage-Gated Calcium Channels and Psychiatric Disorders. Int. J. Mol. Sci. 2019, 20, 3537. [Google Scholar] [CrossRef]
  7. Eroglu, C.; Allen, N.J.; Susman, M.W.; O’Rourke, N.A.; Park, C.Y.; Ozkan, E.; Chakraborty, C.; Mulinyawe, S.B.; Annis, D.S.; Huberman, A.D.; et al. Gabapentin Receptor Alpha2delta-1 Is a Neuronal Thrombospondin Receptor Responsible for Excitatory CNS Synaptogenesis. Cell 2009, 139, 380–392. [Google Scholar] [CrossRef]
  8. Risher, W.C.; Kim, N.; Koh, S.; Choi, J.-E.; Mitev, P.; Spence, E.F.; Pilaz, L.-J.; Wang, D.; Feng, G.; Silver, D.L.; et al. Thrombospondin Receptor α2δ-1 Promotes Synaptogenesis and Spinogenesis via Postsynaptic Rac1. J. Cell Biol. 2018, 217, 3747–3765. [Google Scholar] [CrossRef]
  9. Beeson, K.A.; Beeson, R.; Westbrook, G.L.; Schnell, E. α2δ-2 Protein Controls Structure and Function at the Cerebellar Climbing Fiber Synapse. J. Neurosci. 2020, 40, 2403–2415. [Google Scholar] [CrossRef]
  10. Fell, B.; Eckrich, S.; Blum, K.; Eckrich, T.; Hecker, D.; Obermair, G.J.; Münkner, S.; Flockerzi, V.; Schick, B.; Engel, J. α2δ2 Controls the Function and Trans-Synaptic Coupling of Cav1.3 Channels in Mouse Inner Hair Cells and Is Essential for Normal Hearing. J. Neurosci. 2016, 36, 11024–11036. [Google Scholar] [CrossRef] [Green Version]
  11. Geisler, S.; Schöpf, C.L.; Stanika, R.; Kalb, M.; Campiglio, M.; Repetto, D.; Traxler, L.; Missler, M.; Obermair, G.J. Presynaptic α2δ-2 Calcium Channel Subunits Regulate Postsynaptic GABAA Receptor Abundance and Axonal Wiring. J. Neurosci. 2019, 39, 2581–2605. [Google Scholar] [CrossRef] [PubMed]
  12. Pirone, A.; Kurt, S.; Zuccotti, A.; Rüttiger, L.; Pilz, P.; Brown, D.H.; Franz, C.; Schweizer, M.; Rust, M.B.; Rübsamen, R.; et al. α2δ3 Is Essential for Normal Structure and Function of Auditory Nerve Synapses and Is a Novel Candidate for Auditory Processing Disorders. J. Neurosci. 2014, 34, 434–445. [Google Scholar] [CrossRef] [PubMed]
  13. Caylor, R.C.; Jin, Y.; Ackley, B.D. The Caenorhabditis Elegans Voltage-Gated Calcium Channel Subunits UNC-2 and UNC-36 and the Calcium-Dependent Kinase UNC-43/CaMKII Regulate Neuromuscular Junction Morphology. Neural Dev. 2013, 8, 10. [Google Scholar] [CrossRef]
  14. Kurshan, P.T.; Oztan, A.; Schwarz, T.L. Presynaptic α2δ-3 Is Required for Synaptic Morphogenesis Independent of Its Ca2+-Channel Functions. Nat. Neurosci. 2009, 12, 1415–1423. [Google Scholar] [CrossRef] [PubMed]
  15. Schlick, B.; Flucher, B.E.; Obermair, G.J. Voltage-Activated Calcium Channel Expression Profiles in Mouse Brain and Cultured Hippocampal Neurons. Neuroscience 2010, 167, 786–798. [Google Scholar] [CrossRef]
  16. Kerov, V.; Laird, J.G.; Joiner, M.-L.; Knecht, S.; Soh, D.; Hagen, J.; Gardner, S.H.; Gutierrez, W.; Yoshimatsu, T.; Bhattarai, S.; et al. α2δ-4 Is Required for the Molecular and Structural Organization of Rod and Cone Photoreceptor Synapses. J. Neurosci. 2018, 38, 6145–6160. [Google Scholar] [CrossRef] [PubMed]
  17. Knoflach, D.; Kerov, V.; Sartori, S.B.; Obermair, G.J.; Schmuckermair, C.; Liu, X.; Sothilingam, V.; Garcia Garrido, M.; Baker, S.A.; Glösmann, M.; et al. Cav1.4 IT Mouse as Model for Vision Impairment in Human Congenital Stationary Night Blindness Type 2. Channels 2013, 7, 503–513. [Google Scholar] [CrossRef]
  18. Wang, Y.; Fehlhaber, K.E.; Sarria, I.; Cao, Y.; Ingram, N.T.; Guerrero-Given, D.; Throesch, B.; Baldwin, K.; Kamasawa, N.; Ohtsuka, T.; et al. The Auxiliary Calcium Channel Subunit α2δ4 Is Required for Axonal Elaboration, Synaptic Transmission, and Wiring of Rod Photoreceptors. Neuron 2017, 93, 1359–1374. [Google Scholar] [CrossRef]
  19. Wycisk, K.A.; Budde, B.; Feil, S.; Skosyrski, S.; Buzzi, F.; Neidhardt, J.; Glaus, E.; Nürnberg, P.; Ruether, K.; Berger, W. Structural and Functional Abnormalities of Retinal Ribbon Synapses Due to Cacna2d4 Mutation. Investig. Ophthalmolo. Vis. Sci. 2006, 47, 3523–3530. [Google Scholar] [CrossRef]
  20. van Loo, K.M.J.; Rummel, C.K.; Pitsch, J.; Müller, J.A.; Bikbaev, A.F.; Martinez-Chavez, E.; Blaess, S.; Dietrich, D.; Heine, M.; Becker, A.J.; et al. Calcium Channel Subunit α2δ4 Is Regulated by Early Growth Response 1 and Facilitates Epileptogenesis. J. Neurosci. 2019, 39, 3175–3187. [Google Scholar] [CrossRef] [Green Version]
  21. Klomp, A.; Omichi, R.; Iwasa, Y.; Smith, R.J.; Usachev, Y.M.; Russo, A.F.; Narayanan, N.S.; Lee, A. The Voltage-Gated Ca2+ Channel Subunit α2δ-4 Regulates Locomotor Behavior and Sensorimotor Gating in Mice. PLoS ONE 2022, 17, e0263197. [Google Scholar] [CrossRef] [PubMed]
  22. Cottrell, G.S.; Soubrane, C.H.; Hounshell, J.A.; Lin, H.; Owenson, V.; Rigby, M.; Cox, P.J.; Barker, B.S.; Ottolini, M.; Ince, S.; et al. CACHD1 Is an α2δ-Like Protein That Modulates CaV3 Voltage-Gated Calcium Channel Activity. J. Neurosci. 2018, 38, 9186–9201. [Google Scholar] [CrossRef] [PubMed]
  23. Stephens, G.J.; Cottrell, G.S. CACHD1: A New Activity-Modifying Protein for Voltage-Gated Calcium Channels. Channels 2019, 13, 120–123. [Google Scholar] [CrossRef] [PubMed]
  24. Dahimene, S.; Page, K.M.; Kadurin, I.; Ferron, L.; Ho, D.Y.; Powell, G.T.; Pratt, W.S.; Wilson, S.W.; Dolphin, A.C. The α2δ-like Protein Cachd1 Increases N-Type Calcium Currents and Cell Surface Expression and Competes with α2δ-1. Cell Rep. 2018, 25, 1610–1621. [Google Scholar] [CrossRef]
  25. Schöpf, C.L.; Ablinger, C.; Geisler, S.M.; Stanika, R.I.; Campiglio, M.; Kaufmann, W.A.; Nimmervoll, B.; Schlick, B.; Brockhaus, J.; Missler, M.; et al. Presynaptic α2δ Subunits Are Key Organizers of Glutamatergic Synapses. Proc. Natl. Acad. Sci. USA 2021, 118, e1920827118. [Google Scholar] [CrossRef]
  26. Obermair, G.J.; Szabo, Z.; Bourinet, E.; Flucher, B.E. Differential Targeting of the L-Type Ca2+ Channel Alpha 1C (CaV1.2) to Synaptic and Extrasynaptic Compartments in Hippocampal Neurons. Eur. J. Neurosci. 2004, 19, 2109–2122. [Google Scholar] [CrossRef]
  27. Stanika, R.; Campiglio, M.; Pinggera, A.; Lee, A.; Striessnig, J.; Flucher, B.E.; Obermair, G.J. Splice Variants of the CaV1.3 L-Type Calcium Channel Regulate Dendritic Spine Morphology. Sci. Rep. 2016, 6, 34528. [Google Scholar] [CrossRef]
  28. Brockhaus, J.; Schreitmüller, M.; Repetto, D.; Klatt, O.; Reissner, C.; Elmslie, K.; Heine, M.; Missler, M. α-Neurexins Together with α2δ-1 Auxiliary Subunits Regulate Ca2+ Influx through Cav2.1 Channels. J. Neurosci. 2018, 38, 8277–8294. [Google Scholar] [CrossRef]
  29. Scott, M.B.; Kammermeier, P.J. CaV2 Channel Subtype Expression in Rat Sympathetic Neurons Is Selectively Regulated by α2δ Subunits. Channels 2017, 11, 555–573. [Google Scholar] [CrossRef]
  30. Hoppa, M.B.; Lana, B.; Margas, W.; Dolphin, A.C.; Ryan, T.A. α2δ Expression Sets Presynaptic Calcium Channel Abundance and Release Probability. Nature 2012, 486, 122–125. [Google Scholar] [CrossRef] [Green Version]
  31. Geisler, S.M.; Benedetti, A.; Schöpf, C.L.; Schwarzer, C.; Stefanova, N.; Schwartz, A.; Obermair, G.J. Phenotypic Characterization and Brain Structure Analysis of Calcium Channel Subunit α2δ-2 Mutant (Ducky) and α2δ Double Knockout Mice. Front. Synaptic Neurosci. 2021, 13, 634412. [Google Scholar] [CrossRef] [PubMed]
  32. Gao, S.; Yao, X.; Yan, N. Structure of Human Cav2.2 Channel Blocked by the Painkiller Ziconotide. Nature 2021, 596, 143–147. [Google Scholar] [CrossRef] [PubMed]
  33. Held, R.G.; Liu, C.; Ma, K.; Ramsey, A.M.; Tarr, T.B.; de Nola, G.; Wang, S.S.H.; Wang, J.; van den Maagdenberg, A.M.J.M.; Schneider, T.; et al. Synapse and Active Zone Assembly in the Absence of Presynaptic Ca2+ Channels and Ca2+ Entry. Neuron 2020, 107, 667–683.e9. [Google Scholar] [CrossRef] [PubMed]
  34. Smith, M.; Flodman, P.L.; Gargus, J.J.; Simon, M.T.; Verrell, K.; Haas, R.; Reiner, G.E.; Naviaux, R.; Osann, K.; Spence, M.A.; et al. Mitochondrial and Ion Channel Gene Alterations in Autism. Biochim. Biophys. Acta 2012, 1817, 1796–1802. [Google Scholar] [CrossRef] [PubMed]
  35. Purcell, S.M.; Moran, J.L.; Fromer, M.; Ruderfer, D.; Solovieff, N.; Roussos, P.; O’Dushlaine, C.; Chambert, K.; Bergen, S.E.; Kähler, A.; et al. A Polygenic Burden of Rare Disruptive Mutations in Schizophrenia. Nature 2014, 506, 185–190. [Google Scholar] [CrossRef]
  36. van den Bossche, M.J.; Strazisar, M.; de Bruyne, S.; Bervoets, C.; Lenaerts, A.-S.; de Zutter, S.; Nordin, A.; Norrback, K.-F.; Goossens, D.; de Rijk, P.; et al. Identification of a CACNA2D4 Deletion in Late Onset Bipolar Disorder Patients and Implications for the Involvement of Voltage-Dependent Calcium Channels in Psychiatric Disorders. Am. J. Med. Genetics. Part B Neuropsychiatr. Genet. 2012, 159B, 465–475. [Google Scholar] [CrossRef] [PubMed]
  37. Rudan Njavro, J.; Klotz, J.; Dislich, B.; Wanngren, J.; Shmueli, M.D.; Herber, J.; Kuhn, P.-H.; Kumar, R.; Koeglsperger, T.; Conrad, M.; et al. Mouse Brain Proteomics Establishes MDGA1 and CACHD1 as in Vivo Substrates of the Alzheimer Protease BACE1. FASEB J. 2020, 34, 2465–2482. [Google Scholar] [CrossRef]
  38. Moran, Y.; Zakon, H.H. The Evolution of the Four Subunits of Voltage-Gated Calcium Channels: Ancient Roots, Increasing Complexity, and Multiple Losses. Genome Biol. Evol. 2014, 6, 2210–2217. [Google Scholar] [CrossRef]
  39. Neely, G.G.; Hess, A.; Costigan, M.; Keene, A.C.; Goulas, S.; Langeslag, M.; Griffin, R.S.; Belfer, I.; Dai, F.; Smith, S.B.; et al. A Genome-Wide Drosophila Screen for Heat Nociception Identifies α2δ3 as an Evolutionarily Conserved Pain Gene. Cell 2010, 143, 628–638. [Google Scholar] [CrossRef]
  40. Brodbeck, J.; Davies, A.; Courtney, J.-M.; Meir, A.; Balaguero, N.; Canti, C.; Moss, F.J.; Page, K.M.; Pratt, W.S.; Hunt, S.P.; et al. The Ducky Mutation in Cacna2d2 Results in Altered Purkinje Cell Morphology and Is Associated with the Expression of a Truncated Alpha2Delta-2 Protein with Abnormal Function. J. Biol. Chem. 2002, 277, 7684–7693. [Google Scholar] [CrossRef] [Green Version]
  41. Barclay, J.; Balaguero, N.; Mione, M.; Ackerman, S.L.; Letts, V.A.; Brodbeck, J.; Canti, C.; Meir, A.; Page, K.M.; Kusumi, K.; et al. Ducky Mouse Phenotype of Epilepsy and Ataxia Is Associated with Mutations in the Cacna2d2 Gene and Decreased Calcium Channel Current in Cerebellar Purkinje Cells. J. Neurosci. 2001, 21, 6095–6104. [Google Scholar] [CrossRef] [PubMed]
  42. Kaech, S.; Banker, G. Culturing Hippocampal Neurons. Nat. Protoc. 2006, 1, 2406–2415. [Google Scholar] [CrossRef] [PubMed]
  43. Obermair, G.J.; Schlick, B.; Di Biase, V.; Subramanyam, P.; Gebhart, M.; Baumgartner, S.; Flucher, B.E. Reciprocal Interactions Regulate Targeting of Calcium Channel Beta Subunits and Membrane Expression of Alpha1 Subunits in Cultured Hippocampal Neurons. J. Biol. Chem. 2010, 285, 5776–5791. [Google Scholar] [CrossRef]
  44. Bacchi, N.; Messina, A.; Burtscher, V.; Dassi, E.; Provenzano, G.; Bozzi, Y.; Demontis, G.C.; Koschak, A.; Denti, M.A.; Casarosa, S. A New Splicing Isoform of Cacna2d4 Mimicking the Effects of c.2451insC Mutation in the Retina: Novel Molecular and Electrophysiological Insights. Investig. Ophthalmol. Vis. Sci. 2015, 56, 4846–4856. [Google Scholar] [CrossRef] [PubMed]
  45. Petersen, T.N.; Brunak, S.; von Heijne, G.; Nielsen, H. SignalP 4.0: Discriminating Signal Peptides from Transmembrane Regions. Nat. Methods 2011, 8, 785–786. [Google Scholar] [CrossRef]
  46. Folci, A.; Steinberger, A.; Lee, B.; Stanika, R.; Scheruebel, S.; Campiglio, M.; Ramprecht, C.; Pelzmann, B.; Hell, J.W.; Obermair, G.J.; et al. Molecular Mimicking of C-Terminal Phosphorylation Tunes the Surface Dynamics of CaV1.2 Calcium Channels in Hippocampal Neurons. J. Biol. Chem. 2018, 293, 1040–1053. [Google Scholar] [CrossRef]
  47. Di Biase, V.; Flucher, B.E.; Obermair, G.J. Resolving Sub-Synaptic Compartments with Double Immunofluorescence Labeling In Hippocampal Neurons. J. Neurosci. Methods 2009, 176, 78–84. [Google Scholar] [CrossRef]
  48. Emsley, P.; Lohkamp, B.; Scott, W.G.; Cowtan, K. Features and Development of Coot. Acta Crystallogr. Sect. D Biol. Crystallogr. 2010, 66, 486–501. [Google Scholar] [CrossRef]
  49. Krissinel, E.; Henrick, K. Inference of Macromolecular Assemblies from Crystalline State. J. Mol. Biol. 2007, 372, 774–797. [Google Scholar] [CrossRef]
Figure 1. α2δ-4 and Cachd1 can be expressed on the somato-dendritic and axonal surface. (A) Live cell surface staining of wildtype primary hippocampal neurons overexpressing soluble eGFP together with HA-tagged constructs of α2δ subunits or Cachd1. (A) The somatic expression pattern of the anti-HA labelling revealed that all α2δ subunits and Cachd1 can be expressed on the neuronal surface. (B) Anti-HA and synapsin immunofluorescent labelling revealed that all α2δ subunits and Cachd1 show synaptic and dendritic membrane targeting (white arrowheads). Neurons overexpressing α2δ-1 displayed a weaker expression pattern on the somatic, dendritic, and axonal surface compared to α2δ-2, α2δ-4, and Cachd1. (C) Quantification of the average HA fluorescent intensities illustrated that the surface expression of α2δ-1 was reduced compared to those of the other subunits. α2δ-2 expression in soma, dendrites, and axons was higher compared to α2δ-1, α2δ-4, and Cachd1. Quantification data are shown as values for individual cells (dots) and means ± SEM. ANOVA with Tukey’s multiple comparison test (C) 16–22 cells per condition from three independent culture preparations. F(3, 60) = 53.6, p < 0.0001. Significances of post hoc test (*** p < 0.001, ** p < 0.01, * p < 0.05) in comparison to α2δ-1, unless otherwise indicated, are indicated with asterisks. Scale bars, 5 µm.
Ijms 23 09885 g001
Figure 2. α2δ-4 and Cachd1 can target presynaptic membranes. An analysis of axonal varicosities illustrated a presynaptic localization pattern for all α2δ subunits and Cachd1. This can be inferred from the color overlay and the co-localization of the linescan peaks of HA-α2δ (red), synapsin (blue) and eGFP (green). Axonal varicosities were identified by their eGFP expression and are outlined by a dashed line. α2δ-4 specifically accumulated in the perisynaptic membrane around a central synapsin cluster. Overall, α2δ-2 and α2δ-4 displayed higher axonal expression compared to α2δ-1 and Cachd1 (for a quantitative analysis, see Figure 1C). Scale bar, 1 µm.
Ijms 23 09885 g002
Figure 3. All α2δ subunits and Cachd1 rescue glutamatergic synapse formation. (A) Immunofluorescent labelling of synapsin and CaV2.1 in α2δ TKO/KD neurons (α2δ-2/3 double knockout neurons transfected with shRNA-α2δ-1/eGFP) illustrated a severe defect in glutamatergic synapse formation and differentiation, the absence of synapsin and CaV2.1 clusters in presynaptic varicosities. Boutons and axons were identified by their eGFP expression and are outlined by a dashed line. The reintroduction of α2δ-1, α2δ-4, or Cachd1 could rescue the accumulation of CaV2.1 and synapsin in the presynaptic boutons. This is supported in the color overlay, qualitative linescan analysis, and the quantification of the fluorescent intensities of CaV2.1 (B) and synapsin 1 (C). Quantification is represented as values for individual cells (dots) and means ± SEM. ANOVA with Tukey’s multiple comparison test with 39–46 cells per condition from three independent culture preparations. (B) F(3, 169) = 25.85, p < 0.0001, post hoc: *** p< 0.0001. (C) F(3, 169) = 19.25, p < 0.0001, post hoc: *** p < 0.0001. Significance of the TKO/KD in comparison to rescue conditions is indicated in the graphs with asterisks. Scale bar, 1 µm.
Ijms 23 09885 g003
Figure 4. All α2δ subunits and Cachd1 can restore presynaptic calcium signaling in α2δ TKO/KD neurons. Mean sample traces (A), cumulative frequency distribution blots (B), and quantification (C) of presynaptic calcium imaging (SynGCaMP6f) in α2δ TKO/KD neurons. (A,C) Presynaptic calcium signals were significantly reduced in TKO/KD neurons (black) in response to 1 action potential (AP), 3 AP, and 10 AP stimulation compared to double heterozygous controls (green). The introduction of α2δ-1 (orange), α2δ-4 (blue), or Cachd1 (purple) restored presynaptic calcium transients in all stimulation patterns. (B) The fraction (see text) and mean of responding synapses in TKO/KD neurons was strongly reduced compared to control and rescue conditions. ANOVA with Tukey’s multiple comparison test: 1 AP: F(4, 2504) = 30.7, p < 0.0001; 3 AP: F(4, 2504) = 38.6, p < 0.0001; 10 AP: F(4, 2504) = 95.0, p < 0.0001. Significances of post hoc tests compared to the TKO/KD condition are indicated in the graphs by asterisks (*** p < 0.001). (C) Quantification shows values for individual cells (dots) and means ± SEM. 21–23 cells per condition were obtained from three independent culture preparations (number of synapses analyzed: control, 483; TKO/KD, 506; rescue α2δ-1, 462; rescue α2δ-4, 484; rescue Cachd1, 484). ANOVA with Tukey’s multiple comparison test: 1 AP: F(4, 105) = 4.5, p = 0.0021; 3 AP: F(4, 105) = 11.6, p < 0.0001; 10 AP: F(4, 105) = 35.9, p < 0.0001. Significances of post hoc tests of TKO/KD compared to the other conditions are indicated in the graphs by asterisks (*** p < 0.001).
Ijms 23 09885 g004
Figure 5. Overexpression of α2δ-4 or Cachd1 does not increase presynaptic clustering of CaV2.1 channels. (A) Immunofluorescence analysis of axonal varicosities from wildtype neurons overexpressing eGFP and α2δ or Cachd1 constructs, labelled against synapsin and CaV2.1. Micrographs show immunofluorescent signals of CaV2.1 channels at presynaptic boutons, identified by eGFP expression (outlined with a dashed line) and presynaptic synapsin labelling along untransfected dendrites (see also qualitative linescan analysis). Contrary to neurons overexpressing α2δ-1, which display two times higher CaV2.1 intensity, neurons overexpressing α2δ-4 and Cachd1 exhibited CaV2.1 levels similar to those of the eGFP control. Quantification of CaV2.1 (B) and synapsin 1 (C) shows values for individual cells (dots) and means ± SEM. Cells were obtained from three independent culture preparations. ANOVA with Tukey’s multiple comparison test. (B) 38 cells per condition, F(3, 148) = 41, p < 0.0001. (C) 38 cells per condition, F(3, 148) = 1.4, p = 0.25. Significance of post hoc test in comparison to α2δ-1 is indicated by asterisks (*** p < 0.001). Scale bar, 1 µm.
Ijms 23 09885 g005
Figure 6. Overexpression of α2δ-1, α2δ-4, or Cachd1 does not increase clustering of N-type channels. (A) Immunofluorescence analysis of axonal varicosities from wildtype neurons overexpressing eGFP and α2δ or Cachd1 constructs, labelled against synapsin and CaV2.2. Micrographs show immunofluorescent signals of CaV2.2 channels at presynaptic boutons, identified by eGFP expression (outlined with a dashed line) and presynaptic synapsin labelling along untransfected dendrites (see also qualitative linescan analysis). Neurons overexpressing α2δ-1, α2δ-4, or Cachd1 exhibited CaV2.2 levels similar to those of the eGFP control. Quantification of CaV2.2 (B) and synapsin 1 (C) shows values for individual cells (dots) and means ± SEM. Cells were obtained from three independent culture preparations. ANOVA with Tukey’s multiple comparison test. (B) 24–39 cells per condition, F(3, 110) = 1.58, p = 0.20. (C) 24–39 cells per condition, F(3, 110) = 0.99, p = 0.40. Scale bar, 1 µm.
Ijms 23 09885 g006
Figure 7. Overexpression of α2δ-4 or Cachd1 does not alter the composition of glutamatergic synapses. (A) Co-transfection of soluble eGFP and α2δ subunits or Cachd1 in combination with immunofluorescent labelling of presynaptic vGlut1 and postsynaptic GABAA-receptors was used to detect the formation of mismatched synapses. Only the overexpression of α2δ-2 led to the formation of mismatched synapses, as detected by postsynaptic GABAA receptor clusters opposite vGlut1 positive glutamatergic terminals (A, α2δ-2). Overexpression of α2δ-4 or Cachd1 did not induce the formation of mismatched synapses and did not alter the molecular composition of glutamatergic synapses. Quantifications of immunofluorescence intensities of vGlut1 (B), GABAA receptor (C), gephyrin (D), GluR1 (E), vGAT (F) and the bouton size as identified by eGFP fluorescence area (G) show values for individual cells (dots) and means ± SEM. Cells were obtained from three independent culture preparations. ANOVA with Tukey’s multiple comparison test was performed on 29–45 cells per condition. (B) F(4, 203) = 0.58, p = 0.68. (C) F(4, 203) = 103.6, p < 0.0001. (D) F(3, 81) = 135.2, p < 0.0001. (E) F(3, 108) = 28.8, p < 0.0001. (F) F(3, 104) = 0.30, p = 0.88. (G) F(3, 306) = 1.0, p = 0.51. Significances of post hoc test in comparison to α2δ-2 are indicated by asterisks (*** p < 0.0001). Scale bar, 1 µm.
Ijms 23 09885 g007
Figure 8. α2δ subunits and Cachd1 differentially affect presynaptic calcium transients. Mean sample traces (A), cumulative frequency distribution blots (B), and quantification (C) of presynaptic calcium signals (SynGCaMP6f) in wildtype neurons overexpressing either α2δ or Cachd1 constructs. Overexpression of α2δ-4 led to a reduction in presynaptic calcium signals in response to stimulation with 1 AP, 3 AP and 10 AP (blue) compared to control (green). In contrast, overexpression of α2δ-1 (orange) and Cachd1 (purple) increased calcium transients in all stimulation paradigms, as indicated in the mean sample traces and the maximal responses. Quantification shows values for individual cells (dots) and means ± SEM. 37–53 cells were obtained from four independent culture preparations (number of synapses analyzed: SynGCaMP6f, 1257; α2δ-1, 1122; α2δ-4, 1806; Cachd1, 1650). ANOVA with Tukey’s multiple comparison test: 1 AP: F(3, 244) = 6.4, p = 0.0004; 3 AP: F(3, 185) = 4.7, p = 0.0036; 10 AP: F(3, 183) = 8.7, p < 0.0001. Significances of post hoc tests between conditions are indicated in the graphs by asterisks (*** p < 0.001, ** p < 0.01, * p < 0.05).
Ijms 23 09885 g008
Figure 9. Structural interface analysis revealed preferences in complex formation. (A) Cryo-EM structure of the human CaV2.2 calcium channel complex (PDB code: 7MIY), with the α1 subunit (light blue) and α2δ-1 (green.) Next to the membrane view, the complex is opened up to show the interaction interface between α2δ-1 (top) and α1 (bottom). Residues engaging in the subunit interactions are labelled and shown in sphere representation with the respective charges (blue, positive and red, negative). (B) Models of opened complexes (α2δ-1, top and α1, bottom) of the CaV2.1 α1 subunit with mouse α2δ-1, human α2δ-4, and mouse Cachd1. The predicted interacting residues are labelled and shown in sphere representation in the respective charges (blue, positive, and red, negative); additional interacting residues are labelled in bold. Refer to text for description.
Ijms 23 09885 g009
Table 1. List of antibodies.
AntibodyDilutionSource
Anti-HA1:100 (LIVE/A594)Roche (Mannheim, Germany) (catalog #11867423001)
Anti-GABAARβ2/31:500 (A594)Millipore (Darmstadt, Germany) (catalog #MAB341)
1:250 (A350)Millipore (catalog #MAB341)
Anti-gephyrin1:2000 (A594)Synaptic Systems (Göttingen, Germany) (catalog #147 021)
Anti-GLUR11:1000 (A594)Upstate (Lake Placid, NY, USA) (catalog #06-306)
Anti-PSD-951:1000 (A594)Thermo Fisher Scientific (Waltham, MA, USA) (catalog #MA1-045)
Anti-synapsin11:500 (A350)Synaptic Systems (catalog #106 011)
Anti-vGLUT11:2000 (A350)Synaptic Systems (catalog #135 002)
Anti-vGLUT11:500 (A594)Synaptic Systems (catalog #135 511)
1:250 (A350)Synaptic Systems (catalog #135 511)
Anti-vGAT1:500 (A350)Synaptic Systems (catalog #131 002)
Anti-Cav2.1 1:2000 (A594)Synaptic Systems (catalog #152203)
Anti-Cav2.21:2000 (A594)Synaptic Systems (catalog #152313)
Goat anti-Mouse IgG, Alexa Fluor 3501:500Thermo Fisher Scientific (catalog #A-21049)
Goat anti-Rabbit IgG, Alexa Fluor 3501:500Thermo Fisher Scient (catalog #A-21068)
Goat anti-Mouse IgG, Alexa Fluor 5941:4000Thermo Fisher Scientific (catalog #A-11032)
Goat anti-Rabbit IgG, Alexa Fluor 5941:4000Thermo Fisher Scientific (catalog #A-11037)
Goat anti-Rat IgG, Alexa Fluor 5941:4000Thermo Fisher Scientific (catalog #A-11007)
Publisher’s Note: MDPI stays neutral with regard to jurisdictional claims in published maps and institutional affiliations.

