
Impact on Inference Model Performance for ML Tasks Using Real-Life Training Data and Synthetic Training Data from GANs


SHS—Stahl-Holding-Saar GmbH & Co. KGaA, 66763 Dillingen, Germany
*
Author to whom correspondence should be addressed.
Information 2022, 13(1), 9; https://doi.org/10.3390/info13010009
Submission received: 12 November 2021
/
Revised: 16 December 2021
/
Accepted: 22 December 2021
/
Published: 28 December 2021
(This article belongs to the Special Issue Cognitive Digital Twins: Challenges and Opportunities for Process and Manufacturing Industries)
Abstract
:Collecting and labeling of good balanced training data are usually very difficult and challenging under real conditions. In addition to classic modeling methods, Generative Adversarial Networks (GANs) offer a powerful possibility to generate synthetic training data. In this paper, we evaluate the hybrid usage of real-life and generated synthetic training data in different fractions and the effect on model performance. We found that a usage of up to 75% synthetic training data can compensate for both time-consuming and costly manual annotation while the model performance in our Deep Learning (DL) use case stays in the same range compared to a 100% share in hand-annotated real images. Using synthetic training data specifically tailored to induce a balanced dataset, special care can be taken concerning events that happen only on rare occasions and a prompt industrial application of ML models can be executed without too much delay, making these feasible and economically attractive for a wide scope of industrial applications in process and manufacturing industries. Hence, the main outcome of this paper is that our methodology can help to leverage the implementation of many different industrial Machine Learning and Computer Vision applications by making them economically maintainable. It can be concluded that a multitude of industrial ML use cases that require large and balanced training data containing all information that is relevant for the target model can be solved in the future following the findings that are presented in this study.
1. Introduction
Computer Vision techniques have seen significant advances in recent years and are increasingly seeing applications in industrial contexts. In particular, Deep Learning-based approaches have been responsible for many breakthrough results in past years [1,2]. However, a drawback of these techniques is their demand for very large training data sets [3,4], which can be hard or even impossible to obtain when limited to real-life training data. Apart from the need for labeling real-life data, real-life data sets are prone to imbalances as, e.g., rare or uncommon situations tend to be underrepresented, which can affect model performance on these classes [5]. In addition, some imbalances may be hard to detect without extensive examinations. A way to address these issues can be the generation of synthetic training data, a field of research that has garnered increasing interest in past years [4,6,7]. Approaches reach from physics-based modeling techniques as in [8] over classic image augmentation techniques, e.g., [6], to Deep Learning-based modeling as for example in [9,10,11].
Since Deep Learning (DL) has reached process maturity, and DL-based algorithms can be executed on high-performing Graphics Processing Unit (GPU) hardware, new opportunities have come up to augment the production machinery with artificial intelligence. The steel production process is well-established and has been optimized over many years, rendering the appearance of anomalies or aberrations rare. While an anomaly detection does not necessarily rely on data representing the anomalous state, tasks requiring a classification of different anomalies do require data providing characterizations of the various anomalies. If an anomaly classification should be carried out using DL models, a great number of relevant training data are needed in order to develop a model with good performance. Depending on the use case, anomalies are so uncommon in production that the data collection process would take too much time before a model could be trained.
Hence, a synthetic generation of appropriate data is needed to allow for the training of Machine Learning (ML) and DL algorithms. In this work, a hybrid approach for image synthesis was developed combining classical Computer Vision (CV) and Deep Learning techniques. This work is part of the scope of the COGNITWIN project use case pilot on a tracking system in the steel manufacturing industry. The concept of Digital Twin (DT) has attracted increasing attention in the industrial sector and is seen as an enabling technology for Industry 4.0 [12,13].
The research question this work aims to address is the impact of the usage of synthetic training data as compared to real-life training data on the performance of a Deep Learning-based instance recognition/detection models for images. While there have been other studies investigating a workflow for image synthesis and the usage of synthetic training data for CV models, such as [6,9,10,11], a direct comparison of model performances based on the proportion of synthetic training data used and an investigation of performance on subclasses of particular interest is a novel contribution to the best of the authors’ knowledge. For the first time, the actual impact of using synthetic training data as compared to real-life training data on the performance of a DL model is evaluated systematically, providing a new perspective and insights on the training data side of a DL approach. The authors present a novel framework for realizing DL tasks, combining synthetic training data and real-life training data, and thereby also addressing many current hindrances to the applicability of the DL model research results in industrial settings. The novel framework is independent of a particular DL model used for the inference task at hand. Most academic research on DL focuses on abstract use cases with ample data available, whereas research questions tackling the usage or even usability of DL in less-than-ideal settings are often neglected in the scientific community. In academic research, DL approaches are mostly rated purely by model performance metrics, but when it comes to the applicability of DL to real-life tasks, a broader approach for assessing DL solutions’ merit is needed, taking the efficiency into account. Our framework precisely addresses this problem by showcasing an efficient implementation of DL independently of the particular inference model used for the task at hand. We hope to provide useful guidelines for the usage of synthetic training data in DL-based Computer Vision tasks and that our work will be beneficial for many areas of industry, helping to increase the applicability of DL techniques to industrial settings.
This paper is structured as follows: In Section 2, we begin with a short description of the regarded Use Case and an introduction to Generative Adversarial Networks (GANs), which were used for the generation of synthetic training data in this work, followed by a brief description of the methodology of synthesizing the desired images. After this, a more detailed description of the design of the conducted experiments is added. Section 3 presents the results and discusses them. Section 4 concludes the study and introduces opportunities for future research.
2. Materials and Methods
The study conducted in this paper is composed of two major components: a Generative Adversarial Network (GAN) that is embedded into a workflow for synthesizing stamped billet images and a Faster R-CNN for the stamp detection. Both build the basis for the analysis of the impact of synthetic training data on the training of a neural network for object detection.
2.1. Use Case
In our steel mill, different steel grades are continuously casted into billets of different lengths and dimensional variations. The newly formed billets are tagged right after being casted by stamping a series of digits and letters onto the frontal area while the material is still hot and therefore soft. These stamps are used to identify each billet individually during the manufacturing process. At rare intervals, stamps are partially imprinted only or arise in a defective shape. Collecting training data that contain an adequate amount of these special cases is time consuming. Accordingly, a workflow for generating artificially stamped billets is needed to enrich and complete our training data base that currently consists of annotated real image data only.
2.2. Stamp Synthesis Using a cGAN
Our synthesis process consists of three sequential steps: training data segmentation, conditional Generative Adversarial Network (cGAN) training, and evaluation. In the first step, a segmentation of real stamp examples was carried out in order to generate a pair of mask and target result that can be used to train the cGAN in the following step. Finally, the evaluation was conducted by subjective visual assessment of the synthetic stamps in the last step.
2.2.1. Segmentation/Training Data Preparation
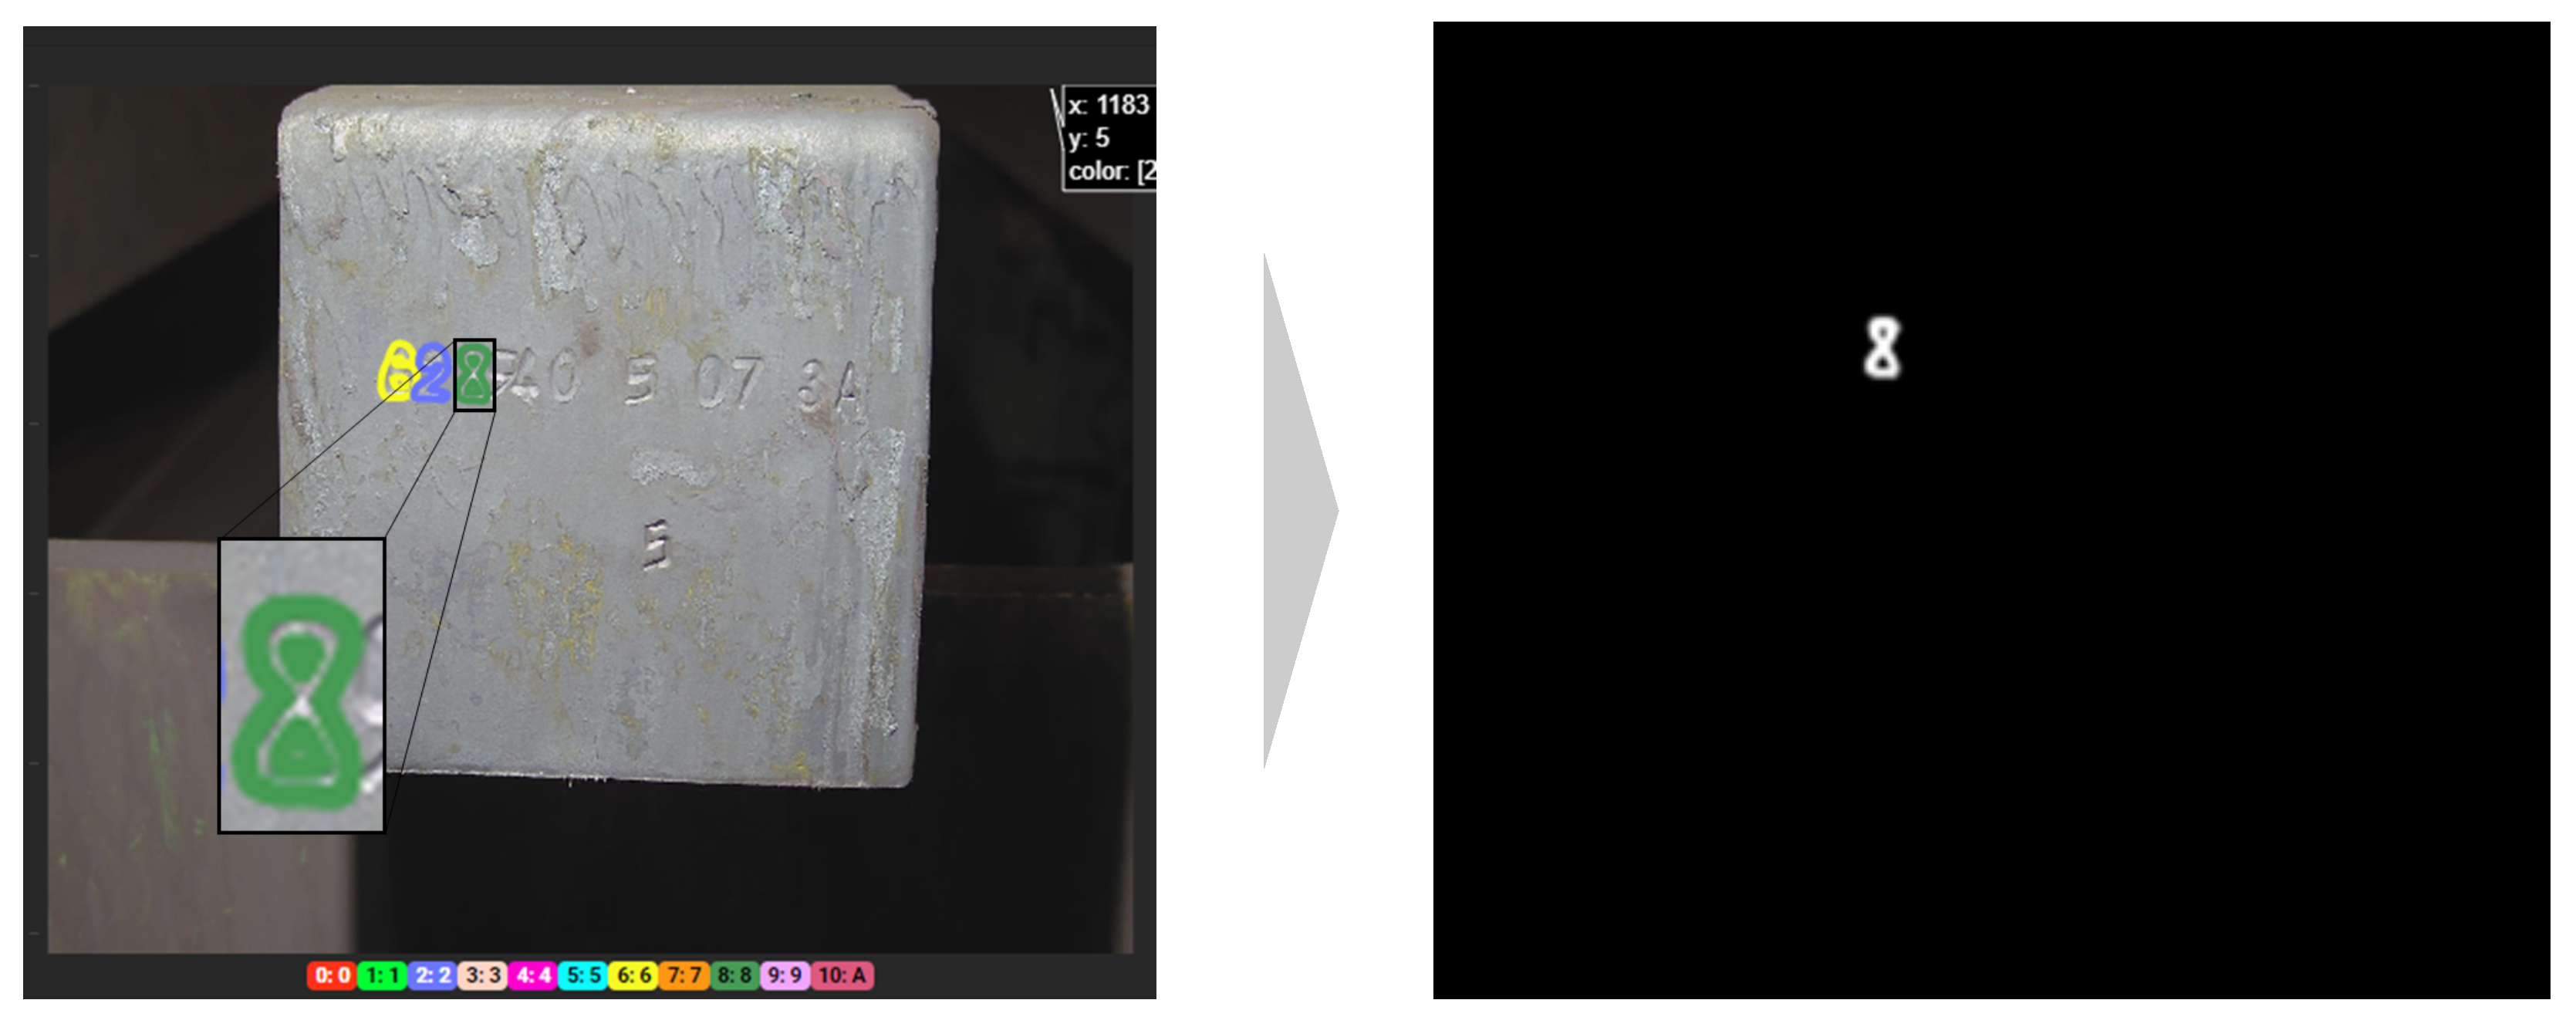
The segmentation was conducted by discretizing the outline of a stamp with a polygonal shape, which was defined by a finite quantity of pairs of values. Each polygon was converted into a binary segmentation mask that showed sufficient accuracy, as shown in Figure 1. Overall, a basis of 417 training examples and a validation set of 108 stamps were prepared.
2.2.2. Training of the Conditional Adversarial Network
In recent years, many researchers have developed specialized architectures of neural networks to generate entirely artificial images [14,15]. The results that can be achieved using GANs are becoming more sophisticated to such an extent that these techniques also seem to be applicable to industrial usage.
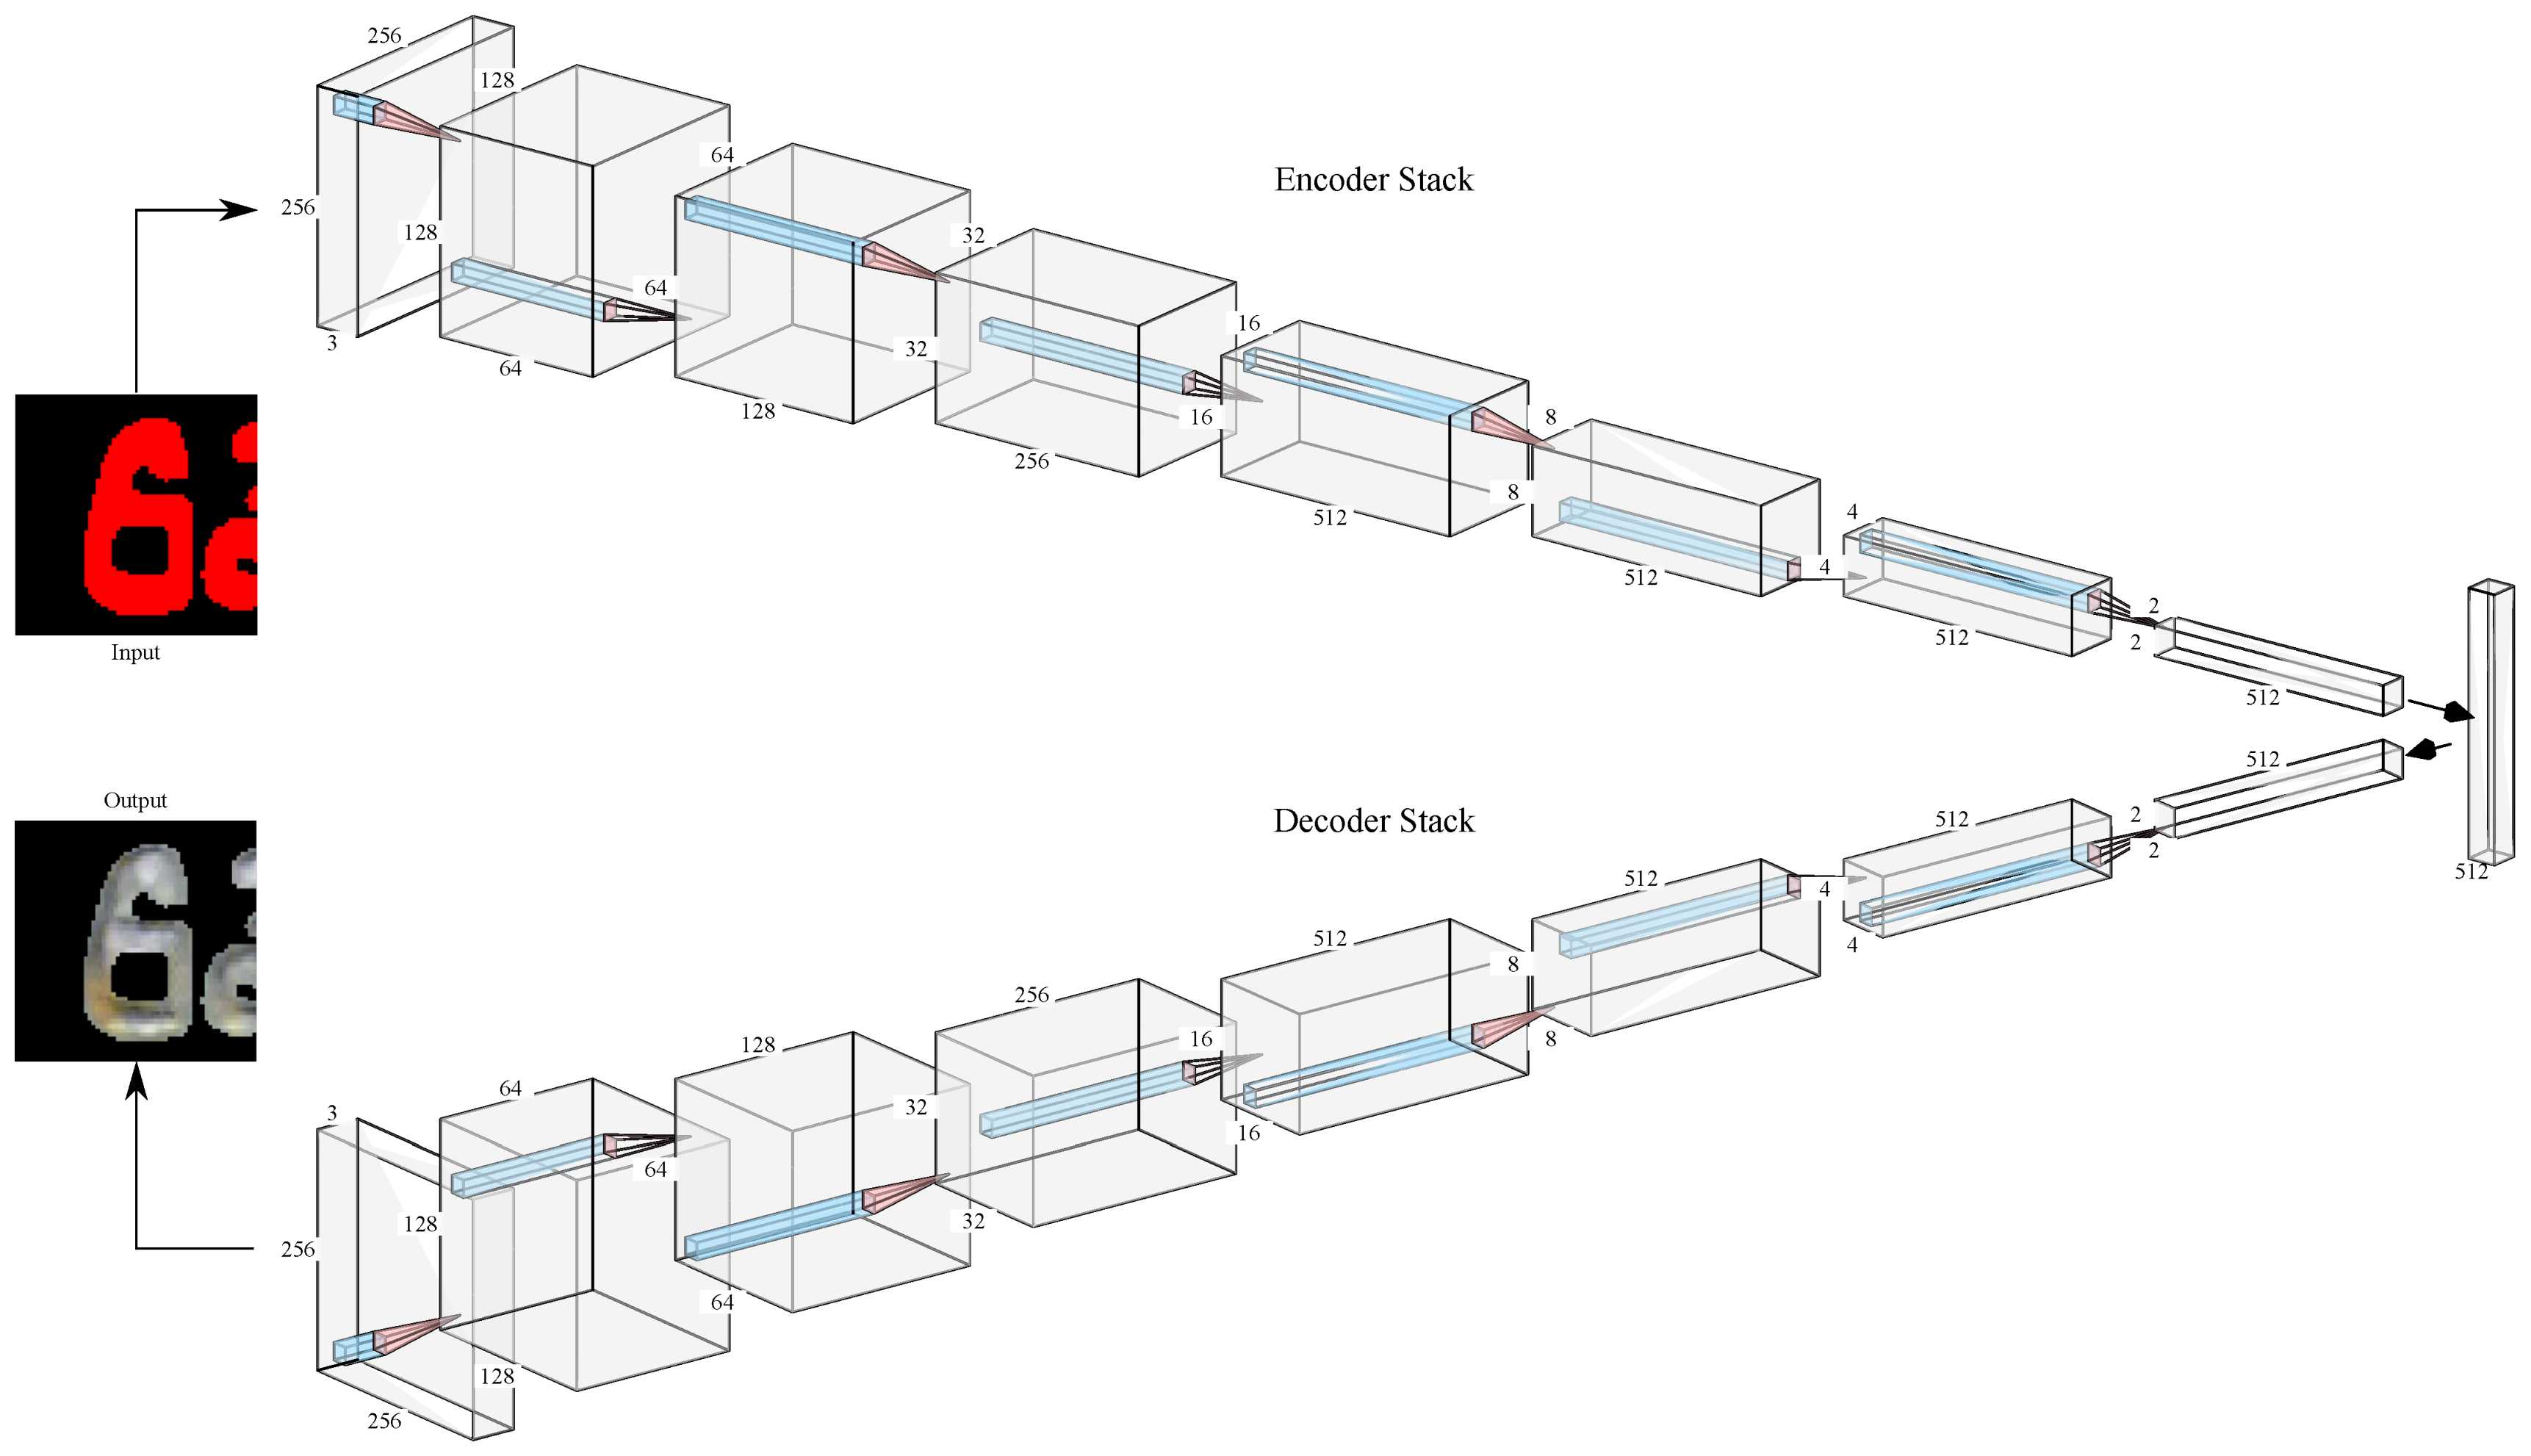
The cGAN architecture used in this study is a Conditional Adversarial Network developed by Isola et al. [16] that performs particularly well on highly structured graphical outputs. Summing up [16], the architecture of the models will be explained in this section. The composite of neural networks consists of a generator with an architecture based on U-Net and a discriminator representing a convolutional PatchGAN classifier. The groundbreaking conception of this specific Deep Learning approach is the interaction between the generator and the discriminator. This setup is comparable to an art critic (the discriminator network) who criticizes a painting (of the generator network representing the artist). This procedure is carried out for as many iterations as it takes until the critic cannot distinguish between the synthetically generated and the original painting. The generator architecture consists of an ensemble stack and a decoder stack of convolutional layers (cf. Figure 2) and produces a synthetic output image based on the input image that represents a binary mask of the to be rendered stamp. Over all n layers, each layer between i and involves a skip connection where the activations are concatenated.
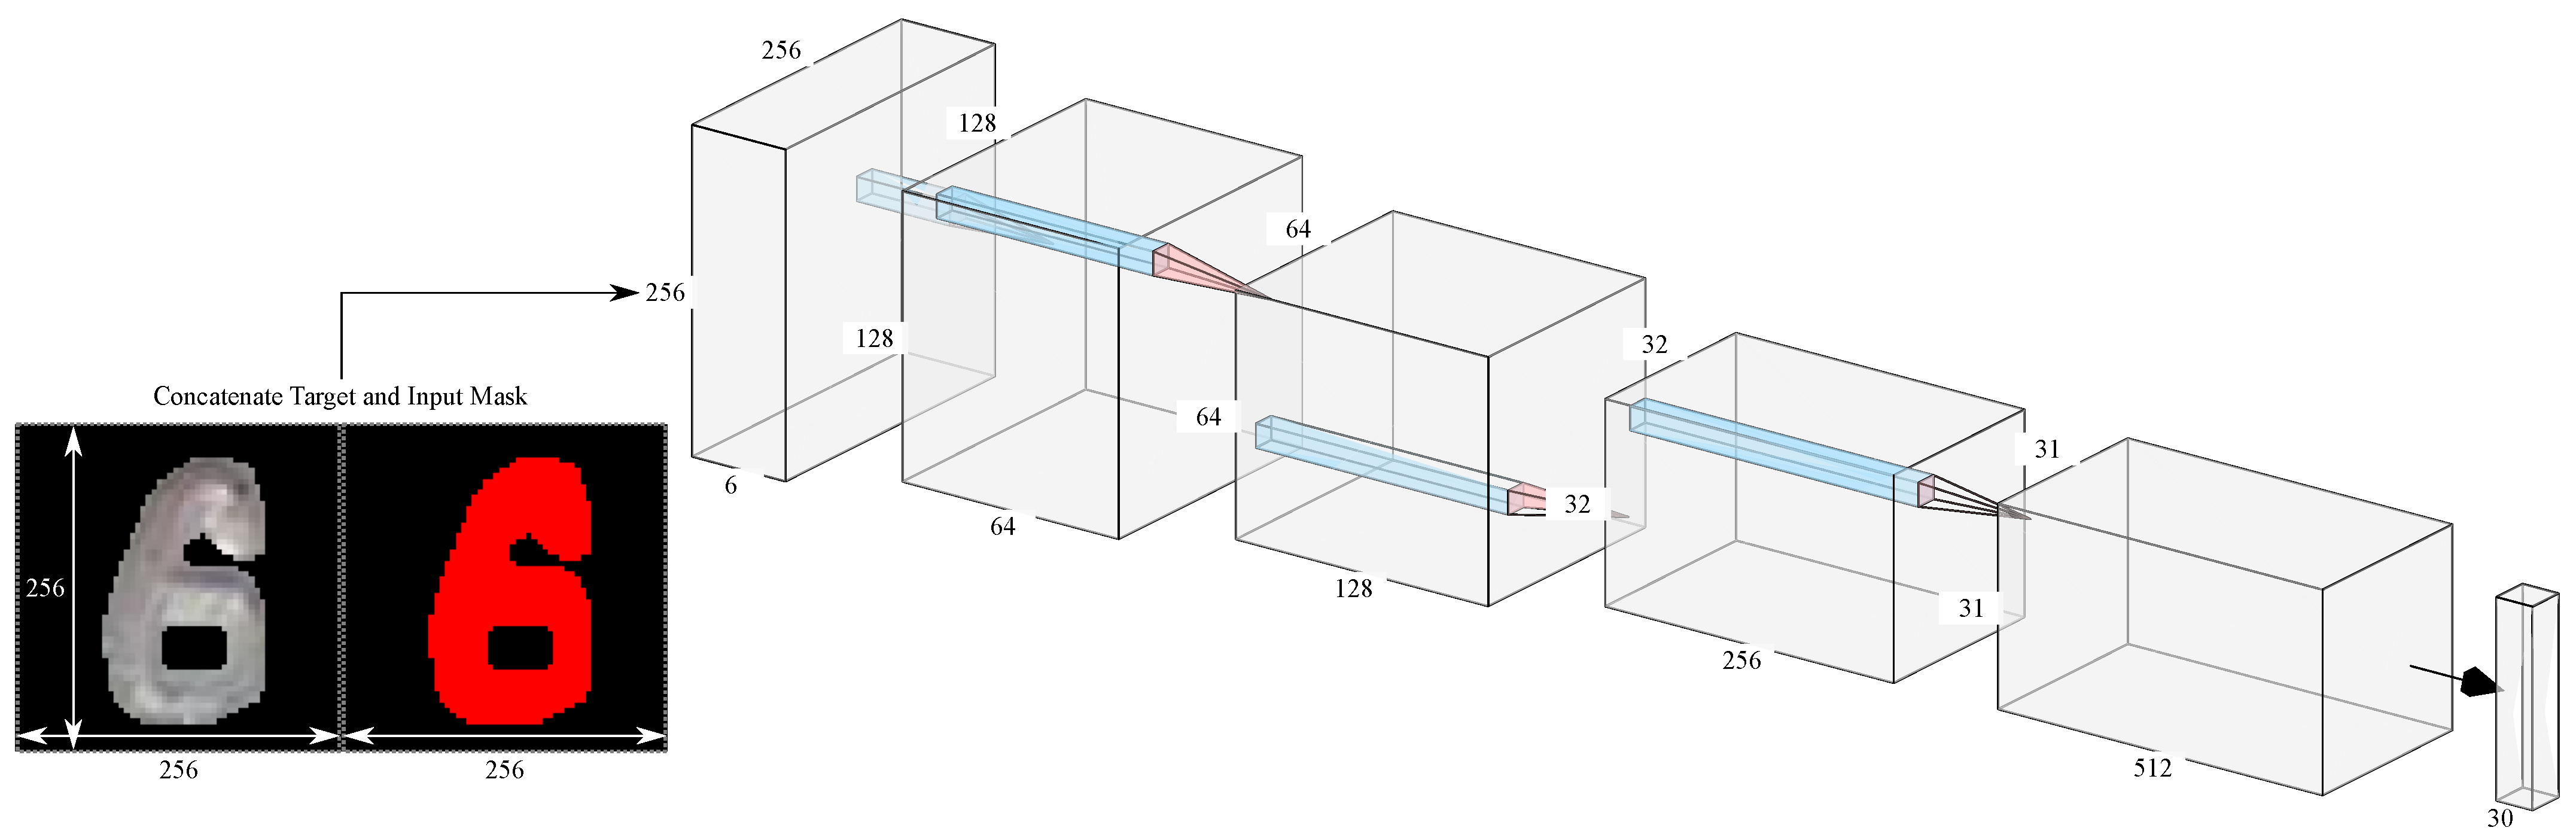
The discriminator represents a convolutional PatchGAN classifier (cf. Figure 3) that takes the stamp mask and the generated image (synthetic example) or target image (real example) as input. Based on these input images, the discriminator guesses which image is the real one. The discriminator is then optimized based on the classification error.
After the discriminator weights were updated the generator’s weights are adapted based on the disagreement between the generated and the target image.
Both neural networks, the generator and the discriminator, were trained against each other over a total amount of 40,000 training steps. Every 5000 steps, a training checkpoint was saved in order to preserve a snapshot of the generators’ ability to focus on specific characteristics of the stamping, such as texture and coloration.
2.2.3. Evaluation
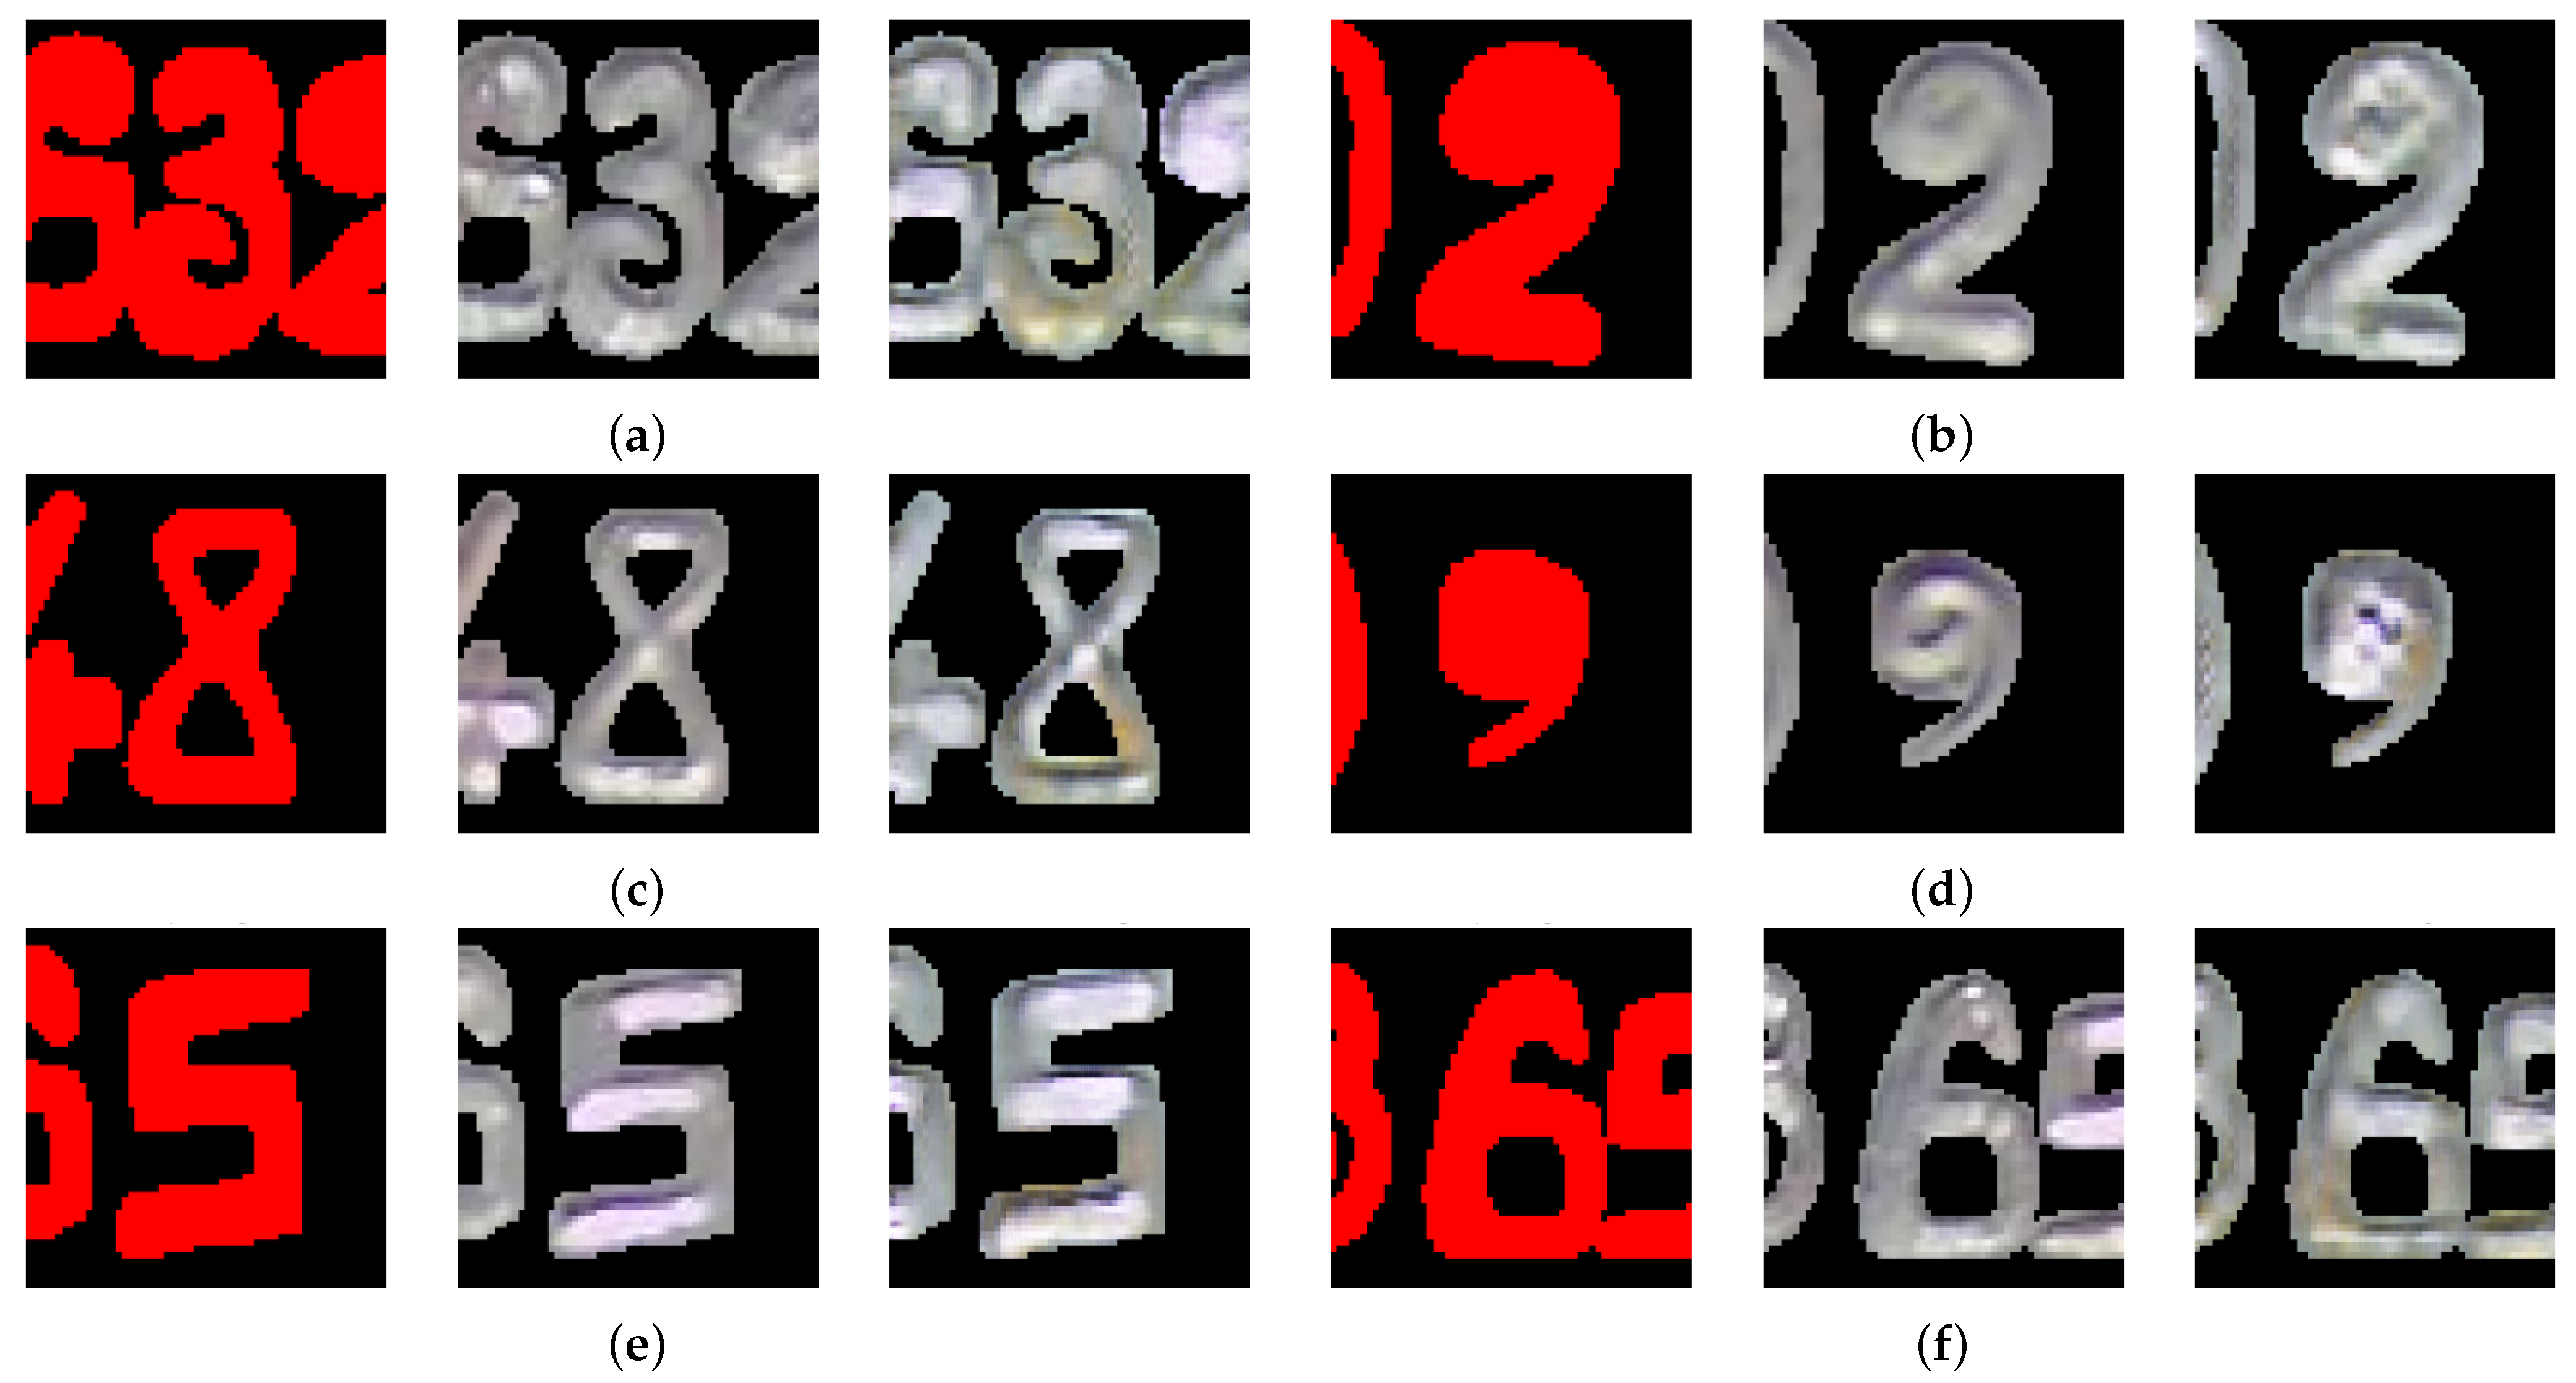
Figure 4 shows a selection of results of the trained generator network. Each subfigure shows the input image on the left, the target image in the middle, and the result of the GAN output on the right.
Overall, the synthetic renderings of the stamps show very good results. Even rust is partially included in the synthesis, e.g., in Figure 4a. However, more complicated shapes of stamping are not well represented; spiral imprinting especially shows unrealistic artifacts, for example, in Figure 4b,d. The generated stamps predominantly appear to be realistic regarding the texture, lighting, and coloration.
2.2.4. Hybrid Approach for Stamp Synthesis
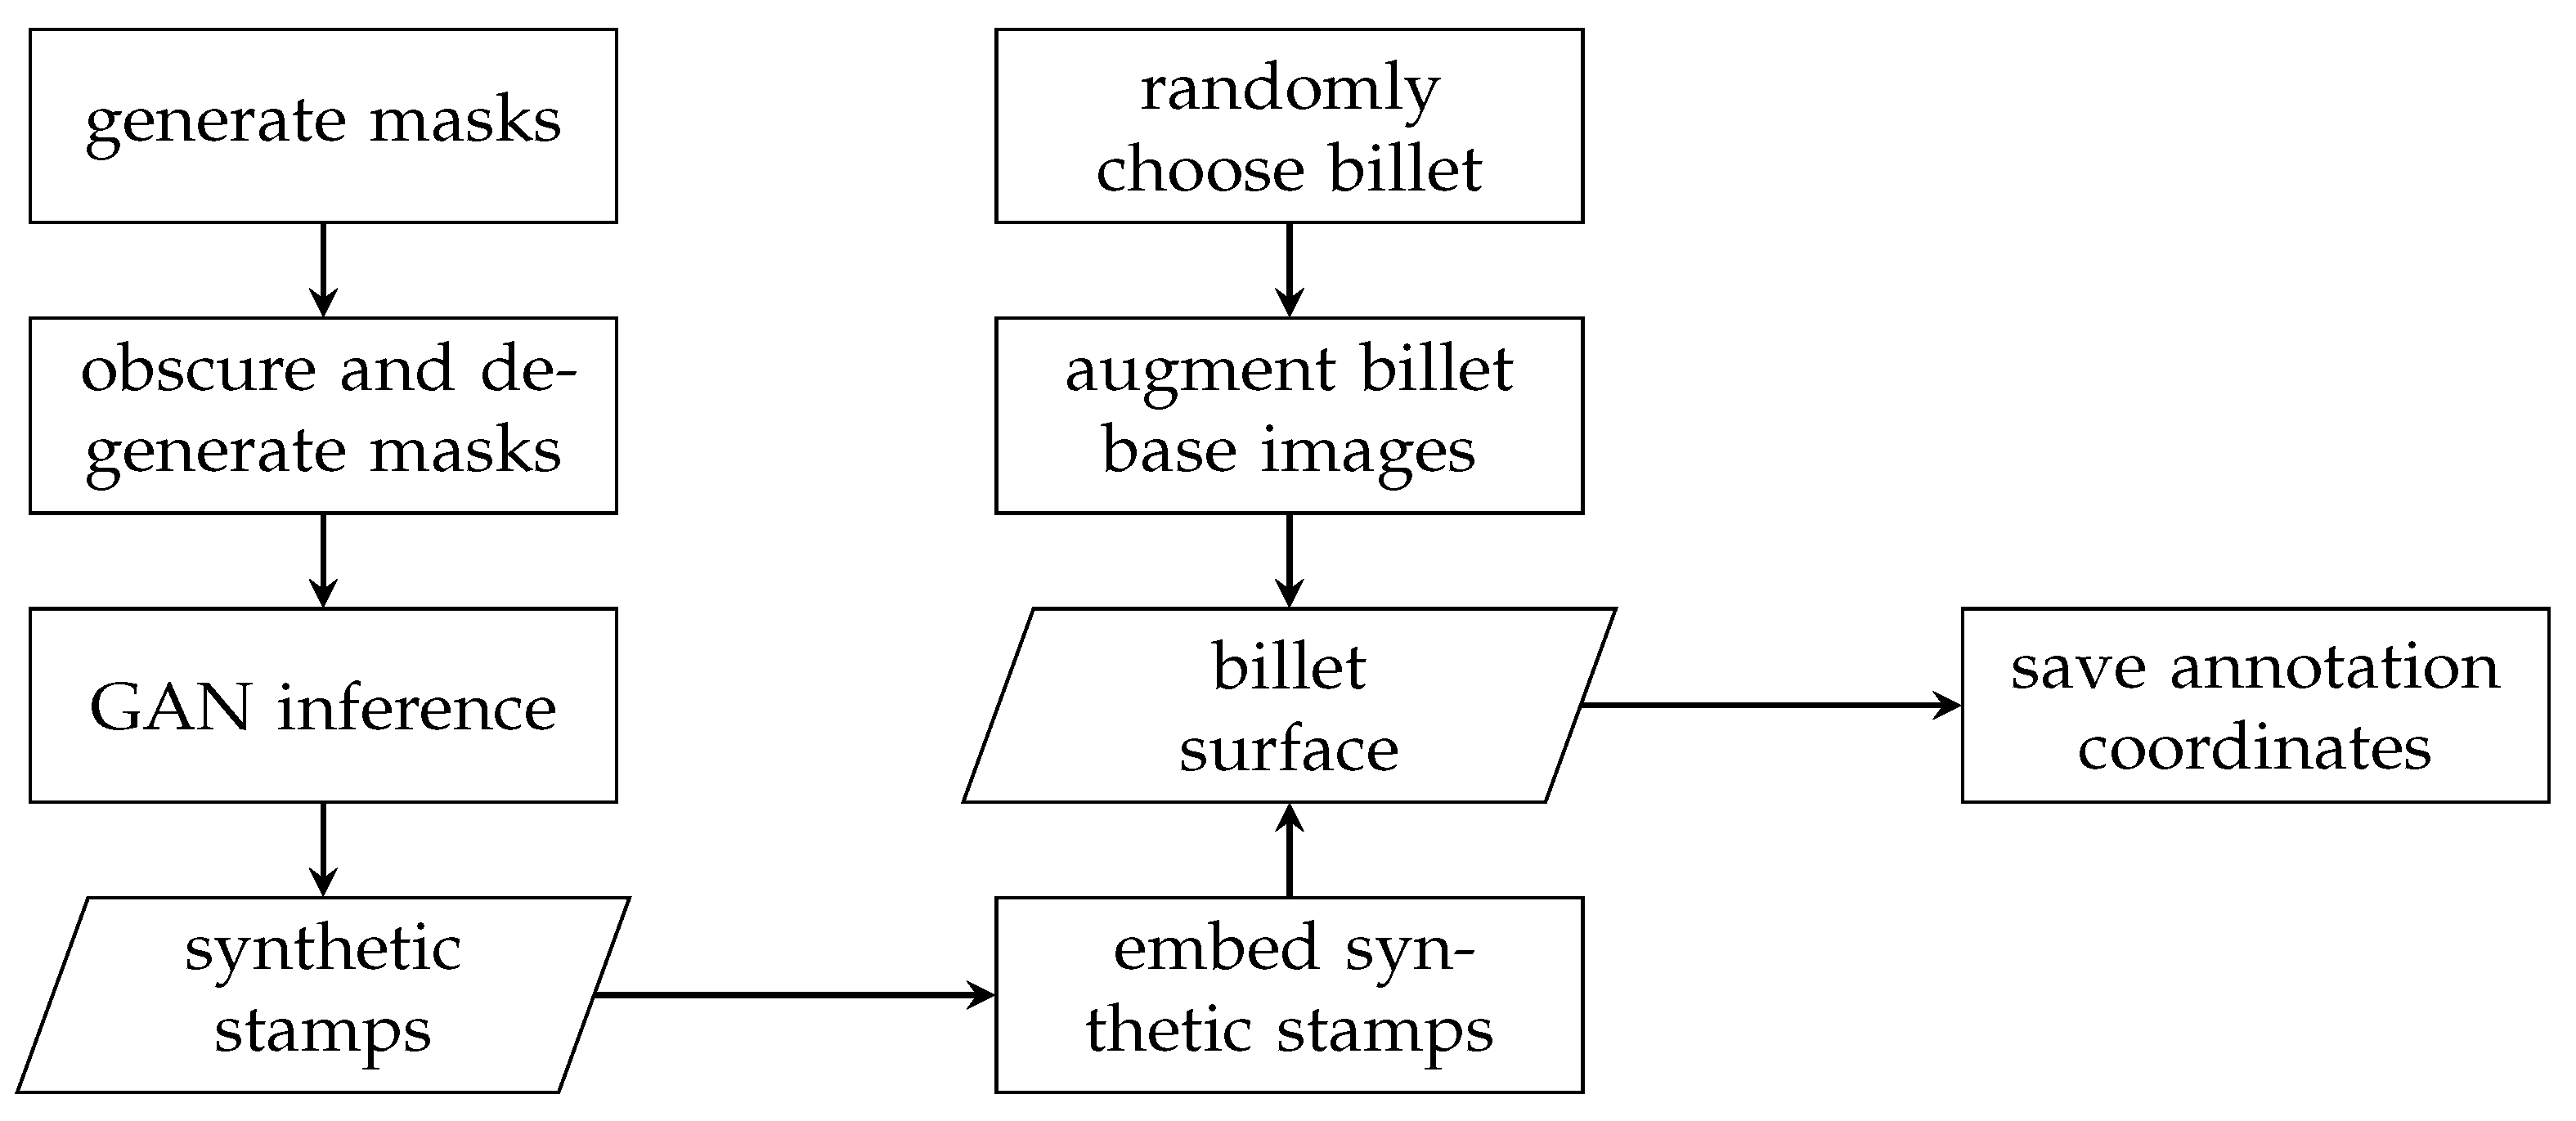
The main goal of the stamp synthesis was to generate training data that represent the high variance of the real application as well as special cases that occur infrequently. Figure 5 summarizes the steps that are necessary for generating relevant synthetic image material of artificially stamped billets using a hybrid approach that combines conventional and Deep Learning-based Computer Vision techniques.
In the first step, mask images of the to be synthesized stamps are generated using a heuristic approach. The basis for the mask generation are pre-defined pairs of numbers that describe the area of the stamping for each distinct digit and letter, respectively. This includes additional open parts that several numbers show, e.g., the two cutout parts of an eight. This information is used to obtain mask arrays that are randomly degraded by erasing individual parts and deformed in order to gain individual and unique input masks for the generator. Primarily, the prevention of the to be trained detector network of overfitting to the ideal contour of a digit was the motivation of the randomization but also to generate synthetic training data that shows enough diversity in relation to the shape of the synthetic stamping. Additionally, different checkpoints of the generator were used to synthesize the stamps since each checkpoint representation showed a different emphasis on particular properties of the result, such as texture and color. This also includes rusty stamps that are rendered incidentally.
After a workflow for a random stamp generation is developed, the synthetic stamps need to be embedded into the billet surface. To create representative training data that includes synthetic stamps, a database of real billet front surface images was prepared. The embedding step randomly picks a surface image of a real billet and randomly modifies its appearance by deforming it slightly and rotating it randomly. Before the synthetic stamps are integrated, Gaussian blurring is used to create a smoother transition between stamp and background. Additionally, the colorspace of each masked stamp was randomly modified to gather different visual appearance and characteristics.
2.3. Methodology and Design of the Experiments
In order to address the research question regarding the impact of the usage of synthetic training data as compared to real-life training data on the performance of a Deep Learning-based instance recognition/detection model for images, the following setup was chosen for a series of experiments.
2.3.1. The Training Process Setup
As a Deep Learning model used to assess the impact of different types of training data, we chose a Faster R-CNN model, first introduced by Ren et al. [17], pretrained on the COCO (Common-Objects-in-Context) dataset [18], as this model is suitable for the task and a is popular, well-documented model with many examples of real-life applications available. We used the model implementation from the TensorFlow Model Zoo [19] using the TensorFlow [20] framework, training went over 165,000 steps, and hyperparameters of the model were left at the standard values of the TensorFlow Model Zoo implementation and were kept fixed over all training runs. Five instances of this model were trained on equally large data sets (2540 images each, of which , i.e., 635, were used for validation runs to assess model convergence and training success and , i.e., 1905, were used for the training itself, with images sized px), featuring different fractions of synthetic and real-life training data, as detailed in Table 1.
Additionally, a sixth instance was trained featuring only real-life data, and only 635 images, i.e., as many real-life images as in Experiment 4, but without the synthetic data added. Of these, , i.e., 159 went into the validation set, and 476 into the training set.
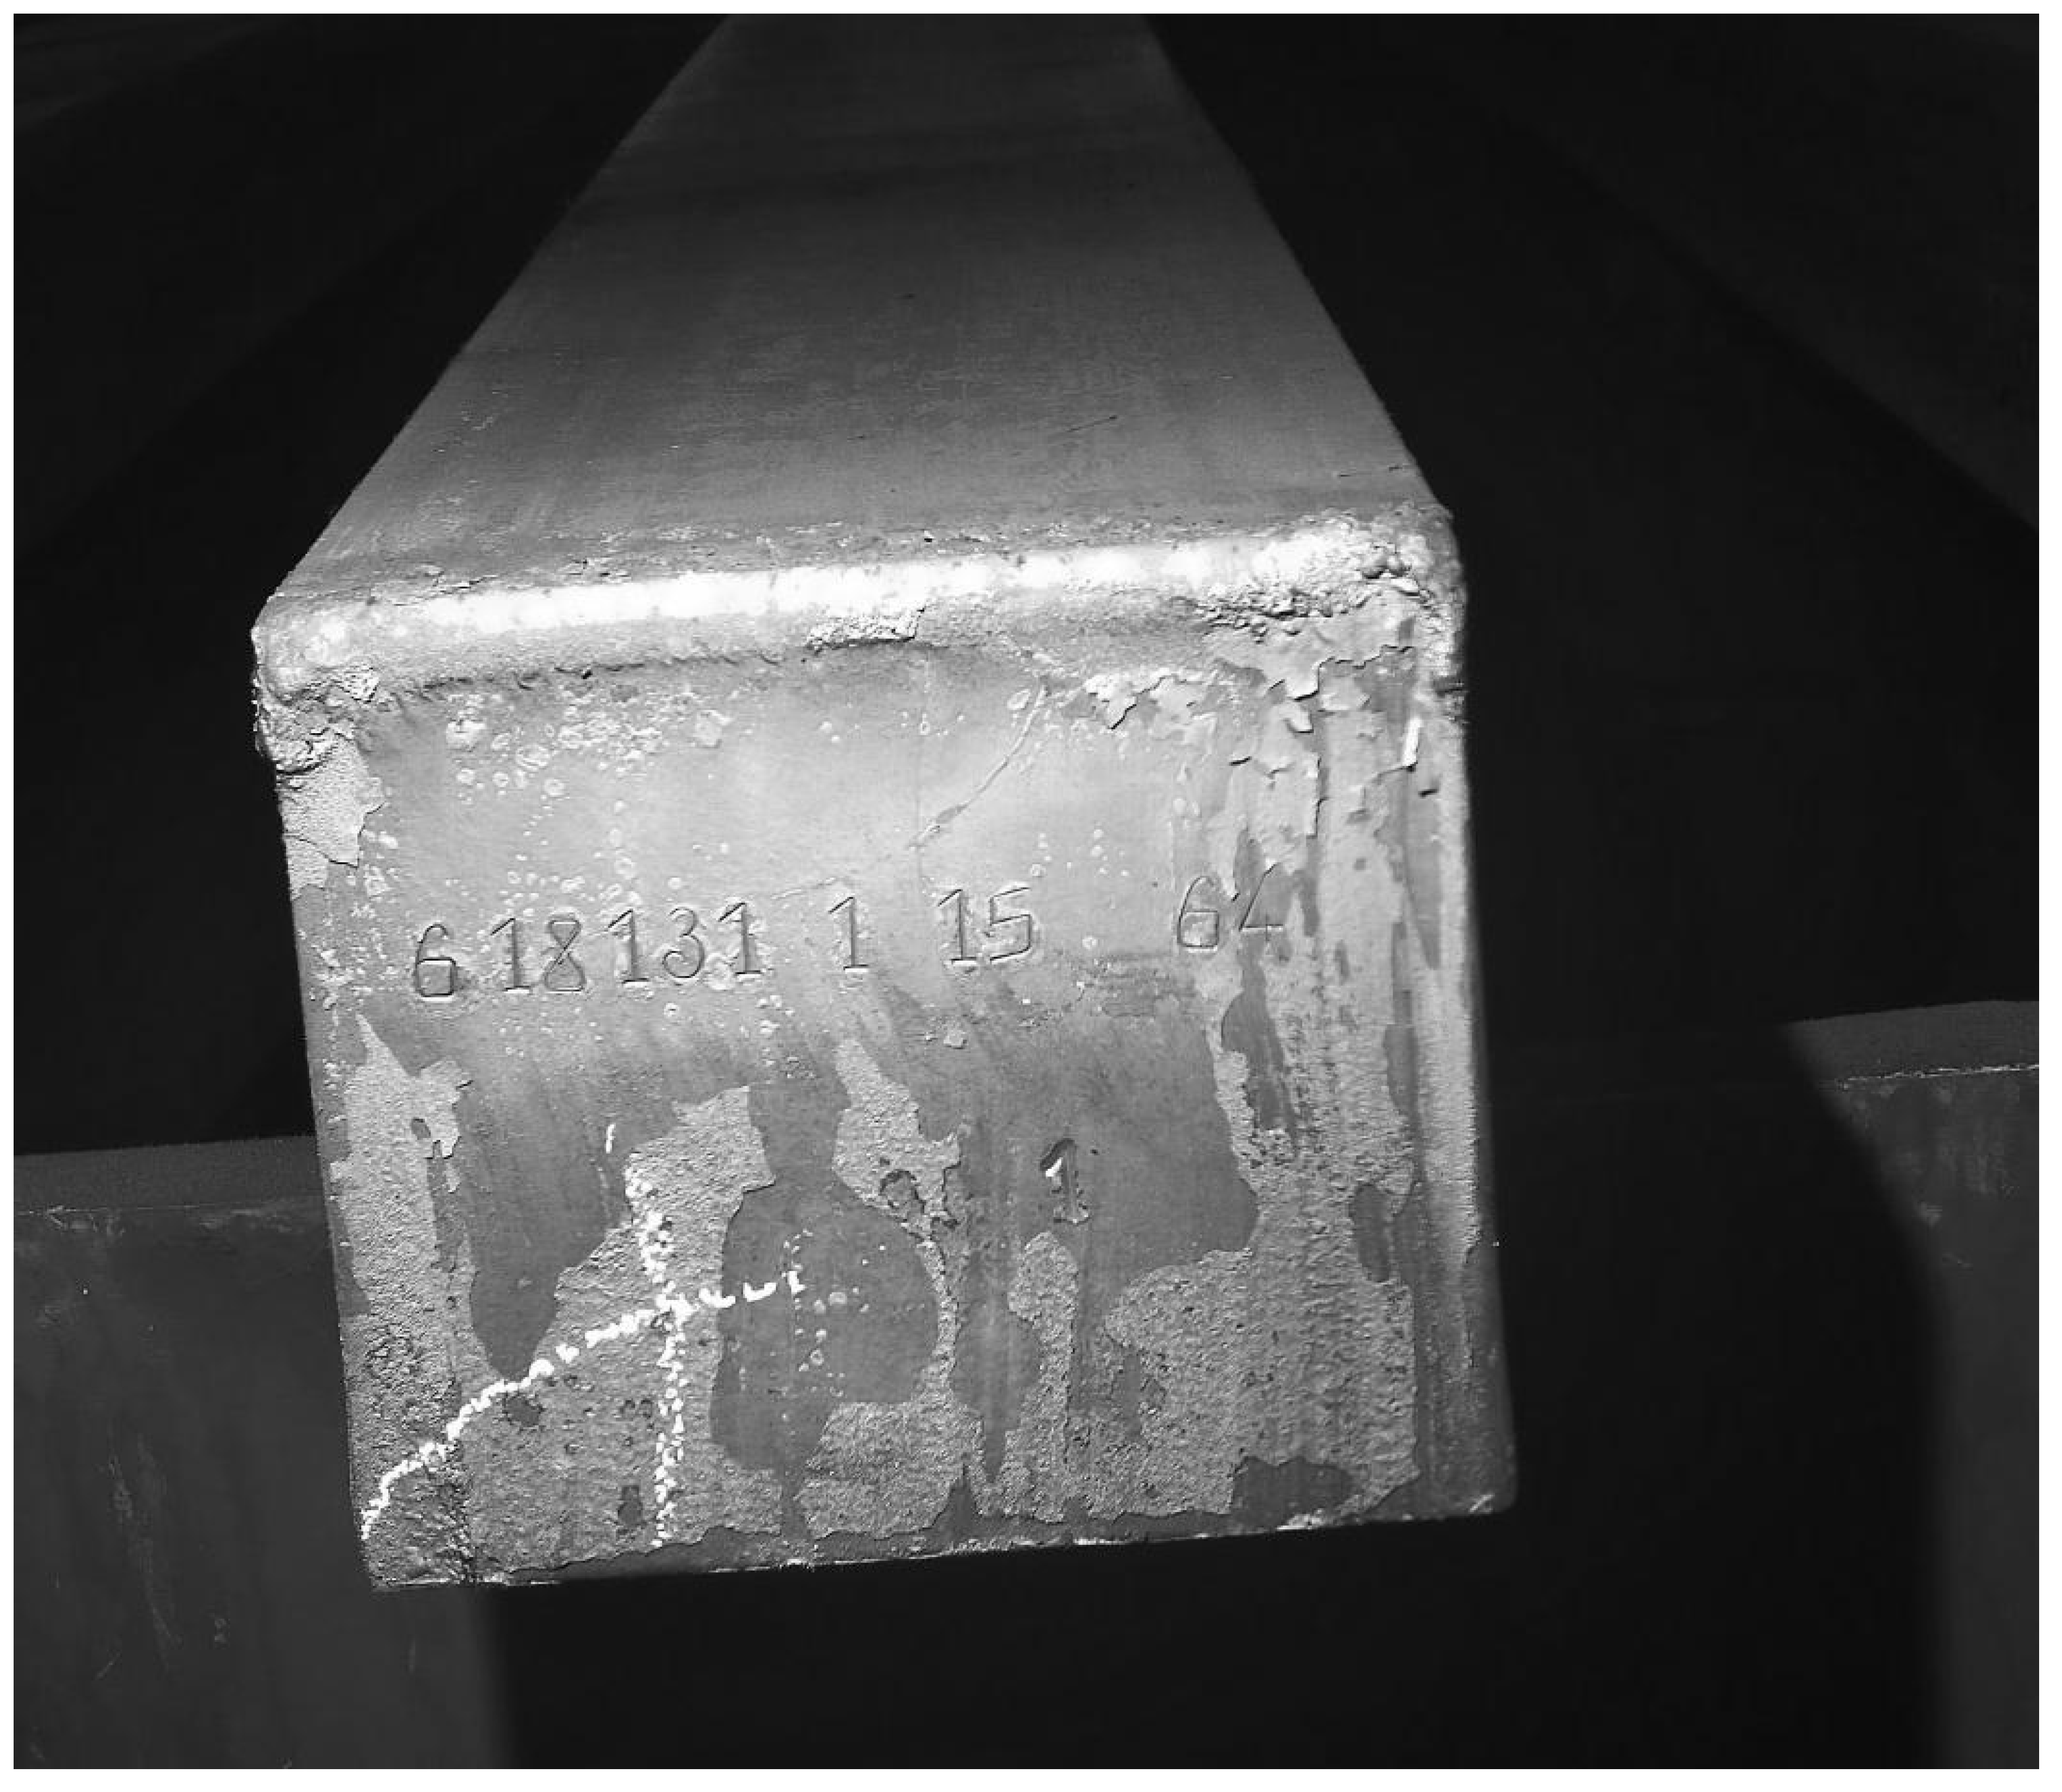
The inference task for the model was to detect and localize digits stamped on steel billets, i.e., elongated cuboid slabs of cast steel, as in Figure 6.
Each billet regularly features 11 digits, although in some cases billets may feature 12 digits, or in other cases fewer than 11 digits (due to e.g., occlusions or surface deformations of the billet). Reading these digits accurately is crucial to a correct production routine and for a smooth automatized workflow in the steel manufacturing process, motivating attempts at using the potential of AI-powered tools for the task.
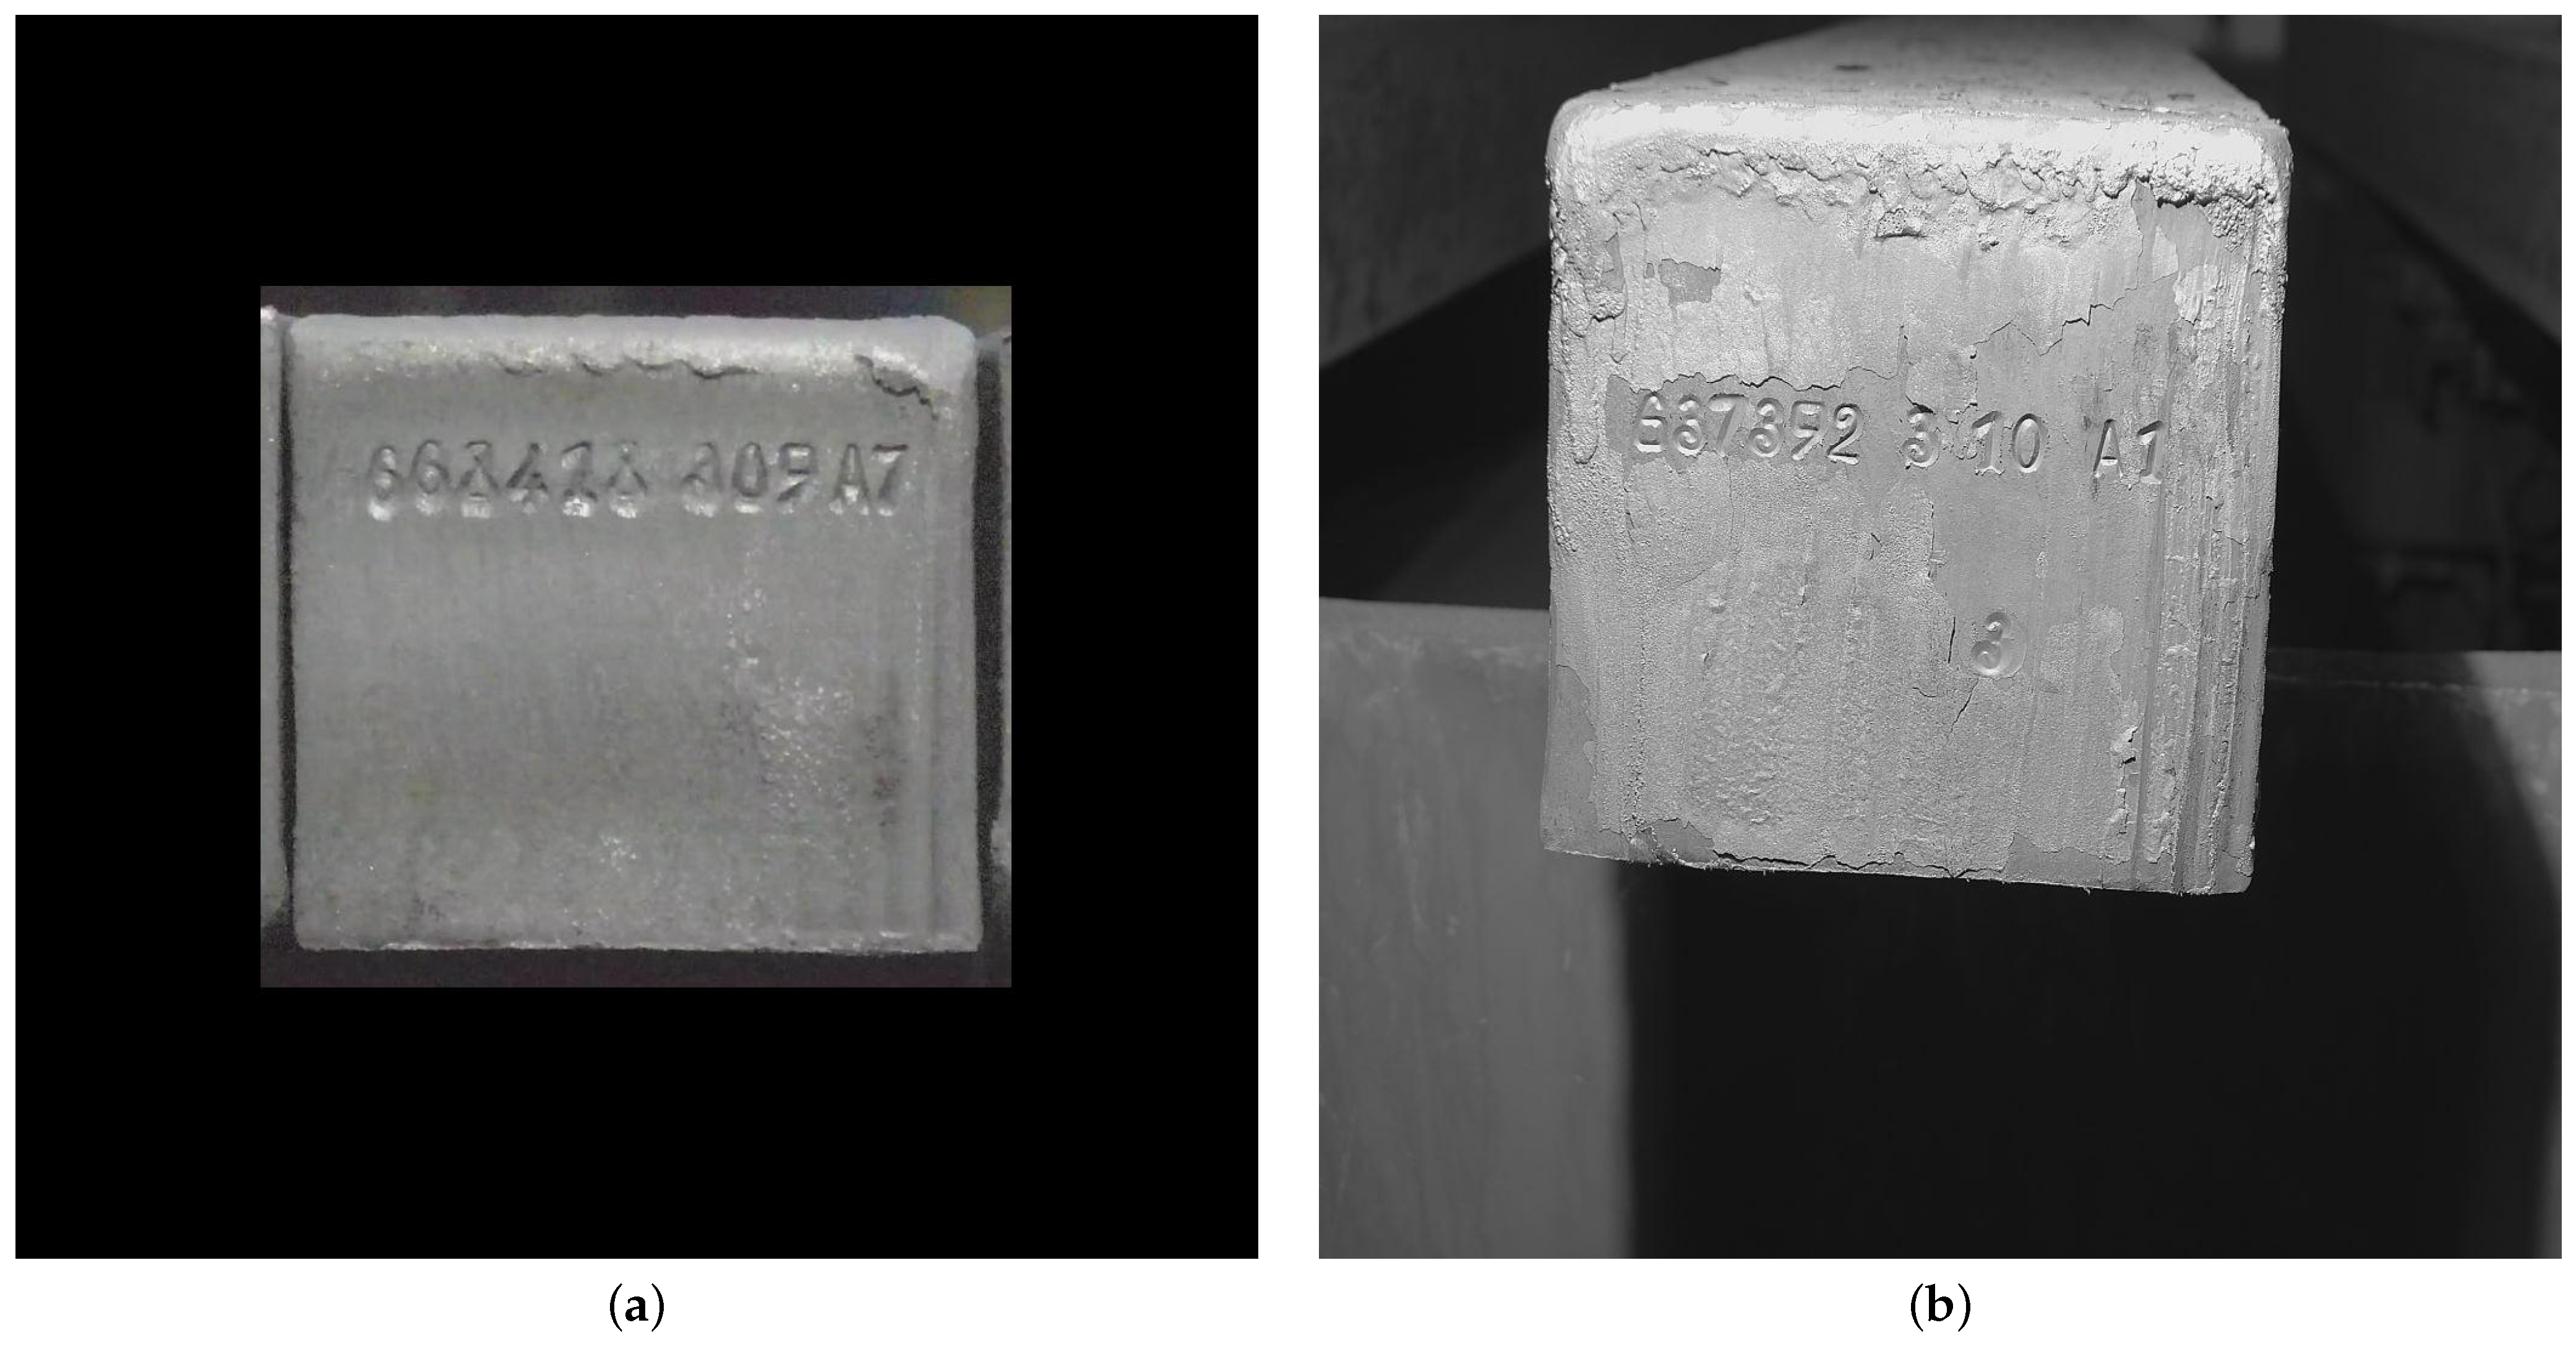
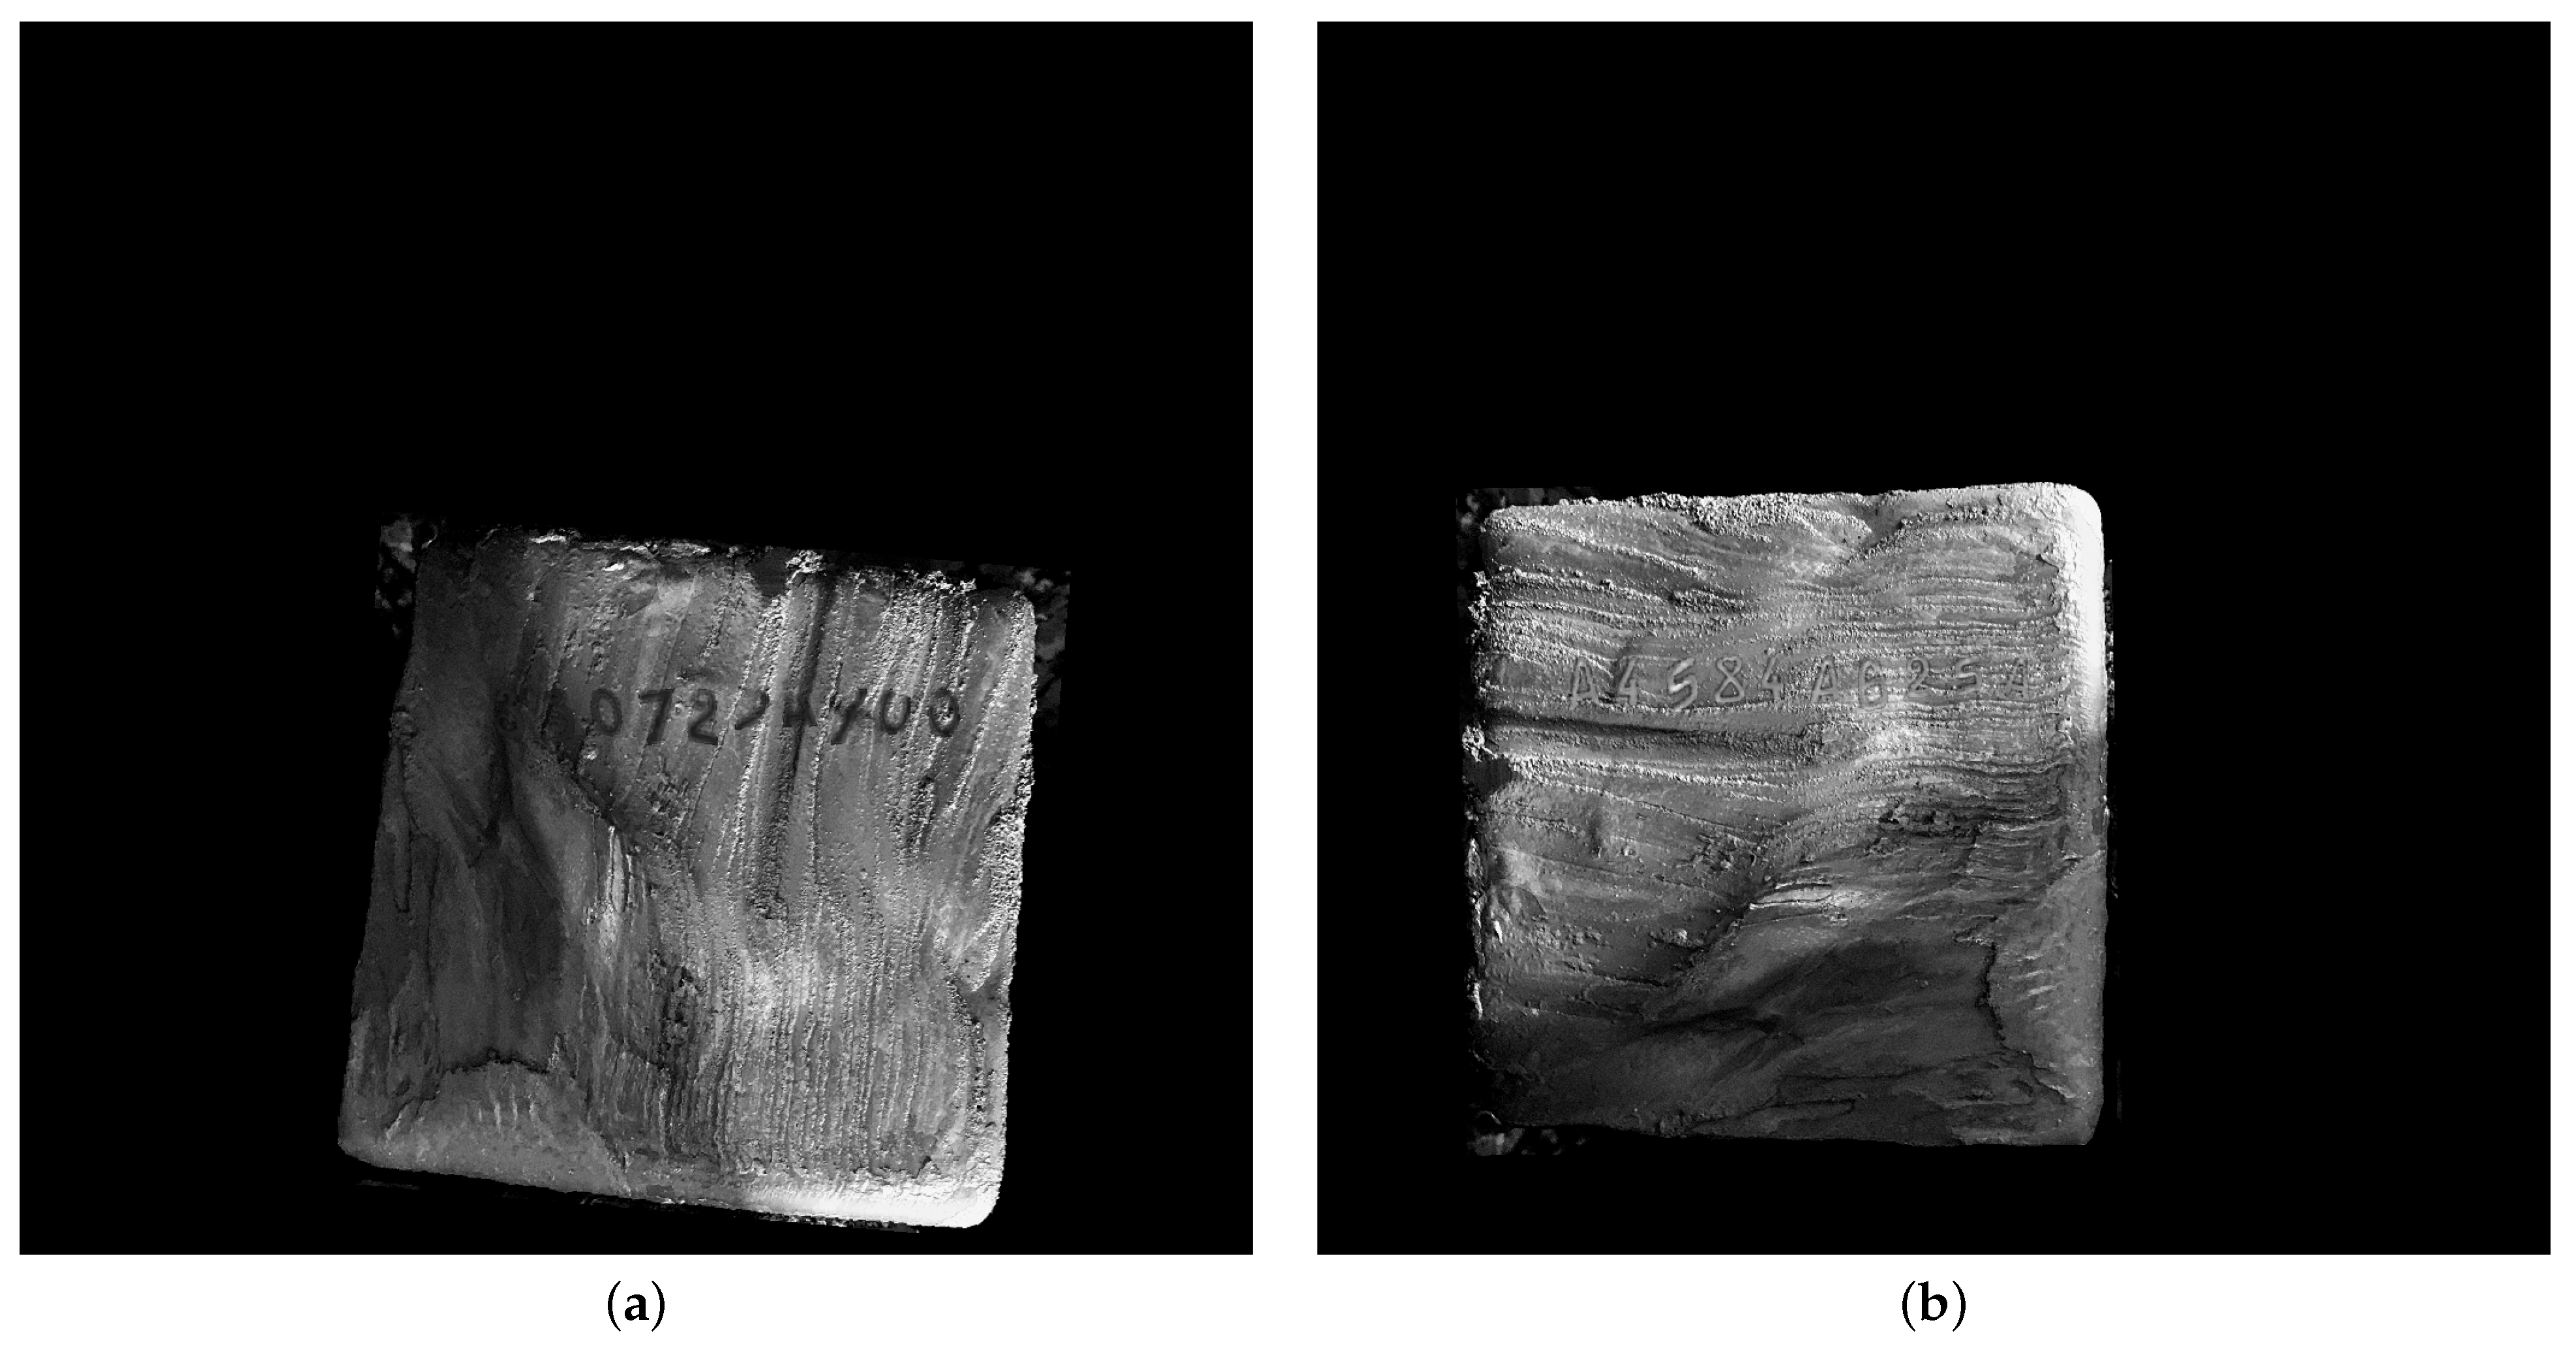
Images were taken by standard Full HD surveillance cameras positioned to face the stamped side of the billets from a close distance and stem from two different production sites, A and B, as visible in Figure 7. Images were resized and cropped to px for training.
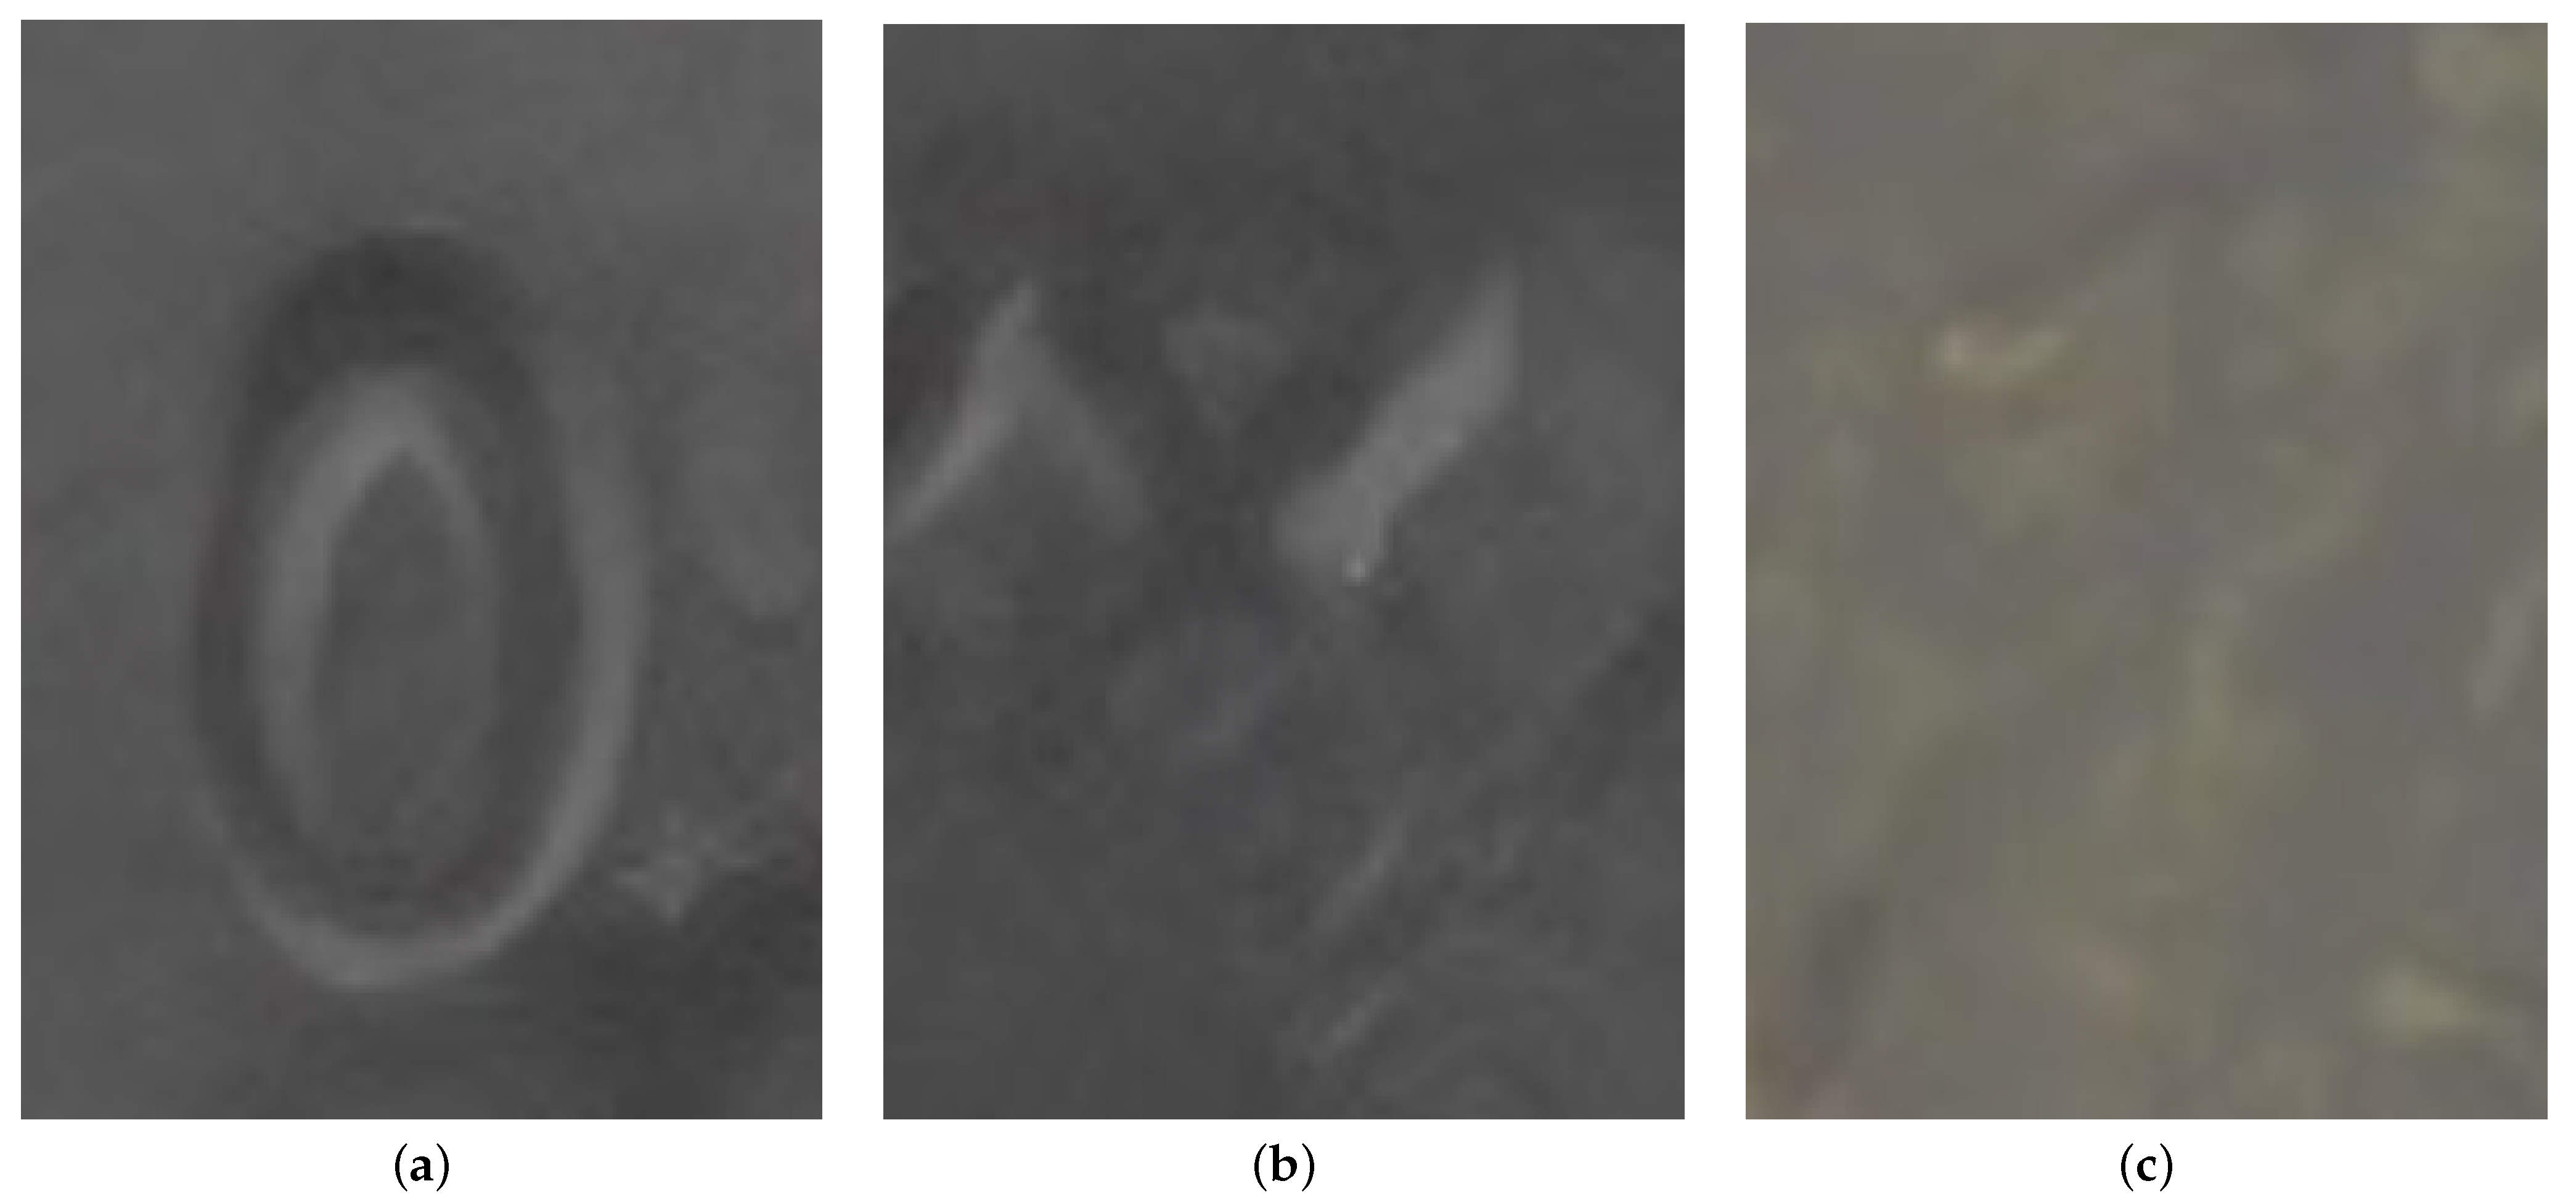
About of the real-life training data stem from production site B and about stem from production site A. These ratios were kept constant over the different training sets in Table 1. In some cases, digits are only partially visible on a billet, due to occlusions or deformations to the billet surface, or stamp readability can be very poor due to other reasons, as shown in Figure 8.
In cases were the readability of the stamped-in ID is very poor (due to e.g., deformations), billets will typically feature an additional stick-on label with the ID, providing another means of automatically identifying the billet ID apart from reading the stamped-in digits. However, cases remain in which only e.g., one or a very few digits are but partially visible and no stick-on label is provided, motivating the need for a model to correctly identify such digits to avoid the need for manual inspection. These only partially visible or poorly stamped digits occur significantly more seldomly than well visible properly stamped digits. This is also reflected in the real-life training data, where occurrences of poorly stamped or only partially visible digits are slightly more frequent than in the real world, but still notably underrepresented; in the real-life training data, about of the billets feature poorly or only partially visible digits. The synthetic training data are more balanced in that billets with easily visible and poorly or only partially visible digits are equally frequent. Synthetic training data images each feature 10 fully or partially visible digits, as visible in Figure 9.
2.3.2. The Test Set
Although poorly or only partially visible digits are less frequent than easily visible digits, performance requirements on them for a model in a productive industrial setting are not less strict. To reflect this, the test set for assessing the different models’ performance is balanced between billets with easily visible digits and billets with only partially or poorly visible digits, with 200 images of billets with well visible digits and 200 images of billets with only partially or poorly visible digits, as detailed in Table 2. In addition, the test set featuring billets with poorly or partially visible digits was subdivided into billets featuring only poorly or partially visible digits, respectively. It is to be noted however that in some cases, billets may be poorly stamped and feature several only partially visible digits, such that the two classes cannot always be separated cleanly. Whenever this occurred, the associated image was sorted into the set with partially visible digits.
In addition, the Test Sets 1–3 are balanced regarding the two different production sites from which images stem. That is, 100 images of billets feature easily visible digits from production site A, 100 images feature billets with poorly or partially visible digits from production site A, another 100 images feature billets with easily visible digits from production site B, and 100 images feature billets with poorly or partially visible digits from production site B. As the only thing that counts in a productive setting is the model performance on real-life data, the test sets consist only of such real-life data, which were manually assembled to ensure that they were well balanced. The assessment of billets for this dataset regarding well-visibility of the stamped digits was done manually as well, based on the authors’ experience of what to expect a well-stamped billet to look like.
3. Results
3.1. Training Performance
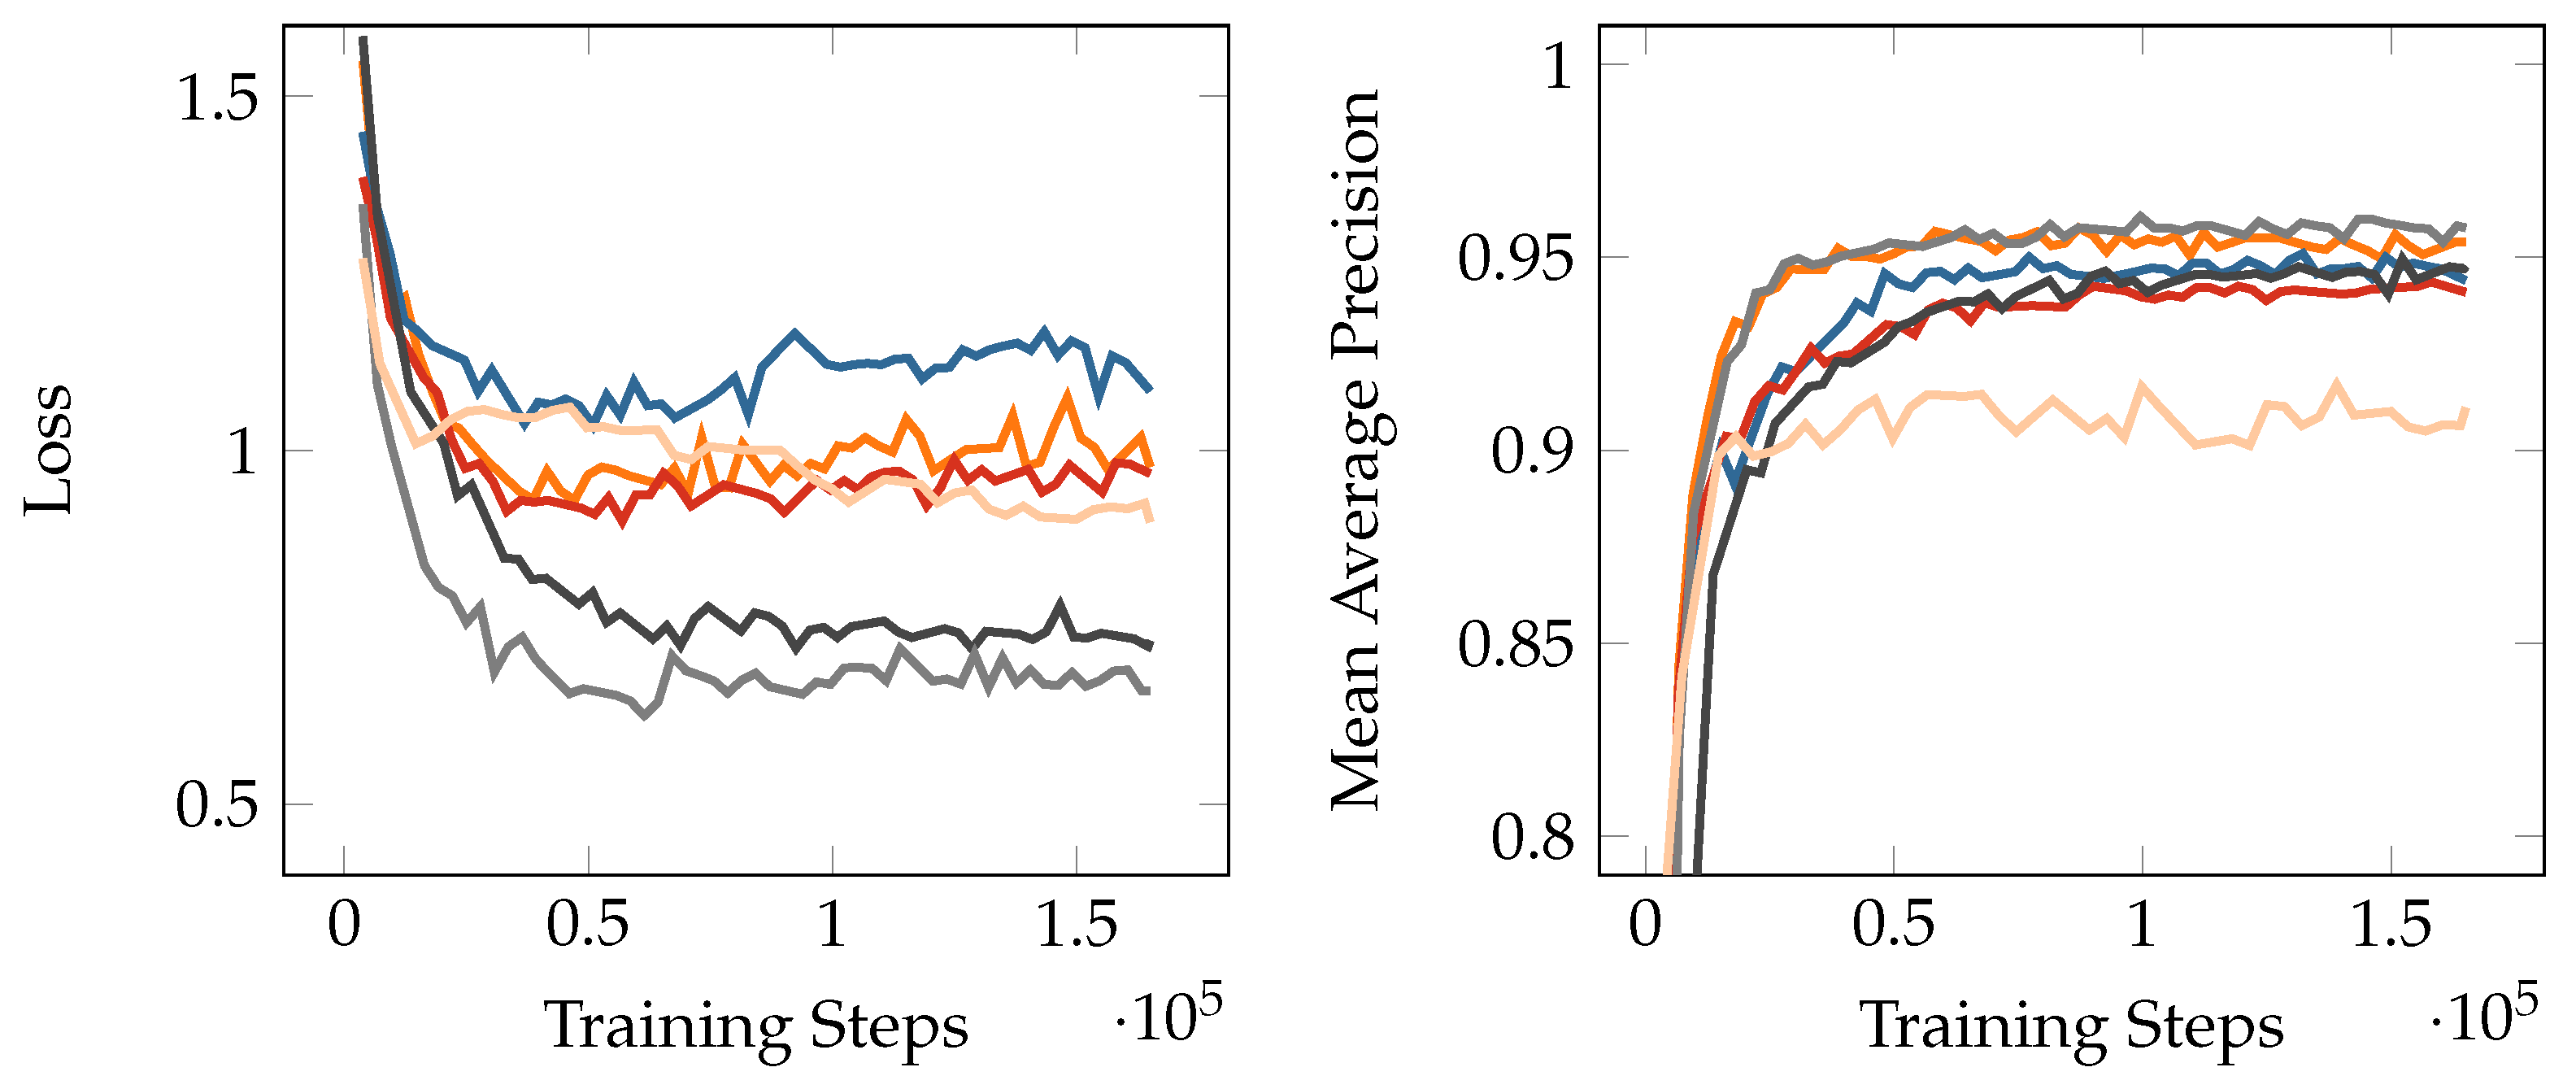
A selection of training performance metrics is depicted in Figure 10. As training performance evaluation is primarily associated with the assertion of convergence in the training process (and the avoidance of overfitting), we restrict ourselves to providing mean average precision (mAP) and loss curves in this section.
3.2. Performance on the Test Sets
Generally, in assessing performance, we view a digit as detected correctly if the Intersection over Union (IoU) ratio . To evaluate the performance of the models on the test sets, we regard the following five metrics, which we believe to capture the relevant dimensions of model performance in a productive setting while remaining broad enough to allow for a transfer of results to other (CV) inference tasks:
- TP
- — the fraction of correctly identified digits;
- MC
- — the fraction of misclassified digits (i.e., the model correctly detected the presence of a digit, but gave it the wrong label);
- FN
- — the fraction of missed digits (i.e., the model missed a digit entirely);
- FP
- — the fraction of wrongly identified digits (i.e., the model located a digit where there was in fact none);
- CB
- — the fraction of billets with all digits identified correctly.
The results on the metrics for the different models are shown in Table 3.
3.3. Interpretation of Results
The training performance metrics show some interesting differentiation along the ratio of synthetic training data in the overall training data, as visible in Figure 10. In the loss curve diagram in Figure 10, the alignment of curves along the vertical axis suggests a correlation between ratio of synthetic training data and validation loss, at least for higher ratios of synthetic training data, with a lower validation loss for higher ratios of synthetic training data. For lower ratios of up to , this correlation does not seem as clear, with Experiment 1 and Experiment 3 showing a very similar validation loss, whereas Experiment 2’s validation loss seems to lie consistently higher. This could indicate a lower variance in the synthetic data, facilitating the model’s learning of the training data’s characteristics for higher ratios of synthetic data. Experiment 6 shows similar loss curve behavior as the other experiments with a high ratio of real-life training data, but with a later and less uniform convergence; this can be possibly attributed to the smaller training data set size. The mAP curves show less differentiation along the ratio of synthetic training data. An exception from this is Experiment 6, which shows significantly lower mAP values. The considerably smaller training data set size could be an explanation for this behavior. It is to be noted, however, that the validation sets for each experiment feature the same ratio of synthetic data as the respective training data, such that this cannot be interpreted as a suggestion that the ratio of synthetic training data does not have any impact on model performance, but rather as an indicator of successful training.
While performance metrics on the test sets are quite similar for fractions of synthetic training data between and , using only synthetic training data had a catastrophic effect on model performance in Experiment 5. One possible explanation for this could be that the model cannot substantially profit from the synthetic training data and relies on the (decreasing) fraction of real-life training data over the consecutive experiments. A possibility could also be that synthetic images used do not offer the same richness of representation as real-life images such that more synthetic training data or synthetic training data with a higher variance are needed to achieve similar model performances when replacing real-life training data entirely. To investigate this further, a sixth experiment was conducted featuring only the subset of real-life data from Experiment 4 as training data. Generally, evaluating the “quality” of generated images is not trivial. For the usage as training data, the merit of generated images must lie in their ability to help improve a DL-based network’s performance, not in their being visually good samples. In particular, an image can look visually convincing but contain statistical artifacts or anomalies differentiating it substantially from real-life data, an extreme example of which is images generated for adversarial attacks [21]. Overall, generated images’ quality must be rated by the required effort going into their generation and the improvement in DL-based model performance their usage can cause.
The performance metrics in Experiment 6 are consistently lower than for Experiment 4, showing that the model did indeed profit from the synthetic training data in Experiment 4, rather than just concentrating on the real-life data. This points towards the second explanation, i.e., that the synthetic training data used do not offer sufficient variety and richness of representation to replace real-life data entirely on a one-to-one basis. An interesting further experiment could be to explore whether this is characteristic for the usage of many kinds of synthetic training data in general or whether only the synthetic training data used in the experiments differed from the real-life data in some dimension essential for model performance.
Regarding the performance on the subset of the test set of only partially or poorly visible digits, underrepresented in the real-life training data, the usage of some synthetic training data does seem to have helped the model in some aspects, albeit only moderately, while not having had that much of an effect in others. s and s were reduced by adding some synthetic data, and the ratio of billets without any misreadings were increased by adding up to of synthetic training data. Interestingly, the ratio of s does not seem to have benefited from adding synthetic training data. To pursue this further and evaluate what might have caused the slight increase for for Experiment 3 as opposed to Experiment 2; whether it indicates an improvement in performance on e.g., partially visible digits, but not on poorly visible digits and whether this perhaps indicates the synthetic training data used presently only helps with the prior category, the test set featuring billets with partially or poorly visible digits (Test Set 3) was split into billets with partially visible digits (Test Set 5) and billets with poorly visible digits (Test Set 4). Indeed the performance on the subset of partially visible digits has caused the slight increase in overall performance in Experiment 3 as opposed to Experiment 2, which is consistent with the synthetic training data’s “hard” examples are partially visible digits, not explicitly poorly visible digits. In spite of this, the differences in performance between Experiments 4 and 6 on poorly visible digits are considerably larger than on partially visible digits, indicating that the task of reading poorly visible digits benefited more from a larger overall training data set than the task of reading partially visible digits, fairly independent of whether this training data was part synthetic or all real-life. This is consistent with the considerations above concerning the differences in performance in between Experiments 4 and 5. Indeed, reading poorly stamped digits should be harder than reading well stamped digits, explaining why a larger training data set size has more impact for performance on Test Set 4 than on Test Set 2. Possibly the task of reading partially visible digits is even much harder and it would perhaps take significantly more effort or training data to push performance further on this task, if this is even feasible. Each billet featuring partially visible digits typically also features some well stamped digits (whereas poorly stamped billets tend to have all digits stamped poorly), and it seems likely that these well stamped digits are responsible for the slighter difference in performance on Test Set 5 between Experiments 4 and 6 as compared to Test Set 4. As the performance on Test Set 2 for Experiments 4 and 6 indicates, the task of reading well stamped digits is sufficiently easy for the model with the smaller training data set to achieve a decent performance, albeit still lower than with a larger training data set, showing that the model still profits from the additional synthetic training data. It could also be interesting to evaluate in how far or whether a stronger class imbalance in the real-life training data would lead to a higher increase in performance when adding more synthetic data to the training data set, and how strong this effect would be, depending on the degree of class imbalance; whether the ideal fraction of synthetic training data could be expressed in terms of class imbalance ratios.
Regarding the performance of the model on well visible digits, the general decline in performance with increasing fraction of synthetic training data was to be expected as the frequency of well visible digits is lower in the synthetic training data than in the real-life training data, thus reducing the overall training examples presented to the respective model. However, the overall performance still remains at a not much lower level even with using synthetic training data as compared to using only real-life data. Considering the significant (manual) labor related to acquiring and labeling real-life training data, this is a very favorable result for the usage of synthetic training data in CV inference tasks.
4. Conclusions and Future Work
In the context of this paper, aberrations in the form of only partially or poorly visible digits were a problem only in so far as these make it harder for a model to correctly identify the corresponding digit. In other potential applications of Deep Learning based Computer Vision models however, such as a defect classification, aberrations will tend to be uncommon and need not only to be detected as an anomaly as such, but will need to be correctly identified as a particular type of aberration, generating a need for corresponding training data. In such cases, synthetic training data can be especially valuable to make DL models a viable option for the task. Our results show that even with only a little real-life training data available, as will be typically the case in many industrial applications, DL based methods can be applied successfully by generating additional synthetic training data.
Generally, especially the ratio of billets with all digits identified correctly may seem disappointingly low for a use of any of the models trained in the experiments in this paper in a productive setting. However, to use a model for a productive setting, one could use all training data available rather than restricting training data size artificially to run comparable experiments. Moreover, and more importantly, for the digit-recognition model developed in the scope of the COGNITWIN project, the output of the Deep Learning based digit-recognition model is combined with 1st principles logic, following the Hybrid and Cognitive Twin approach to achieving enhanced performance. In typical cases of ’misread’ billets, just one or very few digits are not recognized correctly. Using prior knowledge on the systematics of billet IDs combined with the Deep Learning-based model output raises the rate of correctly read billet IDs significantly. The fine details of this approach cannot be laid out in this paper however due to privacy restrictions and are not the subject of this work. Apart from this, the results shown in this paper lay a basis for further improvements in the billet ID detection task model as well as making many other DL-based applications at Saarstahl feasible and will hopefully also prove beneficial for many other industrial applications.
A future approach could be some version of curriculum learning as suggested in [4]. Clearly different types of training data have different effects on the models and some seem to make it easier for a model to learn certain aspects, while other types seem to ease learning other aspects of the overall task. Perhaps instead of using a fixed ratio of synthetic training data throughout the training process, varying this ratio over the training process (e.g., increasing synthetic data ratio over time) and perhaps also varying the ratio of hard examples vs. easy examples in the (synthetic) training data over time could have positive effects. As the authors of [5] suggest, oversampling techniques for underrepresented classes should generally achieve the best results in raising overall performance, including performance on underrepresented classes. Combined with the suggestions on curriculum learning in [4], an approach could be to start with oversampled real-life examples from underrepresented classes (i.e., having near duplicates in the training data set, only varying by, e.g., simple data augmentation techniques) to achieve a balanced training data set and gradually switch to more synthetic training data instead for ensuring balancedness without the downside of a lack in variety associated with the simple naive oversampling of real-life data. Further research could also compare the effectiveness of different types of synthetic training data regarding data generation workload and trained model performance or investigate the GAN approach further. For the present work, a basic GAN approach was used, without too much sophistication. The aim was to evaluate how comparatively rudimentary synthetic GAN images would affect DL model performance compared to real-life training data, i.e., synthetic images that can be generated with comparatively little effort. More sophisticated GAN approaches may very well allow for decreasing the ratio of real-life training data further and show a greater positive impact on model performance on underrepresented classes.
In addition, the impact of synthetic training data could be assessed based on the overall training data set size and, e.g., replacing 1 real-life training data item by n synthetic images. Time constraints did not make it feasible to explore these approaches further in the present work, and we believe that the results presented have enough merit as is.
Aside from these considerations, a conclusion of the findings in this paper is that the usage of up to synthetic training data in Deep Learning-based Computer Vision tasks can indeed be a cost-efficient alternative to the manual collection and labeling of vast numbers of real-life training data, providing a means of making CV applications feasible and economically attractive for a wider scope of industrial settings.
Author Contributions
Conceptualization, S.B., T.B., U.F. and M.S.; methodology, S.B., T.B., U.F. and M.S.; software, S.B. and T.B.; validation, S.B., T.B., U.F. and M.S.; formal analysis, T.B. and U.F.; investigation, S.B., T.B., U.F. and M.S.; resources, M.S.; data curation, S.B., T.B., U.F. and M.S.; writing—original draft preparation, T.B. and U.F.; writing—review and editing, S.B., T.B., U.F. and M.S.; visualization, T.B. and U.F.; supervision, M.S.; funding acquisition, U.F. and M.S. All authors have read and agreed to the published version of the manuscript.
Funding
This research was funded by the European Union’s Horizon 2020 research and innovation programme under grant number 870130 (the COGNITWIN project).
Institutional Review Board Statement
Not applicable.
Informed Consent Statement
Not applicable.
Data Availability Statement
The data presented in this study are available on request from the corresponding author. The data are not publicly available due to privacy restrictions.
Acknowledgments
The authors thank Saarstahl and SHS—Stahl–Holding–Saar for their administrative and technical support.
Conflicts of Interest
The authors declare no conflict of interest.
Abbreviations
The following abbreviations are used in this manuscript:
| cGAN | conditional Generative Adversarial Network |
| CV | Computer Vision |
| DL | Deep Learning |
| DT | Digital Twin |
| Faster R-CNN | Faster Region-based Convolutional Neural Network |
| GAN | Generative Adversarial Network |
| GPU | Graphics Processing Unit |
| IoU | Intersection over Union |
| mAP | mean average precision |
References
- Mathew, A.; Amudha, P.; Sivakumari, S. Deep Learning Techniques: An Overview. In Advanced Machine Learning Technologies and Applications; Hassanien, A.E., Bhatnagar, R., Darwish, A., Eds.; Springer: Singapore, 2021; pp. 599–608. [Google Scholar]
- Emmert-Streib, F.; Yang, Z.; Feng, H.; Tripathi, S.; Dehmer, M. An Introductory Review of Deep Learning for Prediction Models With Big Data. Front. Artif. Intell. 2020, 3, 4. [Google Scholar] [CrossRef] [PubMed] [Green Version]
- Sun, C.; Shrivastava, A.; Singh, S.; Gupta, A. Revisiting Unreasonable Effectiveness of Data in Deep Learning Era. arXiv 2017, arXiv:1707.02968. [Google Scholar]
- Shorten, C.; Khoshgoftaar, T.M. A survey on Image Data Augmentation for Deep Learning. J. Big Data 2019, 60, 1767–1789. [Google Scholar] [CrossRef]
- Buda, M.; Maki, A.; Mazurowski, M.A. A systematic study of the class imbalance problem in convolutional neural networks. Neural Netw. 2018, 106, 249–259. [Google Scholar] [CrossRef] [PubMed] [Green Version]
- Perez, L.; Wang, J. The Effectiveness of Data Augmentation in Image Classification using Deep Learning. arXiv 2017, arXiv:1712.04621. [Google Scholar]
- Mikołajczyk, A.; Grochowski, M. Data augmentation for improving deep learning in image classification problem. In Proceedings of the 2018 International Interdisciplinary PhD Workshop (IIPhDW), Swinoujscie, Poland, 9–12 May 2018; pp. 117–122. [Google Scholar] [CrossRef]
- Schraml, D. Physically based synthetic image generation for machine learning: A review of pertinent literature. In Proceedings of the Photonics and Education in Measurement Science 2019, Jena, Germany, 17–19 September 2019; Rosenberger, M., Dittrich, P.G., Zagar, B., Eds.; International Society for Optics and Photonics, SPIE: Bellingham, WA, USA, 2019; Volume 11144, pp. 108–120. [Google Scholar] [CrossRef] [Green Version]
- Meister, S.; Möller, N.; Stüve, J.; Groves, R.M. Synthetic image data augmentation for fibre layup inspection processes: Techniques to enhance the data set. J. Intell. Manuf. 2021, 32, 1767–1789. [Google Scholar] [CrossRef]
- Kim, K.; Myung, H. Autoencoder-Combined Generative Adversarial Networks for Synthetic Image Data Generation and Detection of Jellyfish Swarm. IEEE Access 2018, 6, 54207–54214. [Google Scholar] [CrossRef]
- Su, Y.H.; Jiang, W.; Chitrakar, D.; Huang, K.; Peng, H.; Hannaford, B. Local Style Preservation in Improved GAN-Driven Synthetic Image Generation for Endoscopic Tool Segmentation. Sensors 2021, 21, 5163. [Google Scholar] [CrossRef] [PubMed]
- Melesse, T.Y.; Pasquale, V.D.; Riemma, S. Digital Twin Models in Industrial Operations: A Systematic Literature Review. Procedia Manuf. 2020, 42, 267–272. [Google Scholar] [CrossRef]
- Liu, M.; Fang, S.; Dong, H.; Xu, C. Review of digital twin about concepts, technologies, and industrial applications. J. Manuf. Syst. 2021, 58, 346–361. [Google Scholar] [CrossRef]
- Goodfellow, I.; Pouget-Abadie, J.; Mirza, M.; Xu, B.; Warde-Farley, D.; Ozair, S.; Courville, A.; Bengio, Y. Generative Adversarial Nets. In Advances in Neural Information Processing Systems; Ghahramani, Z., Welling, M., Cortes, C., Lawrence, N., Weinberger, K.Q., Eds.; Curran Associates, Inc.: Red Hook, NY, USA, 2014; Volume 27. [Google Scholar]
- Mirza, M.; Osindero, S. Conditional Generative Adversarial Nets. arXiv 2014, arXiv:1411.1784. [Google Scholar]
- Isola, P.; Zhu, J.Y.; Zhou, T.; Efros, A.A. Image-to-Image Translation with Conditional Adversarial Networks. arXiv 2018, arXiv:1611.07004. [Google Scholar]
- Ren, S.; He, K.; Girshick, R.; Sun, J. Faster R-CNN: Towards Real-Time Object Detection with Region Proposal Networks. In Advances in Neural Information Processing Systems; Cortes, C., Lawrence, N., Lee, D., Sugiyama, M., Garnett, R., Eds.; Curran Associates, Inc.: Red Hook, NY, USA, 2015; Volume 28. [Google Scholar]
- COCO—Common Objects in Context. Available online: http://cocodataset.org/#download (accessed on 15 January 2019).
- TensorFlowModelZoo/Garden. Available online: https://github.com/tensorflow/models (accessed on 15 January 2019).
- TensorFlow. Available online: https://www.tensorflow.org/ (accessed on 13 October 2021).
- Elsayed, G.F.; Shankar, S.; Cheung, B.; Papernot, N.; Kurakin, A.; Goodfellow, I.; Sohl-Dickstein, J. Adversarial Examples that Fool both Computer Vision and Time-Limited Humans. arXiv 2018, arXiv:1802.08195. [Google Scholar]
Figure 1.
Conversion of a polygonal shape into segmentation mask (left: polygon of digit 8, right: mask of digit 8 as binary array).
Figure 1.
Conversion of a polygonal shape into segmentation mask (left: polygon of digit 8, right: mask of digit 8 as binary array).

Figure 2.
Architecture of the Generator Network (visualized using: http://alexlenail.me/NN-SVG/ (accessed on 18 October 2021)).
Figure 2.
Architecture of the Generator Network (visualized using: http://alexlenail.me/NN-SVG/ (accessed on 18 October 2021)).

Figure 3.
Architecture of the Discriminator Network (visualized using: http://alexlenail.me/NN-SVG/ (accessed on 18 October 2021)).
Figure 3.
Architecture of the Discriminator Network (visualized using: http://alexlenail.me/NN-SVG/ (accessed on 18 October 2021)).

Figure 4.
Results of the cGAN generator with the input mask (left), original image (middle), and synthesis (right). (a,c,f) depict examples of the GAN hallucinating rust onto a generated digit, (b,d) are examples where artifacts can be seen on the generated image, (e) is an example where the generated image is highly similar to the real image, without serious hallucinated additions or artifacts.

Figure 5.
Workflow of stamp synthesis.

Figure 6.
A billet with digits stamped onto one side.

Figure 7.
Billet images captured at production sites A (a) and B (b).

Figure 8.
Digits stamped onto a billet surface: well visible (a), partially visible (b), and poorly visible (c).
Figure 8.
Digits stamped onto a billet surface: well visible (a), partially visible (b), and poorly visible (c).

Figure 9.
Two examples of synthetic training images with (a) and without (b) some only partially visible digits.
Figure 9.
Two examples of synthetic training images with (a) and without (b) some only partially visible digits.

Figure 10.
Loss and Mean Average Precision for each experiment over 165,000 training steps ( ![Information 13 00009 i002]() Experiment 1,
Experiment 1, ![Information 13 00009 i003]() Experiment 2,
Experiment 2, ![Information 13 00009 i004]() Experiment 3,
Experiment 3, ![Information 13 00009 i005]() Experiment 4,
Experiment 4, ![Information 13 00009 i006]() Experiment 5,
Experiment 5, ![Information 13 00009 i007]() Experiment 6).
Experiment 6).
 Experiment 1,
  Experiment 2,
  Experiment 3,
  Experiment 4,
  Experiment 5,
  Experiment 6).
Figure 10.
Loss and Mean Average Precision for each experiment over 165,000 training steps ( ![Information 13 00009 i002]() Experiment 1,
Experiment 1, ![Information 13 00009 i003]() Experiment 2,
Experiment 2, ![Information 13 00009 i004]() Experiment 3,
Experiment 3, ![Information 13 00009 i005]() Experiment 4,
Experiment 4, ![Information 13 00009 i006]() Experiment 5,
Experiment 5, ![Information 13 00009 i007]() Experiment 6).
Experiment 6).
Experiment 1, Experiment 2, Experiment 3, Experiment 4, Experiment 5, Experiment 6).

Table 1.
Fraction of synthetic and real training data for the different experimental setups.
| Experiment | Frac. of Synth. Training Data | Frac. of Real Training Data | No. of Images |
|---|---|---|---|
| 1 | 0 | 100 | 2540 |
| 2 | 25 | 75 | 2540 |
| 3 | 50 | 50 | 2540 |
| 4 | 75 | 25 | 2540 |
| 5 | 100 | 0 | 2540 |
| 6 | 0 | 100 | 635 |
Table 2.
Statistics of the used test sets.
| Test Set | Composition | No. of Images | No. of Annotations |
|---|---|---|---|
| 1 | all | 400 | 4322 |
| 2 | well visible | 200 | 2260 |
| 3 | poorly or partially visible | 200 | 2062 |
| 4 | poorly visible | 83 | 864 |
| 5 | partially visible | 117 | 1198 |
Table 3.
Model performances regarding the chosen metrics. The orange horizontal bars represent the magnitude of the respective numeric value.
Table 3.
Model performances regarding the chosen metrics. The orange horizontal bars represent the magnitude of the respective numeric value.
| Experiment | Test Set | TP | MC | FN | FP | CB |
|---|---|---|---|---|---|---|
 | ||||||
Publisher’s Note: MDPI stays neutral with regard to jurisdictional claims in published maps and institutional affiliations. |
© 2021 by the authors. Licensee MDPI, Basel, Switzerland. This article is an open access article distributed under the terms and conditions of the Creative Commons Attribution (CC BY) license (https://creativecommons.org/licenses/by/4.0/).
Share and Cite
MDPI and ACS Style
Faltings, U.; Bettinger, T.; Barth, S.; Schäfer, M. Impact on Inference Model Performance for ML Tasks Using Real-Life Training Data and Synthetic Training Data from GANs. Information 2022, 13, 9. https://doi.org/10.3390/info13010009
AMA Style
Faltings U, Bettinger T, Barth S, Schäfer M. Impact on Inference Model Performance for ML Tasks Using Real-Life Training Data and Synthetic Training Data from GANs. Information. 2022; 13(1):9. https://doi.org/10.3390/info13010009
Chicago/Turabian StyleFaltings, Ulrike, Tobias Bettinger, Swen Barth, and Michael Schäfer. 2022. "Impact on Inference Model Performance for ML Tasks Using Real-Life Training Data and Synthetic Training Data from GANs" Information 13, no. 1: 9. https://doi.org/10.3390/info13010009
Note that from the first issue of 2016, this journal uses article numbers instead of page numbers. See further details here.