
The Impacts of Tourism Stays on Residents’ Self-Reported Health: A Pan-European Analysis on the Role of Age and Urbanization Level

 , ,
, ,  ,
,
Abstract
:1. Introduction
2. Materials and Methods
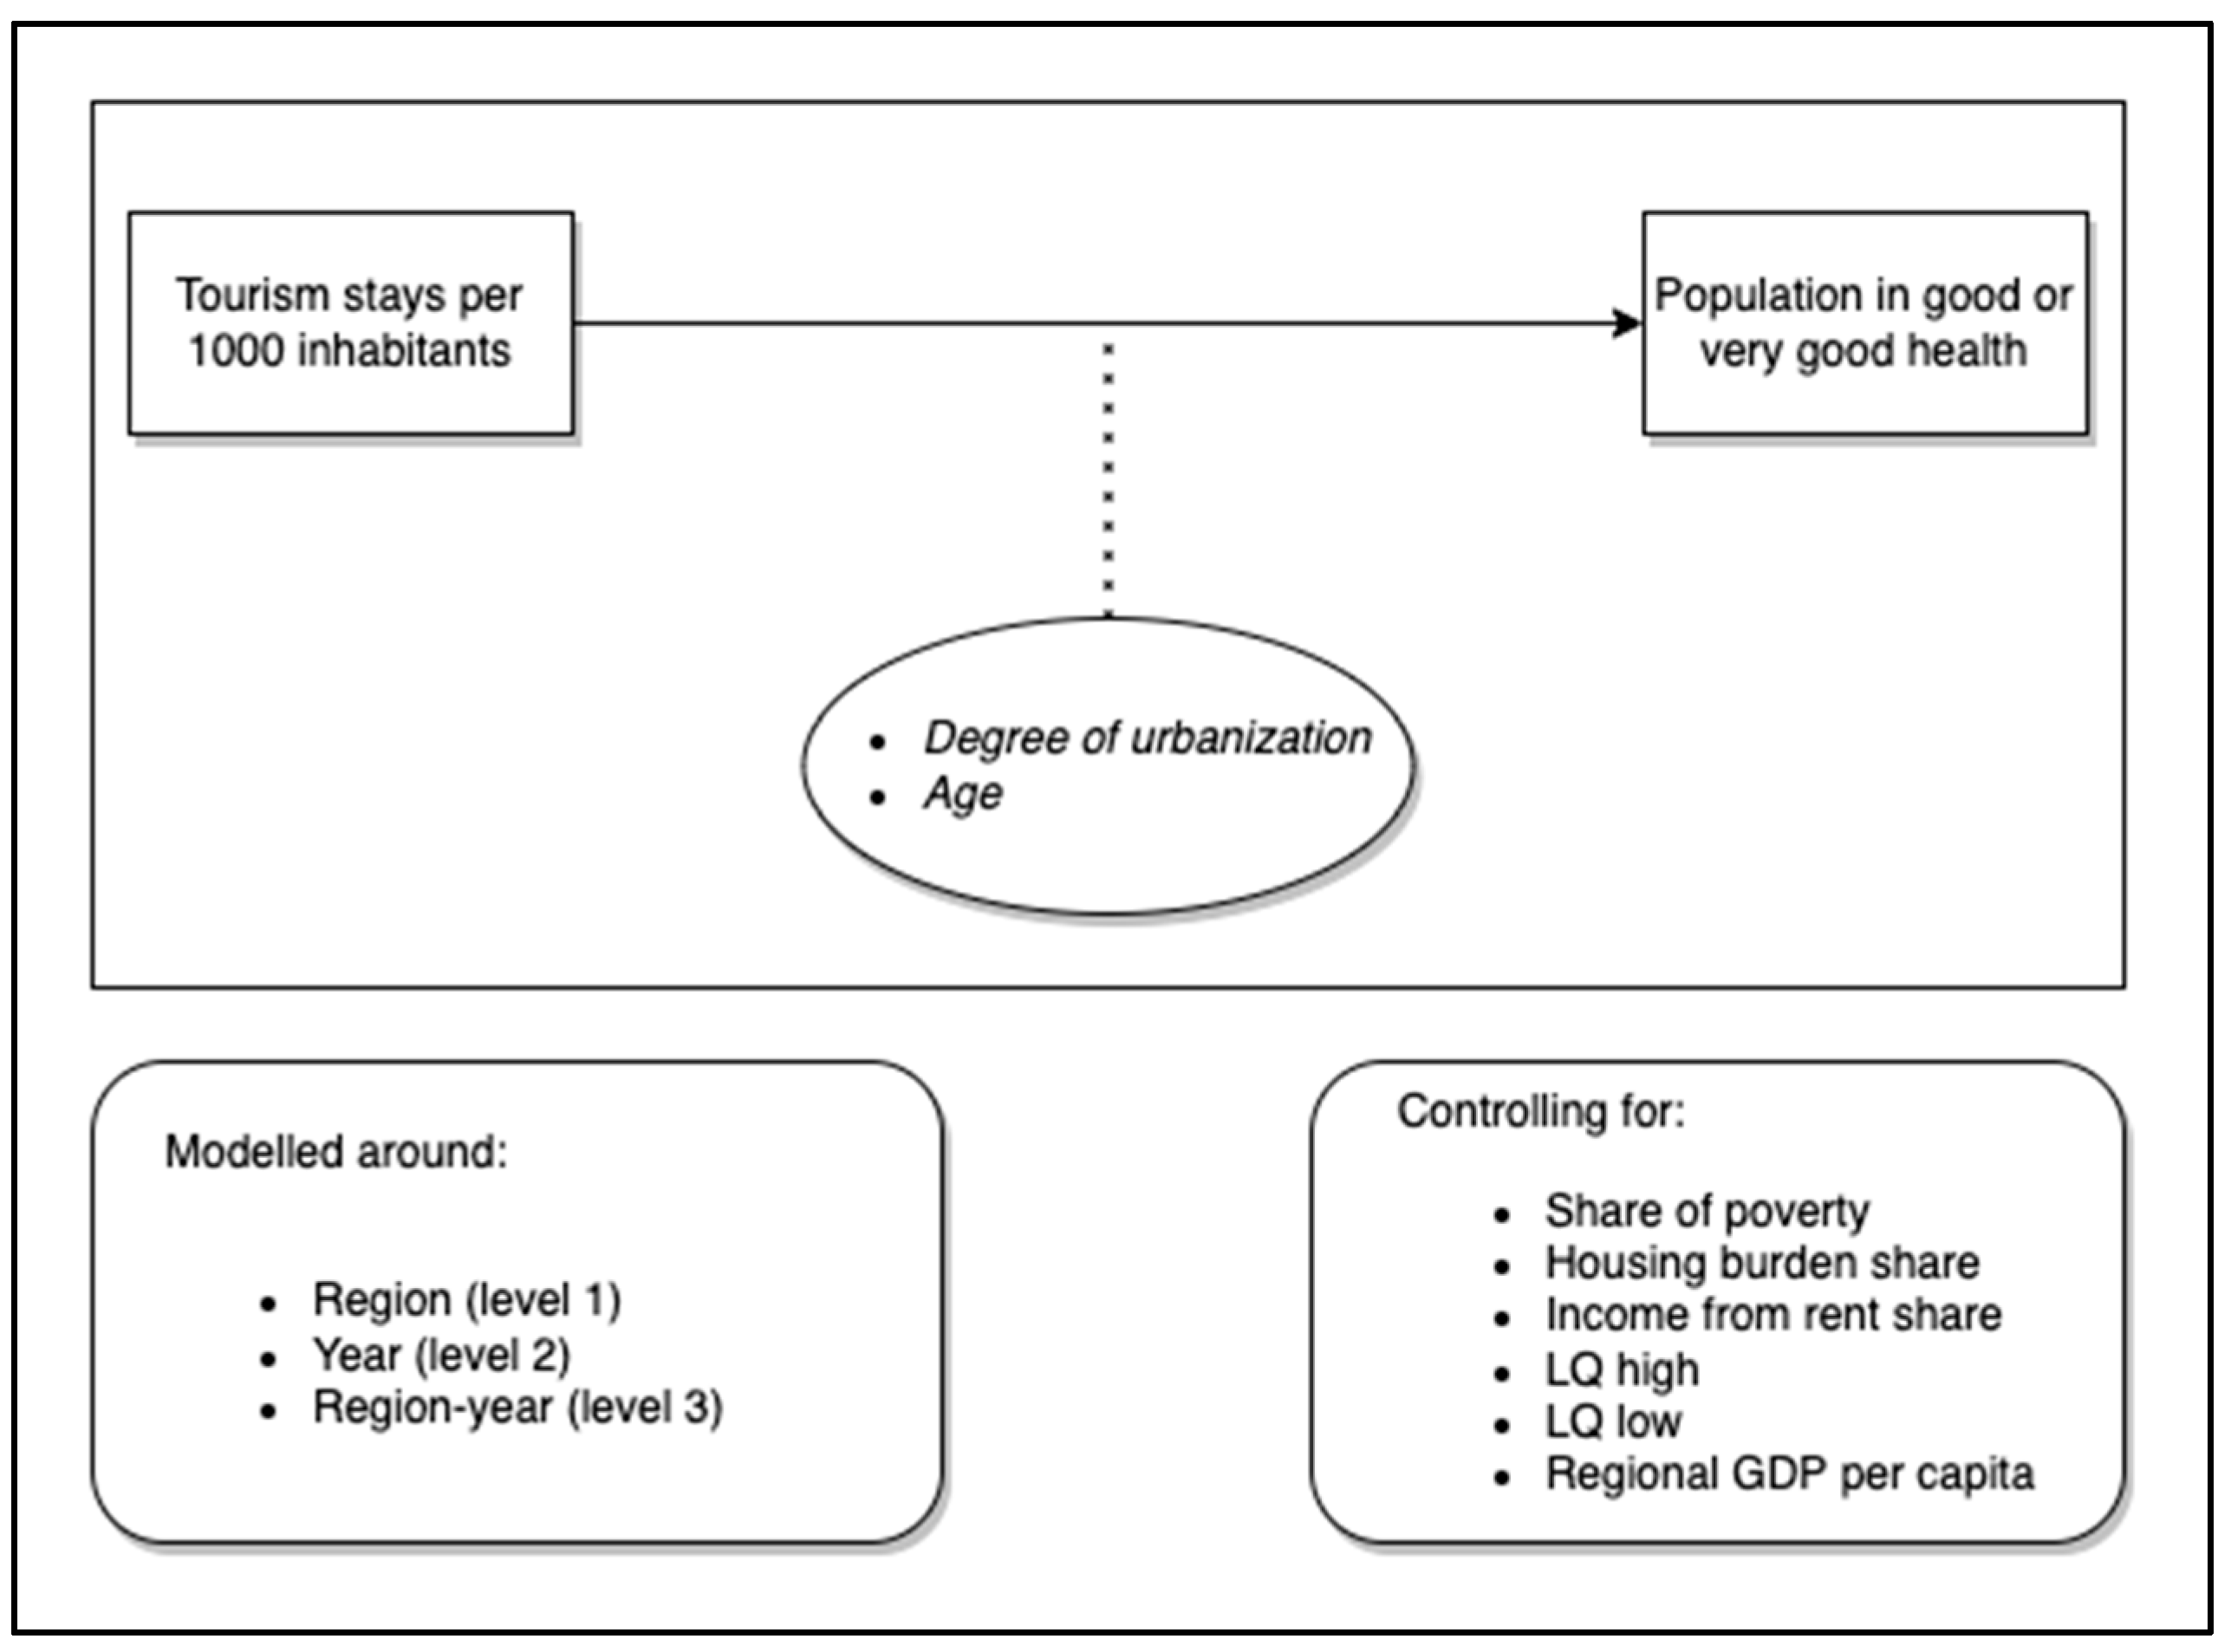
- = share of healthy individuals in region i with level of urbanization u at time t in age group a
- = natural log of tourism pressure (overnight stays per thousand inhabitants) in region i with level of urbanization u at time t
- = poverty rate in region i with level of urbanization u at time t in age group a
- = the share of people experiencing a housing burden in region i with level of urbanization u at time t in age group a
- = the share of people receiving income from rent in region i with level of urbanization u at time t in age group a
- = dummy indicating if region i is a capital region
- = GDP per capita in region i at time t
- = dummy indicating if region i at time t has a high LQ
- = dummy indicating if region i at time t has a low LQ
- = age group (15–29; 30–49; 50–64; over 65)
- = urbanisation type (urban; town; rural)
2.1. Data Sources
2.2. Dependent Variable
2.3. Independent Variable
2.4. Controls
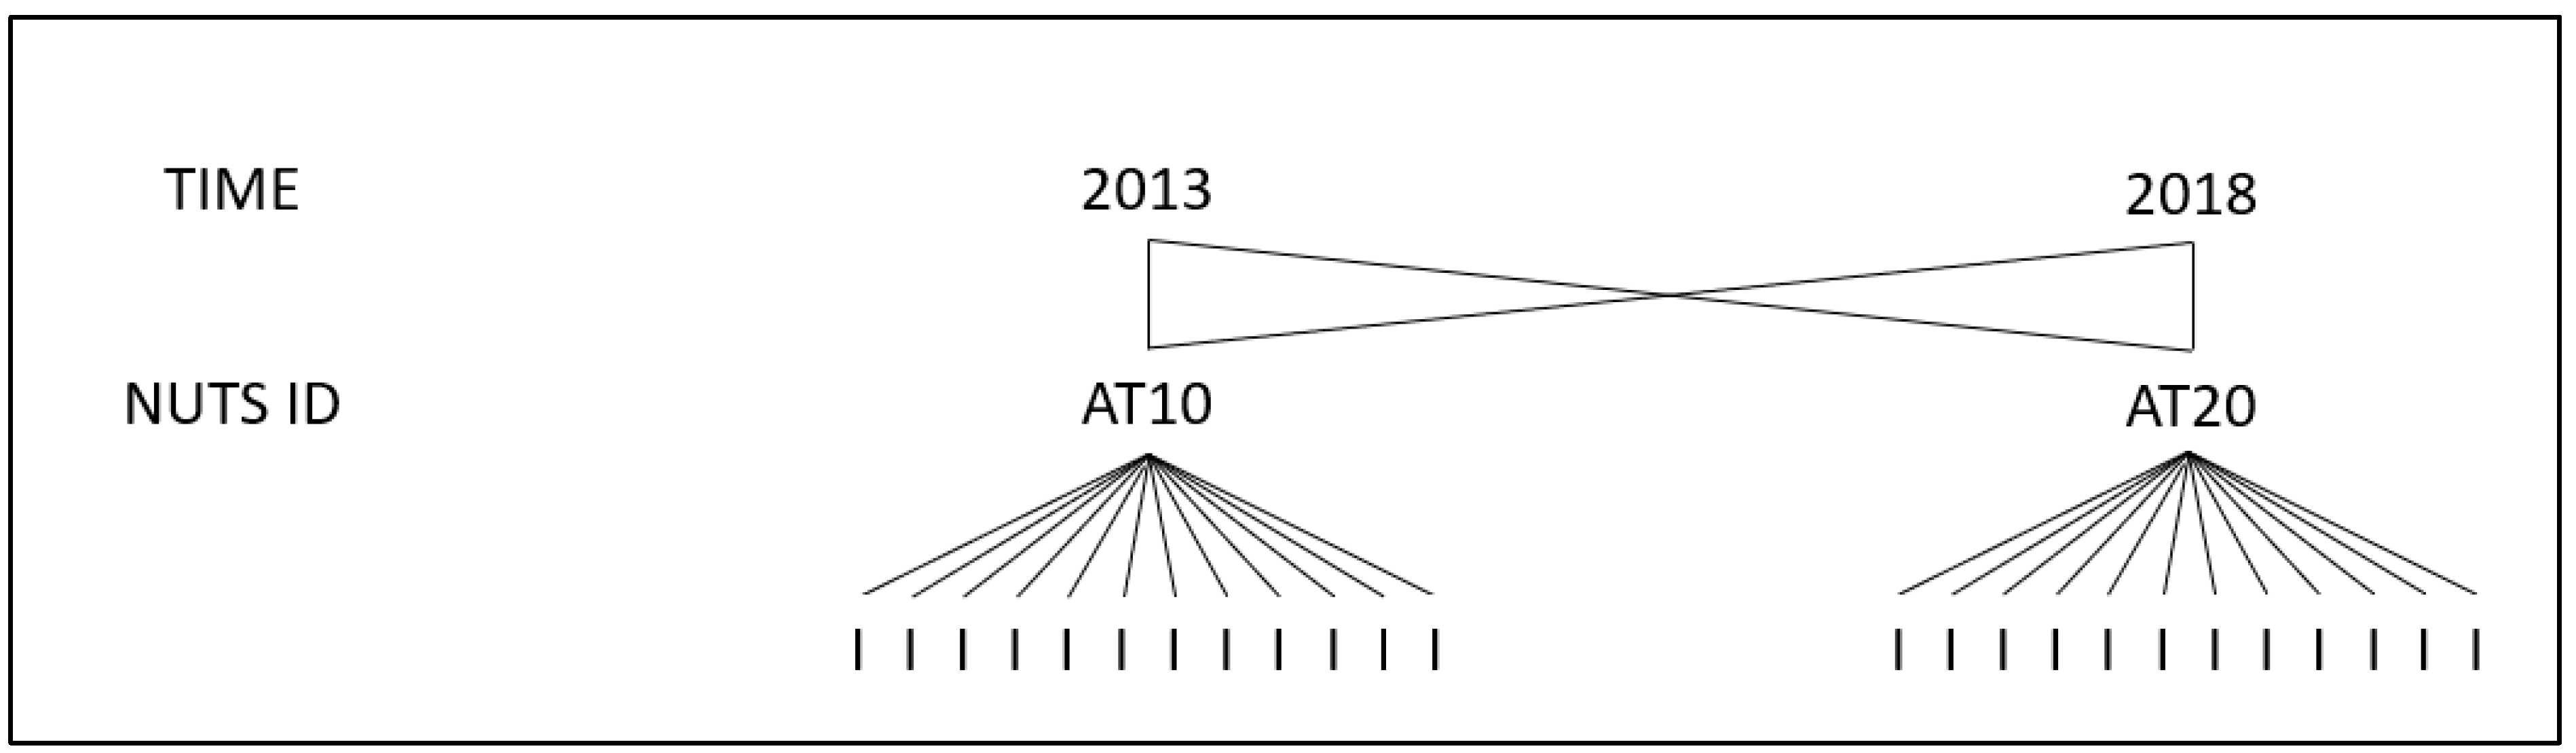
2.5. Model
2.6. Instrumental Variable Regressions
3. Results
3.1. Multilevel Models
3.2. Instrumental Variable Regressions
4. Discussion
5. Policy Suggestions and Limitations
6. Conclusions
Author Contributions
Funding
Institutional Review Board Statement
Informed Consent Statement
Data Availability Statement
Conflicts of Interest
References
- Eurostat. Tourism. Fact Sheets on the European Union. 2021. Available online: https://www.europarl.europa.eu/ftu/pdf/en/FTU_3.4.12.pdf (accessed on 10 January 2022).
- Nunkoo, R.; Smith, S.L.; Ramkissoon, H. Residents’ attitudes to tourism: A longitudinal study of 140 articles from 1984 to 2010. J. Sustain. Tour. 2013, 21, 5–25. [Google Scholar] [CrossRef]
- Uysal, M.; Sirgy, M.J.; Woo, E.; Kim, H.L. Quality of life (QOL) and well-being research in tourism. Tour. Manag. 2016, 53, 244–261. [Google Scholar] [CrossRef]
- World Tourism Organization (WTO). Guide for Local Authorities on Developing Sustainable Tourism; World Tourism Organization: Madrid, Spain, 1998. [Google Scholar]
- Perdue, R.R.; Long, P.T.; Kang, Y.S. Resident support for gambling as a tourism development strategy. J. Travel Res. 1995, 34, 3–11. [Google Scholar] [CrossRef]
- Ivlevs, A. Happy hosts? International tourist arrivals and residents’ subjective well-being in Europe. J. Travel Res. 2017, 56, 599–612. [Google Scholar] [CrossRef] [Green Version]
- Damasio, A.R. Descartes’ error and the future of human life. Sci. Am. 1994, 271, 144. [Google Scholar] [CrossRef]
- Helliwell, J.; Layard, R.; Sachs, J. World Happiness Report 2017 (Ser. Canadian Public Documents Collection). Center for Sustainable Development. 2017. Available online: https://worldhappiness.report/ed/2017/ (accessed on 10 January 2022).
- Gursoy, D.; Jurowski, C.; Uysal, M. Resident attitudes: A structural modeling approach. Ann. Tour. Res. 2002, 29, 79–105. [Google Scholar] [CrossRef]
- Gjerald, O. Sociocultural impacts of tourism: A case study from Norway. J. Tour. Cult. Change 2005, 3, 36–58. [Google Scholar] [CrossRef]
- Yamada, N.; Heo, J.; King, C.; Fu, Y.Y. Life satisfaction of urban residents: Do health perception, wealth, safety, community pride and, and cultural tourism matter? In Proceedings of the International CHRIE Conference-Refereed Track, San Francisco, CA, USA, 31 July 2009; p. 24. [Google Scholar]
- Rivera, M.; Croes, R.; Lee, S.H. Tourism development and happiness: A residents’ perspective. J. Destin. Mark. Manag. 2016, 5, 5–15. [Google Scholar] [CrossRef]
- Nawijn, J.; Mitas, O. Resident attitudes to tourism and their effect on subjective well-being: The case of Palma de Mallorca. J. Travel Res. 2012, 51, 531–541. [Google Scholar] [CrossRef]
- Matarrita-Cascante, D.; Brennan, M.A.; Luloff, A.E. Community agency and sustainable tourism development: The case of La Fortuna, Costa Rica. J. Sustain. Tour. 2010, 18, 735–756. [Google Scholar] [CrossRef]
- Godovykh, M.; Ridderstaat, J. Health outcomes of tourism development: A longitudinal study of the impact of tourism arrivals on residents’ health. J. Destin. Mark. Manag. 2020, 17, 100462. [Google Scholar] [CrossRef]
- Tokarchuk, O.; Gabriele, R.; Maurer, O. The impact of tourism on the wellbeing of residents. In Proceedings of the 21st Excellence in Services International Conference (EISIC), Paris, France, 30–31 August 2018; pp. 679–692. [Google Scholar]
- Okulicz-Kozaryn, A.; Strzelecka, M. Happy tourists, unhappy locals. Soc. Indic. Res. 2017, 134, 789–804. [Google Scholar] [CrossRef]
- UNCTAD (United Nations Conference on Trade and Development). Sustainable Tourism—A Tool for Development and Poverty Eradication. 2017. Available online: https://unctad.org/news/sustainable-tourism-tool-development-and-poverty-eradication (accessed on 10 January 2022).
- Dahlgren, G.; Whitehead, M. Policies and Strategies to Promote Social Equity in Health; Background Document to WHO-Strategy Paper for Europe; No. 2007: 14; Institute for Futures Studies: Stockholm, Sweden, 1991. [Google Scholar]
- Hayes, M.; Zaban, H. Transnational gentrification: The crossroads of transnational mobility and urban research. Urban Stud. 2020, 57, 3009–3024. [Google Scholar] [CrossRef]
- Cocola-Gant, A. Tourism gentrification. In Handbook of Gentrification Studies; Edward Elgar Publishing: Cheltenham, UK, 2018. [Google Scholar]
- Riganti, P.; Nijkamp, P. Congestion in popular tourist areas: A multi-attribute experimental choice analysis of willingness-to-wait in Amsterdam. Tour. Econ. 2008, 14, 25–44. [Google Scholar] [CrossRef] [Green Version]
- Gotham, K.F. Tourism gentrification: The case of new Orleans’ Vvieux Ccarrée (French Quarter). Urban Stud. 2005, 42, 1099–1121. [Google Scholar] [CrossRef]
- Nguyen TT, M.; Rahtz, D.; Shultz, C. Tourism as catalyst for quality of life in transitioning subsistence marketplaces: Perspectives from Ha Long, Vietnam. J. Macromark. 2014, 34, 28–44. [Google Scholar]
- World Tourism Organization (WTO); International Labour Organization (ILO). Measuring Employment in the Tourism Industries—Guide with Best Practices; UNWTO: Madrid, Spain, 2014. [Google Scholar]
- Croezen, S.; Burdorf, A.; van Lenthe, F.J. Self-perceived health in older Europeans: Does the choice of survey matter? Eur. J. Public Health 2016, 26, 686–692. [Google Scholar] [CrossRef] [PubMed] [Green Version]
- SMARTDEST. The SMARTDEST Project. 2021. Available online: www.smartdest.eu (accessed on 10 January 2022).
- Vermeulen, S.; Bornioli, A.; Liedl, B.; Alexander, L.; Kazepov, Y.; Mocca, E.; Russo, A.P.; Valente, R.; Brandajs, F. SMARTDEST DATASET WP2 V1 [Data set]. Zenodo 2020. [Google Scholar] [CrossRef]
- Eurostat. Degree of Urbanization. 2019. Available online: https://ec.europa.eu/eurostat/web/degree-of-urbanisation/background (accessed on 10 January 2022).
- R Core Team. R: A Language and Environment for Statistical Computing; R Foundation for statistical Computing: Vienna, Austria, 2020; Available online: https://www.R-project.org/ (accessed on 10 January 2022).
- Lahti, L.; Huovari, J.; Kainu, M.; Biecek, P. Retrieval and Analysis of Eurostat Open Data with the eurostat Package. R J. 2017, 9, 385. [Google Scholar] [CrossRef] [Green Version]
- Wickham, H.; Averick, M.; Bryan, J.; Chang, W.; McGowan LD, A.; François, R.; Yutani, H. Welcome to the Tidyverse. J. Open Source Softw. 2019, 4, 1686. [Google Scholar] [CrossRef]
- Pebesma, E.J. Simple features for R: Standardized support for spatial vector data. R J. 2018, 10, 439. [Google Scholar] [CrossRef] [Green Version]
- Bornioli, A.; Russo, A.P.; Vermeulen, S.; Valente, R.; The Spatial Articulation and Local Effects of Tourism and Associated Mobilities. SMARTDEST Report. 2020. Available online: https://smartdest.eu/wp-content/uploads/2021/01/SMARTDESTD2.2-FULLVERSION-Spatialarticulationlocaleffectstourism-merged.pdf (accessed on 10 January 2022).
- Eurostat. European Union Statistics on Income and Living Conditions (EU-SILC). 2021. Available online: https://ec.europa.eu/eurostat/web/microdata/european-union-statistics-on-income-and-living-conditions (accessed on 10 January 2022).
- Schmidt-Catran, A.W.; Fairbrother, M. The random effects in multilevel models: Getting them wrong and getting them right. Eur. Sociol. Rev. 2016, 32, 23–38. [Google Scholar] [CrossRef]
- Swanson, S.A.; Hernán, M.A. Commentary: How to report instrumental variable analyses (suggestions welcome). Epidemiology 2013, 24, 370–374. [Google Scholar] [CrossRef]
- Staiger, D.; Stock, J.H. Instrumental variables regression with weak instruments. Econom. J. Econom. Soc. 1997, 65, 557–586. [Google Scholar] [CrossRef]
- Meng, F.; Li, X.; Uysal, M. Tourism development and regional quality of life: The case of China. J. China Tour. Res. 2010, 6, 164–182. [Google Scholar] [CrossRef]
- Sánchez-Ledesma, E.; Vásquez-Vera, H.; Sagarra, N.; Peralta, A.; Porthé, V.; Díez, È. Perceived pathways between tourism gentrification and health: A participatory Photovoice study in the Gòtic neighborhood in Barcelona. Soc. Sci. Med. 2020, 258, 113095. [Google Scholar] [CrossRef]
- Cocola-Gant, A.; Gago, A. Airbnb, buy-to-let investment and tourism-driven displacement: A case study in Lisbon. Environ. Plan. A Econ. Space 2019, 53, 1671–1688. [Google Scholar] [CrossRef] [Green Version]
- Milano, C.; Koens, K. The paradox of tourism extremes. Excesses and restraints in times of COVID-19. Curr. Issues Tour. 2021, 1–15. [Google Scholar] [CrossRef]
- Russo, A.P.; Scarnato, A. “Barcelona in common”: A new urban regime for the 21st-century tourist city? J. Urban Aff. 2018, 40, 455–474. [Google Scholar] [CrossRef]
- Mehdipanah, R.; Marra, G.; Melis, G.; Gelormino, E. Urban renewal, gentrification and health equity: A realist perspective. Eur. J. Public Health 2018, 28, 243–248. [Google Scholar] [CrossRef] [PubMed] [Green Version]
- Lacher, R.G.; Oh, C.O. Is tourism a low-income industry? Evidence from three coastal regions. J. Travel Res. 2012, 51, 464–472. [Google Scholar] [CrossRef]
- Marcouiller, D.W.; Kim, K.K.; Deller, S.C. Natural amenities, tourism and income distribution. Ann. Tour. Res. 2004, 31, 1031–1050. [Google Scholar] [CrossRef]
- Brandajs, F.; Russo, A.P. Whose is that square? Cruise tourists’ mobilities and negotiation for public space in Barcelona. Appl. Mobilities 2019, 289–313. [Google Scholar] [CrossRef]
- Quinn, B. Performing tourism Venetian residents in focus. Ann. Tour. Res. 2007, 34, 458–476. [Google Scholar] [CrossRef]
- Gibbons, J.; Barton, M.S. The Association of Minority Self-Rated Health with black versus white gentrification. J. Urban Health 2016, 93, 909–922. [Google Scholar] [CrossRef] [PubMed] [Green Version]
- Jelks, N.T.O.; Jennings, V.; Rigolon, A. Green gentrification and health: A scoping review. Int. J. Environ. Res. Public Health 2021, 18, 907. [Google Scholar] [CrossRef]
- Kadi, J.; Plank, L.; Seidl, R. Airbnb as a tool for inclusive tourism? Tour. Geogr. 2019, 1–23. [Google Scholar] [CrossRef] [Green Version]
- Barron, K.; Kung, E.; Proserpio, D. The Sharing Economy and Housing Affordability: Evidence from Airbnb. In Proceedings of the 2018 ACM Conference on Economics and Computation, Ithaca, NY, USA, 18–22 June 2018; p. 5. [Google Scholar]
- Rickly, J.; Hannam, K.; Mostafanezhad, M. (Eds.) Tourism and Leisure Mobilities: Politics, Work, and Play; Routledge: London, UK, 2016. [Google Scholar]
- Smith, G.S.; Breakstone, H.; Dean, L.T.; Thorpe, R.J. Impacts of gentrification on health in the US: A systematic review of the literature. J. Urban Health 2020, 97, 845–856. [Google Scholar] [CrossRef]
- McCartney, G.; Hearty, W.; Taulbut, M.; Mitchell, R.; Dryden, R.; Collins, C. Regeneration and health: A structured, rapid literature review. Public Health 2017, 148, 69–87. [Google Scholar] [CrossRef]
- Michalos, A.C. The impact of trust on business, international security and the quality of life. In Essays on the Quality of Life; Springer: Dordrecht, The Netherlands, 2003; pp. 391–415. [Google Scholar]


| Statistic | N | Mean | St. Dev. | Min | Max |
|---|---|---|---|---|---|
| ln(tourism pressure) | 340 | 8.54 | 0.923 | 5.74 | 12.104 |
| City | 121 | 8.452 | 0.715 | 5.74 | 10.757 |
| Town | 110 | 8.366 | 0.925 | 6.871 | 11.447 |
| Rural | 109 | 8.814 | 1.060 | 5.92 | 12.104 |
| Share of population in good or very good health | 1359 | 0.686 | 0.220 | 0.03 | 1 |
| 15–29 | 340 | 0.909 | 0.073 | 0.347 | 1 |
| 30–49 | 340 | 0.808 | 0.081 | 0.483 | 1 |
| 50–64 | 340 | 0.620 | 0.126 | 0.231 | 1 |
| Over 65 | 339 | 0.404 | 0.134 | 0.03 | 0.749 |
| Share of population in good or very good health | 1359 | 0.686 | 0.220 | 0.03 | 1 |
| City | 484 | 0.69 | 0.209 | 0.127 | 1 |
| Town | 436 | 0.685 | 0.222 | 0.07 | 1 |
| Rural | 435 | 0.679 | 0.23 | 0.03 | 1 |
| Share of housing burden | 1359 | 0.762 | 0.217 | 0 | 1 |
| 15–29 | 340 | 0.793 | 0.206 | 0 | 1 |
| 30–49 | 340 | 0.785 | 0.201 | 0 | 1 |
| 50–64 | 340 | 0.751 | 0.219 | 0 | 1 |
| Over 65 | 339 | 0.720 | 0.235 | 0 | 1 |
| Poverty rate | 1359 | 0.097 | 0.09 | 0 | 0.53 |
| 15–29 | 340 | 0.061 | 0.063 | 0 | 0.44 |
| 30–49 | 340 | 0.155 | 0.095 | 0 | 0.53 |
| 50–64 | 340 | 0.143 | 0.084 | 0 | 0.45 |
| Over 65 | 339 | 0.029 | 0.032 | 0 | 0.18 |
| Share of population which retrieves income from rent | 1359 | 0.105 | 0.080 | 0 | 0.75 |
| 15–29 | 340 | 0.084 | 0.074 | 0 | 0.48 |
| 30–49 | 340 | 0.090 | 0.068 | 0 | 0.49 |
| 50–64 | 340 | 0.118 | 0.073 | 0 | 0.41 |
| Over 65 | 339 | 0.127 | 0.096 | 0 | 0.75 |
| Location Quotient | 122 | 1.188 | 0.583 | 0.34 | 4.04 |
| GDP per inhabitant | 122 | 27,556.46 | 10,924.630 | 11,315.72 | 69,669.97 |
| Sub-Category | ß (SE) | |
|---|---|---|
| ln(tourism pressure) | −0.019 ** | |
| (−0.009) | ||
| Housing burden (%) | −0.133 *** | |
| (−0.024) | ||
| Poverty rate (%) | −0.113 *** | |
| (−0.04) | ||
| Income from rent (%) | 0.113 *** | |
| (−0.038) | ||
| GDP per inhabitant | 7.45 × 10⁻⁷ | |
| 7.9 × 10⁻⁶ | ||
| Capital dummy | −0.002 | |
| (−0.025) | ||
| LQ low (<0.7) | −0.027 | |
| (−0.021) | ||
| LQ high (>1.3) | 0.028 | |
| (−0.017) | ||
| Urbanization type | City | |
| Town | −0.134 ** | |
| (−0.067) | ||
| Rural | −0.192 *** | |
| (−0.068) | ||
| Age group | 15−29 | 0.106 * |
| (−0.061) | ||
| 30–49 | ||
| 50–64 | −0.302 *** | |
| (−0.061) | ||
| Over 65 | −0.600 *** | |
| (−0.061) | ||
| ln(tourism pressure) * 15–29 | −0.002 | |
| (−0.007) | ||
| ln(tourism pressure) * 30–49 | - | |
| ln(tourism pressure) * 50–64 | 0.012 * | |
| (−0.007) | ||
| ln(tourism pressure) * over 65 | 0.020 *** | |
| (−0.007) | ||
| City * ln(tourism pressure) | - | |
| Town * ln(tourism pressure) | 0.016 ** | |
| (−0.008) | ||
| Rural * ln(tourism pressure) | 0.021 *** | |
| (−0.008) | ||
| Constant | 1.065 *** | |
| (−0.079) | ||
| sd(Time) | 0.017 | |
| sd(NUTS) | 0.021 | |
| sd(nuts-year) | 0.053 | |
| sd(nuts-year: LQ HIGH) | 0.045 | |
| sd(nuts-year: LQ LOW) | 0 | |
| sd(residual) | 0.085 | |
| Observations | 1359 | |
| Log Likelihood | 1229.95 | |
| Akaike Inf. Crit. | −2403.90 | |
| Bayesian Inf. Crit. | −2258.29 |
| Urbanization Level | Age | β | SE |
|---|---|---|---|
| City | 15–29 | −0.021 ** | (−0.009) |
| 30–49 | −0.019 ** | (−0.009) | |
| 50–64 | −0.007 | (−0.009) | |
| >65 | 0.001 | (−0.009) | |
| Town | 15–29 | −0.005 | (−0.007) |
| 30–49 | −0.003 | (−0.007) | |
| 50–64 | 0.009 | (−0.007) | |
| >65 | 0.017 ** | (−0.007) | |
| Rural | 15–29 | 0.001 | (−0.007) |
| 30–49 | 0.002 | (−0.007) | |
| 50–64 | 0.015 ** | (−0.007) | |
| >65 | 0.022 *** | (−0.007) |
| Variables | Model 1 | Model 2 |
|---|---|---|
| ln(tourism pressure) | 0.188 * | 0.235 *** |
| (0.113) | (0.0819) | |
| Share of poverty | −0.0429 | |
| (0.0483) | ||
| Share of housing burden | −0.0893 | |
| (0.0617) | ||
| Share of income from rent | 0.0304 | |
| (0.0808) | ||
| Time = 2013 (reference category is 2018) | 0.0141 | 0.0164 |
| (0.0207) | (0.0135) | |
| Observations | 2188 | 2188 |
| Number of n_unique_id | 1094 | 1094 |
| Fixed Effects | Yes | Yes |
| Heritage per 1000 km2 | Yes | Yes |
| Ryanair Airports per 1000 km | Yes | Yes |
| Controls | Yes | No |
| Type LQ | None | None |
| First Stage F-Stat | 28.70 | 29.04 |
| Kleibergen Paap Lm | 5.687 | 5.597 |
| p value Kleibergen Paap | 0.0582 | 0.0609 |
| Hansen J | 0.0915 | 0.0575 |
| p value Hansen J | 0.762 | 0.811 |
Publisher’s Note: MDPI stays neutral with regard to jurisdictional claims in published maps and institutional affiliations. |
© 2022 by the authors. Licensee MDPI, Basel, Switzerland. This article is an open access article distributed under the terms and conditions of the Creative Commons Attribution (CC BY) license (https://creativecommons.org/licenses/by/4.0/).
Share and Cite
Bornioli, A.; Vermeulen, S.J.; van Haaren, J.; Valente, R.; Mingardo, G. The Impacts of Tourism Stays on Residents’ Self-Reported Health: A Pan-European Analysis on the Role of Age and Urbanization Level. Sustainability 2022, 14, 1157. https://doi.org/10.3390/su14031157
Bornioli A, Vermeulen SJ, van Haaren J, Valente R, Mingardo G. The Impacts of Tourism Stays on Residents’ Self-Reported Health: A Pan-European Analysis on the Role of Age and Urbanization Level. Sustainability. 2022; 14(3):1157. https://doi.org/10.3390/su14031157
Chicago/Turabian StyleBornioli, Anna, Susan J. Vermeulen, Jeroen van Haaren, Riccardo Valente, and Giuliano Mingardo. 2022. "The Impacts of Tourism Stays on Residents’ Self-Reported Health: A Pan-European Analysis on the Role of Age and Urbanization Level" Sustainability 14, no. 3: 1157. https://doi.org/10.3390/su14031157