Article

Development and Validation of a Low-Cost Gas Density Method for Measuring Biochemical Methane Potential (BMP)

1
Department of Engineering, Aarhus University, Finlandsgade 12, 8200 Aarhus N, Denmark
2
Advanced Water Management Centre, The University of Queensland, Brisbane, QLD 4072, Australia
3
Department of Chemical Engineering and Analytical Chemistry, University of Barcelona, 08028 Barcelona, Spain
4
Chair of Urban Water Systems Engineering, Technical University of Munich, Am Coulombwall 3, 85748 Garching, Germany
5
Biochemical Conversion Department, Deutsches Biomasseforschungszentrum gemeinnützige GmbH, Torgauer Straße 116, 04347 Leipzig, Germany
6
Department of Chemical Engineering, Biotechnology and Environmental Technology, University of Southern Denmark, 5230 Odense M, Denmark
*
Authors to whom correspondence should be addressed.
Water 2019, 11(12), 2431; https://doi.org/10.3390/w11122431
Submission received: 30 October 2019 / Revised: 15 November 2019 / Accepted: 17 November 2019 / Published: 20 November 2019

Abstract

:
Accurate determination of biochemical methane potential (BMP) is important for both biogas research and practice. However, access to laboratory equipment limits the capacity of small laboratories or biogas plants to conduct reliable BMP assays, especially in low- and middle-income countries. This paper describes the development and validation of a new gas density-based method for measuring BMP (GD-BMP). In the GD-BMP method, biogas composition is determined from biogas density. Biogas density is based on bottle mass loss and biogas volume, and these can be accurately measured using only a standard laboratory scale, inexpensive syringes, and a simple manometer. Results from four experiments carried out in three different laboratories showed that the GD-BMP method is both accurate (no significant bias compared to gravimetric or volumetric methods with biogas analysis by gas chromatography) and precise (<3% relative standard deviation is possible). BMP values from the GD-BMP method were also comparable to those measured for the same substrates with an industry standard automated system (AMPTS II) in two independent laboratories (maximum difference 10%). Additionally, the GD-BMP method was shown to be accurate even in the presence of leakage by excluding leakage from mass loss measurements. The proposed GD-BMP method represents a significant breakthrough for both biogas research and the industry. With it, accurate BMP measurement is possible with only a minimal investment in supplies and equipment.

1. Introduction

Anaerobic digestion is a well-developed technology for recovery of renewable energy in the form of methane (CH4) from agricultural, municipal, and industrial organic wastes. Biochemical methane potential (BMP), the maximum achievable CH4 yield from a particular substrate, is a key parameter for evaluation of substrates and pre-treatment methods, and is important for both research and biogas plant management [1,2,3].
Conventional experimental methods for measuring BMP are typically based on either volumetric displacement in an external vessel while keeping pressure constant, or measurements of pressure accumulation inside a BMP bottle headspace with a fixed volume. These methods are known as volumetric and manometric, respectively [1,3,4]. Gravimetric measurement is also possible, and has some advantages over conventional approaches, including accuracy even in the presence of leakage [5,6]. Separate determination of the CH4 content of the biogas is typically required for all these methods. CH4 content is commonly measured with a gas chromatograph (GC) or infrared (IR) gas analyzer, which require a significant financial investment for purchase, maintenance, and calibration standards, as well specialized technical skills for accurate measurements. Removal of carbon dioxide (CO2) and measurement of residual CH4 volume is an alternative, but manual approaches are time-consuming and introduce additional errors as well as costs for chemicals and handling [2]. Automated systems that include CO2 removal by scrubbing the biogas through a alkaline solution appear to perform well [7,8]. However, the cost of an automated system is too high for many laboratories and biogas plants, particularly in low- and middle-income countries, restricting research and application. This paper addresses this limitation by presenting a simple yet accurate approach for measurement of BMP.
In this paper, a new BMP method that relies on measurement of biogas density for estimating CH4 content within biogas is presented. Mass loss due to venting of biogas from BMP bottles and the vented biogas volume are measured as in existing gravimetric and volumetric methods. The key advantage of the gas density-based BMP (GD-BMP) method is that it requires only simple, inexpensive, and common laboratory equipment, including a laboratory scale and equipment for measurement of biogas volume. The GD-BMP method eliminates the need for a gas chromatograph or other gas analysis instrument for BMP measurement. The objectives of this paper were to (1) describe the new GD-BMP method and (2) validate the method by comparison to conventional BMP measurement methods in multiple independent trials.

2. Materials and Methods

2.1. The GD-BMP Method

The GD-BMP measurement approach is based on a measurement of both bottle mass loss and vented biogas volume in each sampling event over time. With these measurements, biogas density can be determined, and from that, biogas composition. These calculations exploit the clear and measurable relationship between biogas composition and biogas density, which is the result of the large difference in molar mass of CH4 and CO2. Dry biogas density at 0 °C and 101 kPa more than doubles as composition changes from pure CH4 (0.72 mg mL−1) to pure CO2 (2.0 mg mL−1). With a density-based estimate of CH4 mole fraction and measurement of biogas volume (or mass), calculation of CH4 production is simple.

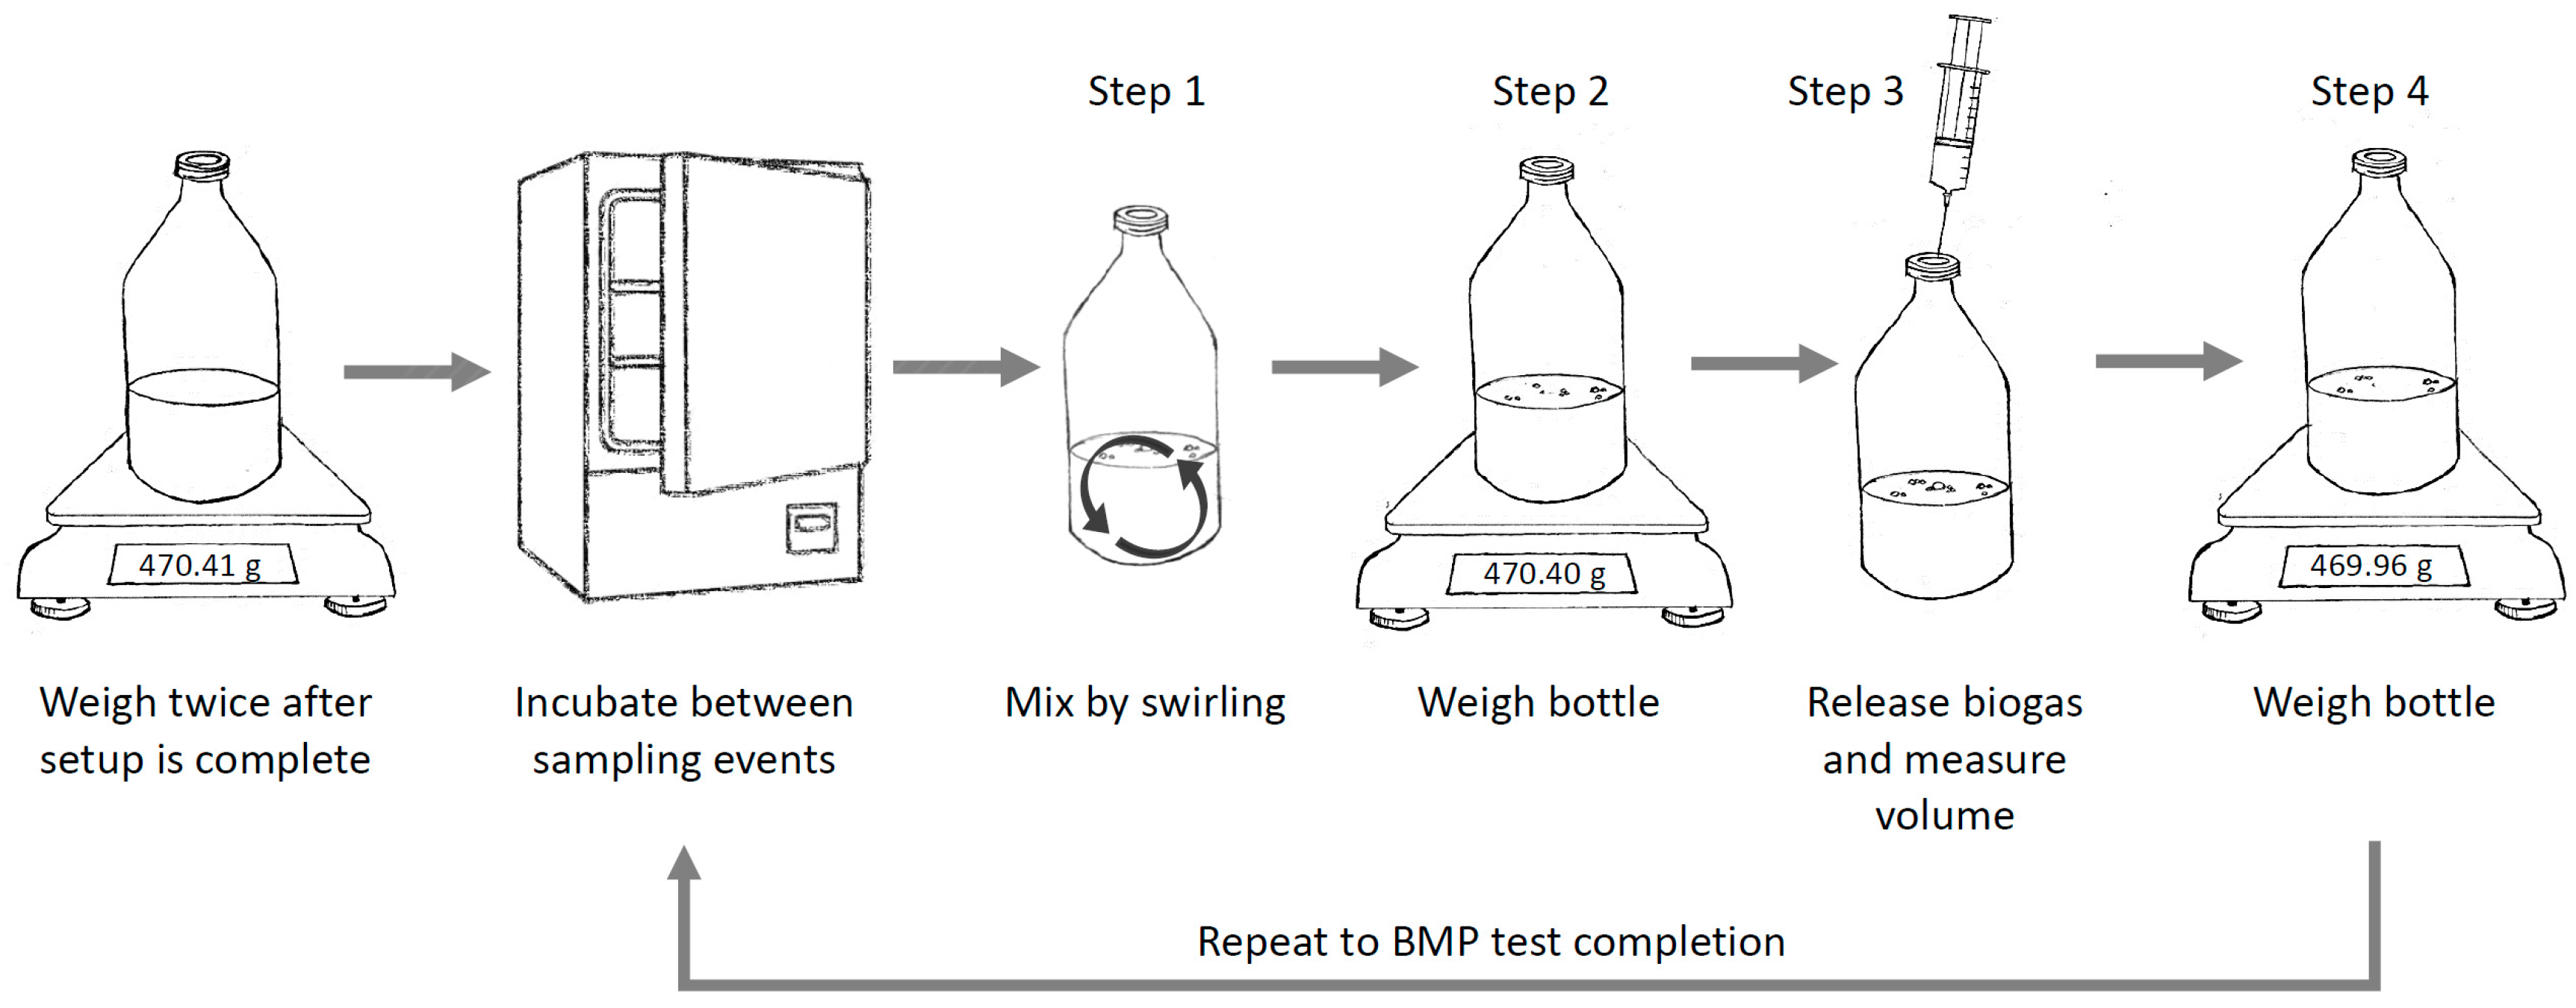
2.1.1. GD-BMP Method Measurements

The GD-BMP method requires an electronic scale with sufficient accuracy (typically readability of 0.01 g or better), equipment for measuring biogas volume at atmospheric pressure (e.g., plastic syringes and a U-tube manometer), an incubator, and usual BMP supplies such as bottles, septa, and screw tops or crimps. Bottles were prepared and incubated as with other conventional methods [9,10] and occasionally removed from the incubator to measure accumulated biogas quantity (and avoid dangerously high headspace pressure). During measurements, accumulated biogas volume is removed as with conventional volumetric methods [11]. However, for GD-BMP measurements, both mass loss and biogas volume are measured. For each bottle, the following steps are carried out during each sampling event (Figure 1):
(1)
Mix the bottle by swirling, avoiding contact between the slurry and the septum;
(2)
Weigh the bottle and record the pre-venting mass;
(3)
Remove biogas with a syringe and record vented biogas volume at atmospheric pressure;
(4)
Weigh the bottle and record post-venting mass.
These measurements are sufficient for determining biogas volume, CH4 volume, and biogas leakage. Room temperature, or the temperature at which biogas volume is measured, should be measured as well for volume standardization. Sampling time for each set of triplicates was ca. 1–3 min per bottle in the experiments described below (Section 2.2). Assuming 12 sampling events for 18 bottles (three inoculum-only, three cellulose, three different substrates, and three water controls) time required for biogas measurements would be 4–11 h plus time for bottle transfer and other necessary tasks. Accurate weighing is essential, and scales should be initially checked with a weight set, and a stable response confirmed by weighing water-only control bottles (in triplicate) during each sampling event, as in the gravimetric method [5]. It is important that changes in bottle mass are due only to the loss of biogas, and not, e.g., the loss of reacting material through a needle, the presence of water on the bottle surface, or addition or removal of tape or a label, all of which should be avoided.

2.1.2. GD-BMP Method Calculations

In the GD-BMP method, measured mass loss and vented biogas volume from one or more sampling events are used to determine biogas density, and from that, biogas composition (i.e., CH4 content). The resulting estimates of CH4 content are then used with either mass loss or measured volume to determine CH4 production.
Biogas density under standard conditions of 101.325 kPa and 0 °C ( ρ b , g mL−1) is calculated from bottle mass loss ( Δ m b , g) and standardized biogas volume ( V b , mL), with a correction for the water vapor content of vented biogas ( c H 2 O , g mL−1). Standardized biogas volume is determined from the measured vented volume (step 3 above) by correcting for moisture, temperature, and pressure [5,12]. Mass loss is determined from changes in post-venting bottle mass between sampling events (step 4, above) or the change in bottle mass during venting (step 2 minus step 4, above):
ρ b = Δ m b V b c H 2 O .
Water vapor pressure ( p H 2 O , kPa) can be calculated following Alduchov and Eskridge [13], assuming saturation:
p H 2 O = 0.61094 e 17.625 T h s 243.04 + T h s .
In Equation (2), T h s is the bottle headspace temperature at the time of venting (°C). Assuming bottles are removed from an incubator for measurement, T h s will be between incubation and room temperatures. The concentration of water present in vented biogas ( c H 2 O , g mL−1, dry standardized biogas volume basis) is then calculated from this value, water molar mass ( M H 2 O = 18.02 g mol−1), pressure of biogas in the bottle headspace just prior to venting ( P h s , kPa), and the molar volume of biogas at standard conditions ( v b , assumed to be 22300 mL mol−1 [5]):
c H 2 O = M H 2 O · p H 2 O p h s p H 2 O · 1 v b .
Equation (3) is the only expression where bottle headspace temperature and pressure must be considered. As with the gravimetric method, variation in headspace temperature and pressure have only minor effects [5]. Pressure can be approximated from the volume of vented biogas (ratio of vented biogas volume to headspace volume times ambient pressure, plus ambient pressure). Temperature can be measured in a representative bottle containing water, or approximated, e.g., as 5 °C below incubator temperature. For both pressure and temperature, a single, fixed value for all observations is sufficient [6]. The molar mass of biogas ( M b , g mol−1) is then obtained from biogas density:
M b = ρ b · v b .
Finally, the mole fraction of CH4 in biogas ( x CH 4 , dimensionless) normalized for CH4 and CO2 ( x CH 4 +   x CO 2 =   1 ) is calculated from molar masses of CO2, CH4, and biogas ( M CO 2 = 44.01 g mol−1, M CH 4 = 16.04 g mol−1):
x CH 4 = M CO 2 M b M CO 2 M CH 4 .
From Equation (5), the content of CH4 in the biogas is known and can be used for calculation of BMP as with gravimetric or volumetric methods. Equation (5) is based on the assumption that biogas contains only CH4 and CO2. The presence of flushing gas will have a small effect (usually <5%). When N2 is used as a flushing gas (recommended for the GD-BMP method), error will be negligible when x CH 4 is ca. 0.58, because biogas has the same density as N2 in this case (1.25 mg mL−1). The use of other gases or mixtures complicates this issue. In particular the high density of N2/CO2 mixtures inflates this source of error, and also adds uncertainty about the fate of flushing gas (vented or in solution). As long as nearly all flushing gas has been removed by the end of a trial, this source of error can be addressed by simply subtracting the flushing gas mass from Δ m b and volume from V b using Equations (6) and (7).
V b = V b V f .
Δ m b = Δ m b d f V f .
In Equations (6) and (7), V f is the standardized volume of flushing gas in the bottle headspace prior to any venting, and d f is the density of flushing gas under standard conditions. Corrected measurements V b and Δ m b can be used in Equation (1) to correct for the flushing gas error. In this work, for simplicity and because N2 was used as the flushing gas, this correction was not applied universally, but was explored for ethanol as substrate, which resulted in the highest value of x CH 4 (and so the highest expected error). This complication also applies to the gravimetric method, and was described previously [5].

2.1.3. Variations on GD-BMP Application (GDt, GDi, and GDv)

Mass loss ( Δ m b ) and biogas volume ( V b ) used in Equation (1) may be from a single measurement interval or the sum (volume) or difference (mass) over multiple intervals (Figure 2). With low resolution in gravimetric measurements and compensation among interval errors in mass, the use of multiple intervals provides better precision. Here, two approaches were explored: single interval values, and “complete” values from the start to end of a trial. In addition, mass loss ( Δ m b ) for a single measurement interval (between two sampling events) can be calculated in one of two ways. It may be the total mass loss over an interval, calculated as the difference between post-venting mass (step 4, above) at two sampling times. This is referred to as the “total” mass loss approach here, because it is based on the apparent total mass loss that occurred during incubation and venting. Alternatively, where leakage is present, a venting-only mass loss may be calculated as the difference between the pre- and post-venting mass at a single time. This second approach is referred to as “venting” mass loss here, because it is based on apparent mass loss during venting only, which will provide a more accurate measure of the mass of vented biogas when the leakage is significant (Figure 2). Lastly, once biogas composition has been determined, either gravimetric or volumetric approaches can be used to calculate CH4 production. If total mass loss is used in GD calculations, both gravimetric and volumetric approaches will provide the same results, because the GD method links mass loss and biogas volume through x CH 4 . However, when venting mass loss is used, this is not the case, and only the gravimetric approach will be unbiased when leakage has occurred.
Combination of two alternatives for each of these three components (interval or complete mass loss and volume summation, total or venting mass loss, and volumetric or gravimetric biogas volume calculations) results in eight possible GD algorithms (Table S1). Only six are truly unique, because of the equivalence of gravimetric and volumetric approaches when total mass loss is used. Of these only four are logical; it does not make sense to combine the venting mass approach with volumetric measurements, because bias is guaranteed when using volumetric calculations in the presence of leakage. With no measurement error, all algorithms will result in identical BMP estimates. In practice, some algorithms have advantages. This work was primarily focused on two: GDt is based on complete summation, total mass loss, and volumetric calculations, while GDv uses complete summation, venting mass loss, and gravimetric calculations (Figure 2). A third approach, GDi, based on interval values, total mass loss, and volumetric calculations was included for evaluation of the GD-BMP method, but is not recommended for regular use.

2.2. Experiments

The GD-BMP method was developed and validated in three groups of experiments, focused on: (1) development and initial testing, (2) inter-laboratory transfer of the method, and (3) inter-laboratory evaluation. Experiments are summarized in Table 1 and additional details on substrates can be found in the supplementary material (Table S2).

2.2.1. Experiments 1A and 1B: Method Development and Initial Testing

Two experiments (1A and 1B) were carried out at the University of Southern Denmark (Odense, Denmark) in early 2017, where BMP was measured using volumetric, manometric, gravimetric, and GD methods on the same set of bottles. Gravimetric and volumetric methods followed the procedure described previously [5]. Both included two defined substrates (microcrystalline cellulose (Avicel) and ethanol). All bottles were sealed with a bromobutyl rubber septum (article no. 4408, West Pharmaceuticals, Le Nouvion-en-Thiérache, France) and flushed with N2 for at least one headspace exchange before incubation at 35 ± 1°C. Biogas volume was measured using 150 and 1000 mL syringes. Needles were 21 gauge (0.8 mm) stainless steel with a beveled tip (BD Medical, Franklin Lakes, NJ, USA). Mass loss was measured with a Mettler PJ3600 electronic scale (Zurich, CH, 1992 model, readability of 0.01 g for masses < 600 g, otherwise 0.1 g). Pressure measurements were made using a Dwyer 475-7-FM manometer (Michigan City, IN, USA) or a Sper Scientific 840082 manometer (Scotsdale, MI, USA) before and after biogas venting. Biogas composition for use with volumetric, manometric, and gravimetric methods was measured with an Agilent 7890A GC equipped with an Agilent J&W 113-4332GS column (Santa Clara, CA, USA). Three bottles were included for each substrate, and for the inoculum-only condition, and were incubated at 35 ± 1 °C.
In the first experiment (1A), three dried ground animal feed ingredients (FI1, FI2, and FI3) were used as substrates in addition to cellulose and ethanol. Substrate total solids (TS) and volatile solids (VS) were determined by drying at 105 °C and burning at 550 °C, following Baird et al. [14]. Bottles had a total volume of 1100 mL and a headspace volume between 600 and 840 mL. Total bottle mass was ca. 830–1100 g. Inoculum was digestate from a full-scale anaerobic digester at the Ejby Mølle WWTP in Odense, Denmark. The digester treats a mixture of primary and secondary sludge, along with a much smaller mass of highly degradable industrial organic waste. Retention time was ca. 25 d and operating temperature 35 °C. In the experiment, inoculum-to-substrate ratio (ISR) varied from ca. 2 to 4 (VS basis) depending on the expected substrate biodegradability and methane yield. The inoculum was stored at 35 °C for 5 days prior to use. One mL each of a vitamin mixture and trace element solution was added to each BMP bottle following Holliger et al. [10].
In the second experiment (1B), raw and hydrolyzed municipal wastewater sludge was used as substrate. Mixed primary and secondary sludge from a WWTP in Grevesmühlen Germany was treated by thermal hydrolysis (Haarslev Industries Thermal Hydrolyser, Haarslev Industries, Søndersø, Denmark). TS and VS were measured as in Experiment 1A. Inoculum was digestate from a mesophilic digester at the Næstved WWTP in Denmark (Næstved, Denmark, details on temperature and retention time were not available). Bottles had a total volume of 320 mL, a total mass of ca. 350–410 g, an ISR of 1.8–4.6, and a headspace volume of ca. 125–230 mL. In this experiment, biogas leakage eventually occurred for all substrates.

2.2.2. Experiment 2: GD Method Transfer

To ensure that success of the GD method did not depend on particular equipment or technicians, and that the method could be successfully transferred, an experiment was carried out at the University of Queensland in Brisbane, Australia. The GD protocol and related information was shared by email messages and phone calls.
In Experiment 2, the BMP of cellulose and FI3 was measured using three distinct BMP methods. Manometric and gravimetric methods (with biogas analysis by GC) were applied to one set of bottles, and GD-BMP was applied to another set that was meant to be identical. The gravimetric method followed Hafner et al. [5], and the manometric method followed Hafner and Astals [6]. Bottles had a total volume of 160 mL, an ISR of 2, a total mass of ca. 190 g, and a headspace volume of ca. 80 mL. Septa were 13 mm thick T-shape black butyl rubber from Rubber BV (product number 7395, Hilversum, The Netherlands). Inoculum was collected from a digester treating mixed sludge (ca. 1:1 primary to secondary sludge on a VS basis) at 35 °C and a hydraulic retention time of ca. 24 days at a municipal WWTP in South East Queensland, Australia. The inoculum was incubated at 37 °C for 4 days prior to starting the experiments. TS and VS were measured as in Experiment 1A. An electronic manometer (Sper Scientific 840064) was used for manometric measurements. Bottle mass was measured using an analytical balance (#ALJ 310-4A, Kern and Sohn GmbH, 0.1 mg readability and repeatability, 0.3 mg accuracy (reported as linearity)) and volume by three 60 mL three-part plastic syringes. Bottles were incubated at 37 ± 1 °C. Biogas composition of manometric/gravimetric bottles was measured using a Shimadzu GC-2014, with a HayeSep Q 80/100 packed column and a thermal conductivity detector (Kyoto, Japan).

2.2.3. Experiment 3: Inter-Laboratory Comparison

Experiment 3 included application of the GD-BMP measurement to three substrates (cellulose, FI3, and wheat straw (WS)) at Aarhus University in Aarhus, Denmark. A suitable gas chromatograph was not available at this location and therefore no gravimetric or volumetric measurements of BMP were made. Instead, for an independent evaluation of the GD method, the BMP of the same substrates was also measured in two other laboratories: Chair of Urban Water Systems Engineering at the Technical University of Munich (TUM) in Garching, Germany, and Deutsches Biomasseforschungszentrum gemeinnützige GmbH (DBFZ) in Leipzig, Germany. Both used the automated AMPTS II system for measuring BMP (Bioprocess Control, Lund, Sweden). ISR was ca. 2 for cellulose and FI3 and ca. 1 for WS in all three labs. TS and VS were measured as in Experiment 1A at all three locations, and overall mean values for substrates were used in calculations. Experiments were carried out in late 2018.
In Aarhus, inoculum was taken from a mesophilic sludge digester at the Marselisborg municipal WWTP (Aarhus, Denmark), and was stored in an incubator at incubation temperature for 3 days prior to analysis. Total bottle volume was 520 mL and bottle headspace was ca. 375 mL for substrate bottles and ca. 115 mL for inoculum. As in Experiment 1A, 1 mL each of the vitamin mixture and trace element solution were added to each bottle. All bottles were sealed with a bromobutyl rubber septum (West Pharmaceuticals, Le Nouvion-en-Thiérache, France) and flushed with N2 for at least three headspace exchanges before incubation at 37 ± 1 °C. Plastic syringes 60 or 150 mL in size with 23 gauge stainless steel needles and a simple closed U-tube manometer containing water were used to measure vented volume. With these small syringes it was not possible to measure all vented biogas by filling a single syringe once. Instead, BMP bottles were vented in steps, using a valve and the manometer to ensure that biogas was at ambient pressure for volume measurement. A Sartorious electronic scale was used to measure mass loss (QUINTIX2102-1S, Sartorious Lab Instruments GbbH and Co. KG, Goettingen, Germany, readability and repeatability: 0.01 g, accuracy (reported as linearity): 0.03 g). Room temperature and ambient pressure were recorded at each sampling event (19.0–22.1 °C and 99.7–101.7 kPa). Mass measurements were corrected for drift in the scale based on the measured mass of a water-only control.
In Garching, digested sewage sludge used as an inoculum was collected from the Garching WWTP (Garching, Bavaria, Germany), which primarily treats municipal wastewater. The digester is fed with a mixture of primary and secondary sludge and is operated at mesophilic conditions (ca. 38 °C) with a hydraulic retention time of ca. 30 days. The total volume was 500 mL and operating volume for the BMP test was 450 mL, mixing was automatic, with 5 min of mixing and 25 min without. All bottles were flushed with a mixture of 65% N2 + 35% CO2 at a flow rate of 2.5 L per minute for 30 s (> 5 volume exchanges). Bottles were incubated at 38 ± 1°C.
In Leipzig, digestate from a laboratory reactor (400 L) operated at mesophilic temperatures (38 ± 2 °C) and a retention time of ca. 98 days was utilized as inoculum for BMP tests. The reactor was fed with a mixture of sieved cattle manure, rapeseed oil, wheat flour, dried maize silage, and distiller’s grain as well as additional trace elements and urea to guaranty stable process conditions. BMP tests were carried out with a total bottle volume of 500 mL and an operating volume of ca. 400 mL at 38 ± 1 °C. All bottles were flushed with pure N2 prior to incubation (flow rate and volume of flushing gas was not determined). Automated stirring with 30 s with mixing and 360 without was used during the trial.

2.2.4. Data Processing

Data from all four experiments were processed using R version 3.5.2 [15] and version 1.22 of the biogas package [16]. Biogas production was determined for each sampling event by volumetric, manometric, or gravimetric methods using the “cumBg()” function from the biogas package. GC measurements of biogas composition were used for these three methods, with normalized CH4 concentration ( x CH 4 +   x CO 2 =   1 , cmethod = “removed” in cumBg()). Volumetric and gravimetric calculations are described by Hafner et al. [5] while manometric calculations are described by [6]. Gravimetric results were corrected for an initial headspace of N2 [5]. For the GD-BMP approach, the newly developed calcBgGD() function was used. This function implements the calculations described above, including the option to correct for flushing gas. For all measurements, the summBg function was used to calculate BMP from cumulative CH4 volume as described in Hafner [12]. BMP was expressed as dry CH4 volume at 101.325 kPa and 0 °C per g substrate VS. Random error included contributions from substrate bottles and inoculum-only bottles. Specific methane production (SMP, or CH4 yield) was determined by applying the same calculations to measurements from each sampling event.
Experiments were run at least as long as the 1% duration recommended by Holliger et al. [10]. In Experiments 1 and 2, BMP was evaluated at a fixed time to facilitate comparison among methods: 31, 21, and 27 d for 1A, 1B, and 2, respectively. For Experiments 1A and 2, these were the latest times. For Experiment 1B, net CH4 production rates were above the 1% criterion for RS, HS1, and HS2 at 21 d, but measurements were inadvertently omitted at 31 d for some bottles, so the earlier time was selected. In Experiment 3, where each lab used a different inoculum and kinetics likely differed among labs, BMP was evaluated at the 1% duration (when net cumulative CH4 production dropped below 1% of the net cumulative value, after subtracting the inoculum contribution, for at least 3 days [10]) but with a minimum duration of 25 days.
Gas temperature was assumed to be 30 °C in bottle headspace [6] for use in Equation (2). Biogas temperature at the time of volume measurement for use in calculating standardized volume from the measured volume was taken as the measured room temperature (or 20 °C where measurements were not made). Ambient pressure was measured in Experiment 3, and in other cases a value of 101.3 kPa was assumed for volume measurements. For gravimetric calculations, a headspace pressure of 150 kPa (absolute) was assumed for the water vapor correction (uncertainty here has only small effects on results [6]).
Leakage in the individual bottles was identified and accounted for when cumulative mass loss exceeded the total detection limit estimated from water-only bottles [17]. Total detection limits were set to interval detection limits multiplied by the square root of the number of intervals, where the interval detection limit was five times the standard deviation of the mass of water-only controls [18].

2.2.5. Evaluation of GD-BMP

The GD method was evaluated by comparing BMP mean and standard deviation (as relative standard deviation, RSD) to estimates made with other methods. Gravimetric estimates were taken as the primary reference values, because of lower systematic error and lower sensitivity to leakage [5,6]. Evaluation was also done based on biogas composition. Overall volume-weighted GC-based estimates of x CH 4 were calculated as the ratio of cumulative CH4 to cumulative biogas volume. The presence of systematic differences between gravimetric and GD results was evaluated using an analysis of variance (ANOVA) and Dunnett’s test with the aov function from the stats package [15] and the glht function from the multcomp package [19]. Predictors included the measurement method, substrate, and, for Experiments 1A and 1B, bottle key. Additionally, rate information was extracted by fitting a single-pool first-order model to average rate data [9,20]. Estimation of the first-order rate constant k was done separately for each bottle based on minimization of the sum of squares, using the Levenburg–Marquardt algorithm as implemented in the nls.lm function [21]. Any observations within a “lag phase” (defined as all intervals earlier than the one with the maximum average CH4 production rate) were excluded from the objective function.

3. Results and Discussion

Results from the GD-BMP method were similar to gravimetric and volumetric results. When leakage was present, results based on the venting mass loss approach (instead of total mass loss) were more accurate.

3.1. Experiments 1A and 1B: Method Development and Initial Testing

3.1.1. Measurements Made without Biogas Leakage

BMP values calculated with the GD method (GDt, based on complete, total mass loss) in Experiment 1A were similar to gravimetric, manometric, and volumetric estimates (Table 2). The largest difference was for ethanol, for which the GD estimate was 9% below the gravimetric result. Biogas from ethanol had a high x CH 4 as expected (volume-weighted average of 0.72 from GC measurements) and, therefore, the error due to the effect of flushing gas on overall density was expected to be the highest. Including the correction presented in Equations (6) and (7) resulted in a higher BMP value (730 mL g−1) and significantly less error (< 1%). Both this value and estimates from all three non-GD methods were virtually identical (< 1% higher) to the theoretical maximum (728 mL g−1). The difference between GDt and gravimetric results was 7% for cellulose and below 5% for the three feed ingredients. The overall mean difference between GDt and gravimetric results was -21 mL g−1 (GDt lower) but there was insufficient evidence to conclude there was any systematic error (p = 0.24 from Dunnett’s test). However, random error was clearly higher for the GD results. Average relative standard deviation (RSD) was 13% for GDt vs. < 4% for the other methods. This RSD value was higher than the maximum of 5% recommended by [10] for homogenous substrates.
All SMP curves followed the typical pattern over time [22], and GDt and gravimetric curves were similar (not shown). The GDt approach provides a single estimate of biogas composition for each bottle, which is then applied over the duration of a BMP trial (see Section 2). These composition estimates were generally close to GC-based values, with differences ranging from −0.07 to +0.04 (mole fraction), excluding a single inoculum-only bottle with a difference of 0.14 (Figure 3).
Estimates of composition based on interval data, as in GDi, show why summation of mass loss and biogas volume (i.e., the use of “complete” measurements) is important for precision: interval estimates had very high random error (Figure 3). This error is due to limited precision when weighing small differences between two large masses. Error in interval measurements of mass loss was undoubtedly high in this experiment. The most common interval mass loss estimate was 0.1 g, and the median value was 0.2 g, both with only a single significant digit. Somewhat counterintuitively, these measurements were sufficient for estimating BMP with a higher degree of relative precision. Due to the non-additive nature of bottle mass loss estimates (when using total mass loss), these errors will tend to cancel or compensate over time, so BMP estimates may still be accurate even with clearly inaccurate interval estimates of composition and CH4 volume. In this experiment, complete mass loss (over the entire incubation, see Section 2) was > 1.0 g (with two significant digits) for all bottles except those with inoculum only. For FI1, for example, all GDi BMP estimates were within 7% of GDt values. However, lower relative error in complete mass loss estimates makes for more precise GDt estimates of x CH 4 , which were generally within 10% of GC results in this experiment (Figure 3). Incorporation of the initial headspace correction (Equations (6) and (7)) improved the accuracy of GDt estimates for ethanol, as expected (Figure 3), but did not clearly improve results for other substrates. For inoculum-only bottles, where total biogas volume was only slightly more than headspace volume, the bottle headspace must have contained a significant amount of N2 at the end of the trial, and the correction cannot be applied as described in Equations (6) and (7).
For individual bottles, error in composition estimates will generally increase as mass loss decreases, as reflected in the high error for inoculum-only bottles (Figure 4). Although error was relatively high for these bottles, effects on BMP were small, because of a moderate inoculum contribution to overall CH4 production (median of 22%). Comparing total biogas volume and apparent error in GDt x CH 4 for inoculum-only (total biogas volume < 1 L) and substrate bottles (total biogas production > 2 L) suggests that relative accuracy better than 10% will require a total biogas volume >1 L for the equipment used in this experiment.
Reported scale accuracy will typically differ from achieved accuracy, due in part to sources of error unrelated to the scale (e.g., air currents). Variation in the measured mass of water-only controls provides a true estimate. Standard deviation of water control mass measurements was about 24 mg in this experiment. Scale accuracy may be estimated as some multiple of this value (e.g., three or five times the standard deviation) and the standard deviation value itself may be used to evaluate the suitability of the scale for a particular experiment, based on earlier results (see Recommendations, below).

3.1.2. Measurements Made with Leakage

In Experiment 1B, biogas leakage was observed for at least one bottle for each substrate (but not for inoculum-only bottles), up to a maximum of 24% of biogas. Therefore, the GDt algorithm was not expected to be accurate. Indeed, GDt BMP estimates were lower than gravimetric results by as much as 20% (Table 3). However, the use of venting mass loss (instead of total mass loss) in the calculations through the GDv algorithm provided relatively accurate results. As in Experiment 1A, the largest difference was for ethanol, where the mean GDv estimate was 13% lower than the gravimetric result. Correction for initial headspace N2 results in a BMP of 765 mL g−1, closer to, but even higher (3%) than, the gravimetric estimate, which was itself slightly above the theoretical maximum. Excluding ethanol, the maximum difference was ca. 7%, for cellulose. The GDt method had a clear negative systematic error in this experiment (overall mean difference of −62 mL g−1, p < 0.001 from Dunnett’s test) due to leakage, but there was insufficient evidence to detect any bias in GDv results (overall mean difference of 6.9 mL g−1, p = 0.80 from Dunnett’s test).
Comparison of GDv and GC estimates of x CH 4 support results from Experiment 1A, where the apparent error in the GDv results was larger for inoculum-only bottles. Differences between the two methods were always < 0.10 (mole fraction) when total biogas production was > 1 L, and usually (for 21/24 bottles) < 0.05. High error (0.23–0.44) was observed for inoculum-only bottles. However, as in Experiment 1A, the effect on BMP estimates was small, because of the relatively small contribution that inoculum made to the total CH4 production (median of 10%).
These results show that the GD-BMP method can provide accurate results even when leakage is present, as long as venting mass loss is used in the calculations. This accuracy is an advantage over most other methods, shared only by the gravimetric method (with separate biogas analysis). As in Experiment 1A, random error was higher for GDv than for gravimetric results: RSD was 2% on average for gravimetric and 7% for GDv results. However, the readability of the scale used in both Experiment 1A and 1B limited the accuracy of results at least for inoculum-only bottles, and a higher accuracy scale was recommended (see Recommendations, below).
Although the same scale was used in both Experiment 1A and 1B, the smaller bottle masses in Experiment 1B resulted in higher resolution in mass measurements. A majority (70%) of interval mass loss measurements had two significant digits (mass < 600 g, see Section 2), and complete mass loss (over the entire experiment) was > 1.00 g for most bottles, resulting in three significant digits. Variability in the apparent mass of water control bottles was, not surprisingly, somewhat smaller than in Experiment 1A: 15 mg. However, effects of this higher measurement resolution on precision in BMP estimates were undoubtedly diminished by higher random error related to the use of venting mass loss.

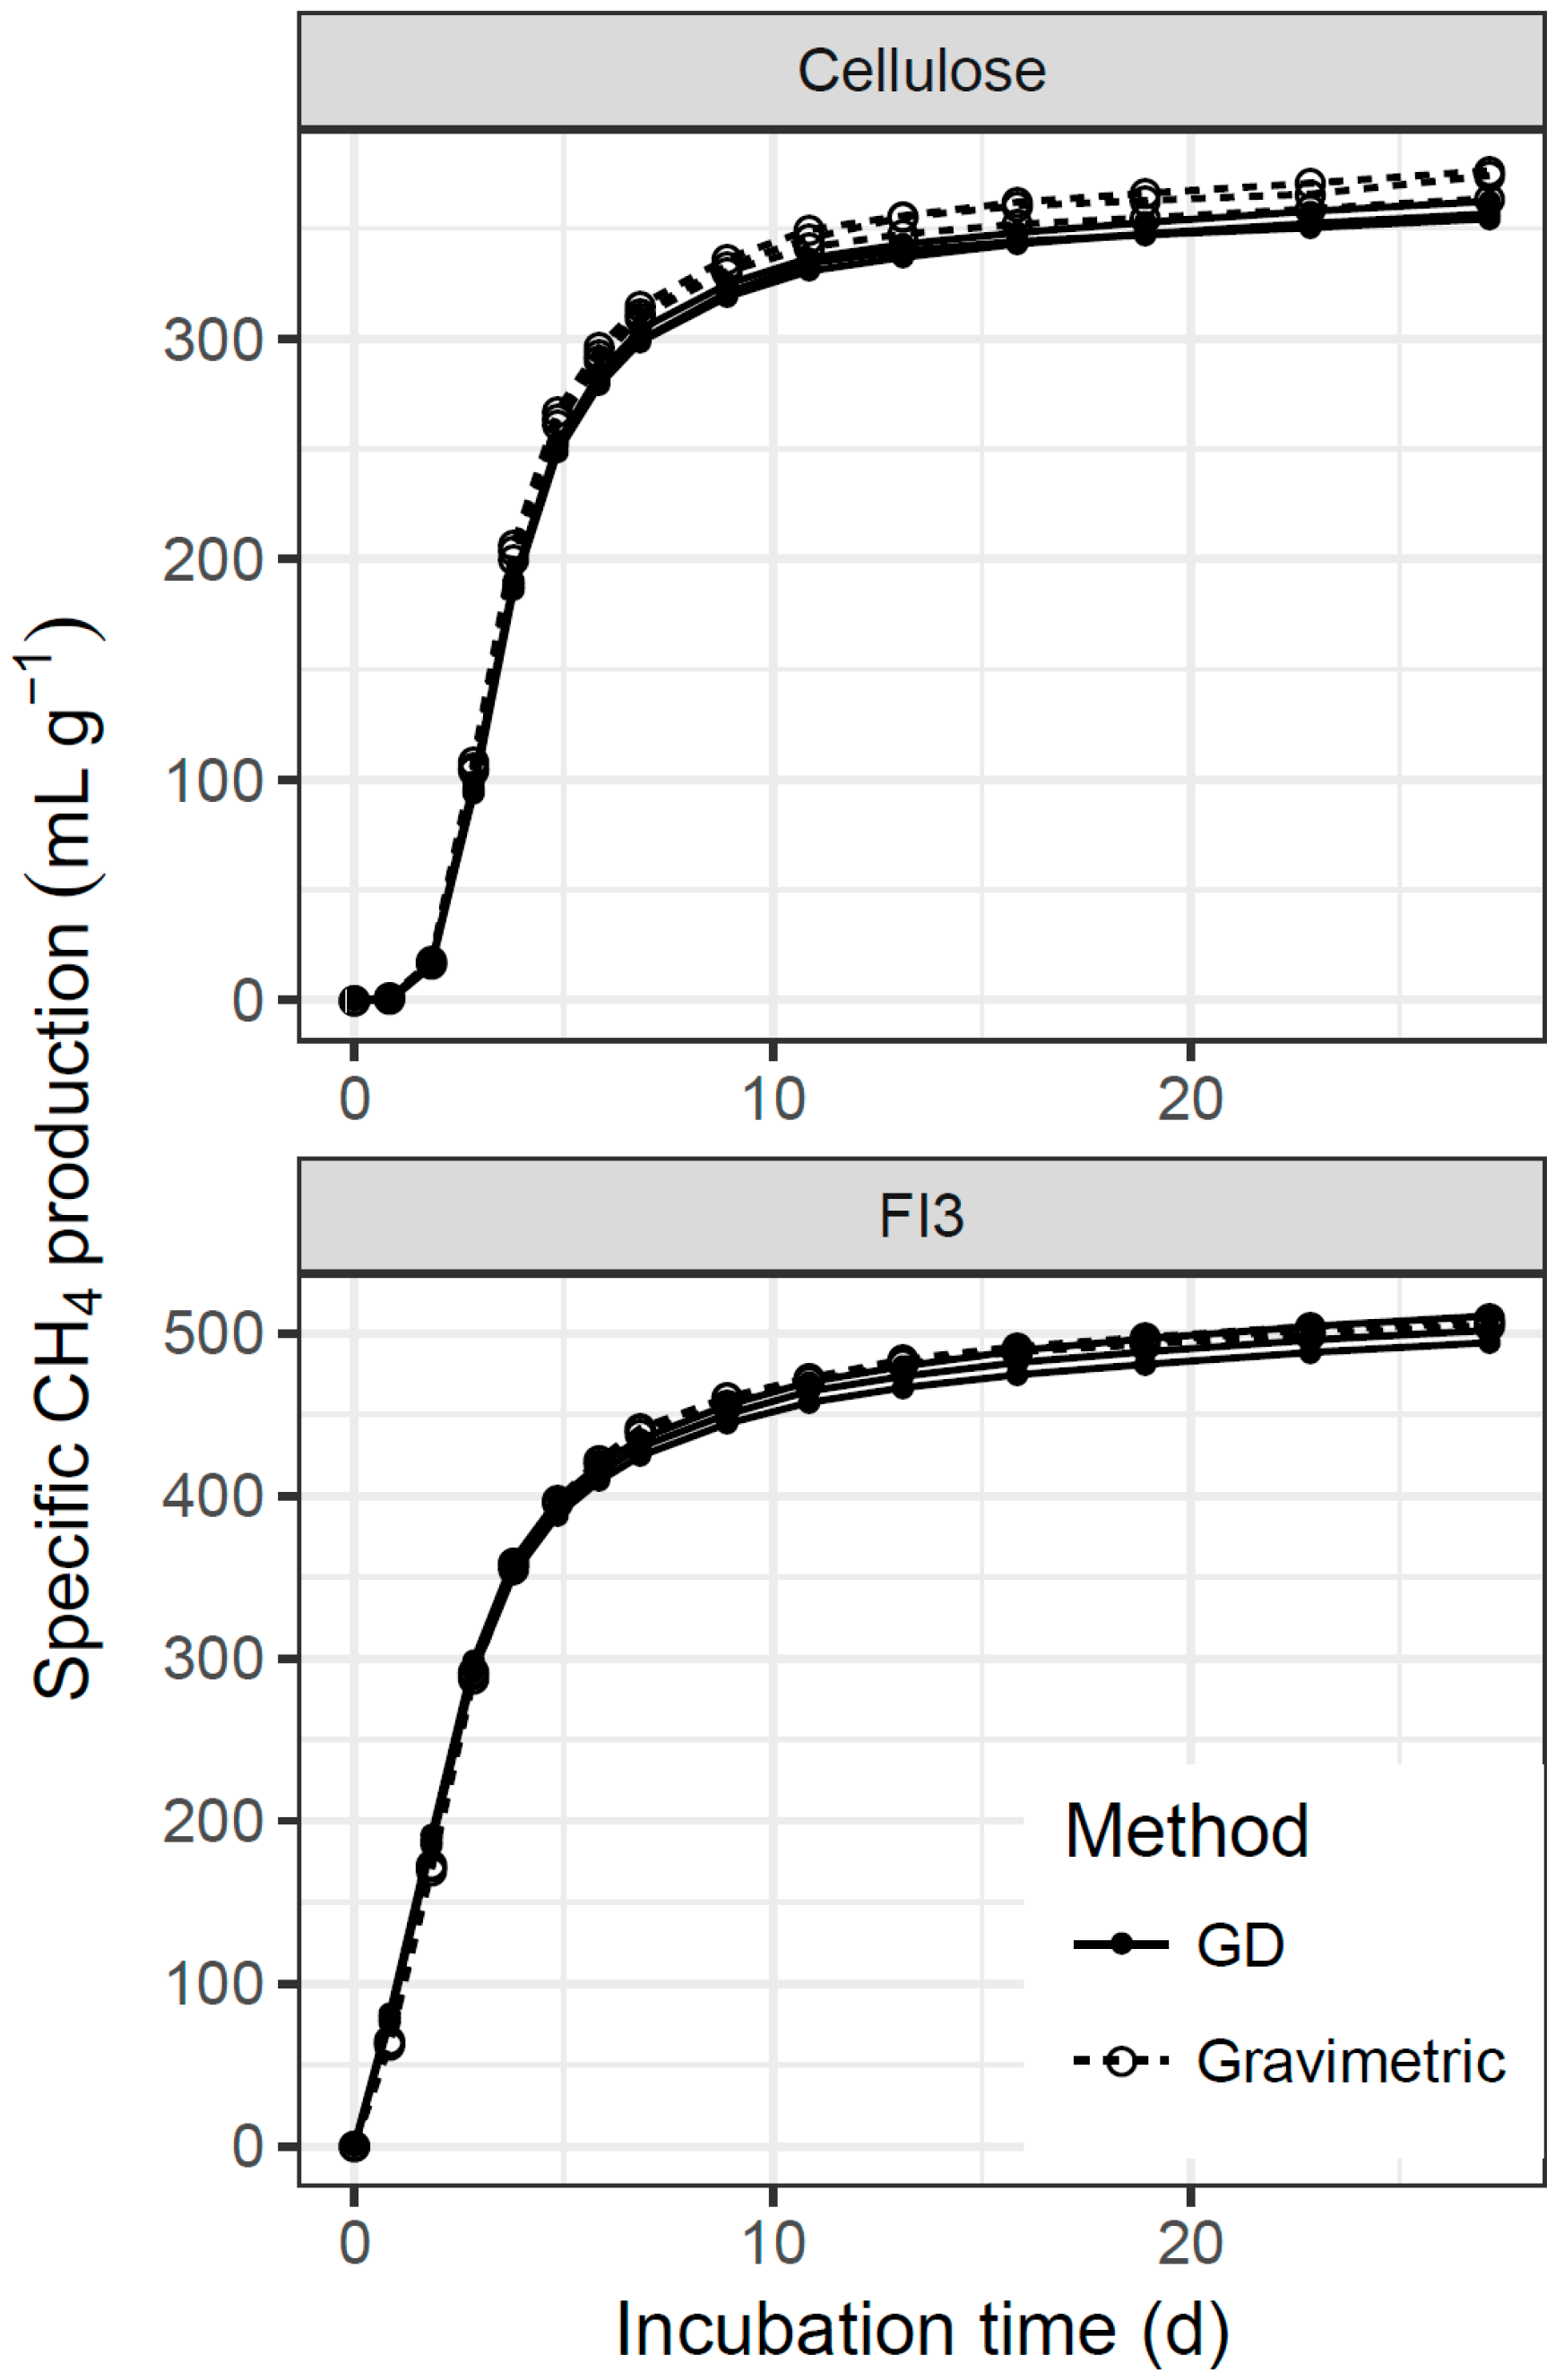
3.2. Experiment 2: GD-BMP Method Transfer

Results from Experiment 2 showed that transfer of the GD-BMP method to a new lab was feasible. The use of an analytical balance resulted in a high degree of accuracy in the GDt method when compared to Experiments 1A and 1B and the gravimetric method. As expected, variability in measurement of water control bottle mass was lower in this experiment than in the others: standard deviation was only 2 mg. GDt estimates differed from gravimetric results by less than 3% (Table 4). In Experiment 2, gravimetric and GD results were obtained from two different sets of bottles, therefore these small observed differences in BMP include additional random error unrelated to measurement method. There was no evidence of a systematic difference between GD and gravimetric results (overall mean difference −9.1 mL g−1, p = 0.35 from Dunnett’s test). Overall, GD-BMP estimates were nearly identical for the three algorithms (GDt, GDv and GDi, differences < 1%), confirming their effective equivalence in the absence of error. Very low random error (RSD < 2.5%) was observed for both GD and gravimetric estimates, with no clear difference between methods. Manometric estimates of BMP were lower than both gravimetric and GD estimates. This difference was almost certainly related to error in manometric measurements, as recently described [6].
Bottles showed expected patterns in SMP curves [22], and all methods resulted in similar curves (GDt and gravimetric results are shown for two substrates in Figure 5). Both the GDt and gravimetric results clearly show a lag phase in the cellulose curve, but none for FI3.
Because GD and GC measurements of x CH 4 were not made for the same bottles in Experiment 2, values were not compared. Instead, CH4 production (normalized by inoculum mass) was compared among inoculum-only bottles in order to clarify the limits of the GD method. On average, GDt CH4 production in inoculum-only bottles was 13% lower than gravimetric results (p = 0.02 from two-sample t-test). This result provides some evidence of a bias in the GD method for low gas volumes. In this experiment, inoculum-only bottles produced < 200 mL of biogas in total, while other bottles produced ca. 800 mL. Whether this bias was specific to this laboratory or experiment will require additional work. Results show that the GD method can be accurate for measuring < 1 L of biogas production using an analytical balance, but error may be unacceptably high for volumes ca. 200 mL. As in the other experiments, the contribution of this error in inoculum-only bottles to BMP was small.

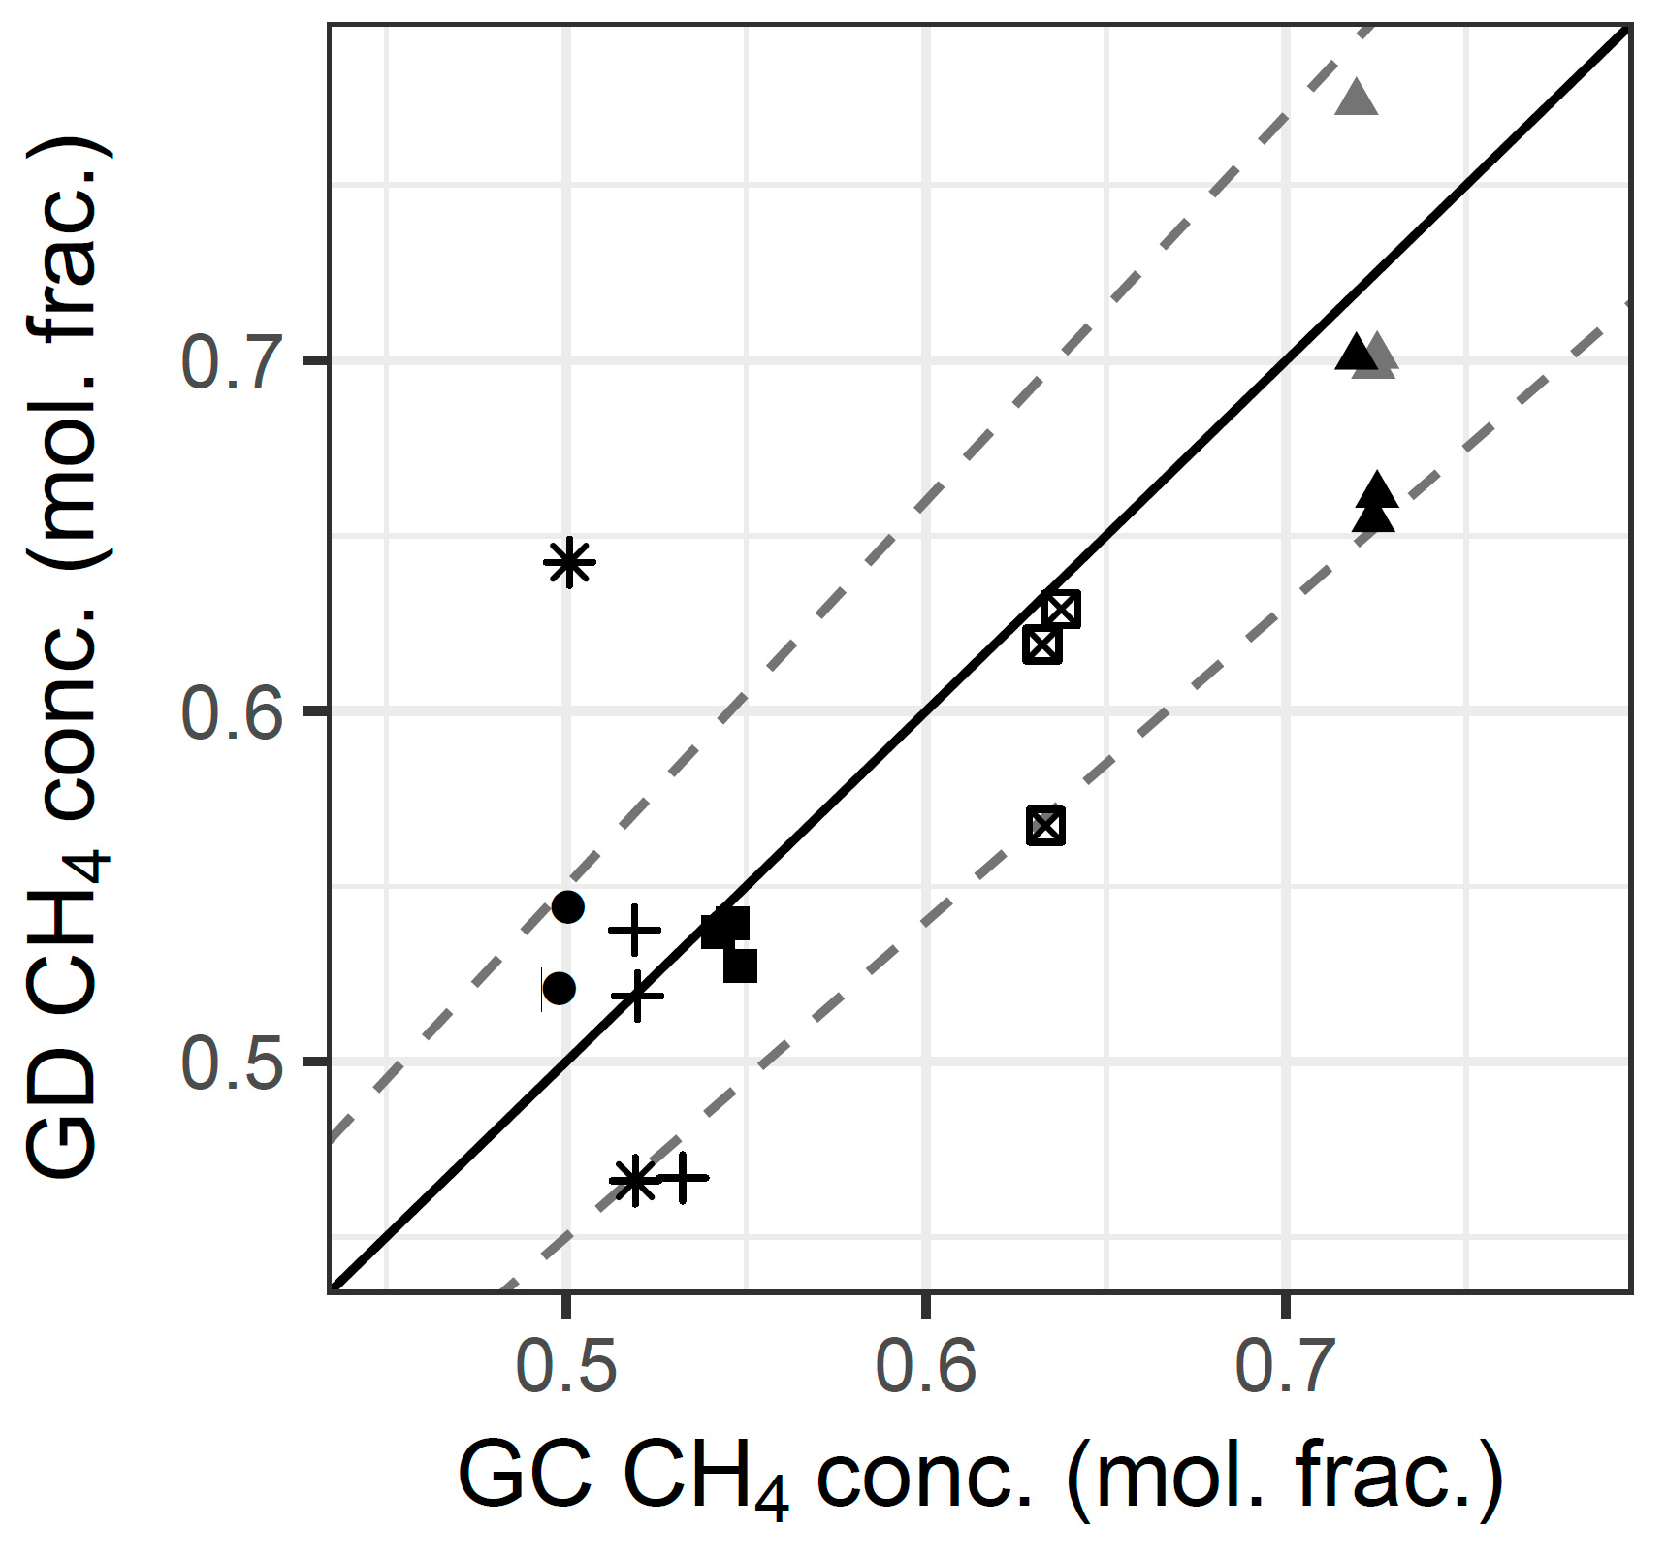
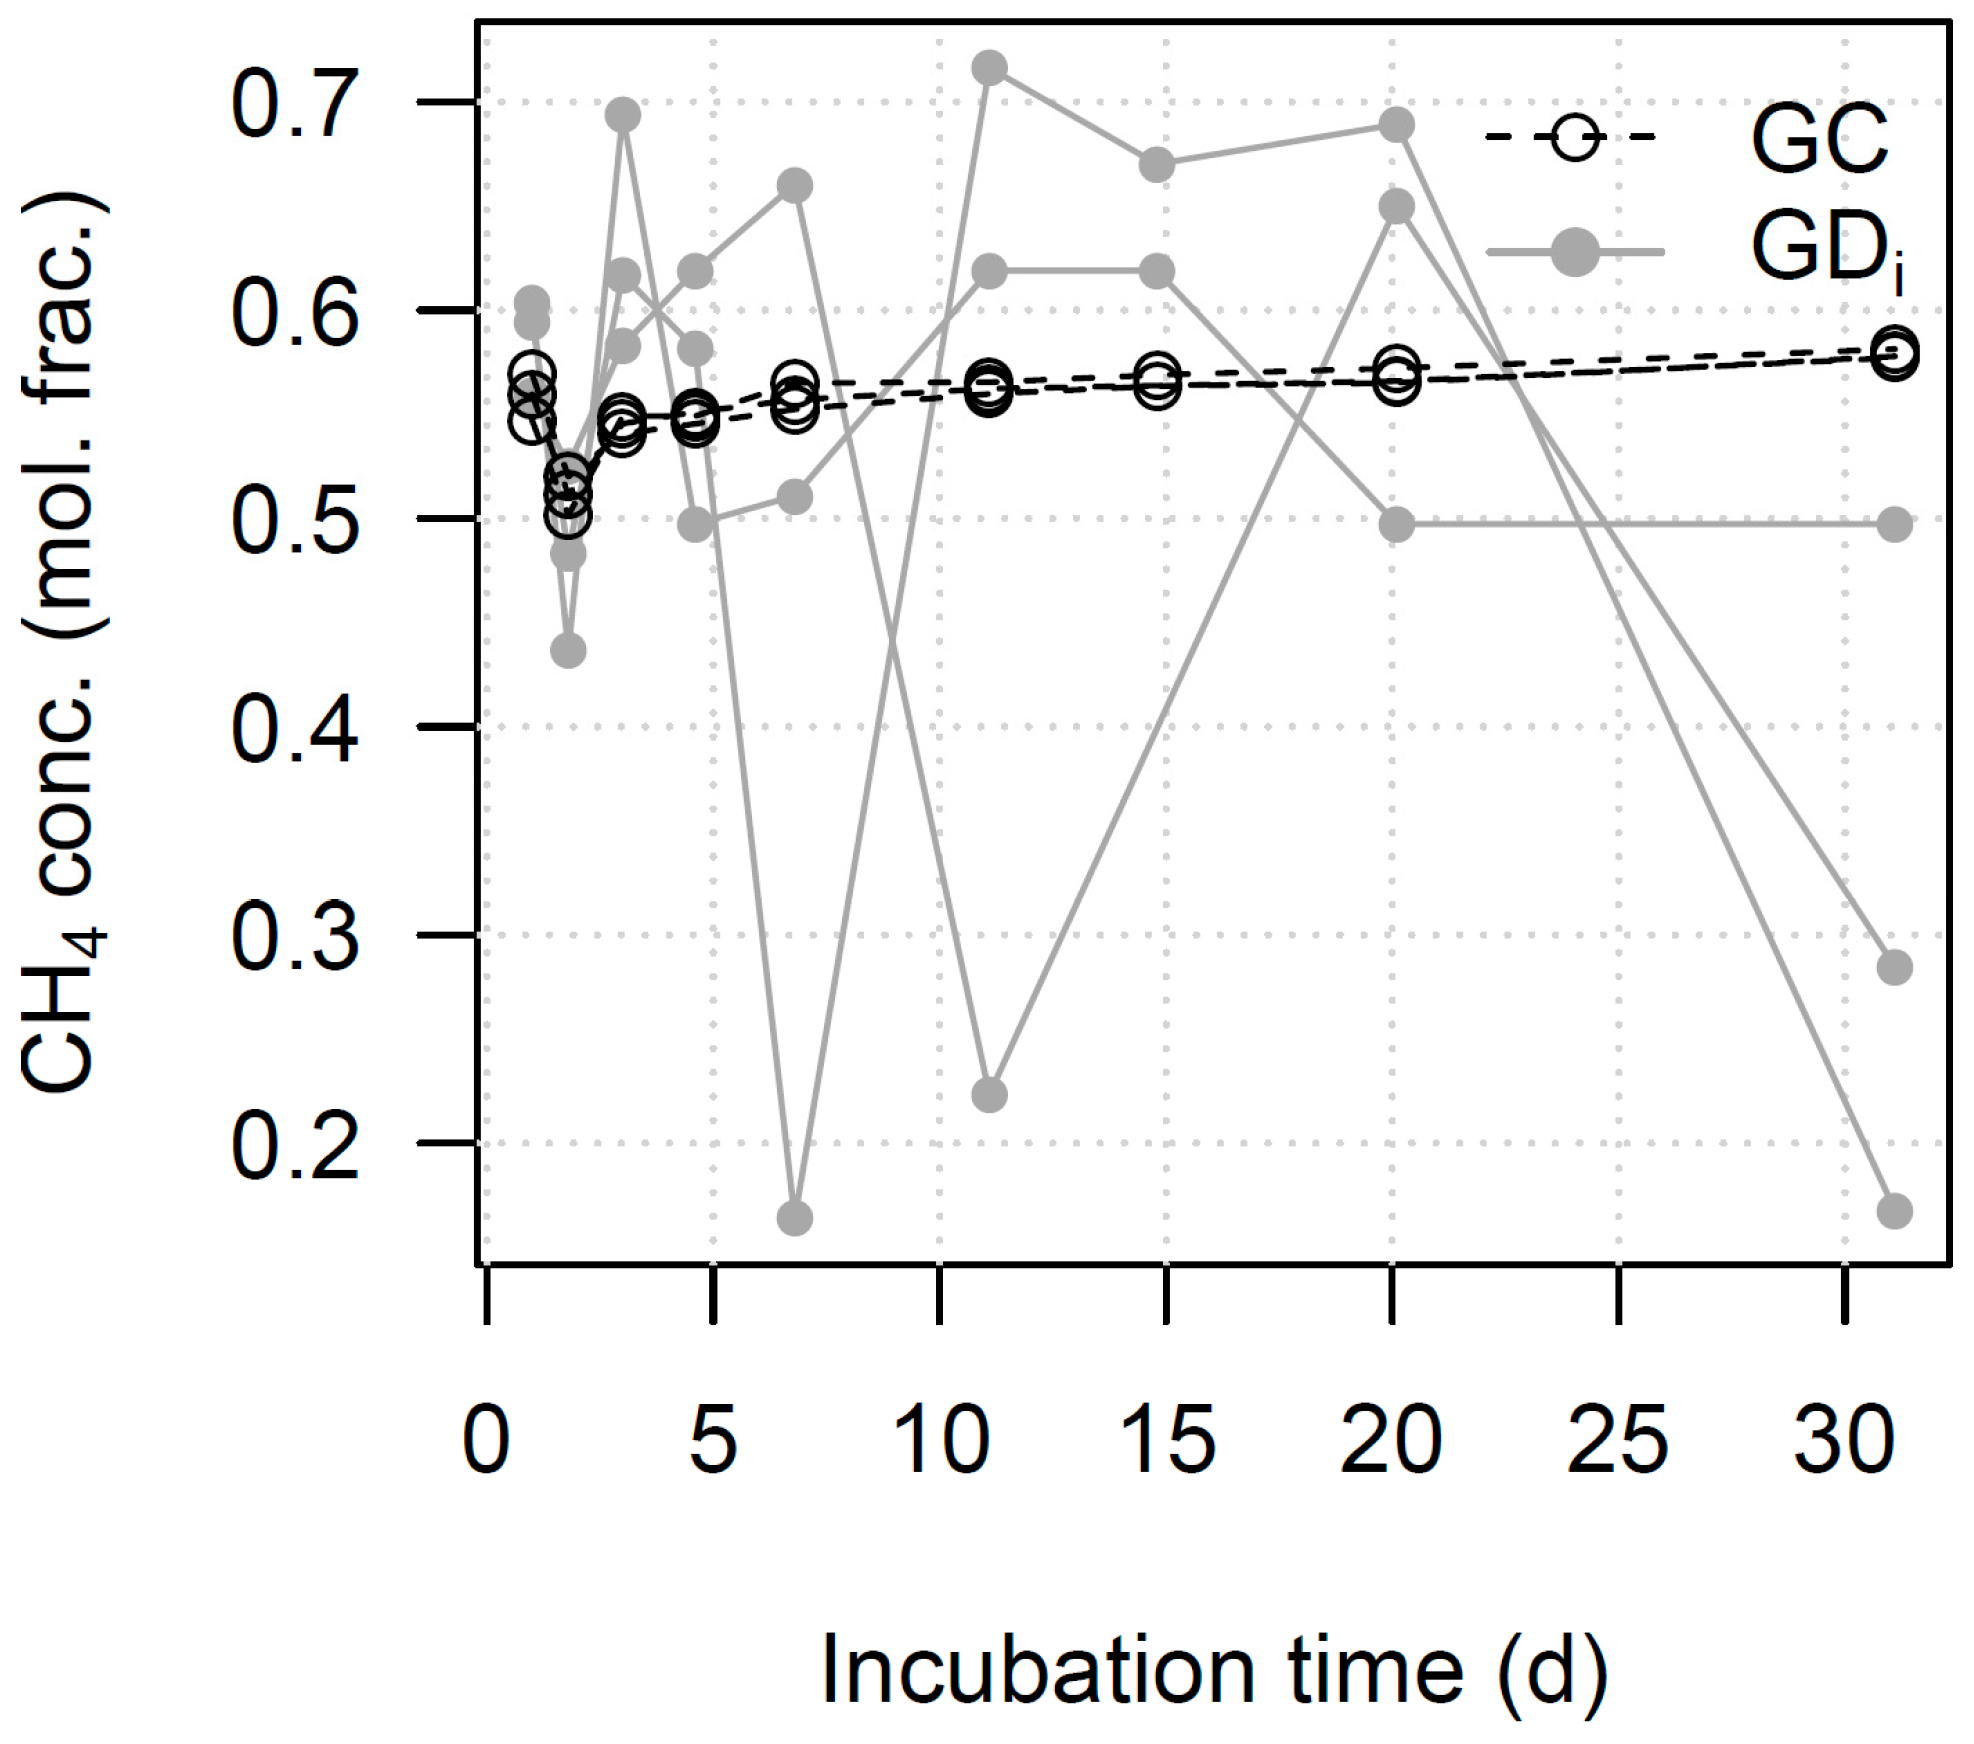
3.3. Experiment 3: Inter-Laboratory Evaluation of GD-BMP

The comparison of GD-BMP results to AMPTS II measurements made in two independent labs in Experiment 3 showed only relatively small differences among labs (Table 5). GDt BMP values differed from AMPTS II results by 1%–10% (maximum difference for cellulose, AU vs. TUM). These differences are small compared to those observed in inter-laboratory comparisons of BMP, which may be a factor of 2 or more [8,23]. AMPTS II is a common system for BMP measurement and has been shown to provide more consistent results than other methods [7,8]. Random error was low for all three labs (RSD < 3%), although generally slightly lower for the AMTPS II results (overall average of 1.4% VS. 2% for GDt). While an inter-laboratory comparison could not confirm high accuracy of the GD-BMP method, because multiple sources of error were present in such a comparison (e.g., differences among inocula), these results did not suggest that there was any systematic problem with GD-BMP measurements, and instead provided additional evidence that the GD-BMP method was a valid method to measure the BMP of organic materials.

3.4. Recommendations

Although all measurement methods should be expected to have some systematic error, the source of the observed differences between GD and both gravimetric and volumetric BMP measurements was primarily random error, not bias. Error in the GD-BMP method is mainly related to weighing accuracy, and therefore selection of an appropriate scale is important. Scale accuracy should always be reported with GD-BMP results. For high accuracy and low random error (RSD < 5%) in BMP, a reported scale accuracy of 30 mg or better (as in Experiment 3) appears to be sufficient when using as little as 1 g of substrate VS. Focusing instead on observed measurement variability, a limit of 5 mg for standard deviation in mass of water control bottles appears to be sufficient for 1 g of substrate VS. Better weighing accuracy may provide results that rival the best existing BMP measurements. Where substrate VS mass is larger, less weighing accuracy is needed (assuming degradability and biogas composition are not far from those reported here). The ratio of 30 mg g−1 (reported accuracy-to-substrate VS) or 5 mg g−1 (measured water control standard deviation-to-substrate VS) may be a useful starting point for selection of equipment. In comparison, the second (measured) ratio in Experiment 1A ranged from 7.5 to 16 mg g−1. In Experiment 2, where an analytical balance was used, the ratio was 2.6 mg g−1. It is important to remember that it is not necessary to measure mass loss over individual intervals with a high degree of precision in order to obtain accurate BMP measurements.
Scale drift is a potential issue that can be identified by including water control bottles. In general, if significant drift is detected (larger than the expected accuracy) it should be immediately corrected (by e.g., leveling, eliminating air currents, or calibration). When this is not possible, correction of measured masses for drift is probably a reasonable alternative. In our experience, this problem is not common (it was only encountered in Experiment 3). However, to ensure that drift can be detected and, if necessary, removed through calculation, the use of at least three water control bottles is recommended.
The best general GD algorithm is GDt, which is based on complete mass loss (Section 2). Although interval-based calculations may provide similar BMP estimates, interval estimates of CH4 production will have high uncertainty, probably resulting in inaccurate SMP curves. Where biogas composition changes substantially during a BMP trial, the GDt approach may not accurately capture the shape of the SMP curve, and result in biased kinetic parameter estimates. However, for the composition changes observed in these experiments, effects appear to be small. SMP curves were similar (Figure 5), and estimates of a first-order rate constant k showed some differences but no consistent bias (Table S3).
The GDv algorithm, based on venting mass loss, can be used to work around leakage and provide accurate BMP estimates. Even if the leakage is only suspected but not above detection limits, GDv may be the better choice, as long as weighing precision is high. In the absence of leakage, GDv should be unbiased relative to GDt but with higher random error, because the important advantage of weighing error compensation is lost.
Where biogas composition leads to a density far from the density of the flushing gas (e.g., ethanol) the density correction (Equations (6) and (7)) should be applied. However, the correction should not be applied when significant leakage is present or for bottles where biogas production is not much greater than headspace volume, such as for inoculum-only bottles. In both cases the assumption that all flushing gas is removed and measured in the volume and mass measurements is not valid.
Calculations for the GD-BMP method (including the variations described in this work) can be carried out using the biogas package in R or the web application OBA in an Internet browser. For details, refer to [16] or the current version of the R package (https://github.com/sashahafner/biogas) or web application (https://biotransformers.shinyapps.io/oba1/).

4. Conclusions

Evaluation of the new GD-BMP method clearly shows that it was a valid method for BMP measurement. The GD method could provide BMP results with accuracy and precision comparable to conventional methods, but without gas analysis or CO2 removal and with relatively low labor requirements. This new method improved accessibility of accurate BMP measurement and might make BMP analysis more widely available for both research and practice in the biogas field.

Supplementary Materials

The following are available online at https://www.mdpi.com/2073-4441/11/12/2431/s1, Table S1: Summary of the 8 GD-BMP algorithms. Table S2: Summary of substrates used for evaluation of the GD-BMP method. Table S3: First-order degradation rate constants for all SMP curves.

Author Contributions

Conceptualization, S.D.H.; Methodology, S.D.H., S.A.; Software, S.D.H., C.G.J., J.R.M.; Validation, C.G.J., K.K., J.M.T., J.R.M., R.T., S.A., S.D.H., and S.W.; Formal Analysis, S.D.H., C.G.J., J.R.M., R.T.; Investigation, C.G.J., K.K., J.M.T., J.R.M., R.T., S.A., S.D.H., and S.W.; Resources, C.G.J., K.K., J.M.T., J.R.M., R.T., S.A., S.D.H., and S.W.; Data Curation, C.G.J., J.R.M., R.T., and S.D.H.; Writing—Original Draft Preparation, C.G.J. and S.D.H.; Writing—Review and Editing, S.D.H., C.G.J., K.K., J.M.T., J.R.M., R.T., S.A., and S.W.; Visualization, C.G.J. and S.D.H.; Supervision, S.D.H.; Project Administration, S.D.H., S.A.

Funding

This research was funded by Australian Research Council, grant number DE170100497 and the Spanish Ministry of Science, Innovation and Universities, grant number RYC-2017-22372.

Acknowledgments

Palle Olsen (Miljøstyrelsen Virksomheder) carried out measurements for Experiment 1B. Peter Fischer (Deutsches Biomasseforschungszentrum gemeinnützige GmbH) performed BMP measurements in Experiment 3 for DBFZ in Leipzig, DE. Marylight J. Garnica (Industrial University of Santander, Colombia) produced a video demonstration of the GD method in Spanish. Christof Holliger (École Polytechnique Fédérale de Lausanne) provided substrates FI1, FI2, FI3, and WS, as well as trace element and vitamin solutions.

Conflicts of Interest

The authors declare no conflict of interest. The funders had no role in the design of the study; in the collection, analyses, or interpretation of data; in the writing of the manuscript, or in the decision to publish the results.

References

  1. Raposo, F.; De la Rubia, M.A.; Fernandez-Cegri, V.; Borja, R. Anaerobic digestion of solid organic substrates in batch mode: An overview relating to methane yields and experimental procedures. Renew. Sustain. Energy Rev. 2012, 16, 861–877. [Google Scholar] [CrossRef]
  2. Pham, C.H.; Triolo, J.M.; Cu, T.T.T.; Pedersen, L.; Sommer, S.G. Validation and Recommendation of Methods to Measure Biogas Production Potential of Animal Manure. Asian-Australas. J. Anim. Sci. 2013, 26, 864–873. [Google Scholar] [CrossRef] [PubMed]
  3. Filer, J.; Ding, H.H.; Chang, S. Biochemical Methane Potential (BMP) Assay Method for Anaerobic Digestion Research. Water 2019, 11, 921. [Google Scholar] [CrossRef]
  4. Rozzi, A.; Remigi, E. Methods of assessing microbial activity and inhibition under anaerobic conditions: A literature review. Rev. Environ. Sci. Biotechnol. 2004, 3, 93–115. [Google Scholar] [CrossRef]
  5. Hafner, S.D.; Rennuit, C.; Triolo, J.M.; Richards, B.K. Validation of a simple gravimetric method for measuring biogas production in laboratory experiments. Biomass Bioenergy 2015, 83, 297–301. [Google Scholar] [CrossRef]
  6. Hafner, S.D.; Astals, S. Systematic error in manometric measurement of biochemical methane potential: Sources and solutions. Waste Manag. 2019, 91, 147–155. [Google Scholar] [CrossRef] [PubMed]
  7. Wang, B.; Nges, I.A.; Nistor, M.; Liu, J. Determination of methane yield of cellulose using different experimental setups. Water Sci. Technol. 2014, 70, 599–604. [Google Scholar] [CrossRef] [PubMed]
  8. Holliger, C.; Fruteau de Laclos, H.; Hafner, S. A new protocol and software tool for standardizing biomethane potential tests: Results of an inter-laboratory study. In Proceedings of the 15th IWA World Conference on Anaerobic Digestion, Beijing, China, 17–20 October 2017. [Google Scholar]
  9. Angelidaki, I.; Alves, M.; Bolzonella, D.; Borzacconi, L.; Campos, J.L.; Guwy, A.J.; Kalyuzhnyi, S.; Jenicek, P.; van Lier, J.B. Defining the biomethane potential (BMP) of solid organic wastes and energy crops: A proposed protocol for batch assays. Water Sci. Technol. 2009, 59, 927–934. [Google Scholar] [CrossRef] [PubMed]
  10. Holliger, C.; Alves, M.; Andrade, D.; Angelidaki, I.; Astals, S.; Baier, U.; Bougrier, C.; Buffière, P.; Carballa, M.; de Wilde, V.; et al. Towards a standardization of biomethane potential tests. Water Sci. Technol. 2016, 74, 2515–2522. [Google Scholar] [CrossRef] [PubMed]
  11. VDI. Fermentation of Organic Materials: Characterisation of the Substrate, Sampling, Collection of Material Data, Fermentation Tests; Verein Deutscher Ingenieure e.V.: Düsseldorf, Germany, 2016. [Google Scholar]
  12. Hafner, S.D. Calculation of Biochemical Methane Potential (BMP). Available online: https://github.com/sashahafner/BMP-methods/blob/master/BMP_calculations.pdf (accessed on 19 October 2019).
  13. Alduchov, O.A.; Eskridge, R.E. Improved Magnus form approximation of saturation vapor pressure. J. Appl. Meteorol. 1996, 35, 601–609. [Google Scholar] [CrossRef]
  14. Baird, R.B.; Eaton, A.D.; Rice, E.W. Standard Methods for the Examination of Water and Wastewater; American Water Works Association: Denver, CO, USA, 2017; ISBN 978-1-62576-240-5. [Google Scholar]
  15. R Core Team. R: A Language and Environment for Statistical Computing; R Foundation for Statistical Computing: Vienna, Austria, 2017. [Google Scholar]
  16. Hafner, S.D.; Koch, K.; Carrere, H.; Astals, S.; Weinrich, S.; Rennuit, C. Software for biogas research: Tools for measurement and prediction of methane production. SoftwareX 2018, 7, 205–210. [Google Scholar] [CrossRef]
  17. Hafner, S.D.; Rennuit, C.; Olsen, P.J.; Pedersen, J.M. Quantification of leakage in batch biogas assays. Water Pract. Technol. 2018, 13, 52–61. [Google Scholar] [CrossRef]
  18. Brown, L.C.; Berthouex, P.M. Statistics for Environmental Engineers, 2 Edition; CRC Press: Boca Raton, FL, USA, 2002; ISBN 978-1-4200-5663-1. [Google Scholar]
  19. Hothorn, T.; Bretz, F.; Westfall, P. Simultaneous Inference in General Parametric Models. Biom. J. 2008, 50, 346–363. [Google Scholar] [CrossRef] [PubMed]
  20. Brulé, M.; Oechsner, H.; Jungbluth, T. Exponential model describing methane production kinetics in batch anaerobic digestion: A tool for evaluation of biochemical methane potential assays. Bioprocess Biosyst. Eng. 2014, 37, 1759–1770. [Google Scholar] [CrossRef] [PubMed]
  21. minpack.lm: R Interface to the Levenberg-Marquardt Nonlinear Least-Squares Algorithm Found in MINPACK, Plus Support for Bounds. R package version 1.2-1. Available online: https://cran.r-project.org/web/packages/minpack.lm/index.html (accessed on 19 November 2019).
  22. Koch, K.; Hafner, S.D.; Weinrich, S.; Astals, S. Identification of critical problems in biochemical methane potential (BMP) tests from methane production curves. Front. Environ. Sci. 2019, 7, 178. [Google Scholar] [CrossRef]
  23. Raposo, F.; Fernandez-Cegri, V.; De la Rubia, M.A.; Borja, R.; Beline, F.; Cavinato, C.; Demirer, G.; Fernandez, B.; Fernandez-Polanco, M.; Frigon, J.C.; et al. Biochemical methane potential (BMP) of solid organic substrates: Evaluation of anaerobic biodegradability using data from an international interlaboratory study. J. Chem. Technol. Biotechnol. 2011, 86, 1088–1098. [Google Scholar] [CrossRef]
Figure 1. The data collection steps required for gas density-based BMP (GD-BMP) measurements. Step numbers match those listed in the text, and are repeated for each sampling event.
Water 11 02431 g001
Figure 2. A graphical representation of GD-BMP measurements showing measurements for only three measurement intervals (a typical BMP experiment will have more). The top panel shows mass measurements, and the bottom shows biogas volume measurements made from the same hypothetical bottle over the same intervals. Note that total mass loss and venting mass loss differ only if leakage occurs (in addition to differences due to measurement errors). In this example, leakage occurred during the second interval. Complete total mass loss does not contain all measurement errors that are present in interval total mass loss. Excluding error in initial and final mass measurements, measurement errors exactly cancel or compensate (i.e., the sum of all interval total mass loss measurements is exactly equal to the difference between initial and final mass).
Water 11 02431 g002
Figure 3. Comparison of complete total gas density (GDt) and gas chromatography (GC) estimates of biogas CH4 content for Experiment 1A. Values are volume-weighted average values for the entire incubation. Each substrate is shown with a unique plotting symbol (triangles for ethanol, asterisks for inoculum-only, filled squares for FI1). For ethanol, gray symbols show results including initial headspace correction. Dashed lines show ±10%.
Water 11 02431 g003
Figure 4. Comparison of interval total gas density (GDi) and gas chromatography (GC) estimates of biogas CH4 content for a single substrate (FI1) from Experiment 1A. Unlike the complete total gas density method (GDt), the GDi method is not recommended for general use.
Water 11 02431 g004
Figure 5. Specific methane production (SMP) curves from Experiment 2 for microcrystalline cellulose and FI3 from the gravimetric (dashed lines) and gas density (GDt, solid lines) methods.
Water 11 02431 g005
Table 1. Summary of the four experiments used for evaluation of the gas density BMP method (GD-BMP).
Experiment
1A1B 23
Institution abbreviationSDUSDUUQAU, TUM, DBFZ
Substrates*FI1, FI2, FI3, ethanol, celluloseRS, HS1, HS2, ethanol, celluloseFI3, celluloseFI3, WS, cellulose
Measuring methodsVolumetric, manometric, gravimetric, GDVolumetric, manometric, gravimetric, GDManometric, gravimetric, GDGD (AU), AMPTS II (TUM and DBFZ)
Biogas composition by GCMeasuredMeasuredMeasured Not measured
Biogas leakageYes Yes § NoNo
* FI1–FI3 were animal feed ingredients, RS was raw wastewater sludge, HS1 and HS2 were sludge samples treated by thermal hydrolysis under two different configurations, and WS was wheat straw. Two separate sets of bottles were used for GD and the other methods. Biogas composition was measured by gas chromatography (GC) only for the manometric and gravimetric bottles, not for the bottles used with the GD method. At AU, biogas composition was determined only by the GD method. At TUM and DBFZ, CO2 was removed with an alkaline trap using the AMPTS II system. Leakage was detected for two bottles, which were eliminated from data analysis for simplicity. § Leakage was detected for at least one bottle for each substrate, and none were eliminated from data analysis.
Table 2. Gas density, gravimetric, manometric, and volumetric estimates of BMP (all in mL g−1) for five substrates from Experiment 1A. The duration was 31 days for all bottles, and n = 3 bottles except for cellulose and inoculum-only (n = 2) where one bottle from each was excluded because of leakage.
SubstrateGravimetricManometricVolumetricGas density (GDt)
Mean *SD MeanSDMeanSDMeanSD
Cellulose36213.336812.636715.538656.2
Ethanol73430.973620.773428.566481.5
FI13798.638110.73899.737533.1
FI23819.83787.638212.736457.1
FI352215.349835.253726.249680.4
* Mean BMP estimate (mL g−1). Standard deviation (mL g−1).
Table 3. Gas density and gravimetric estimates of BMP (all in mL g−1) for four substrates from Experiment 1B, based on measurements made on the same set of bottles. Leakage was observed for all substrates, resulting in biased and variable GDt results. The duration was 21 days for all bottles, and n = 3 bottles for each substrate.
SubstrateGravimetricGas Density (GDt)Gas Density (GDv)
Mean *SD MeanSDMeanSD
Cellulose37213.632515839938.9
Ethanol74021.562053.264549.8
HS13477.028061.134910.7
HS23274.821966.431529.8
RS2665.025128.12758.8
* Mean BMP estimate (mL g−1). Standard deviation (mL g−1).
Table 4. Gas density, gravimetric, and manometric estimates of BMP (mL g−1) for two substrates from Experiment 2. The duration was 27 days for all bottles, and n = 3 bottles per substrate.
SubstrateGravimetricManometricGas Density (GDt)
Mean *SD MeanSDMeanSD
FI35066.248523.85029.4
Cellulose3718.632311.33585.9
* Mean BMP estimate (mL g−1). Standard deviation (mL g−1).
Table 5. Comparison of gas density (GDt) and volumetric (AMPTS II) estimates of BMP (mL g−1) for three substrates from Experiment 3, based on measurements made in three different laboratories (AU, TUM, and DBFZ). For all results n = 3 bottles per substrate.
SubstrateAU (GDt)TUM (AMPTS II)DBFZ (AMPTS II)
t *Mean SD tMeanSDtMeanSD
Cellulose27.93868.525.03507.725.03713.2
FI127.94808.025.05203.325.04856.6
Wheat straw27.93036.225.02877.225.02802.0
* Incubation duration at which BMP was evaluated (days). Determined separately for each laboratory and substrate based on the net 1% d−1 termination criterion [10] or a minimum of 25 days. Mean BMP estimate (mL g−1). Standard deviation (mL g−1).

