Precipitation Isotopes Associated with the Duration and Distance of Moisture Trajectory in a Westerly-Dominant Setting


1
College of Geography and Environmental Science, Northwest Normal University, Lanzhou 730070, China
2
Institute of Desert Meteorology, China Meteorological Administration, Urumqi 830002, China
3
Lanzhou Literature and Information Center, Chinese Academy of Sciences, Lanzhou 730000, China
*
Author to whom correspondence should be addressed.
Water 2019, 11(12), 2434; https://doi.org/10.3390/w11122434
Submission received: 23 September 2019
/
Revised: 15 November 2019
/
Accepted: 18 November 2019
/
Published: 20 November 2019
(This article belongs to the Section Hydrology)
Abstract
:A Lagrangian diagnostic adjusted using specific humidity, with 6 h intervals along the trajectory and with lifting condensation level as cloud base height, was employed to identify the moisture source regions around the Tianshan Mountains, northwest China. Then, the relationship between precipitation stable isotopes and diagnosed duration–distance of moisture trajectory was analyzed. In this region, the median value of transport duration from moisture source to precipitation sampling site is approximately 3 days, and most moisture sources are closer than 1000 km. According to the Lagrangian diagnosed moisture sources, the higher precipitation summer months usually have rapid air mass movement, and remotely sourced moisture can be delivered to arid central Asia; in the dryer winter months, the moisture loading is weak, and longer transport duration and shorter source distances are observed. As trajectory duration increases, δ18O in sampled precipitation shows a positive trend, especially on the northern slope, and the short-duration events are usually significantly impacted by local recycled moisture with depleted isotopic signatures. The northern slope usually shows relatively shorter duration and longer distance, and more distant sources have more enriched isotopic values.
1. Introduction
The Tianshan Mountains are the main mountain range in arid northwest China. The variability in precipitation and water vapor provenances is currently under debate [1,2,3]. In past decades, the stable isotope technique has been widely applied to modern precipitation to diagnose the moisture source in northwest China on a larger spatial scale [4,5,6]. As the westerly-dominant “wet island” in central Asia, the Tianshan Mountains have been the focus of many studies of precipitation isotopes [7,8,9,10,11,12]. As reviewed in Zhang and Wang [13], precipitation isotopes have been observed at about 40 sites with different natural zones across the Tianshan Mountains. Based on these in situ observations, the influencing regimes of below-cloud evaporation [8,14] and local moisture recycling [15,16] on stable hydrogen and oxygen isotopes in precipitation have been investigated in this arid setting. Regarding the moisture source effect of stable isotopes in precipitation, isotopic seasonality is considered a good indicator of westerly moisture [5,17]. Liu et al. [18] exhibited that the great inter-annual variation of moisture path should be highlighted, and that temperature effect is not always effective on an inter-annual basis. According to the event-based precipitation isotopes, Wang et al. [19] found that the northern and southern basins show different moisture regimes. Additionally, the influence of moisture paths on stable isotopes can also be evidenced in an ice core at the eastern portion of the mountains [20].
The specific humidity-adjusted Lagrangian diagnostic provides a tool to understand the trajectory effect on precipitation isotopes in many locations worldwide, such as Greenland [21,22], Australia [23] and Slovenia [24]. This method is derived from the traditional Lagrangian diagnostic, but with the addition that the meteorological parameters for each time interval along the calculated trajectories are checked. Specific humidity is used to identify a specific location where the local moisture greatly contributes, that is, the site where the specific humidity significantly increases along the backward trajectory is considered to be the most likely moisture source [21]. This method is helpful to determine a suitable backward path duration for a specific climate setting [21,22,23,24]. Although the adjusted diagnostic has been applied to aid central Asia before [19], quantitative analysis of westerly moisture transportation remains limited. In this study, a compiled database of the Tianshan Mountains [9] was revisited, as we focused on how moisture transports to the study region along the trajectory, and thus, the duration and distance of moisture trajectory in the westerly-dominant setting is discussed.
2. Data and Method
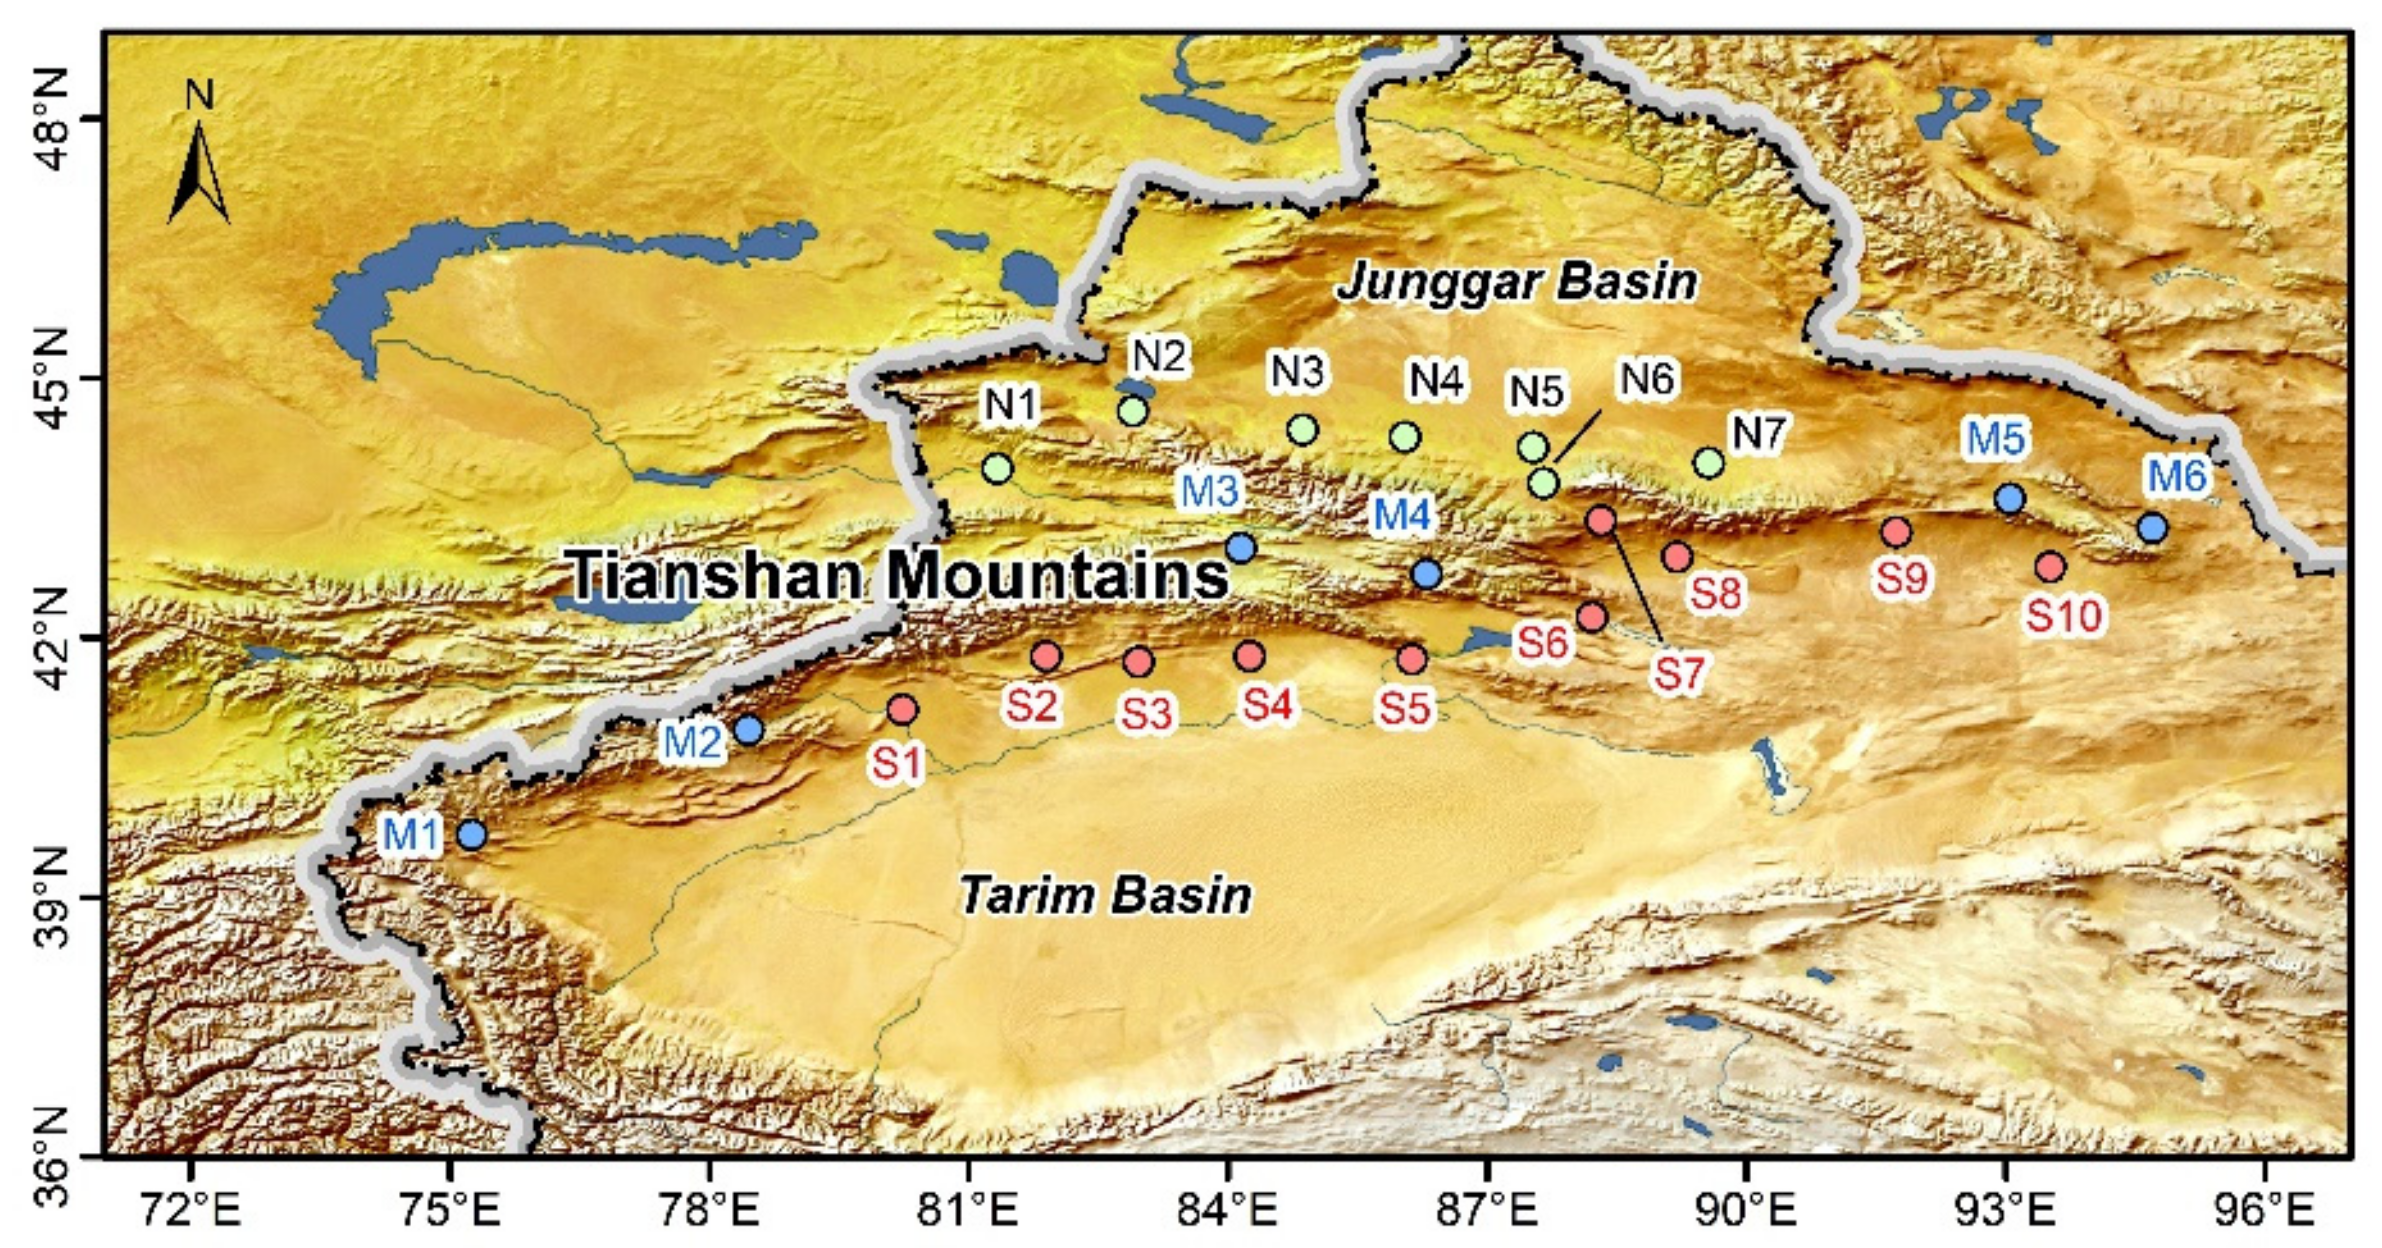
In this study, a compiled database of the stable isotopes in precipitation around the Tianshan Mountains [9] was applied, including 1052 event-based samples at 23 sites during the period 2012–2013 (Figure 1). Based on the elevation, these stations can be divided into three groups including the northern slope, the mountains and the southern slope. These samples were analyzed for stable hydrogen and oxygen isotope ratio using the liquid water isotope analyzer DLT-100 (Los Gatos Research, Inc., San Jose, CA, USA) at the Northwest Normal University, and the results are expressed as delta values relative to the Vienna Standard Mean Ocean Water (VSMOW).
We used a Hybrid Single-Particle Lagrangian Integrated Trajectory (HYSPLIT) version 4 [25] with the Global Data Assimilation System (GDAS) and with spatial resolution of 1° × 1° [26]. As suggested in previous studies [19,21,22,23,24], the 10 day back trajectories were calculated, respectively, for each record and the specific humidity along the trajectory was checked for each 6 h interval. Below the planternary boundary layer (PBL), when the specific humidity following the 6 h interval was 0.2 g/kg higher than the previous measurment, an evaporative source was identified; the backward procedure ended when specific humidity was no more than 0.05 g/kg.
For each event, the start conditions were needed as the input in this model. The start date and time was based on the in situ manual record of each event, as observed by the local weather observer. The start height for each event in the model was determined as the lifting condensation level (LCL), which is generally close to cloud base height [27,28]. Using a barometric formula [29,30], the height can be calculated using air temperature and pressure:
where tmean is the mean air temperature in °C between the lifting condensation level and surface, and P0 and PLCL are the air pressure in hPa at the surface and lifting condensation level.
The air temperature at lifting condensation level [31] is
where Td and T are, respectively, the dew point temperature and air temperature in °C, at the surface.
The air pressure at lifting condensation level [31] is
where P0 is the measured pressure at the observation site in hPa, and TLCL and T are the air temperature in K at lifting condensation level and the surface, respectively. The meteorological parameters at the surface level, for Equations (1)–(3), were measured by the automatic weather station at the sampling sites.
To test the difference between the various groups, one-way analysis of variance (ANOVA) and general linear model (GLM) were also performed, using software IBM SPSS Statistics 19.0 (IBM Corp., Armonk, NY, USA).
3. Results and Discussion
3.1. Lagrangian Diagnosed Moisture Sources
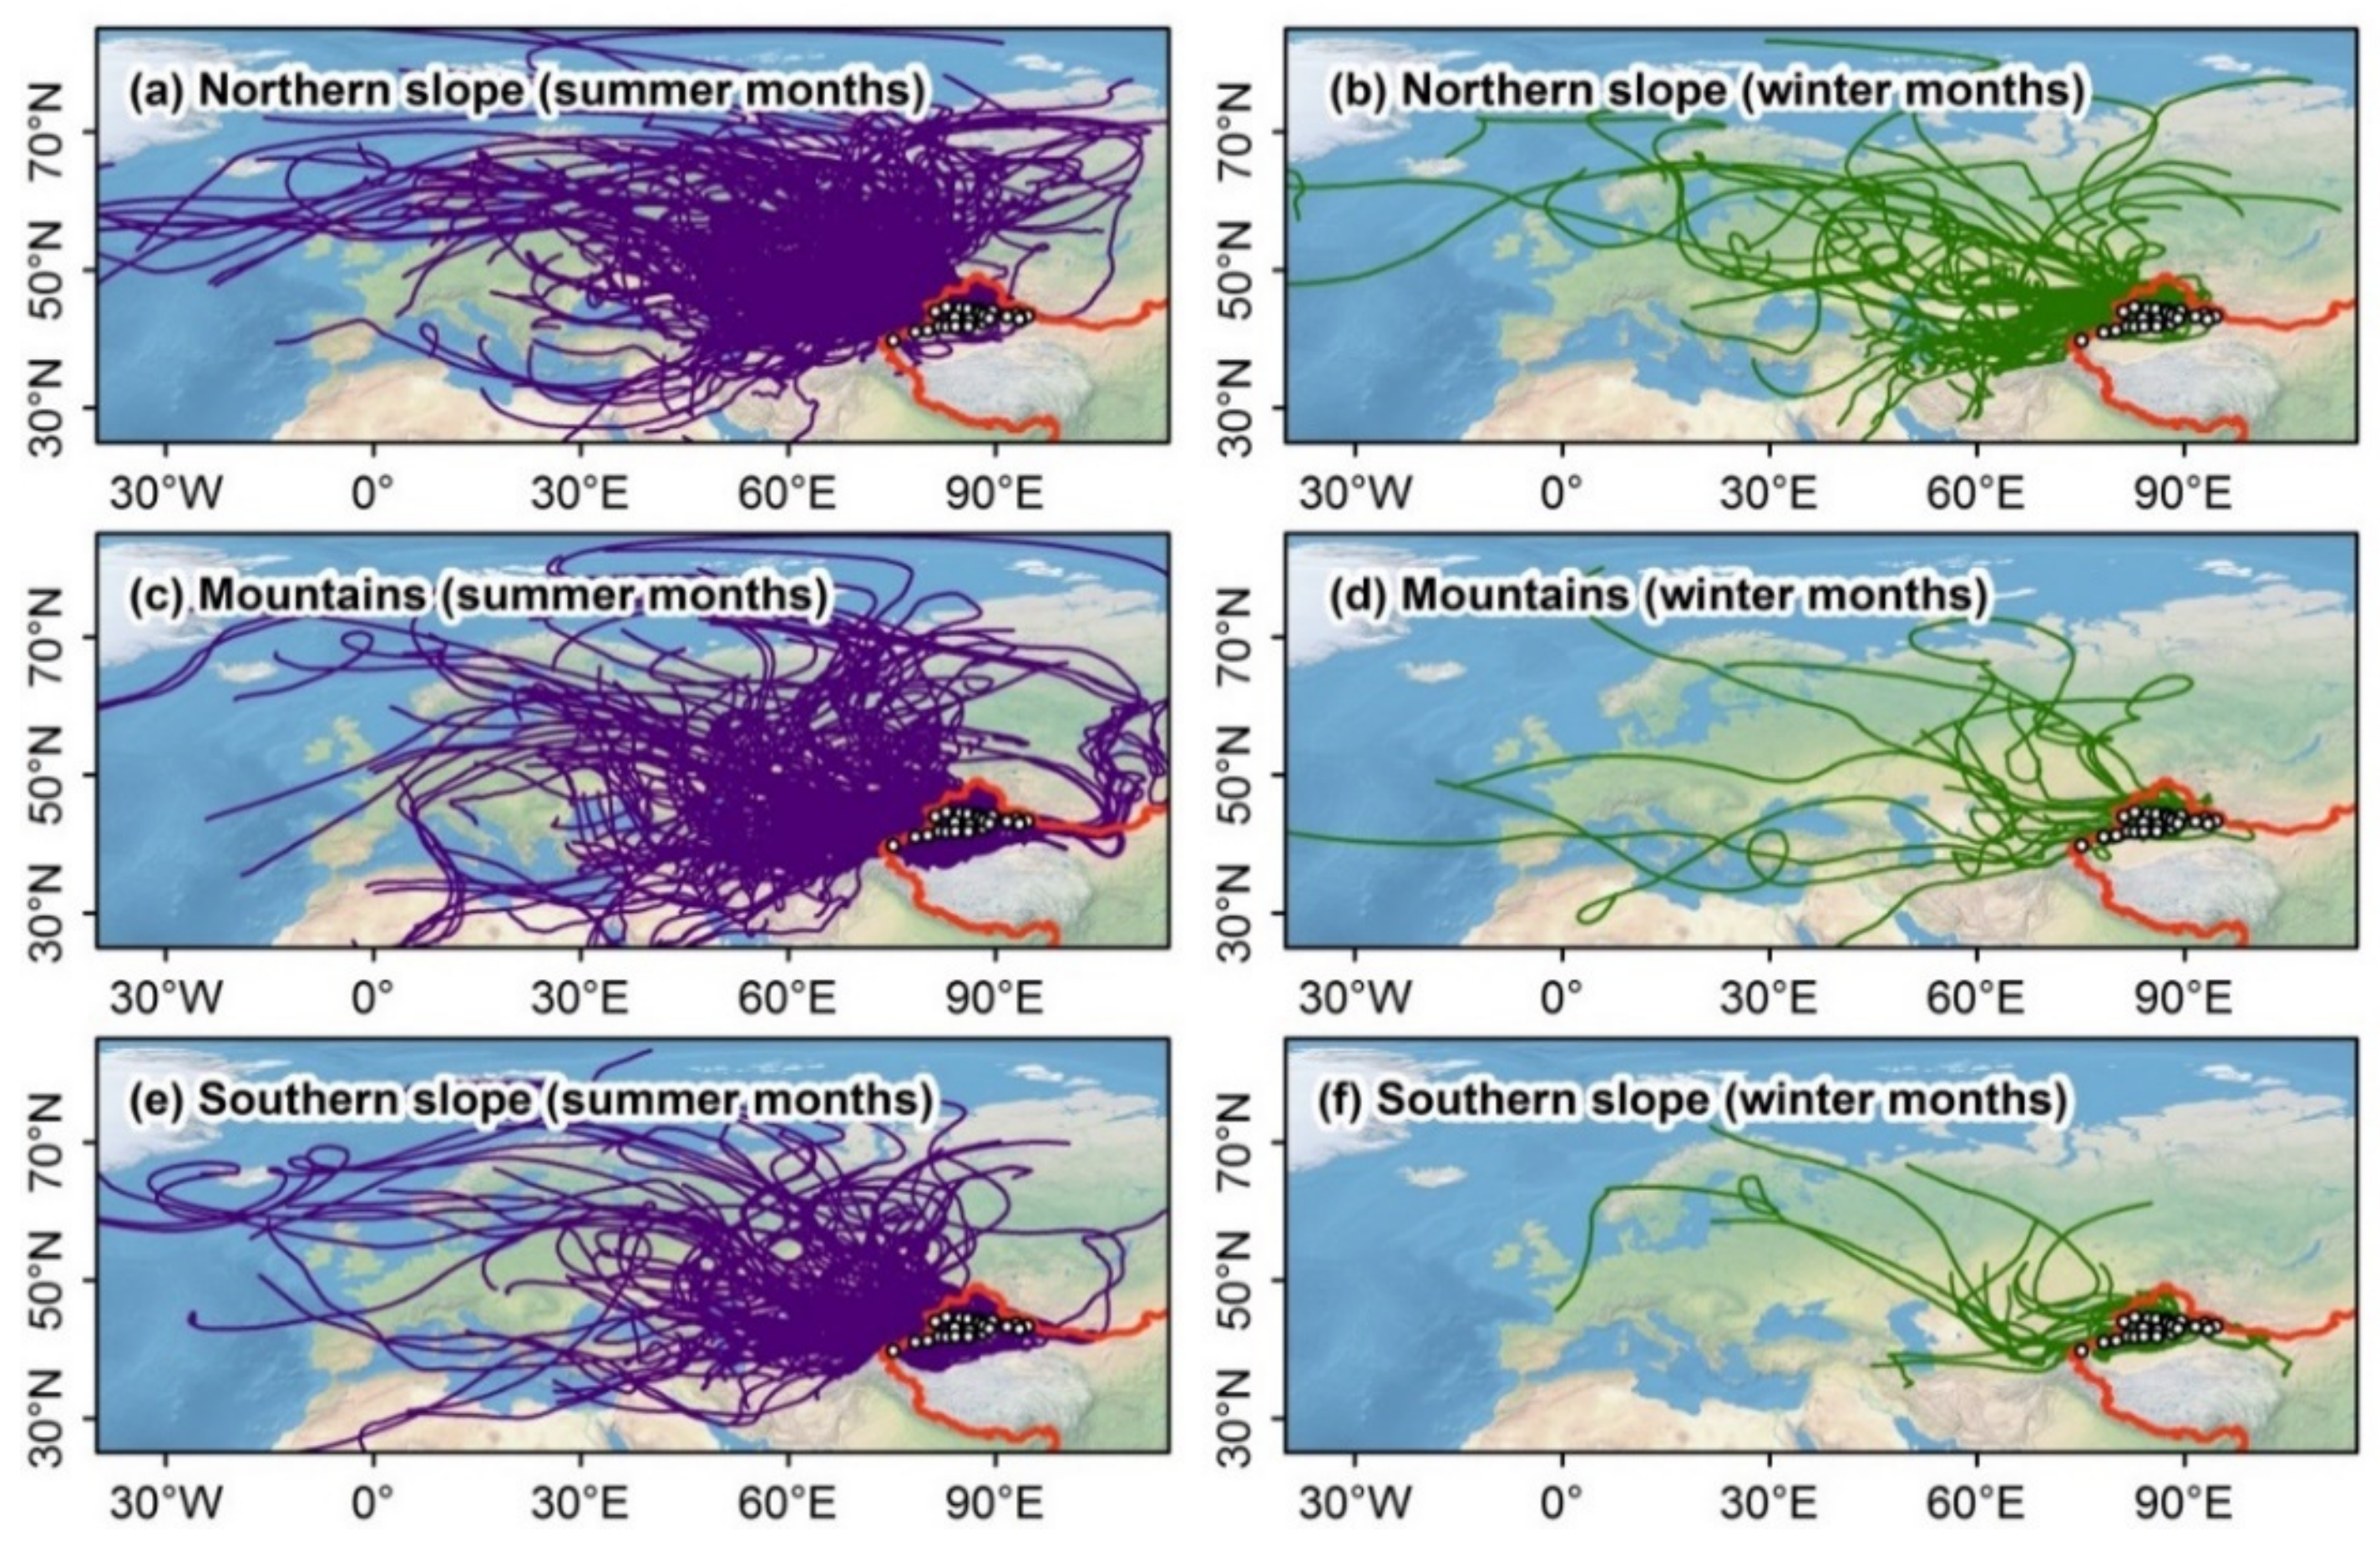
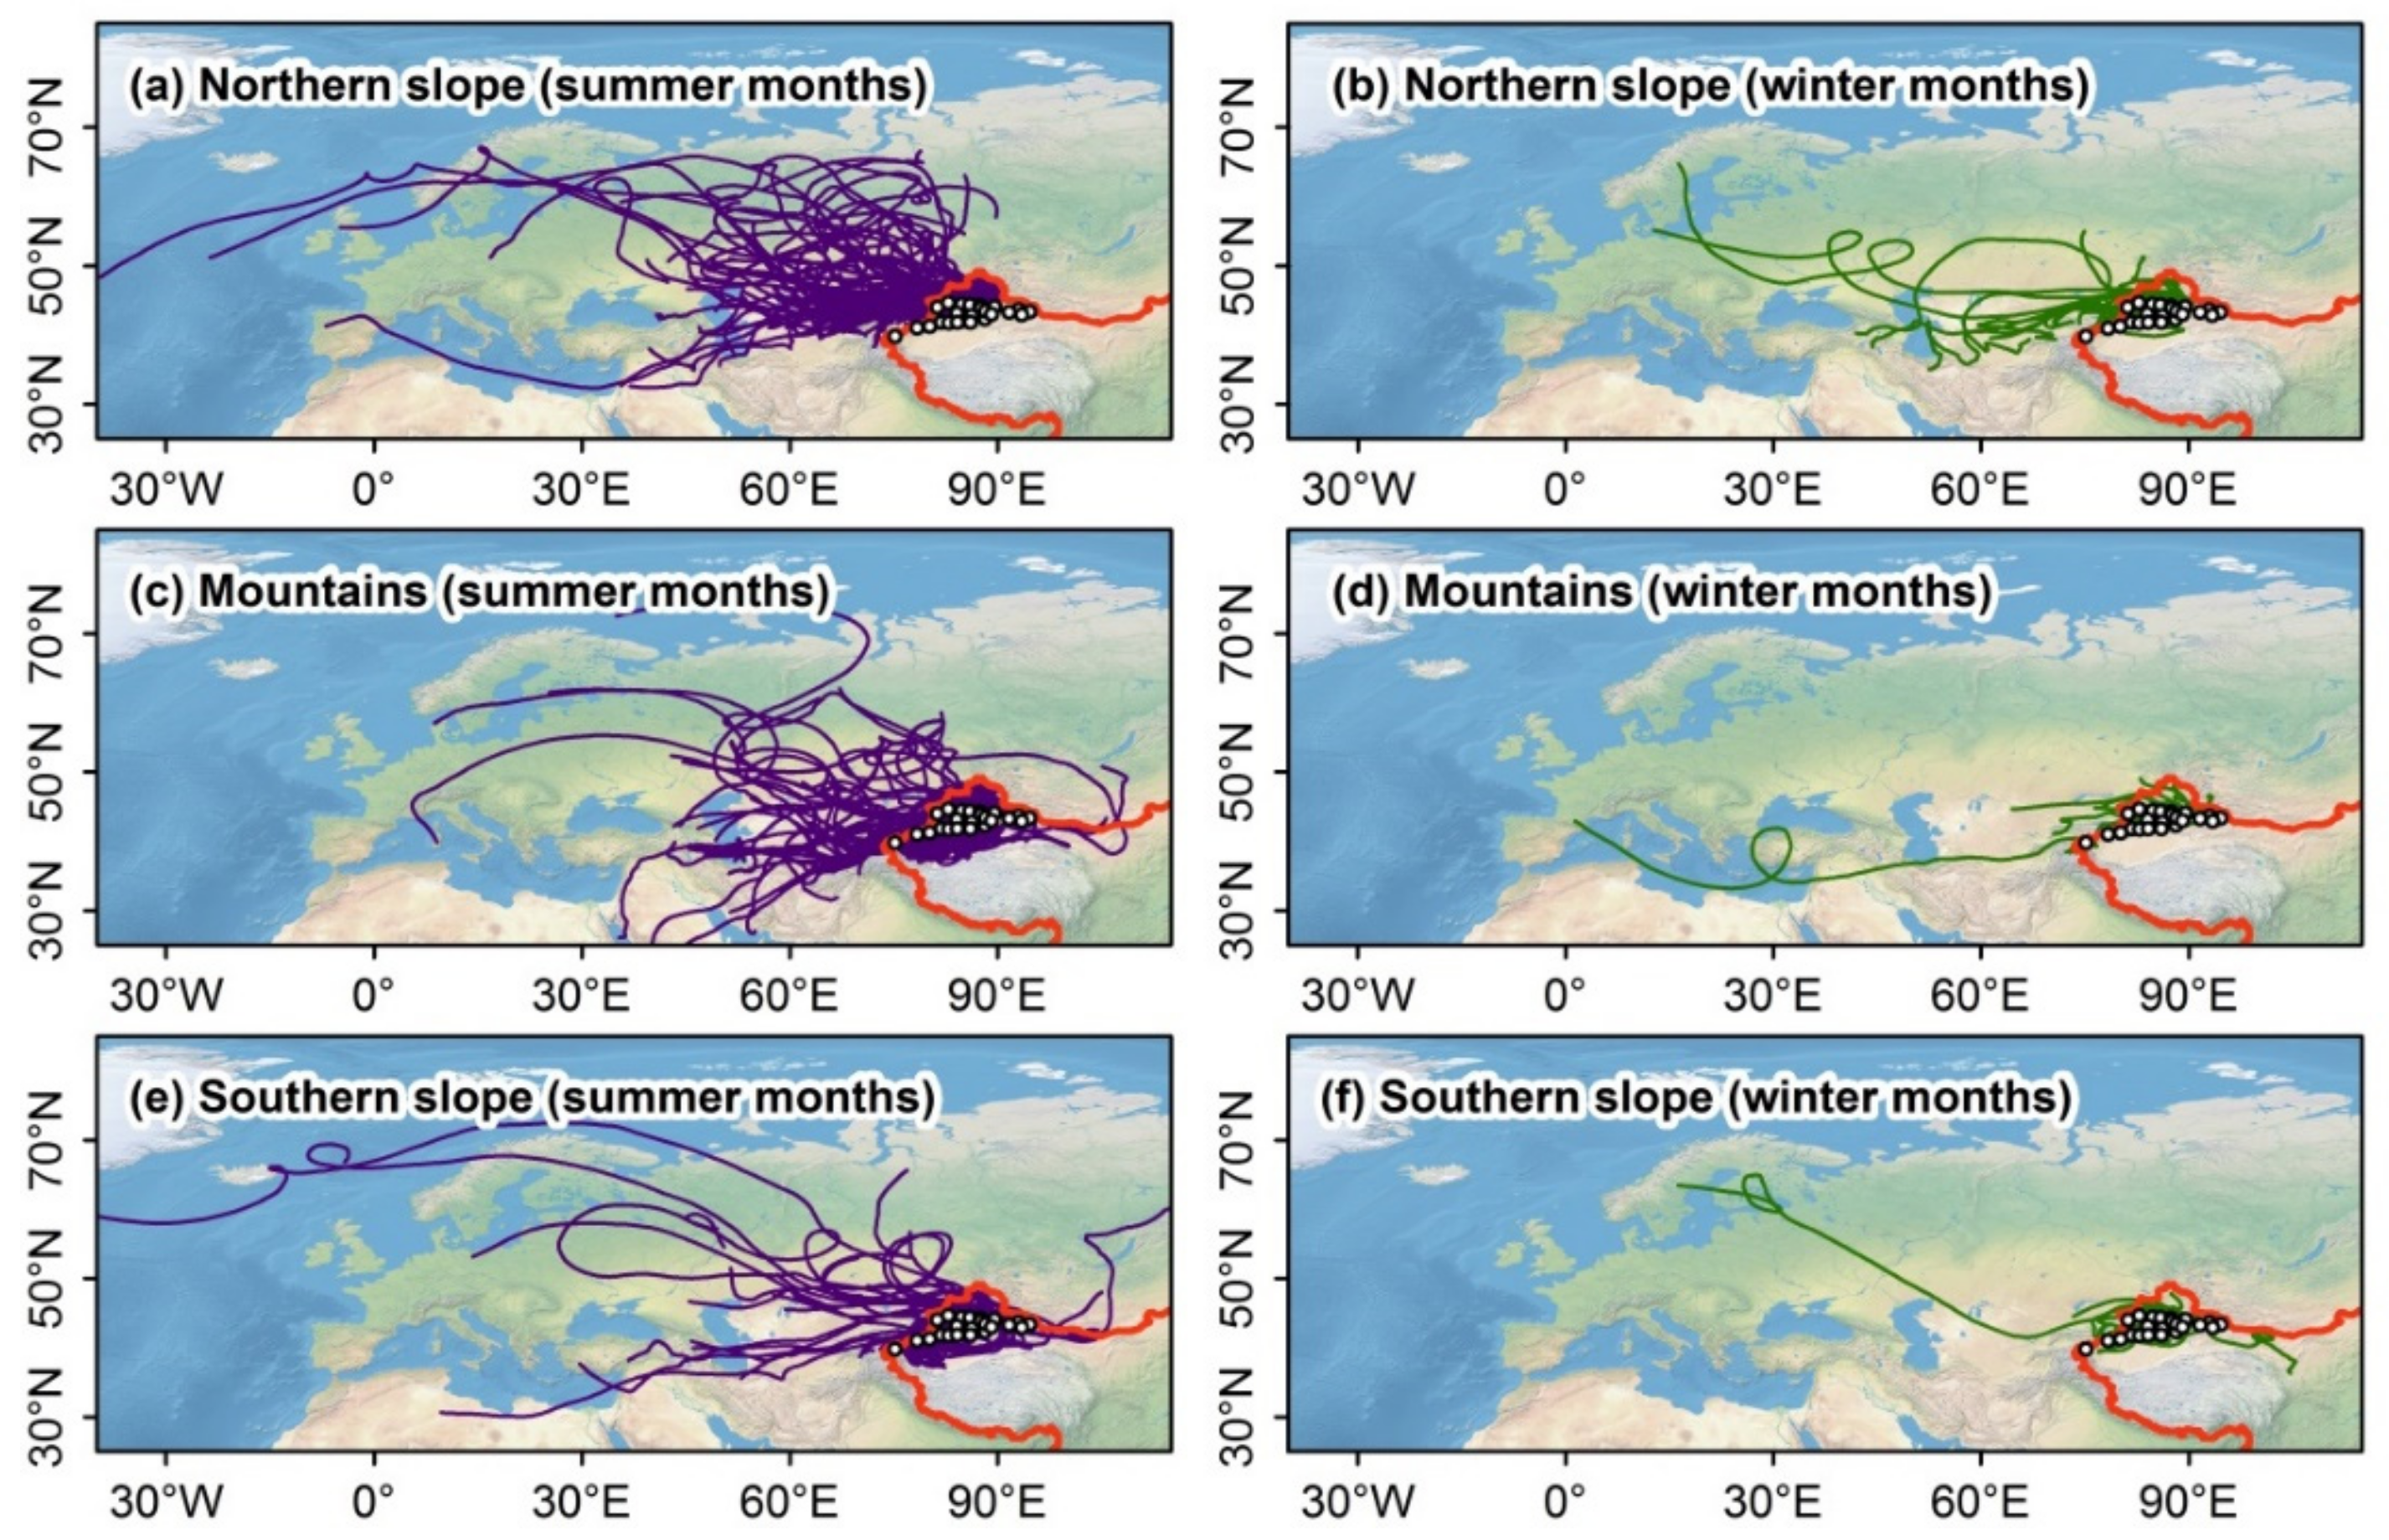
In this study, 10 day backward trajectories (one for each precipitation event) are presented in Figure 2. Summer months are defined as months from April to October, and winter months are from November to March. Considering the main open water bodies along the trajectories, the Atlantic Ocean, the Arctic Ocean, the Mediterranean, the Black Sea and the Caspian Sea are the potential moisture sources [32]. The backward trajectory length can be adjusted according to the variation of specific humidity along the air mass path (i.e., the length can be reduced to the location where the specific humidity is ≤0.05 g/kg; Figure 3). The adjusted results are generally shorter than for those of the raw model (Figure 2), which is consistent with previous findings using different ending heights [19]. The critical moisture sources seem to come indirectly from the Atlantic Ocean, instead of Europe and Central Asia.
To identify the direction of diagnosed moisture sources, the sources were classified into 16 direction sectors, each with a 22.5° interval, and the north and south were defined as 0° and 180°, respectively, i.e., N = 0°, E = 90°, S = 180° and W = 270°. Figure 4 shows the frequency of moisture sources in each direction. Because of the spatial resolution of the reanalysis data used in this study (1° longitude by 1° latitude), the direction classification was not suitable for a very close location (near or less than 1° by 1°). Therefore, in Figure 4, the diagnosed moisture sources within a 300 km radius around the sampling site are removed. In the 16 sectors, on an annual basis, W is the dominant upwind direction, and NW–W is slightly more frequent than SW–W. The seasonal spatial difference for the subregions is also presented in Figure 4b,c.
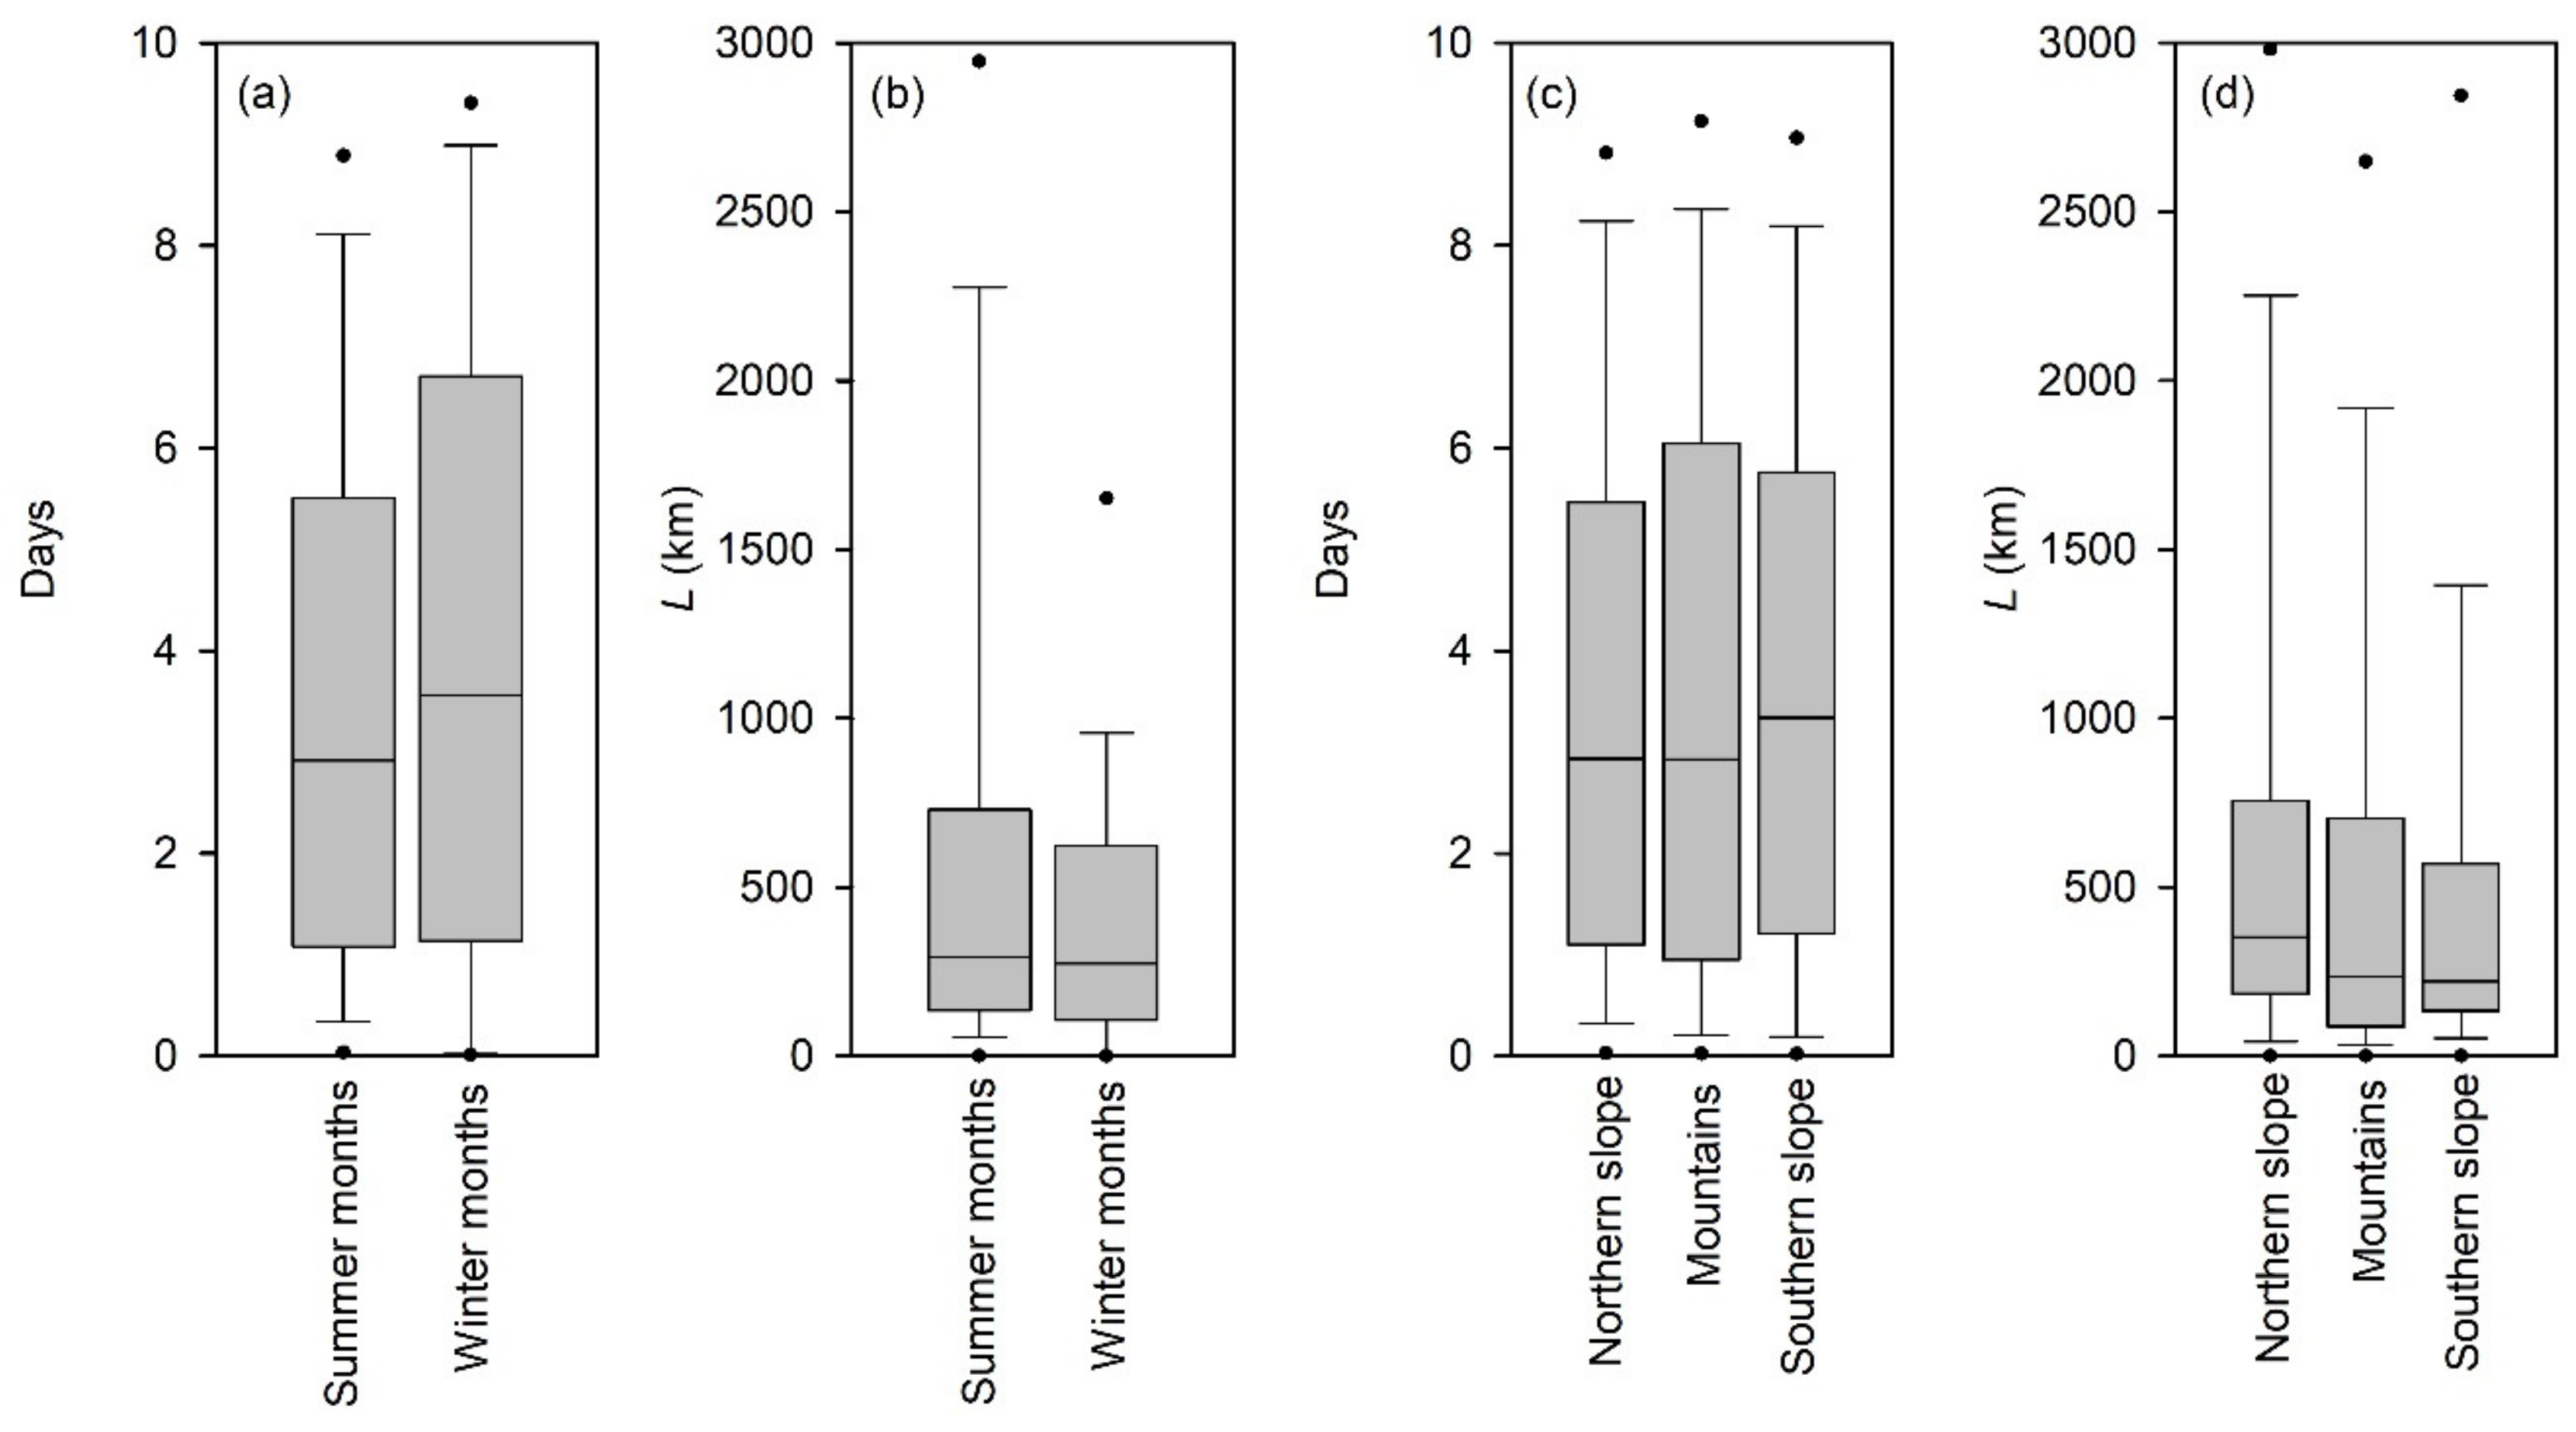
In order to investigate the transport of air mass along the westerly trajectories, the duration and distance of air mass from the diagnosed source to the sampling site were calculated (Figure 5). In the study region, the median value of transport duration from moisture source to precipitation site was 3.0 days (arithmetic average is 3.6 and standard deviation is 2.9). On an annual basis, the median (arithmetic average) durations ± standard deviation on the northern slope, the mountains, and the southern slope are 2.9 (3.6) ± 2.9 days, 2.9 (3.6) ± 3.0 days and 3.3 (3.8) ± 2.9 days, respectively. In summer months, the durations are 2.5 (3.3) ± 2.7 days, 3.0 (3.6) ± 2.9 days and 3.3 (3.7) ± 2.8 days, respectively; in winter months, the durations are 3.6 (4.1) ± 3.0 days, 2.6 (3.7) ± 3.5 days and 3.1 (3.9) ± 3.4 days, respectively. The backward trajectory duration in winter months, in terms of time, is generally longer than that in summer months (Figure 5a,c).
Figure 5b,d show the direct distance from the source to the target site, and most moisture sources are closer than 1000 km. The median and arithmetic average distances on an annual basis are 292 km and 665 km, and the standard deviation is 1037 km. The distances, median (arithmetic average) ± standard deviation, in summer and winter months are 293 (704) ± 1081 km and 275 (510) ± 823 km, respectively; on a spatial view, the distances for the northern slope, the mountains and the southern slope are 353 (755) ± 1098 km, 237 (607) ± 941 km and 222 (594) ± 1052 km, respectively. The moisture sources in winter months are usually closer than those in summer months, and the sources to the southern slope sites are usually closer than those to the northern slope.
According to one-way analysis of variance, the differences in duration and distance between summer and winter months are statistically significant at the 0.05 level (significance levels are 0.030 and 0.015, respectively), but there is no significant difference in duration and distance among the northern slope, the mountains, and the southern slope (0.655 and 0.061, respectively). In summer months, there is significant difference in distance (0.006), instead of duration (0.183), for three subregions; in winter months, no statistically significant difference exists among different subregions.
Taking duration and distance of backward trajectory into account, the transport process exhibits obvious differences in summer and winter. In summer months, the air mass transport takes a short time and a long direct distance; in winter months, the duration of moisture transport is slightly longer and the distance from source to target site is short. This pattern indicates that the summer months usually have rapid air mass movement, and remotely sourced moisture can be delivered to arid central Asia; whereas the winter months have weak moisture loading, and the contribution from local moisture increases. Similarly, the northern slope shows shorter duration and longer distance, and the southern slope shows longer duration and shorter distance, i.e., the northern slope receives more moisture from remote regions with fast transport, and the southern slope has more local moisture with relatively slow transport.
3.2. Relationship between Precipitation Isotope and Moisture Source
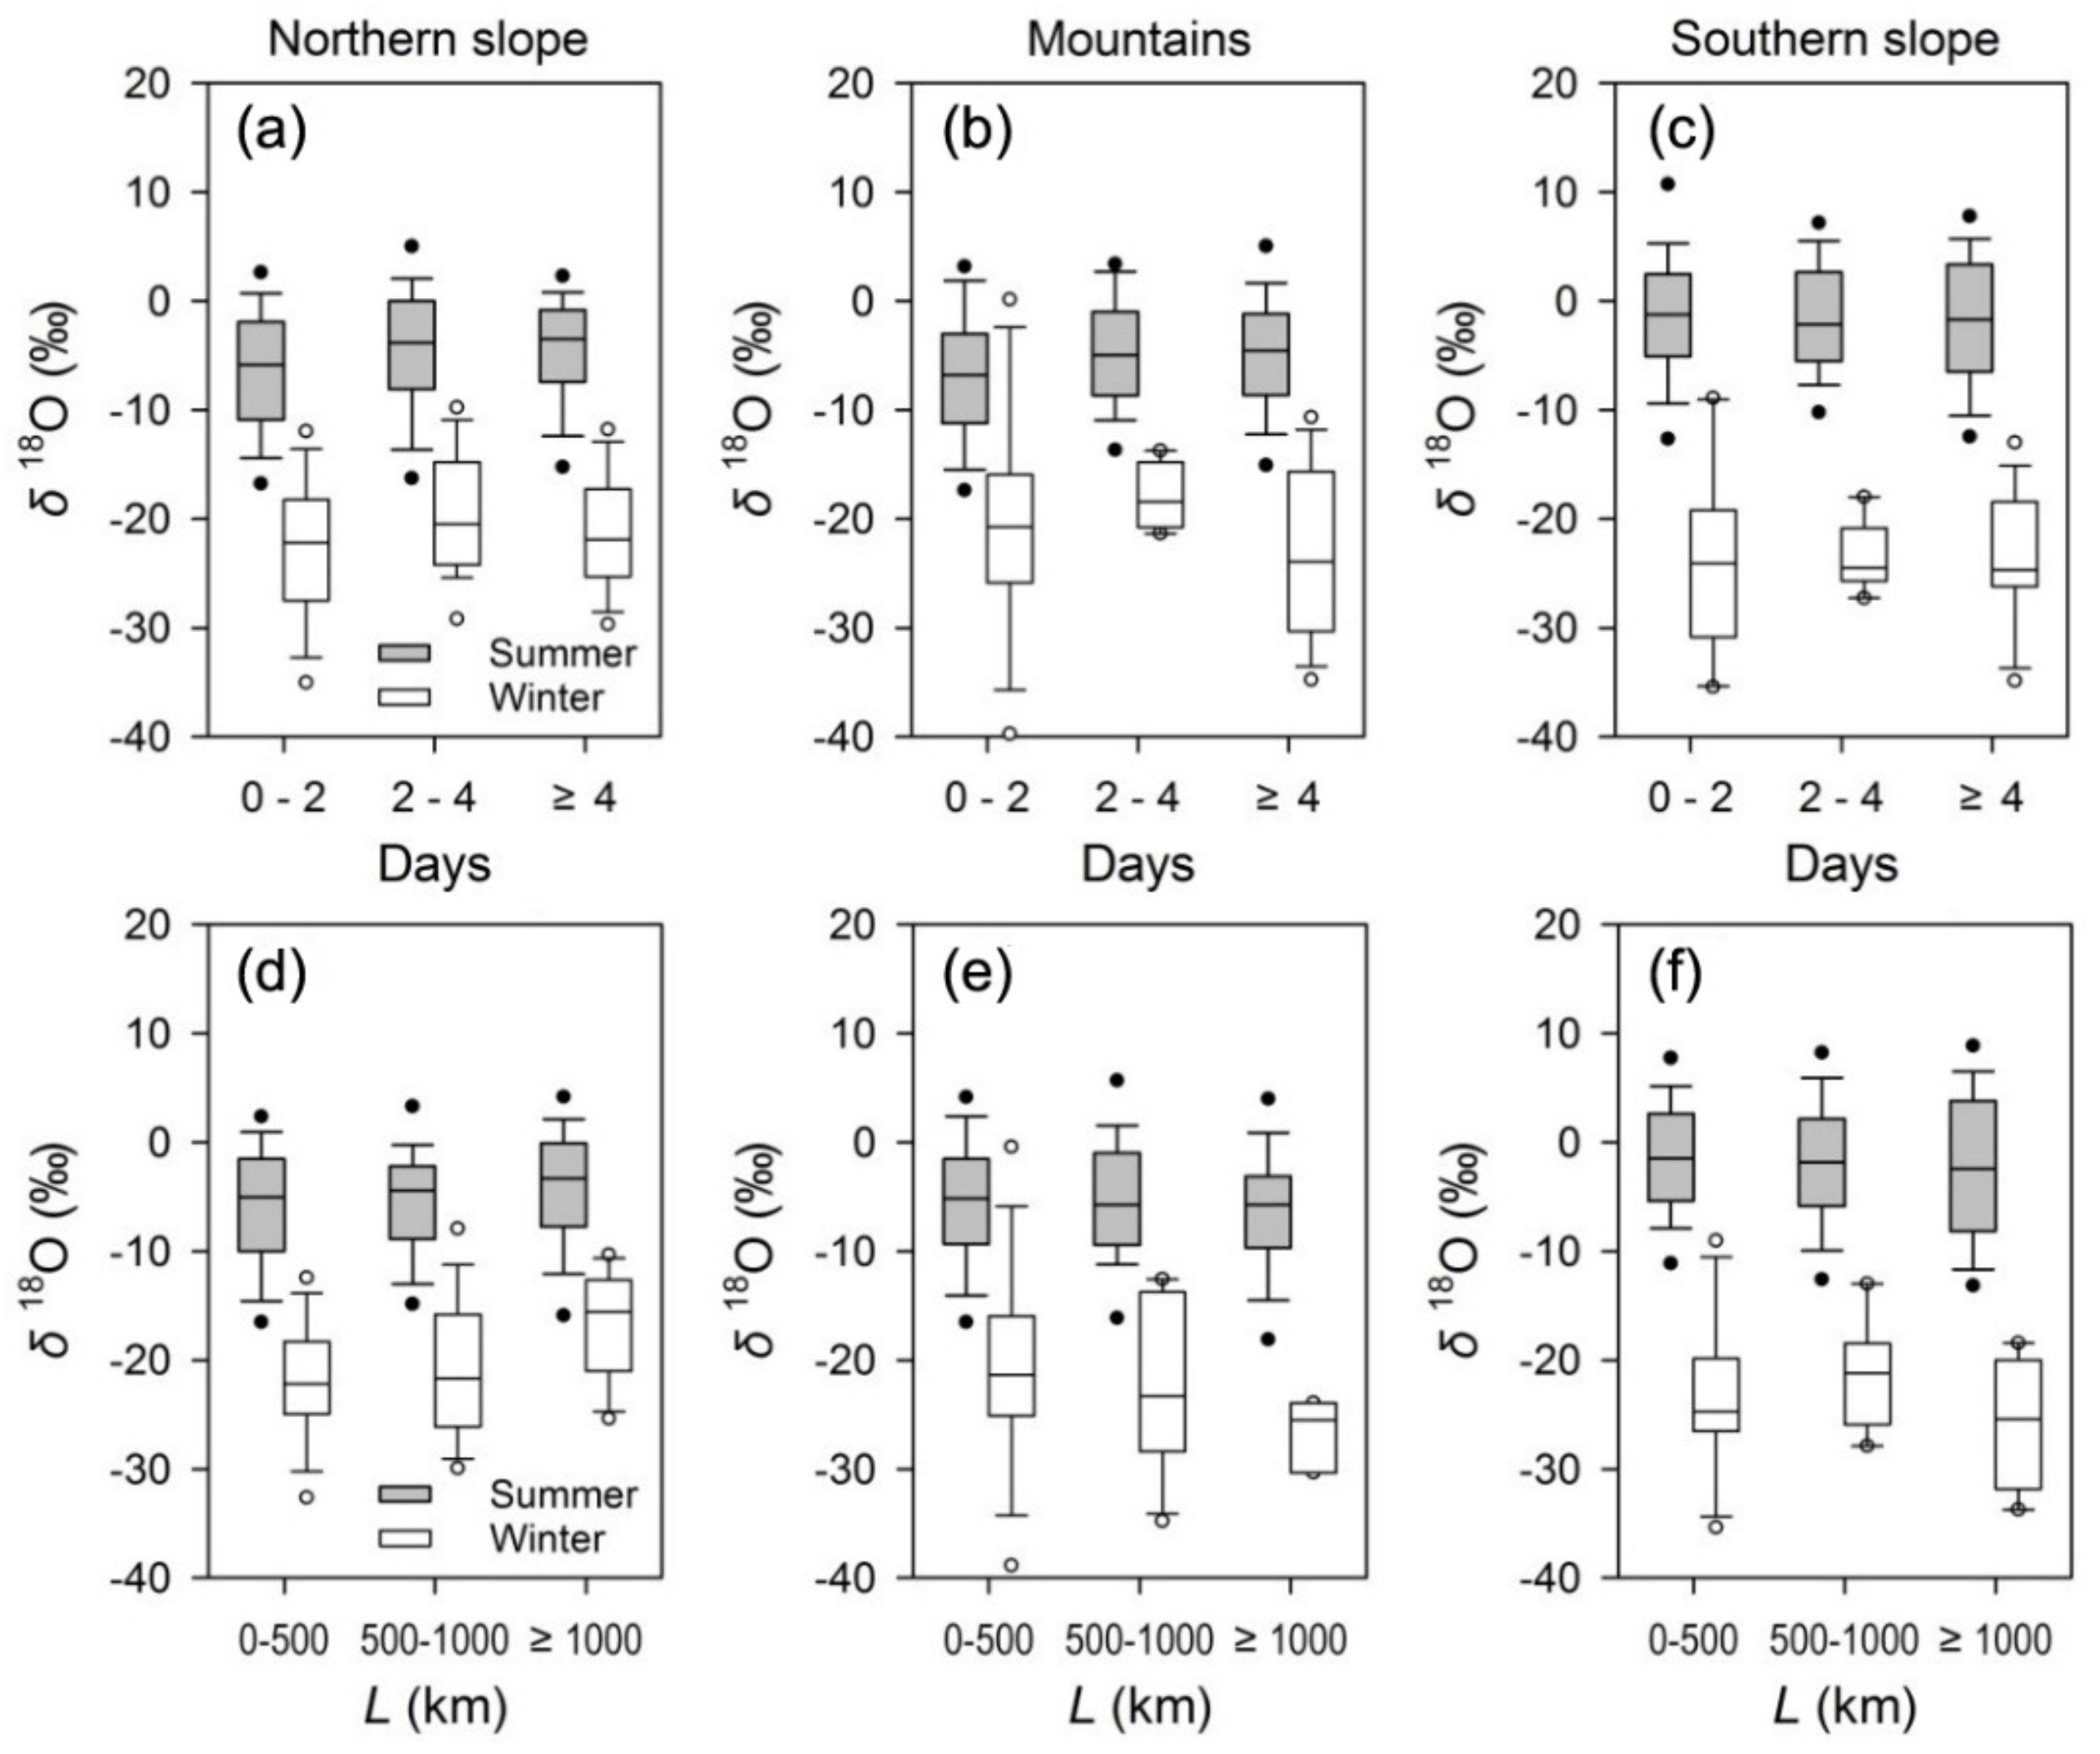
Figure 6a–c shows the relationship between trajectory duration and isotopic composition in precipitation during summer and winter months. On the northern slope and the mountains, as summer trajectory duration increases, δ18O shows a positive trend. Seen from the median value of δ18O in the summer and winter months, the events with less than 2 days trajectory duration are usually more depleted in the heavier isotope 18O. In contrast, on the southern slope the relationship is not clear in summer; as the backward trajectory duration increases, δ18O in precipitation fluctuates on the southern slope. The spatial difference may demonstrate that in a relatively wet region like the northern slope [19], the events with short transport time from moisture source to precipitation are usually significantly impacted by local recycled moisture with a low isotopic ratio.
In Figure 6d–f, the relationship between the stable isotopes in precipitation and direct distance from the source to the target site also shows a different pattern for each subregion. On the northern slope, more distant moisture sources in summer months usually have more enriched isotopic values. In contrast, on the southern slope, more distant moisture sources in summer months may not always correspond with lower or higher isotopic values. The main regime generally corresponds with the finding in Figure 5.
According to the general linear model, the isotopic difference for various duration ranges and distance ranges is statistically significant, and the significance levels are 0.001 (duration ranges) and 0.049 (distance ranges), respectively. If only the northern slope sites are taken into consideration, the significance still remains (0.003 and 0.005); however, in the southern slopes, there is no statistical significance (0.201 and 0.676).
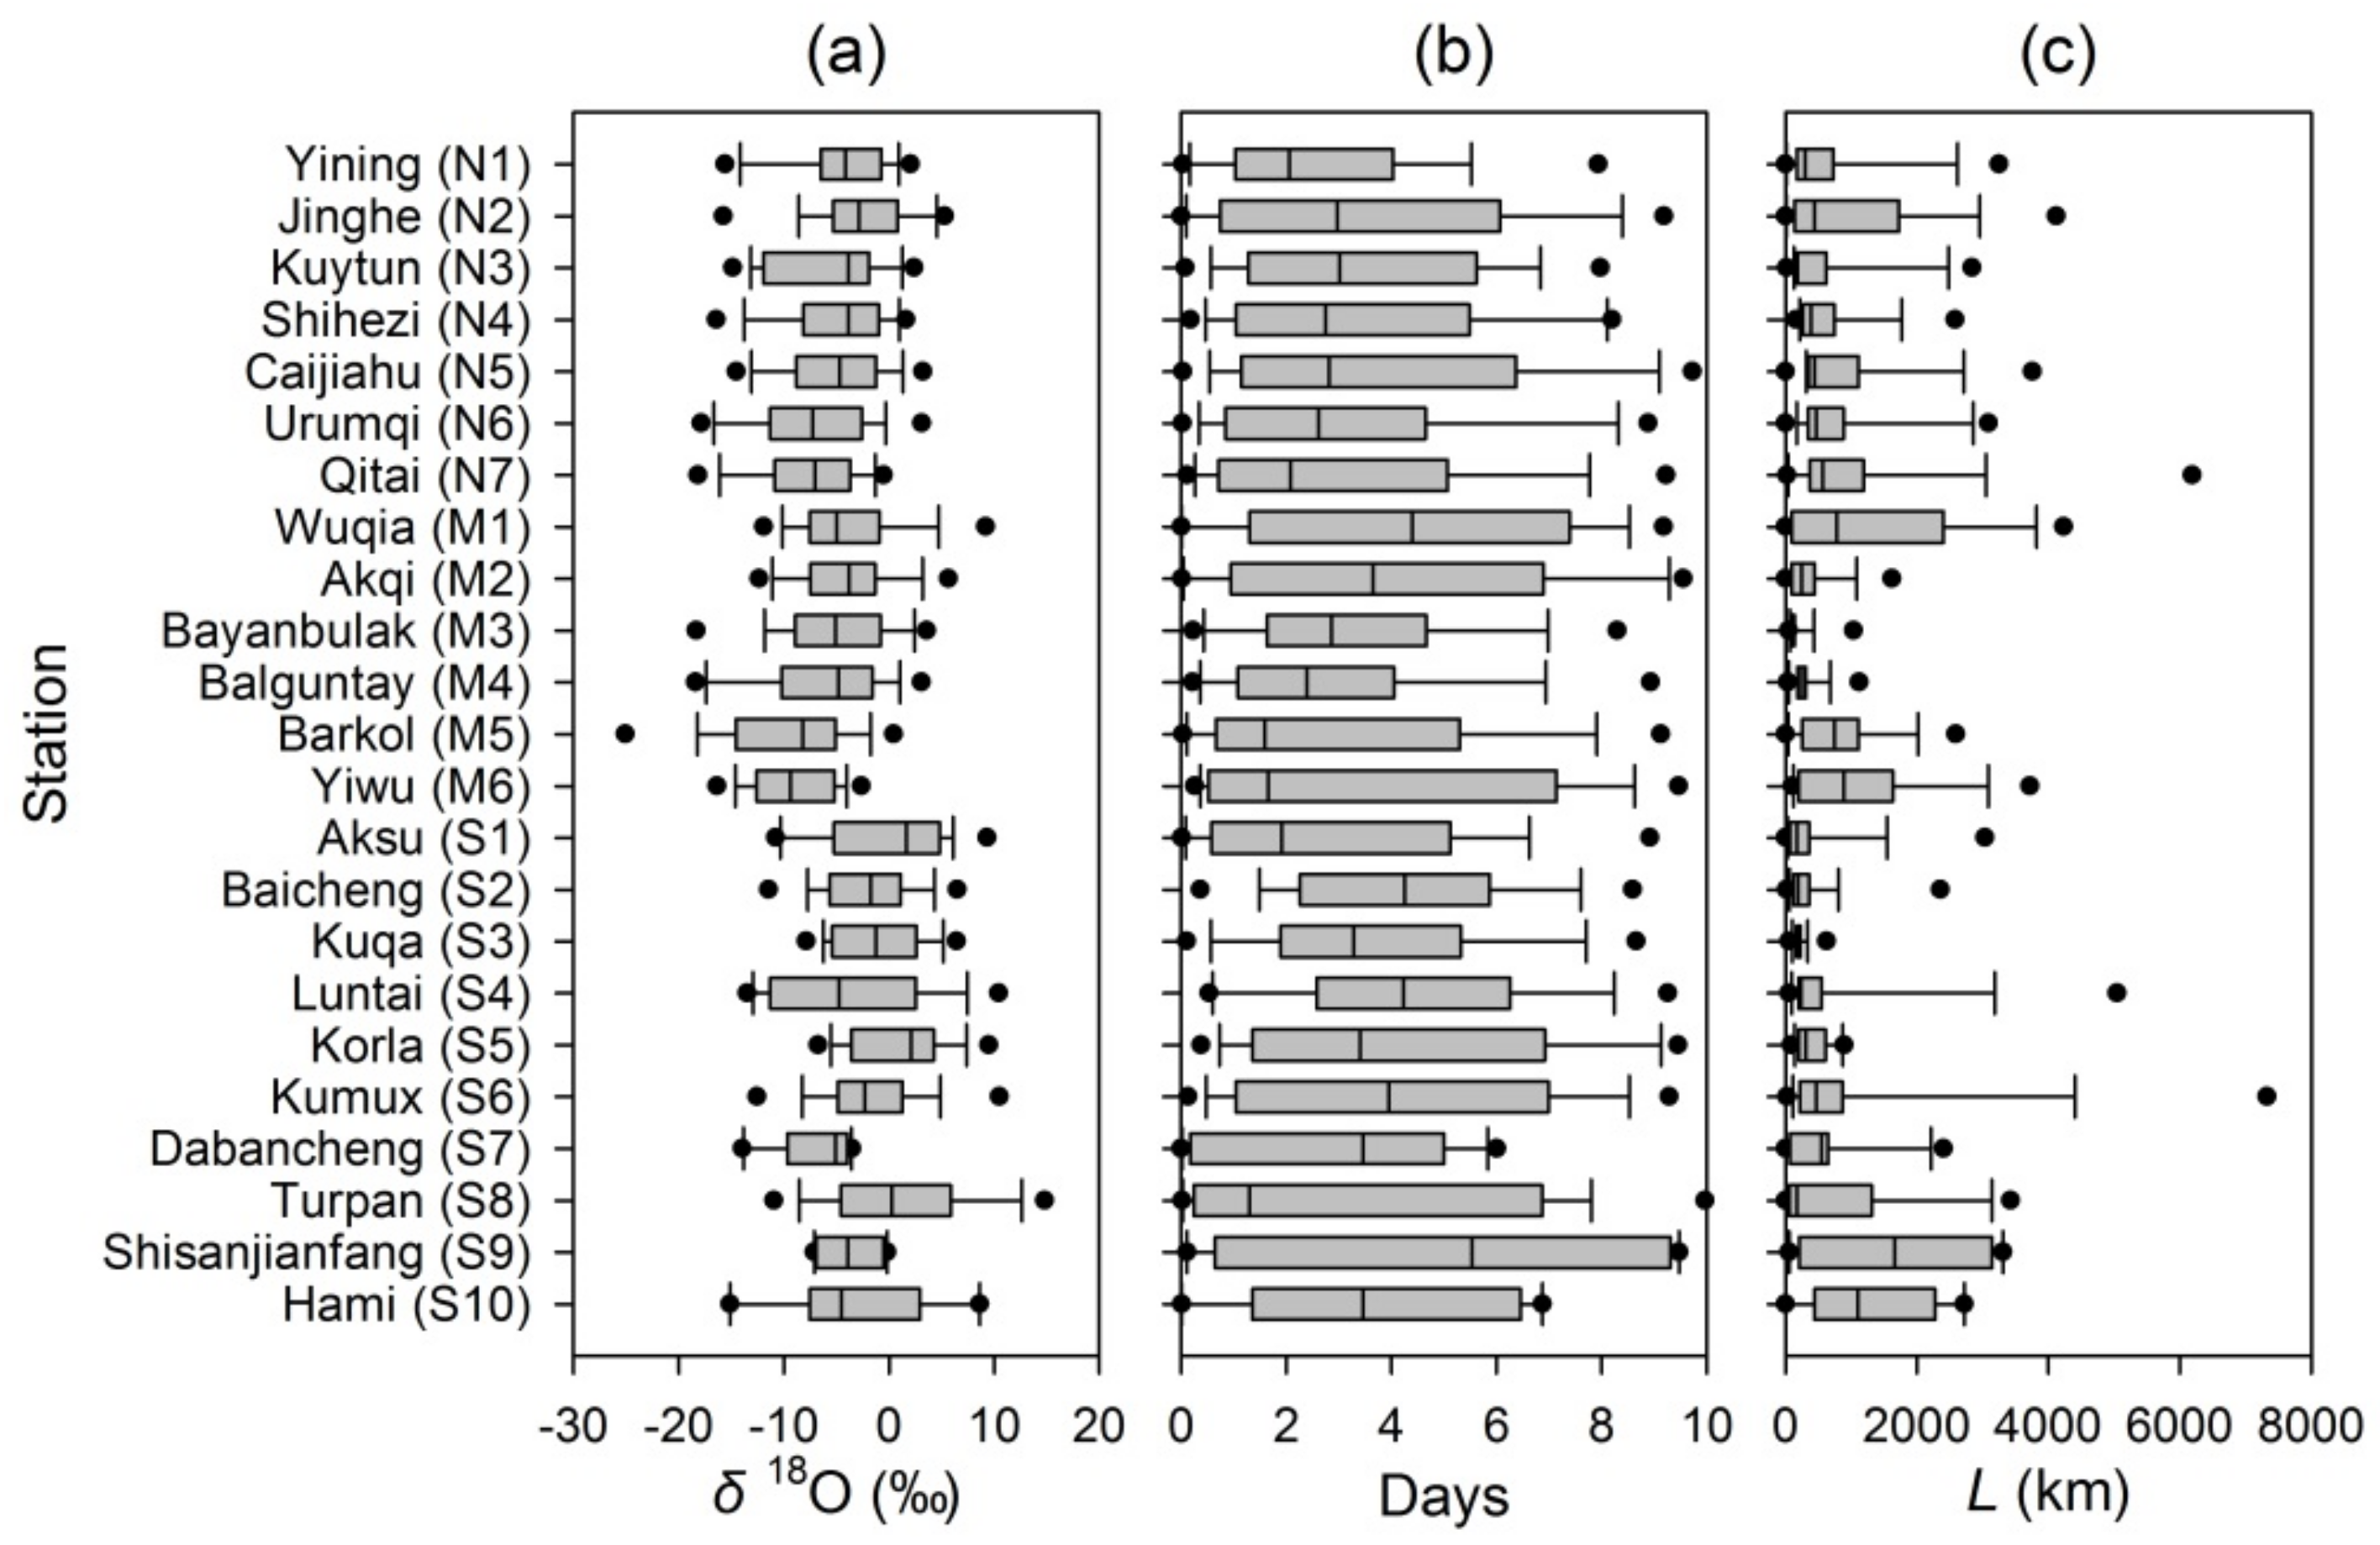
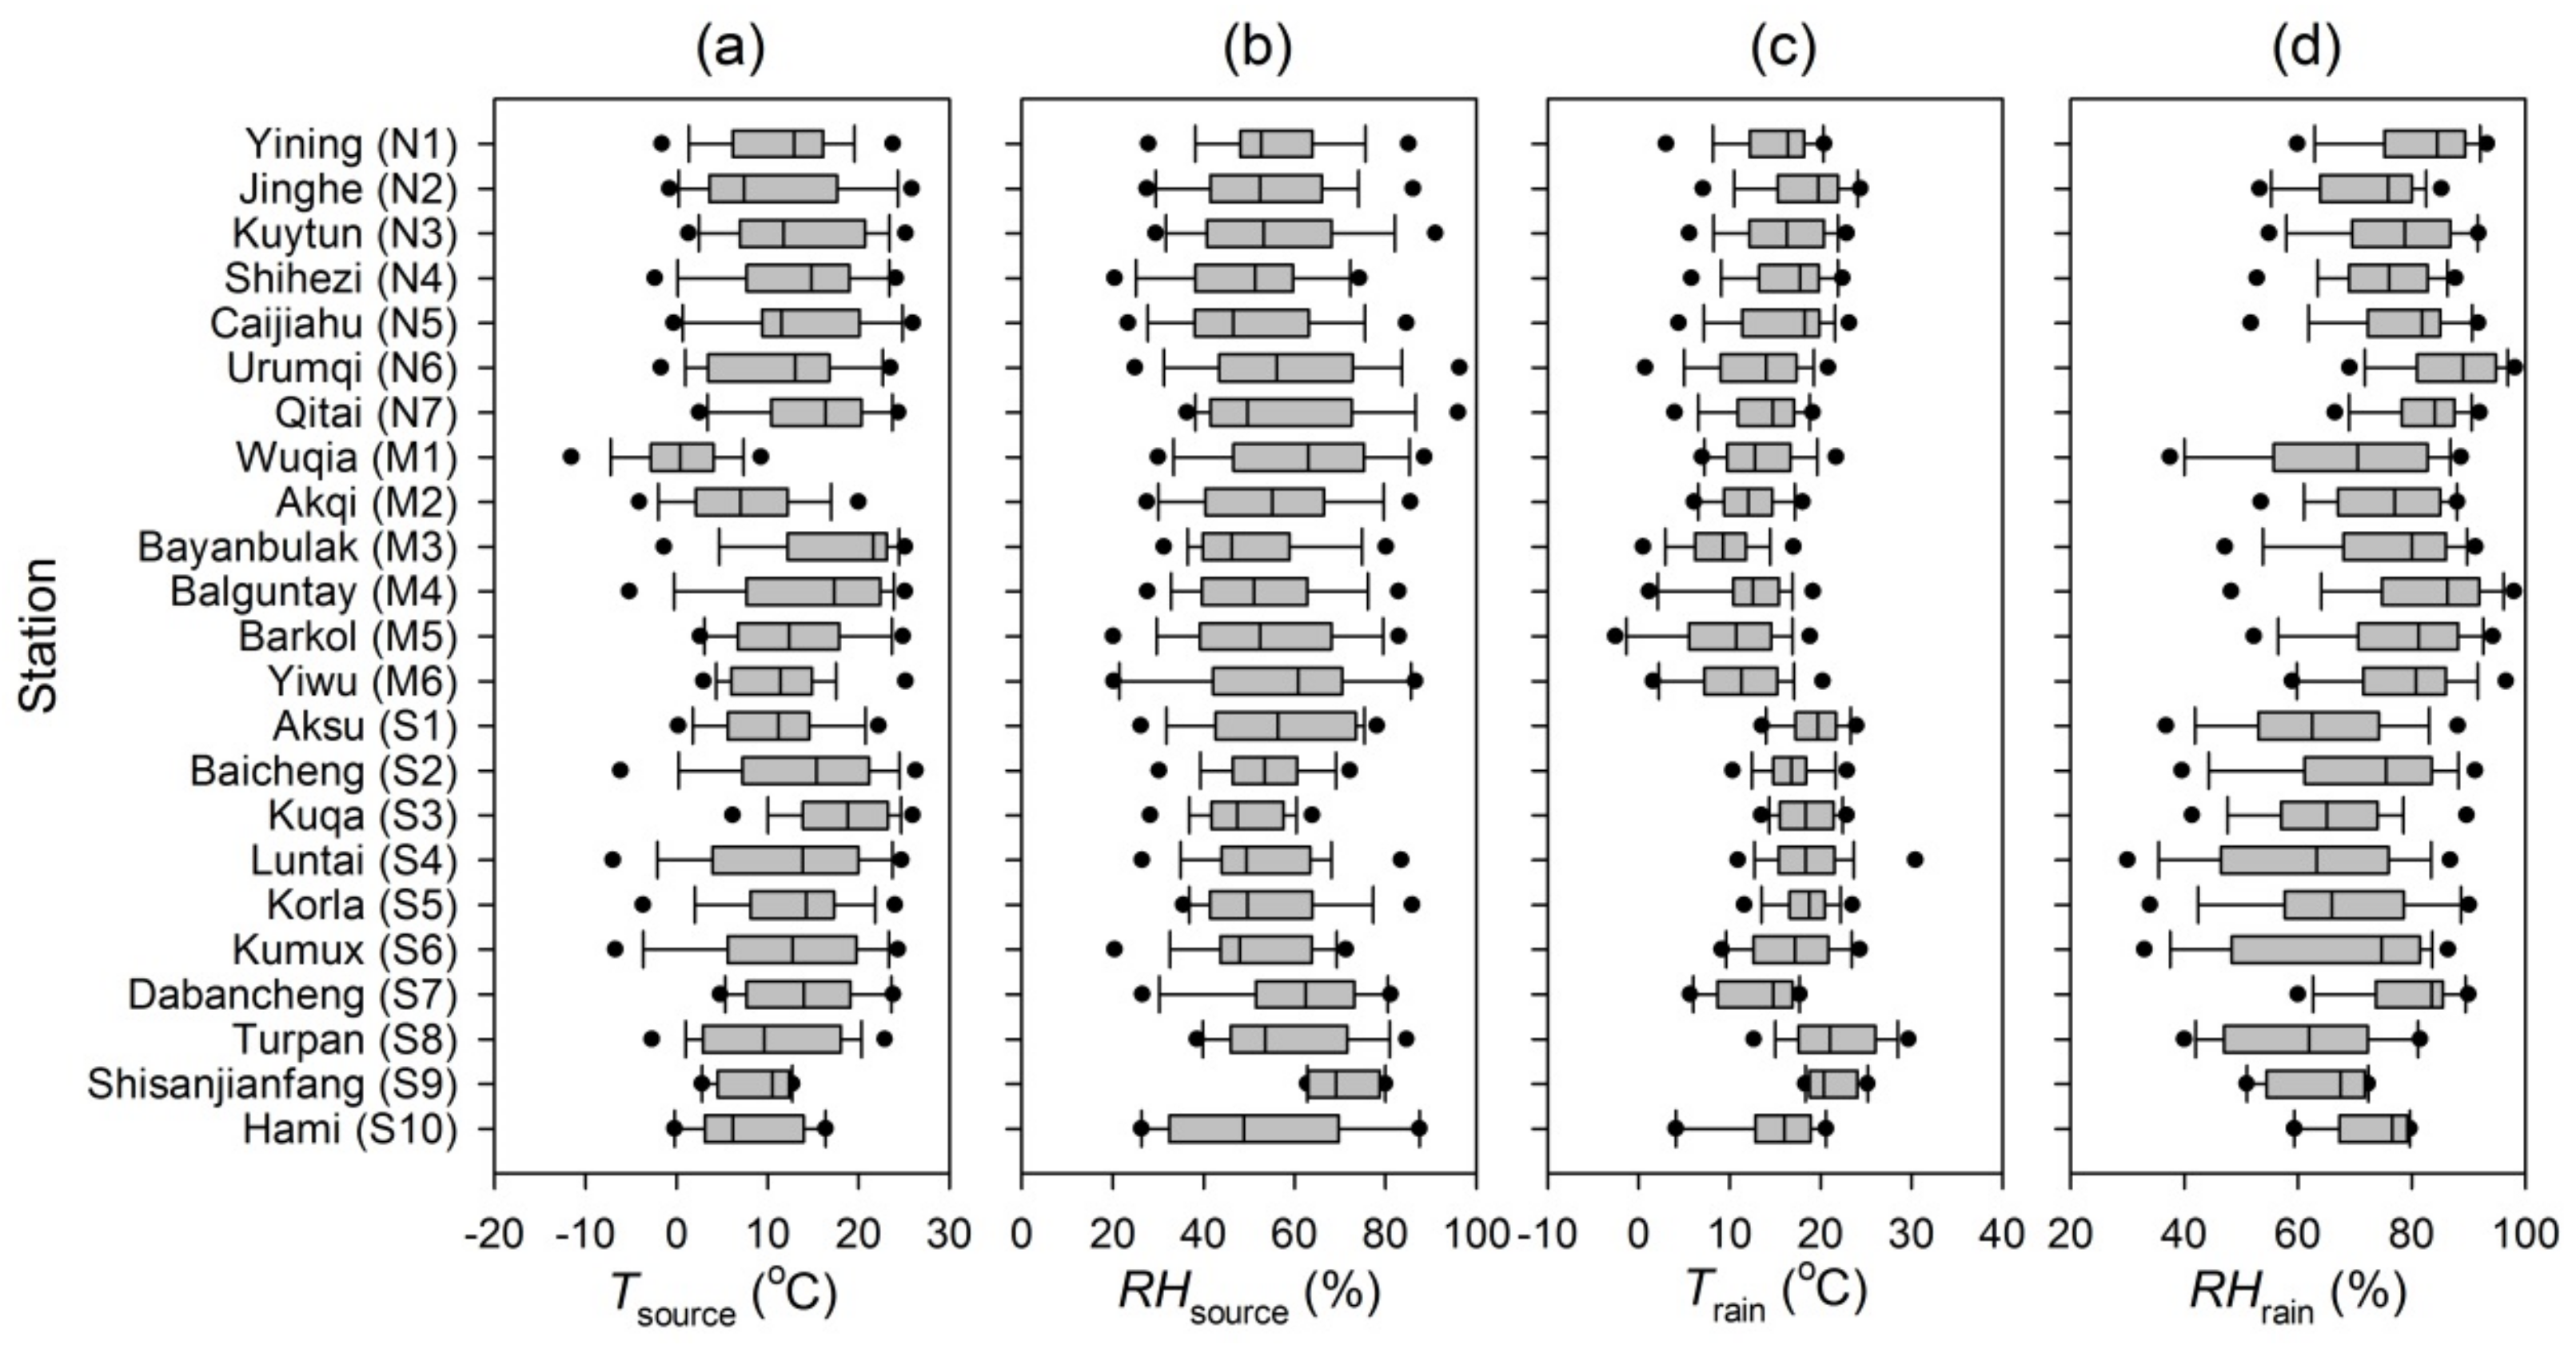
To investigate the transport process via the westerlies, the summer precipitation isotopes for each sampling site around the Tianshan Mountains are shown in Figure 7 and Figure 8. Generally, the isotopic values show a relative depleting trend from west to east, which is seen from each subregion. The pattern corresponds with the rainout effect of single air mass. Along the westerlies path for the northern slope and mountains, the duration shows a decreasing trend, and the distance shows an increasing trend. For the southern slope, the trend is not so obvious, especially for δ18O in precipitation and trajectory duration.
In past decades, almost all observational studies of stable isotopes in the precipitation of this region attribute the moisture source to the westerlies [4,5,6,33,34], which is also coincident with the findings using meteorological approaches [35]. Because the transport paths are generally from west to east, the parameters of the duration and direct distance of the diagnosed backward trajectory were analyzed in this study, and these two parameters can effectively describe the moisture source to the study region of arid central Asia. It should be noticed that detailed information of the westerly moisture path has not been well quantified in previous studies across this region. For example, the path variability of the westerly has been mentioned in many investigations and has been considered an important cause of the inter-annual variability of isotopes in precipitation [18,20]. However, the duration and distance of the westerly moisture have not been calculated. The Lagrangian diagnostic adjusted using specific humidity along the trajectory does provide a useful method for this topic. In particular, the duration and distance from the moisture source to the target site can be calculated, respectively, which may also be helpful for different climate settings all over the world. In a study based on the same data source in arid central Asia [19], input parameters such as start height and the threshold value of specific humidity in the Lagrangian diagnostic were carefully verified, but quantified information like the duration and distance of trajectories was still not focused on. As shown previously in the current study, the transport process of moisture is generally related to the duration and distance of backward trajectory.
In addition, the conditions in this study were quite different from previous studies using the adjusted Lagrangian diagnostic at other locations, especially Greenland [21,22] and Australia [23], sites which are surrounded with vast oceans. For a coastal site, the specific humidity-based trajectory can be used to identify the evaporative sea region. In arid central Asia, terrestrial evaporation and transpiration may greatly contribute to local precipitation, especially the oases including inland lakes, urban green areas, and cropland.
4. Conclusions
Based on an observation network, an adjusted Lagrangian diagnostic was applied to identify the moisture sources for each precipitation event. The median value of transport duration from moisture source to precipitation sampling site is approximately 3 days, and most moisture sources are closer than 1000 km. Summer months usually have rapid air mass movement, and the relatively remote moisture can be delivered to arid central Asia; in winter months, the moisture loading is weak, and longer transport duration and more local sources are seen. This study concurs with prior studies that have been largely based on monthly datasets, however, the event-based data from this study enabled us to investigate in more detail the relationship between trajectory and isotopic composition. The northern slope usually shows shorter duration and longer distance, and more distant moisture sources have more enriched isotopic values; in contrast, on the southern slope with longer duration and shorter distance, more distant sources usually correspond with lower isotopic values in precipitation.
Author Contributions
Conceptualization, S.W. and M.Z.; methodology, S.W. and M.D.; writing—original draft preparation, S.W; writing—review and editing, S.W, M.S., R.J. and L.W.; visualization, S.W.; supervision, M.Z.; project administration, S.W. and M.Z.
Funding
This research was funded by the National Natural Science Foundation of China (grant number 41701028, 41971034 and 41161012) and the Scientific Research Program of Higher Education Institutions of Gansu Province (grant number 2018C-02).
Acknowledgments
The authors thank Jagoda Crawford, Catherine E. Hughes (Australian Nuclear Science and Technology Organisation), Zhongqin Li (Northwest Institute of Ecology and Environmental Resources, Chinese Academy of Sciences) and Yanlong Kong (Institute of Geology and Geophysics, Chinese Academy of Sciences) for their constructive suggestions. Satellite-derived land cover map were kindly provided by Natural Earth (http://www.naturalearthdata.com).
Conflicts of Interest
The authors declare no conflict of interest.
References
- Hu, Z.; Zhou, Q.; Chen, X.; Qian, C.; Wang, S.; Li, J. Variations and changes of annual precipitation in Central Asia over the last century. Int. J. Climatol. 2017, 37, 157–170. [Google Scholar] [CrossRef]
- Yao, J.; Hu, W.; Chen, Y.; Huo, W.; Zhao, Y.; Mao, W.; Yang, Q. Hydro-climatic changes and their impacts on vegetation in Xinjiang, Central Asia. Sci. Total. Environ. 2019, 660, 724–732. [Google Scholar] [CrossRef] [PubMed]
- Cai, P.; Hamdi, R.; Luo, G.; He, H.; Zhang, M.; Termonia, P.; De Maeyer, P. Agriculture intensification increases summer precipitation in Tianshan Mountains, China. Atmos. Res. 2019, 227, 140–146. [Google Scholar] [CrossRef]
- Araguas-Araguas, L.; Froehlich, K.; Rozanski, K. Stable isotope composition of precipitation over Southeast Asia. J. Geophys. Res. 1998, 103, 28721–28742. [Google Scholar] [CrossRef]
- Tian, L.; Yao, T.; MacClune, K.; White, J.W.C.; Schilla, A.; Vaughn, B.; Vachon, R.; Ichiyanagi, K. Stable isotopic variations in west China: A consideration of moisture sources. J. Geophys. Res. 2007, 112, D10112. [Google Scholar] [CrossRef]
- Kong, Y.; Wang, K.; Li, J.; Pang, Z. Stable isotopes of precipitation in China: A consideration of moisture Sources. Water 2019, 11, 1239. [Google Scholar] [CrossRef]
- Yao, T.; Masson, V.; Jouzel, J.; Stievenard, M.; Sun, W.; Jiao, K. Relationships between δ18O in precipitation and surface air temperature in the Urumqi River Basin, East Tianshan Mountains, China. Geophys. Res. Lett. 1999, 26, 3473–3476. [Google Scholar] [CrossRef]
- Pang, Z.; Kong, Y.; Froehlich, K.; Huang, T.; Yuan, L.; Li, Z.; Wang, F. Processes affecting isotopes in precipitation of an arid region. Tellus B 2011, 63, 352–359. [Google Scholar] [CrossRef]
- Wang, S.; Zhang, M.; Hughes, C.E.; Zhu, X.; Dong, L.; Ren, Z.; Chen, F. Factors controlling stable isotope composition of precipitation in arid conditions: An observation network in the Tianshan Mountains, central Asia. Tellus B 2016, 68, 26206. [Google Scholar] [CrossRef]
- Wang, S.; Zhang, M.; Hughes, C.E.; Crawford, J.; Wang, G.; Chen, F.; Du, M.; Qiu, X.; Zhou, S. Meteoric water lines in arid Central Asia using event-based and monthly data. J. Hydrol. 2018, 562, 435–445. [Google Scholar] [CrossRef]
- Wang, L.; Dong, Y.; Han, D.; Xu, Z. Stable isotopic compositions in precipitation over wet island in Central Asia. J. Hydrol. 2019, 573, 581–591. [Google Scholar] [CrossRef]
- Wang, X.; Li, Z.; Tayier, R.; Wang, R. Characteristics of atmospheric precipitation isotopes and isotopic evidence for the moisture origin in Yushugou River basin, Eastern Tianshan Mountains, China. Quat. Int. 2015, 380–381, 106–115. [Google Scholar] [CrossRef]
- Zhang, M.; Wang, S. Precipitation isotopes in the Tianshan Mountains as a key to water cycle in arid central Asia. Sci. Cold Arid. Reg. 2018, 10, 27–37. [Google Scholar] [CrossRef]
- Wang, S.; Zhang, M.; Che, Y.; Zhu, X.; Liu, X. Influence of below-cloud evaporation on deuterium excess in precipitation of arid central Asia and its meteorological controls. J. Hydrometeorol. 2016, 17, 1973–1984. [Google Scholar] [CrossRef]
- Wang, S.; Zhang, M.; Che, Y.; Chen, F.; Qiang, F. Contribution of recycled moisture to precipitation in oases of arid central Asia: A stable isotope approach. Water Resour. Res. 2016, 52, 3246–3257. [Google Scholar] [CrossRef]
- Kong, Y.; Pang, Z. A positive altitude gradient of isotopes in the precipitation over the Tianshan Mountains: Effects of moisture recycling and sub-cloud evaporation. J. Hydrol. 2016, 542, 222–230. [Google Scholar] [CrossRef]
- Yao, T.; Masson-Delmotte, V.; Gao, J.; Yu, W.; Yang, X.; Risi, C.; Sturm, C.; Werner, M.; Zhao, H.; He, Y.; et al. A review of climatic controls on δ18O in precipitation over the Tibetan Plateau: Observations and simulations. Rev. Geophys. 2013, 51, 525–548. [Google Scholar] [CrossRef]
- Liu, X.; Rao, Z.; Zhang, X.; Huang, W.; Chen, J.; Chen, F. Variations in the oxygen isotopic composition of precipitation in the Tianshan Mountains region and their significance for the Westerly circulation. J. Geogr. Sci. 2015, 25, 801–816. [Google Scholar] [CrossRef]
- Wang, S.; Zhang, M.; Crawford, J.; Hughes, C.E.; Du, M.; Liu, X. The effect of moisture source and synoptic conditions on precipitation isotopes in arid central Asia. J. Geophys. Res. Atmos. 2017, 122, 2667–2682. [Google Scholar] [CrossRef]
- Yang, S.; Zhang, M.; Wang, S. Affecting mechanism of moisture sources of isotopes in precipitation in the Tianshan Mountains based on GCMs and ice core. Arid. Zone Res. 2018, 35, 425–435. [Google Scholar] [CrossRef]
- Sodemann, H.; Schwierz, C.; Wernli, H. Interannual variability of Greenland winter precipitation sources: Lagrangian moisture diagnostic and North Atlantic Oscillation influence. J. Geophys. Res. 2008, 113, D03107. [Google Scholar] [CrossRef]
- Sodemann, H.; Masson-Delmotte, V.; Schwierz, C.; Vinther, B.M.; Wernli, H. Interannual variability of Greenland winter precipitation sources: 2. Effects of North Atlantic Oscillation variability on stable isotopes in precipitation. J. Geophys. Res. 2008, 113, D12111. [Google Scholar] [CrossRef]
- Crawford, J.; Hughes, C.E.; Parkes, S.D. Is the isotopic composition of event based precipitation driven by moisture source or synoptic scale weather in the Sydney Basin, Australia? J. Hydrol. 2013, 507, 213–226. [Google Scholar] [CrossRef]
- Krklec, K.; Domínguez-Villar, D.; Lojen, S. The impact of moisture sources on the oxygen isotope composition of precipitation at a continental site in central Europe. J. Hydrol. 2018, 561, 810–821. [Google Scholar] [CrossRef]
- Draxler, R.R.; Hess, G.D. An overview of HYSPLIT_4 modelling system for trajectories, dispersion and deposition. Aust. Meteorol. Mag. 1998, 47, 295–308. [Google Scholar]
- Kleist, D.T.; Parrish, D.F.; Derber, J.C.; Treadon, R.; Wu, W.-S.; Lord, S. Introduction of the GSI into the NCEP Global Data Assimilation System. Weather Forecast. 2009, 24, 1691–1705. [Google Scholar] [CrossRef]
- Soares, P.M.M.; Miranda, P.M.A.; Siebesma, A.P.; Teixeira, J. An eddy-diffusivity/mass-flux parametrization for dry and shallow cumulus convection. Q. J. R. Meteorol. Soc. 2004, 130, 3365–3383. [Google Scholar] [CrossRef]
- Betts, A.K. Coupling of water vapor convergence, clouds, precipitation, and land-surface processes. J. Geophys. Res. 2007, 112, D10108. [Google Scholar] [CrossRef]
- Von Herrmann, C.F. Problems in meteorology. Mon. Weather Rev. 1906, 34, 574–579. [Google Scholar] [CrossRef]
- Gale, J. Availability of carbon dioxide for photosynthesis at high altitudes: Theoretical considerations. Ecology 1972, 53, 494–497. [Google Scholar] [CrossRef]
- Barnes, S.L. An empirical shortcut to the calculation of temperature and pressure at the lifted condensation level. J. Appl. Meteorol. 1968, 7, 511. [Google Scholar] [CrossRef]
- Dai, X.; Li, W.; Ma, Z.; Wang, P. Water-vapor source shift of Xinjiang region during the recent twenty years. Prog. Nat. Sci. 2007, 17, 569–575. [Google Scholar] [CrossRef]
- Feng, F.; Li, Z.; Zhang, M.; Jin, S.; Dong, Z. Deuterium and oxygen 18 in precipitation and atmospheric moisture in the upper Urumqi River Basin, eastern Tianshan Mountains. Environ. Earth Sci. 2013, 68, 1199–1209. [Google Scholar] [CrossRef]
- Liu, J.; Song, X.; Sun, X.; Yuan, G.; Liu, X.; Wang, S. Isotopic composition of precipitation over Arid Northwestern China and its implications for the water vapor origin. J. Geogr. Sci. 2009, 19, 164–174. [Google Scholar] [CrossRef]
- Hu, R. Physical Geography of the Tianshan Mountains in China; China Environmental Science Press: Beijing, China, 2004. [Google Scholar]
Figure 1.
Spatial distribution of the sampling sites around the Tianshan Mountains. Northern slope: N1-Yining, N2-Jinghe, N3-Kuytun, N4-Shihezi, N5-Caijiahu, N6-Urumqi, and N7-Qitai; Mountains: M1-Wuqia, M2-Akqi, M3-Bayanbulak, M4-Balguntay, M5-Barkol, and M6-Yiwu; Southern slope: S1-Aksu, S2-Baicheng, S3-Kuqa, S4-Luntai, S5-Korla, S6-Kumux, S7-Dabancheng, S8-Turpan, S9-Shisanjianfang, and S10-Hami.

Figure 2.
Spatial distribution of the 10 day backward trajectories for the sampling sites around the Tianshan Mountains during precipitation days.
Figure 2.
Spatial distribution of the 10 day backward trajectories for the sampling sites around the Tianshan Mountains during precipitation days.

Figure 3.
Spatial distribution of the specific humidity-adjusted backward trajectories for the sampling sites around the Tianshan Mountains during precipitation days.
Figure 3.
Spatial distribution of the specific humidity-adjusted backward trajectories for the sampling sites around the Tianshan Mountains during precipitation days.

Figure 4.
Directions of moisture source further than 300 km around the Tianshan Mountains all year round (a), during summer months (b) and winter months (c).
Figure 4.
Directions of moisture source further than 300 km around the Tianshan Mountains all year round (a), during summer months (b) and winter months (c).

Figure 5.
Transport time in days (a and c) and distances (b and d) of the backward trajectories between moisture source and sampling site around the Tianshan Mountains. The bottom of the box indicates the 25th percentile, a line within marks the median, and the top of box indicates the 75th percentile; whiskers indicate the 90th/10th percentiles; the points above and below show 95th/5th percentiles.

Figure 6.
Relationship between transport time, in days (a–c) and distance (d–f), of the backward trajectory and δ18O in precipitation around the Tianshan Mountains.
Figure 6.
Relationship between transport time, in days (a–c) and distance (d–f), of the backward trajectory and δ18O in precipitation around the Tianshan Mountains.

Figure 7.
Isotopic composition in precipitation (a), transport time in days (b) and distance (c) from moisture source to sampling sites around the Tianshan Mountains, during summer months.
Figure 7.
Isotopic composition in precipitation (a), transport time in days (b) and distance (c) from moisture source to sampling sites around the Tianshan Mountains, during summer months.

Figure 8.
Air temperature (T) and relative humidity (RH) at moisture sources (a and b) and sampling sites (c and d) around the Tianshan Mountains, during summer months.
Figure 8.
Air temperature (T) and relative humidity (RH) at moisture sources (a and b) and sampling sites (c and d) around the Tianshan Mountains, during summer months.

© 2019 by the authors. Licensee MDPI, Basel, Switzerland. This article is an open access article distributed under the terms and conditions of the Creative Commons Attribution (CC BY) license (http://creativecommons.org/licenses/by/4.0/).
Share and Cite
MDPI and ACS Style
Wang, S.; Du, M.; Zhang, M.; Shi, M.; Jiao, R.; Wang, L. Precipitation Isotopes Associated with the Duration and Distance of Moisture Trajectory in a Westerly-Dominant Setting. Water 2019, 11, 2434. https://doi.org/10.3390/w11122434
AMA Style
Wang S, Du M, Zhang M, Shi M, Jiao R, Wang L. Precipitation Isotopes Associated with the Duration and Distance of Moisture Trajectory in a Westerly-Dominant Setting. Water. 2019; 11(12):2434. https://doi.org/10.3390/w11122434
Chicago/Turabian StyleWang, Shengjie, Mingxia Du, Mingjun Zhang, Mengyu Shi, Rong Jiao, and Liwei Wang. 2019. "Precipitation Isotopes Associated with the Duration and Distance of Moisture Trajectory in a Westerly-Dominant Setting" Water 11, no. 12: 2434. https://doi.org/10.3390/w11122434
Note that from the first issue of 2016, this journal uses article numbers instead of page numbers. See further details here.