Evaluating the Spatiotemporal Characteristics of Agricultural Drought in Bangladesh Using Effective Drought Index


1
Department of Agricultural Engineering, Institute of Agriculture and Life Science, Gyeongsang National University, 501 Jinju-daero, Jinju 52828, Gyeongnam, Korea
2
Senior Scientific Officer, Bangladesh Rice Research Institute, Gazipur 1701, Bangladesh
3
Director, Integrated Watershed Management Institute, Suwon 16489, Korea
4
Department of Environmental Engineering, Seoul National University of Science and Technology, Seoul 01811, Korea
*
Author to whom correspondence should be addressed.
Water 2019, 11(12), 2437; https://doi.org/10.3390/w11122437
Submission received: 23 September 2019
/
Revised: 14 November 2019
/
Accepted: 18 November 2019
/
Published: 21 November 2019
(This article belongs to the Section Hydrology)
Abstract
:This study aims to assess the spatiotemporal characteristics of agricultural droughts in Bangladesh during 1981–2015 using the Effective Drought Index (EDI). Monthly precipitation data for 36 years (1980–2015) obtained from 27 metrological stations, were used in this study. The EDI performance was evaluated for four sub-regions over the country through comparisons with historical drought records identified by regional analysis. Analysis at a regional level showed that EDI could reasonably detect the drought years/events during the study period. The study also presented that the overall drought severity had increased during the past 35 years. The characteristics (severity and duration) of drought were also analyzed in terms of the spatiotemporal evolution of the frequency of drought events. It was found that the western and central regions of the country are comparatively more vulnerable to drought. Moreover, the southwestern region is more prone to extreme drought, whereas the central region is more prone to severe droughts. Besides, the central region was more prone to extra-long-term droughts, while the coastal areas in the southwestern as well as in the central and north-western regions were more prone to long-term droughts. The frequency of droughts in all categories significantly increased during the last quinquennial period (2011 to 2015). The seasonal analysis showed that the north-western areas were prone to extreme droughts during the Kharif (wet) and Rabi (dry) seasons. The central and northern regions were affected by recurring severe droughts in all cropping seasons. Further, the most significant increasing trend of the drought-affected area was observed within the central region, especially during the pre-monsoon (March–May) season. The results of this study can aid policymakers in the development of drought mitigation strategies in the future.
1. Introduction
Drought is the most complex of chronic natural calamities that is characterized by the lack of precipitation over an extended period of below-normal precipitation and can cause substantial economic loss as well as human suffering [1]. According to Wilhite and Glantz [2], droughts are classified as meteorological, agricultural, hydrological, and socio-economical droughts. Meteorological drought occurs when the rainfall deficit for a stated period (day, month, season, or year) exceeds a certain threshold, usually defined as a proportion of the long-term average (minimum 30 years). Meteorological drought is typically an expression of precipitation’s departure from normal over a specific period. The hydrological drought refers to deficiencies in surface and subsurface water supplies based on measurements of streamflow and lake, reservoir and groundwater levels, while the agricultural drought occurs when there is not enough soil moisture to meet the needs of a particular crop in a specific time by the deficiency of precipitation for an extended period. Agriculture is generally the first economic sector to be affected by drought. It happens after a meteorological drought but before the hydrological drought. Agricultural drought consequences from the impact of meteorological or hydrological droughts on crop yields [3]. Socioeconomic drought occurs when physical water shortage starts to affect people, individually and collectively. At present, drought is regarded as one of the most frequent natural disasters in Bangladesh [4], given its adverse impact on agricultural production and the environment. Moreover, the frequency and intensity of droughts have been continuously increasing in recent years, which have had a significant effect on agricultural production [5].
In Bangladesh, most of the droughts primarily occur in pre-monsoon (March–May) and post-monsoon (October–November) period [6]; however, in some extreme cases, the pre-monsoon droughts can persist into the monsoon season due to delay in the onset of monsoon rains. Moreover, the vulnerability to drought varies by region. Some studies have projected that, in the near future, precipitation would increase in most of the areas of Bangladesh but decrease in the southwestern region [7]. Spatiotemporal characteristics of historical droughts can provide relevant data for predicting future droughts [8]. Therefore, the spatiotemporal characteristics of agricultural droughts over Bangladesh must be monitored to anticipate their negative impacts and mitigate potential losses and damages. Moreover, accurate assessment and mapping of droughts can play a vital role in understanding the characteristics of regional drought for using in drought monitoring, and an early warning might help planning the efficient use of water resources and agricultural production.
Drought indices are used to characterize droughts in terms of severity, duration, and areal extent [9]. Over the years, several drought indices (DIs) have been proposed and developed to identify the spatiotemporal pattern of droughts and quantify their intensity. Most of the drought indices have been developed for a specific region and are limited in terms of their applications to different climatic conditions, given the inherent complexity of drought phenomena. However, a universal drought index that can be generalized across all regions has not been developed [10].
Several studies have been conducted on drought assessment in Bangladesh and its impacts [11,12,13,14,15,16,17,18,19]. Most of these studies quantify drought severity by using the standardized precipitation index (SPI) [20], while very few studies have been conducted using the Palmer drought severity index (PDSI) [21] and the Standardized Precipitation Evapotranspiration Index (SPEI) [22]. PDSI and SPI are the most widely used indices in current meteorological drought studies; however, both these indices have limited application. For example, PDSI was initially developed for quantifying drought severity in the Great Plains in the United States of America (USA). Moreover, soil moisture calculation used in PDSI has been known for its inaccuracy and complex procedure [23]. On the other hand, SPI is the most commonly used index. However, SPI has limitations. SPI is calculated based on averaged monthly precipitation for a certain period. The SPI does not take into account the water resources generated by rainfall that may have already been lost due to outflow, as well as the effect of evaporation, resulting in erroneous drought events. The time steps involved in SPI, including 1-, 3-, 6-, 9-, 12-, 24- and 48-month periods, tend to produce several different values for the same period. Moreover, SPI assigns be likely to assign equal weight to temporally various precipitation events, thereby resulting in inaccuracy in predicting drought severity [24]. SPEI, which takes into account both rainfall and potential evapotranspiration (PET), requires a large amount of data for determining drought severity. Additionally, the use of different PET calculation methods produces different SPEI values for the same period. To overcome these limitations, Byun and Wilhite [25] developed Effective Drought Index (EDI). EDI is calculated only using rainfall data as in the case of SPI; however, there are some differences. First, EDI values can be calculated in daily time steps as well as in monthly time steps. Second, EDI utilizes a flexible time period for taking into account total precipitation. For example, EDI is calculated considering the summation period is 365 days or 12 months precipitation primarily. If the drought continues beyond 365 days or 12 months, the summation period is extended to include the additional days or months; however, SPI considers only a fixed period. Third, the precipitation is summed using the time-reduction function. Hence, when compared to other drought indices, EDI was found to be more responsive to drought conditions and could capture the real essence of drought situations in the study area. Several studies have examined the suitability of EDI indices. They have suggested that EDI quantifies droughts more precisely than other DIs [26,27,28,29,30]. In particular, Kamruzzaman et al. [30] empirically demonstrated the superiority of EDI over SPI when monitoring both long-term and short-term droughts in Bangladesh.
Although several studies have attempted to investigate droughts in Bangladesh, most of them utilized weather information from a few stations without considering nationwide weather data. [15,16,18,19,31]. Only a handful of studies have utilized nationwide weather data by using mainly SPI indices [4,12,14,17,32]. A literature review suggests that droughts in Bangladesh have usually been investigated in terms of the season and year of their occurrence. Most of the studies have characterized the drought events in terms of severity and frequency; however, very few studies have considered the areal extent of drought [19,33]. For example, Alamgir et al. [4] investigated meteorological drought for different cropping seasons of Bangladesh using SPI indices; the study revealed the variation in the spatial characteristics of droughts corresponding to different seasons. In Reference [14], researches assessed drought years in terms of severity of meteorological drought using both 3- and 6-month time scales of SPI during the period between 1971 and 2010. In Reference [17], estimated the metrological drought event over Bangladesh that occurred between 1961 and 1990 using SPI and PDSI; the drought was compared with the historical drought record. The study showed that that regional analysis could detect 80% of the past drought events. Mondal et al. [12] modeled the spatial and temporal variations of meteorological drought year and severity in different areas of Bangladesh using SPIs between 1981 and 2010. As drought duration is one of the main characteristics of drought; however, no previous study has been done yet to characterize the drought events considering drought duration over Bangladesh. Therefore, there is a need for a comprehensive study on the spatiotemporal characteristics concerning frequency, severity, duration, and the areal extent of drought events to better understand the conditions of drought in different regions of Bangladesh.
To that end, this study attempts to explore the suitability of EDI for evaluating the spatiotemporal characteristics of agricultural drought across different regions in Bangladesh. Precipitation data from 27 stations for the period between 1981 and 2015 were used to gain insights into the regional drought characteristics across Bangladesh. Moreover, in this study, frequency, severity, and duration of drought events, as well as their spatiotemporal patterns, are analyzed. Besides, the spatial attributes of seasonal drought and temporal characteristics of the areal extent of drought are presented.
2. Materials and Methods
2.1. Study Area
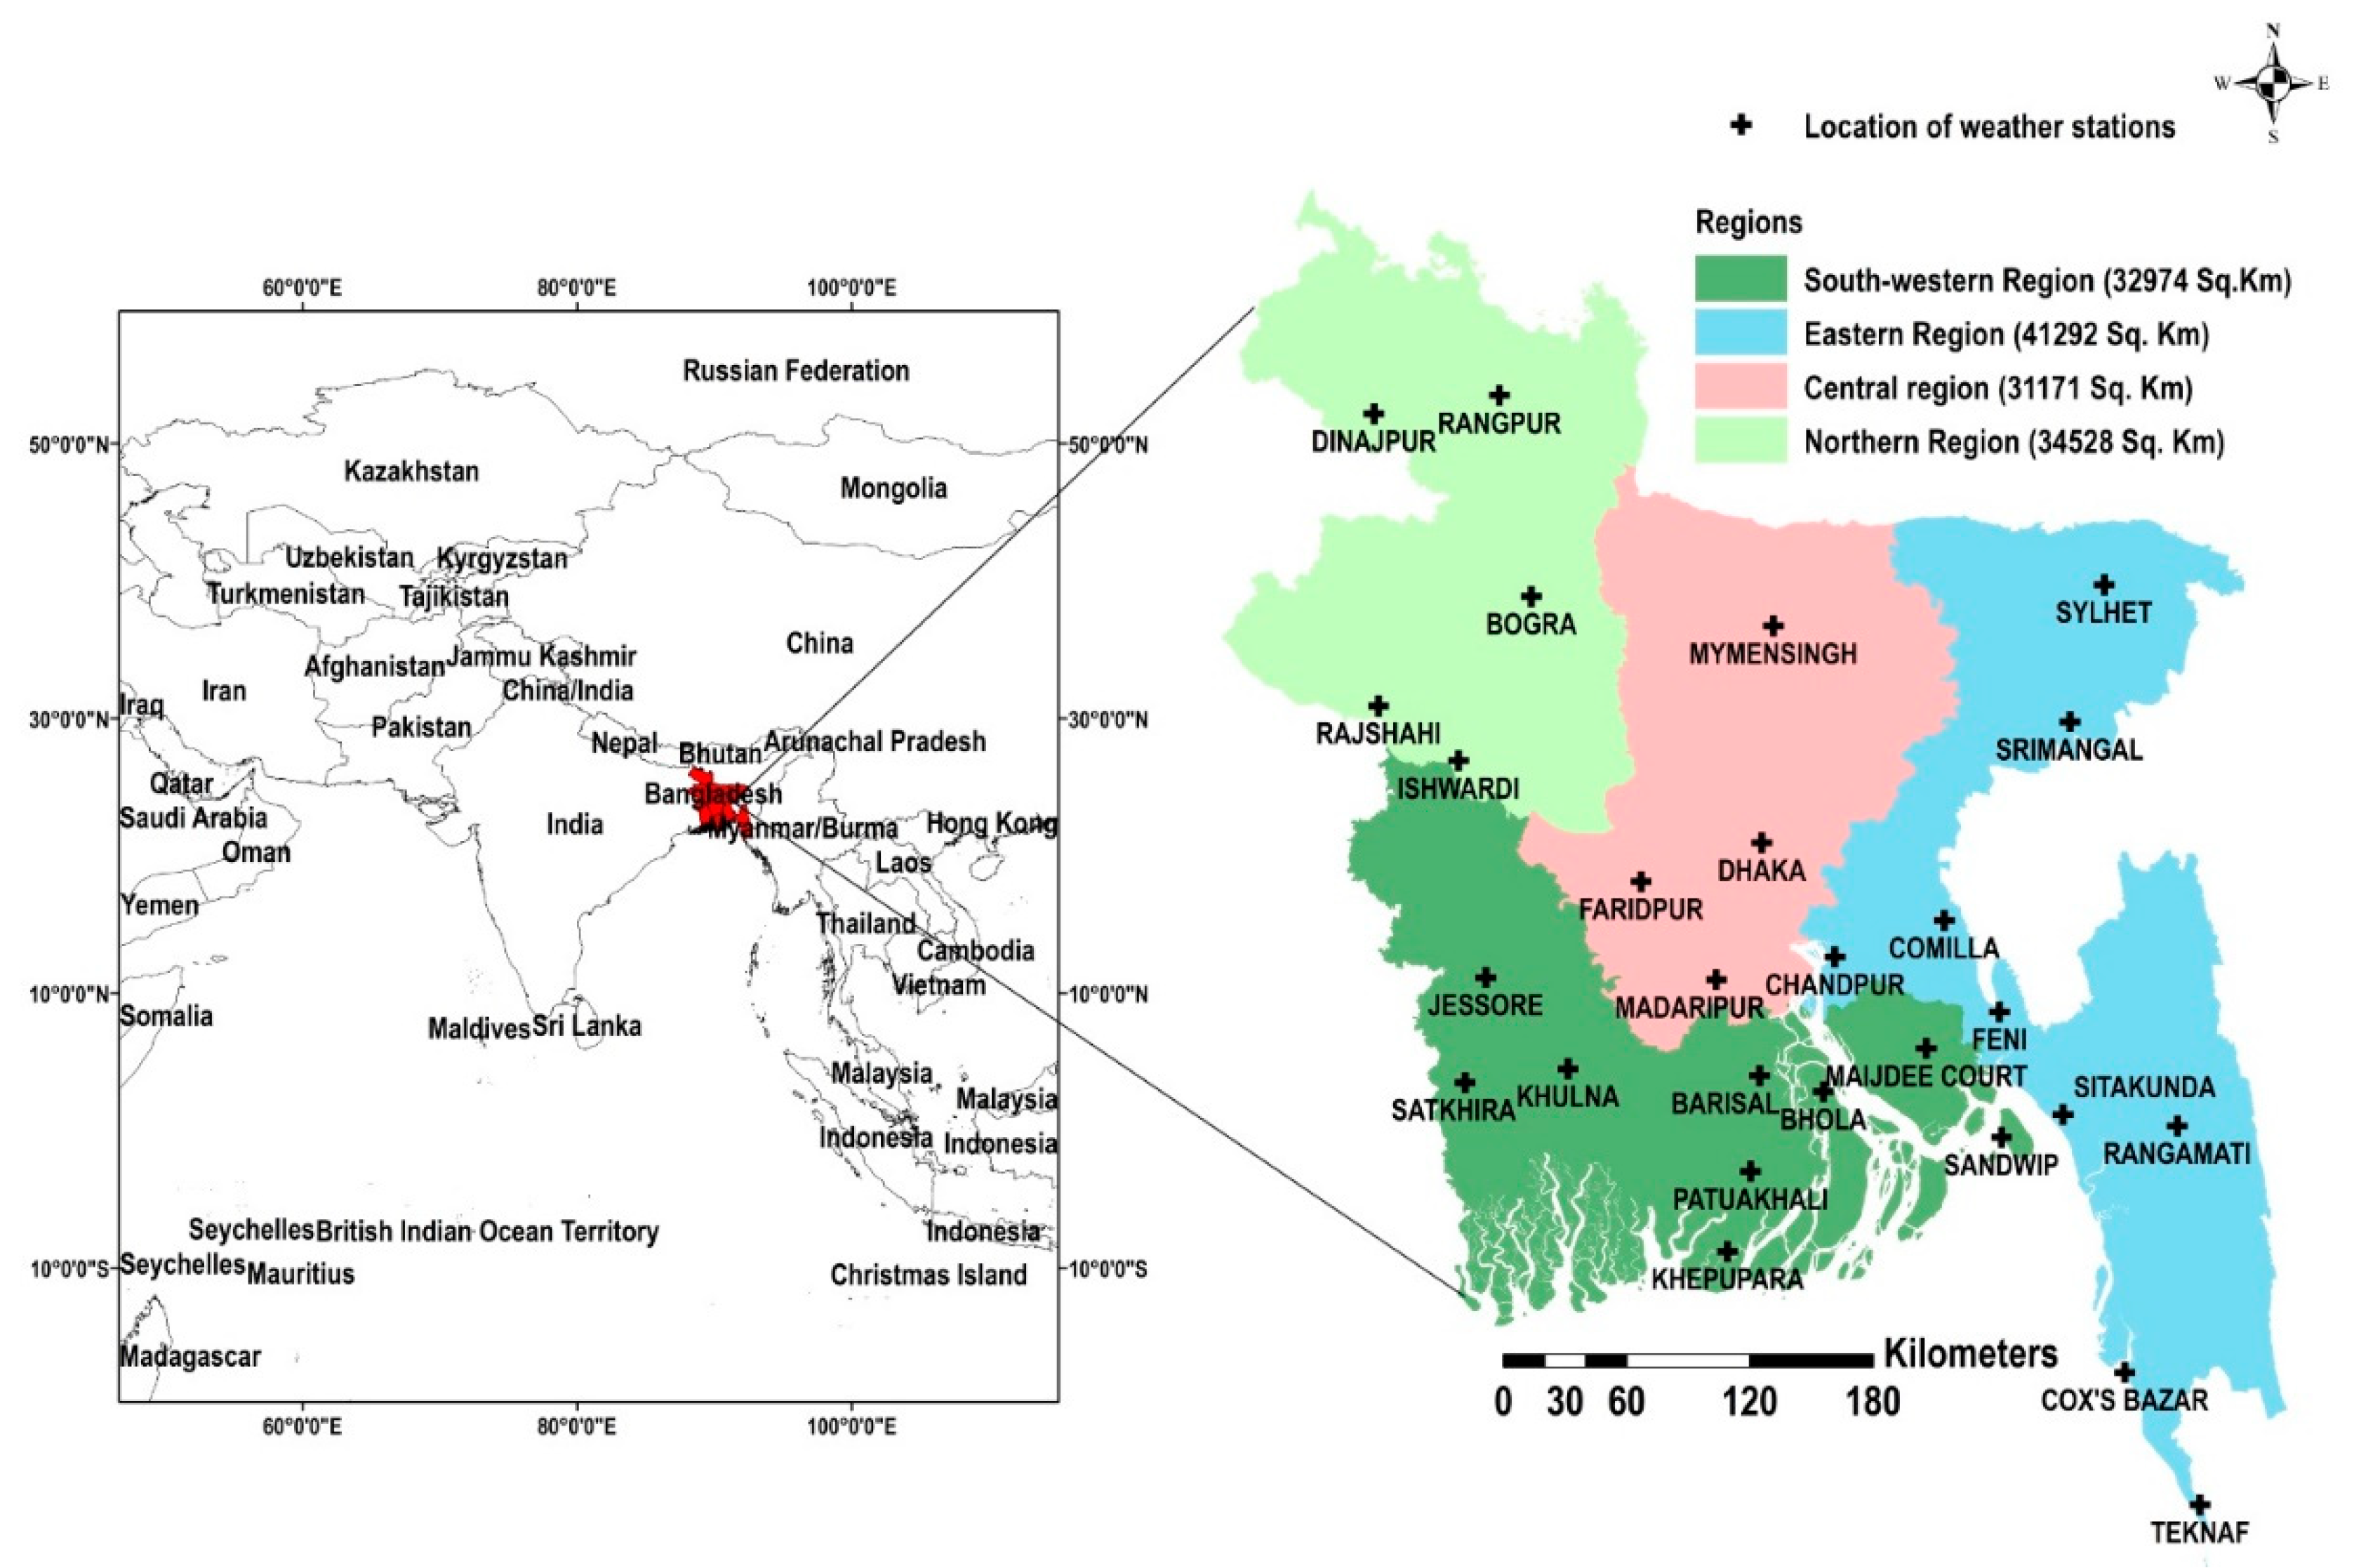
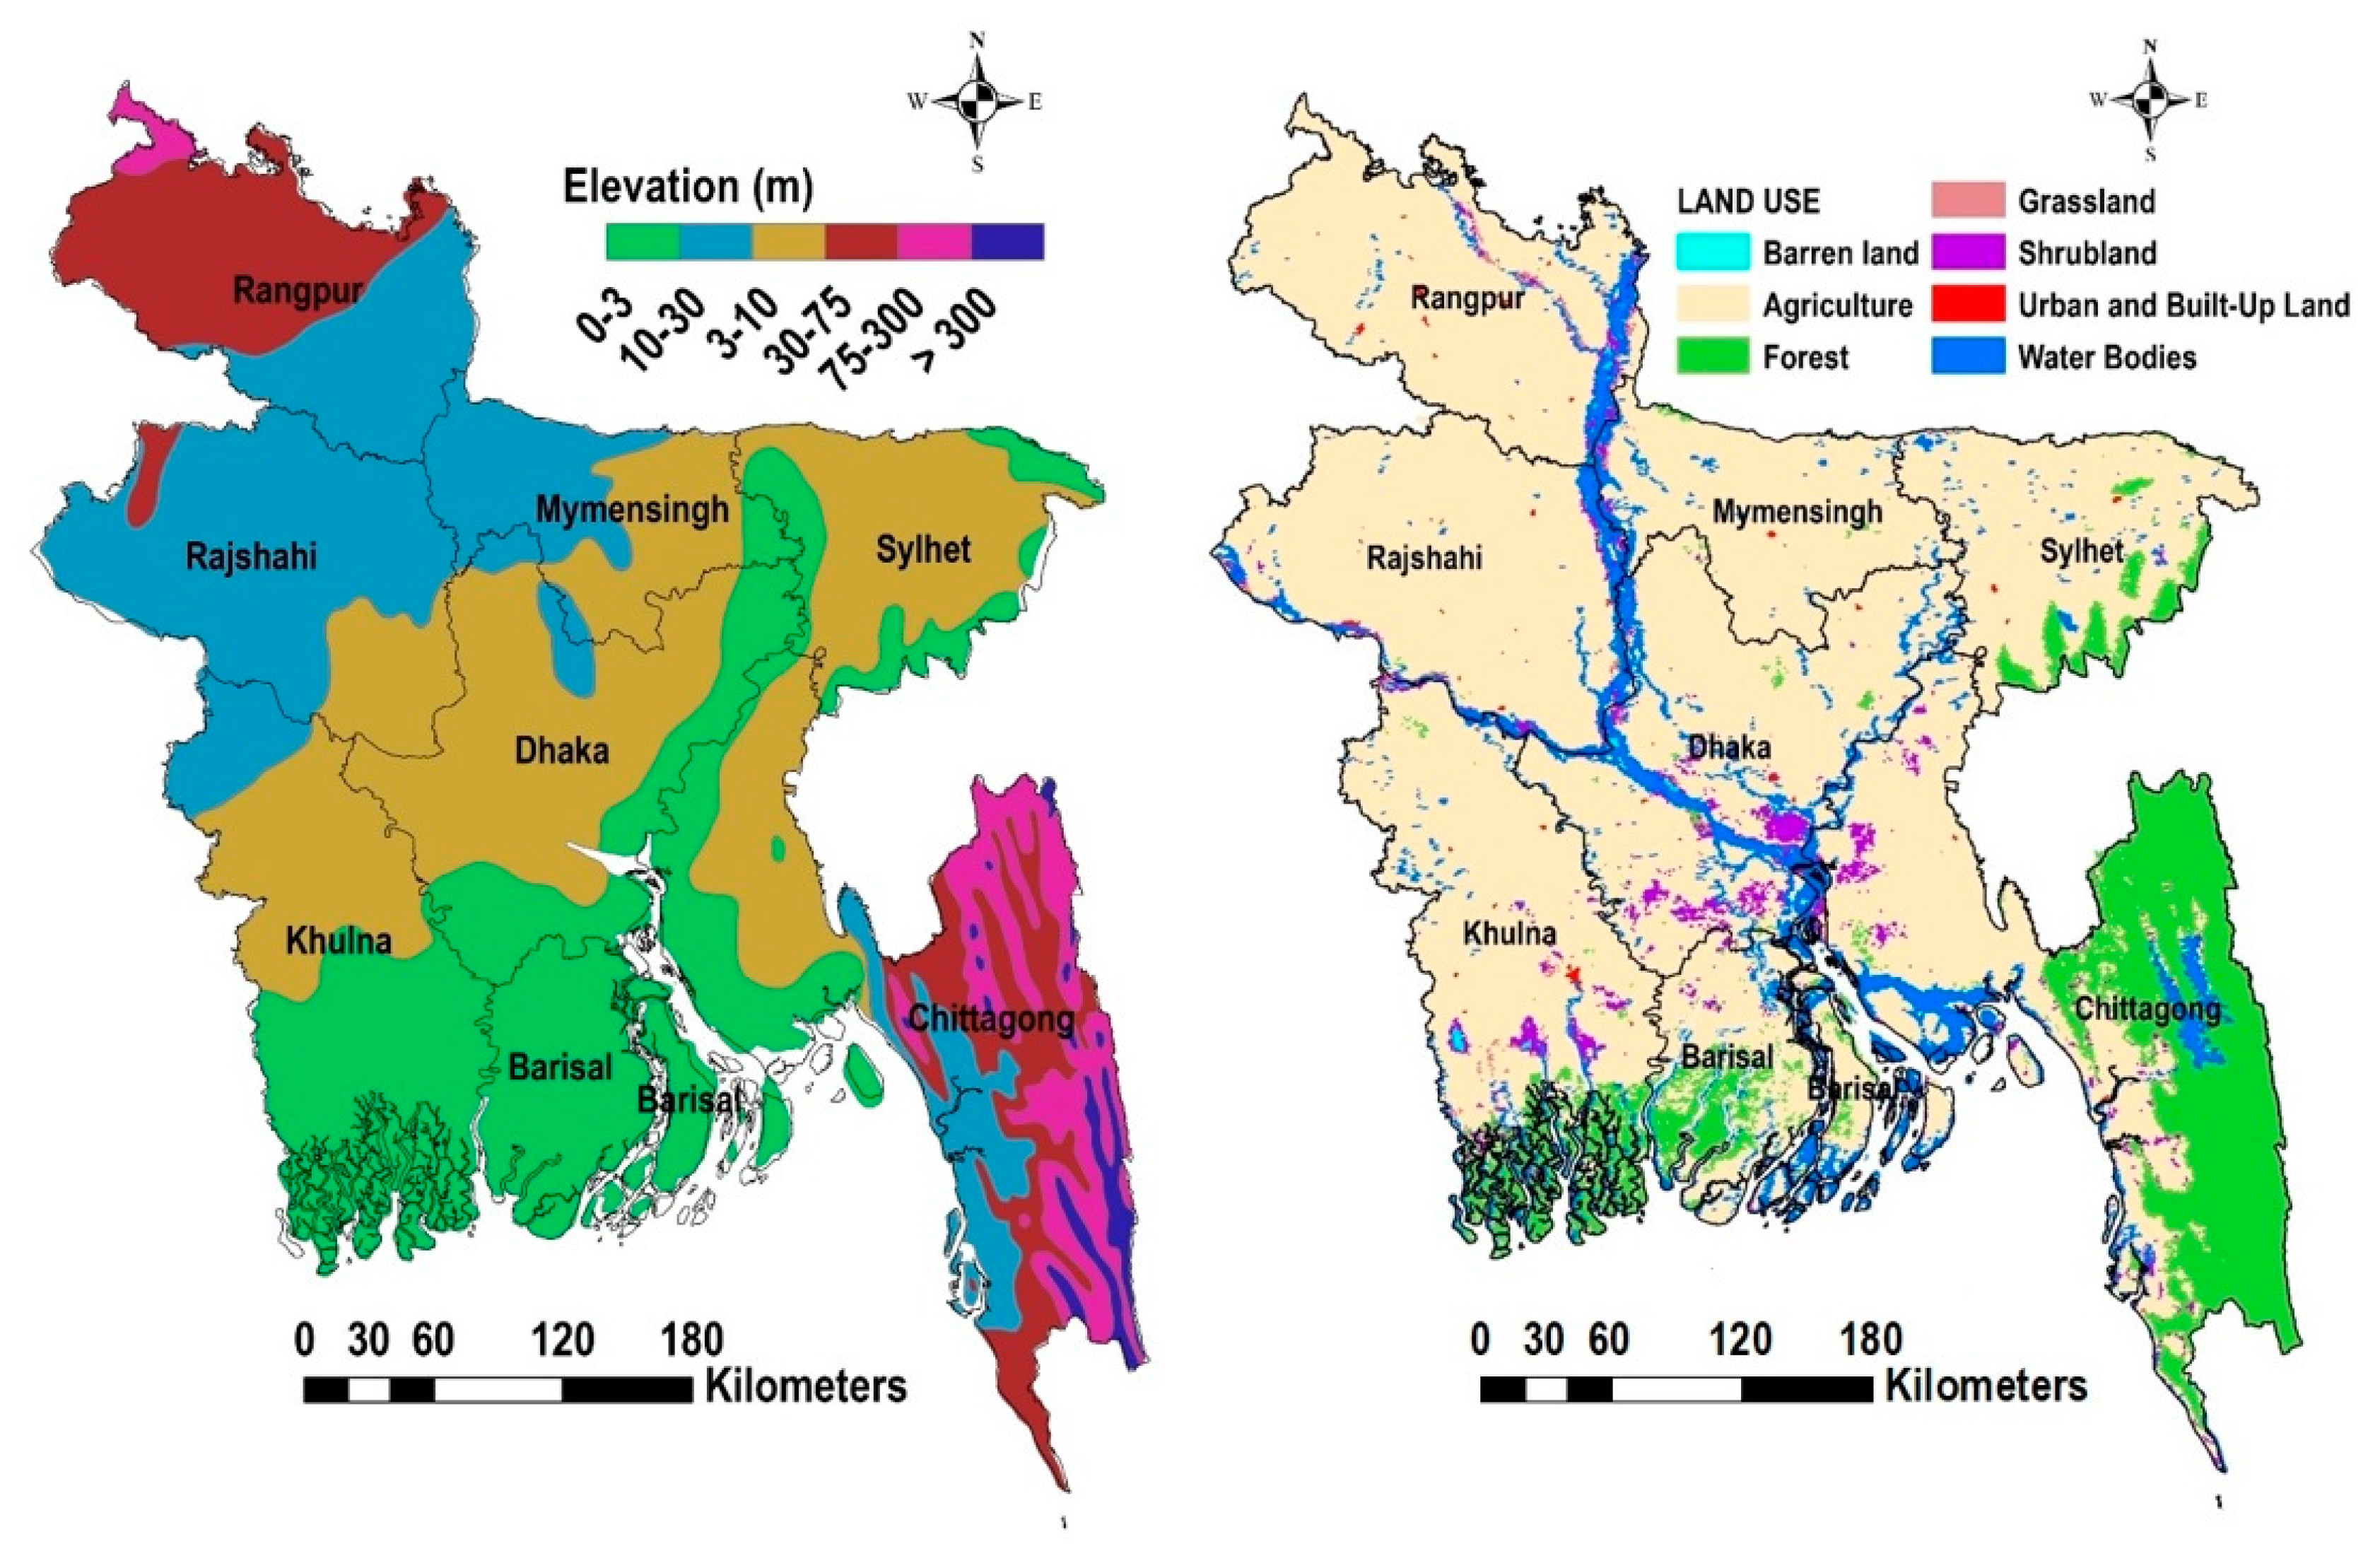
The study area covers Bangladesh, which is situated in the latitudes between 20°34′ and 26°38′ N and longitudes between 88°01′ and 92°41′ E in South Asia. India bounds Bangladesh along the west, north, and northeast borders; it borders Myanmar in the south-east. The Bay of Bengal demarcates the southern border with a long coastline (Figure 1). Although the elevation in the northern part of the country can go up to 105 m above sea level, most of the area in Bangladesh is less than 10 m above sea level. The predominance of agriculture land is evident, given that 3/4th of the total geographical area is under cultivation, followed by forest cover, including orchards, as shown in Figure 2.
Bangladesh is among the most vulnerable countries to the increasing effects of global climate change. It regularly experiences natural disasters such as floods, drought, tornadoes, and tidal bores [34]. In the recent past, Bangladesh has experienced drought at regular intervals; on average, Bangladesh experiences drought at least once in 2.5 years [12]. Although drought is a periodic occurrence in many parts of the country, the northwest region of Bangladesh is the most susceptible to drought because of the high variability in rainfall [19]. This area is also comparatively dry and is characterized by sandy soils, receiving much lower rainfall than the national average [35]. Moreover, the sandy soils have lower moisture retention capacity and a high infiltration rate [36]. In addition, the Farakka barrage constructed in the upstream of the Ganges River has also had a significant impact on the regional microclimate, aggravating the drought scenario.
Bangladesh meteorological department (BMD) stations have been separated into four sub-regions to analyze drought conditions over the entire country, as shown in Figure 1, considering the topography, land use, and rainfall anomalies. The four regions are termed: (i) northern region (R1; 5 stations), (ii) southwestern region (R2; 9 stations), (iii) central region (R3; 4 stations) and (iv) eastern region (R4; 9 stations).
2.2. Rainfall Data
Bangladesh has a subtropical monsoon climate, characterised by wide seasonal variations in temperatures, rainfall, and humidity. The four recognised seasons are as follows: a hot, humid summer from March to May; a wet, warm, and rainy monsoon season from June to September; autumn from October to November; and dry winter from December to February. Moreover, the cropping season in Bangladesh is categorised into Pre-Kharif (March–June), Kharif (July–October), and Rabi (November–February).
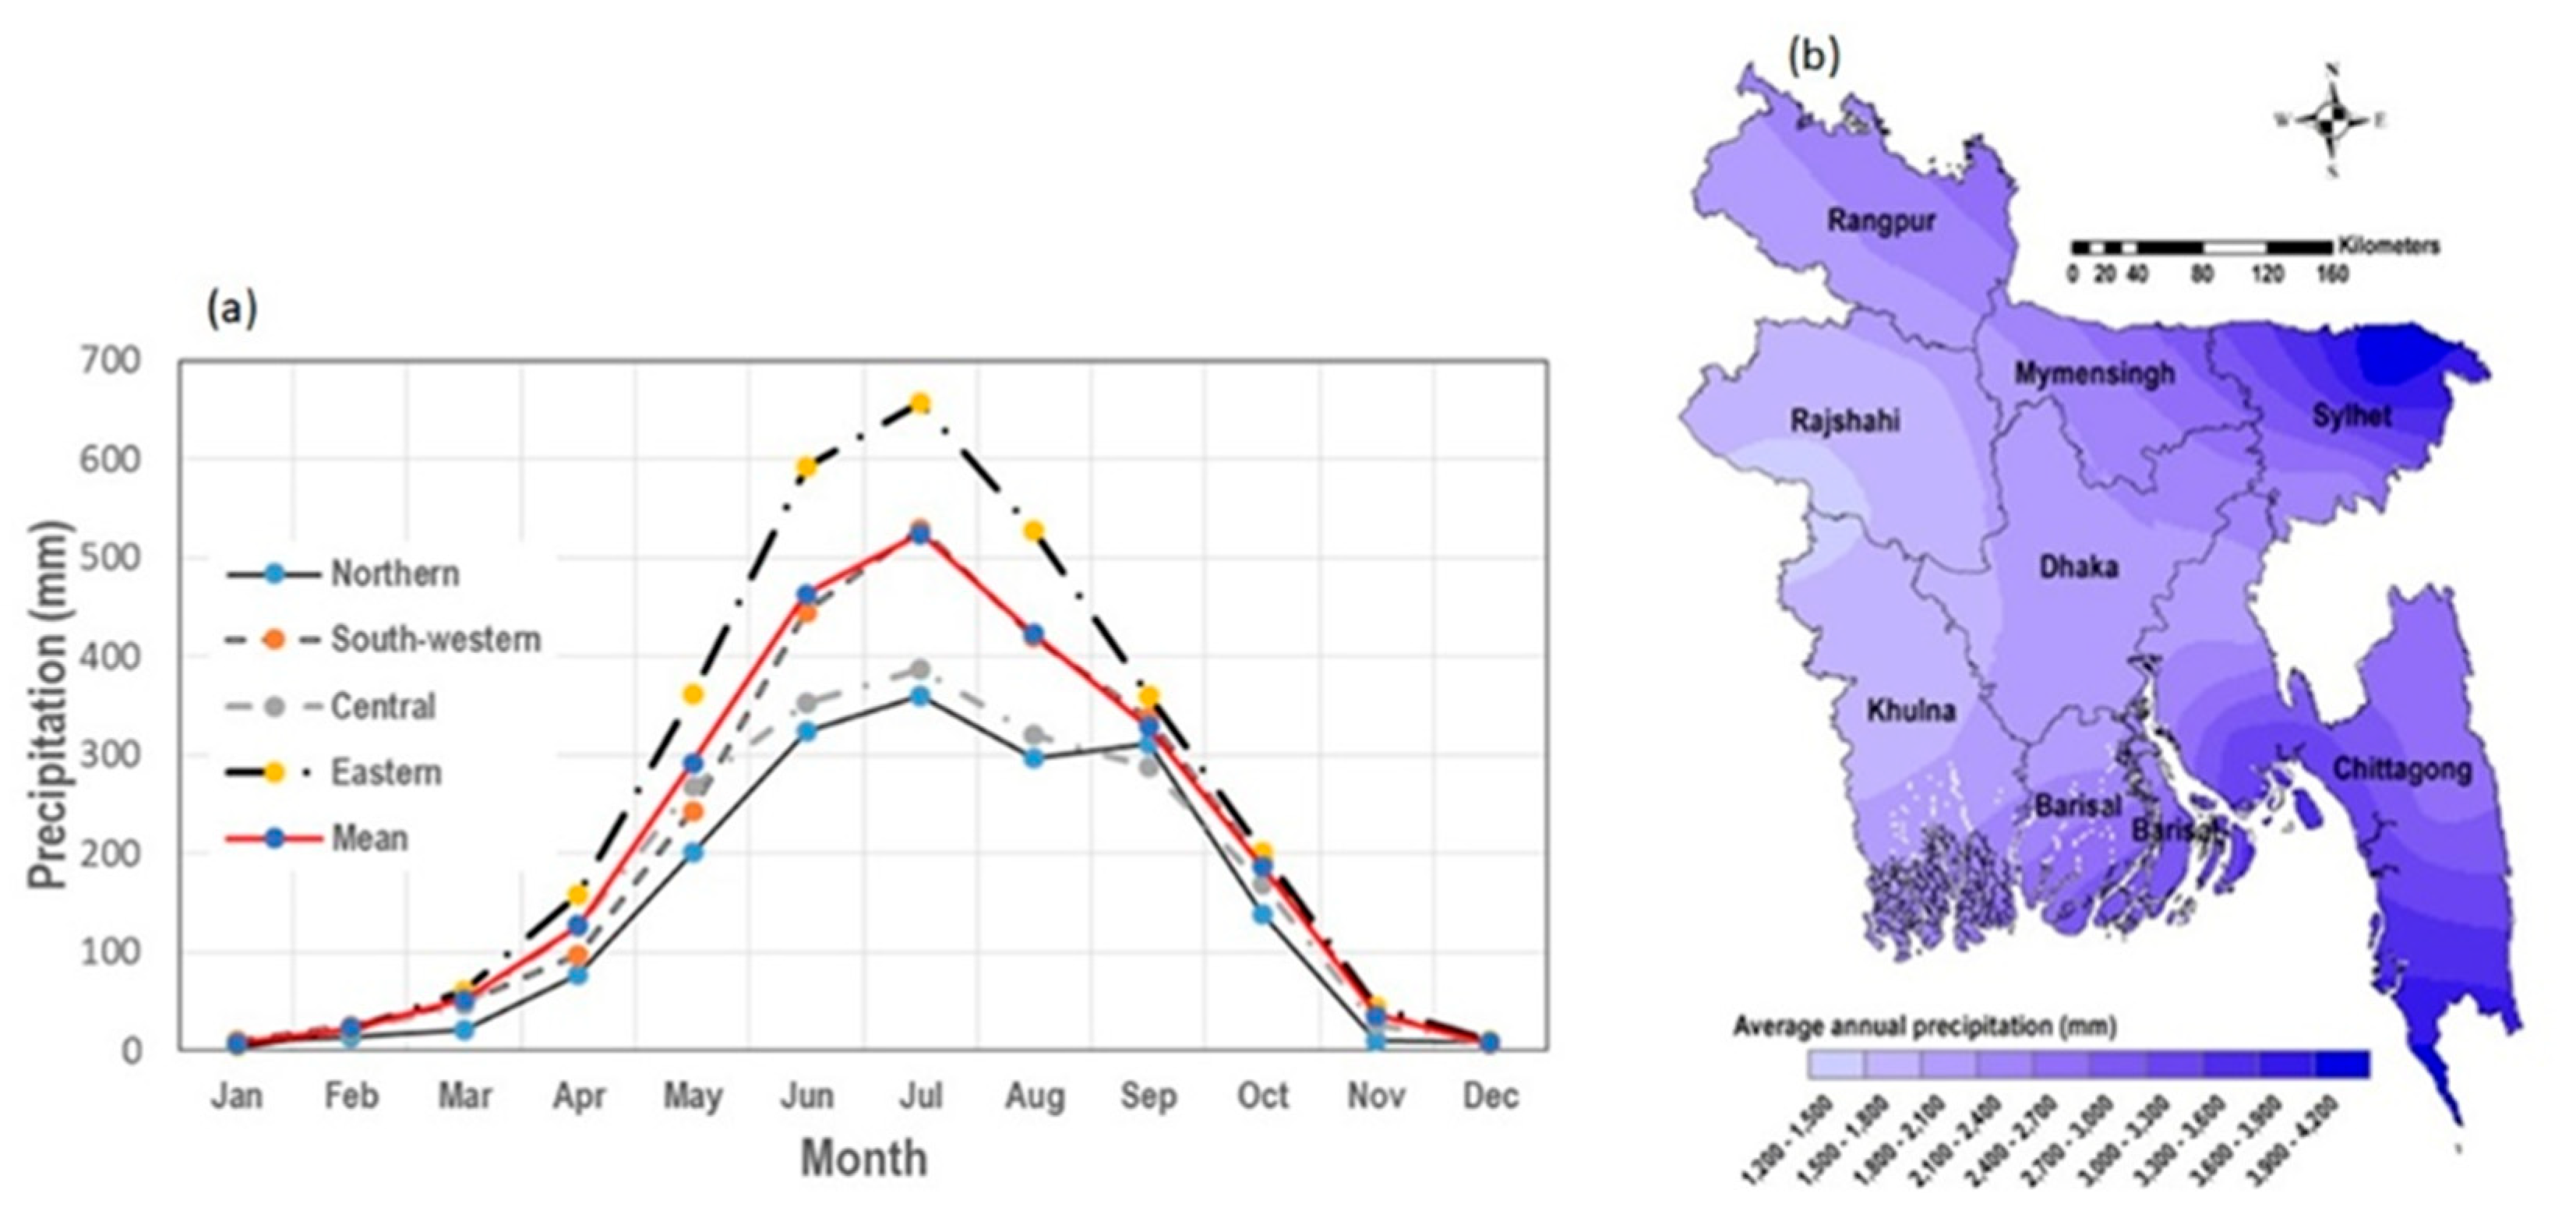
At present, there are 35 weather stations in Bangladesh operated by the BMD. However, continuous rainfall records of more than 30 years are available only at 27 stations. In this study, the time series of monthly rainfall between 1980 and 2015 for the 27 meteorological stations were used to diagnose the droughts. One of the major challenges with observational data is missing data. Roughly <2% of the data was missing, which was replaced by the averaged values of the same month from neighbouring stations. Figure 3a shows the monthly rainfall distribution in four different regions as well as over Bangladesh. The average annual rainfall recorded was 2462.14 mm from 1980 to 2015. Approximately 80% of the annual rainfall is received during the monsoon months (June to October) because of the weak humid depressions that are conveyed from the Bay of Bengal into Bangladesh by the damp monsoon winds [37]. The spatiotemporal variability of rainfall is one of the main features of the climate of Bangladesh. Figure 3b shows the spatial distribution of mean annual rainfall in Bangladesh during the study period. As shown in the figure, precipitation in Bangladesh fluctuated from about 1400 mm in the western region to more than 4000 mm in the eastern part of the country from 1980 to 2015. Moreover, the higher rainfall received in the northeast can be attributed to the additional uplifting effect of the Meghalaya plateau.
2.3. Historical Drought Data
The history of drought in Bangladesh has been poorly documented. However, major historical drought events of Bangladesh within the study period (1981–2015) were obtained from different sources and study reports [6,17,34,38,39]. Most of the drought records were prepared based on the crop damage data due to extreme and severe drought events in different parts of the country, as shown in Table 1. Post-independence, Bangladesh has experienced droughts in 1973, 1978, 1979, 1981, 1982, 1989, 1992, 1994 and 1995. However, the droughts of 1973, 1979 and 1994–1995 were the most severe in recent history, leading to a loss of 3.5 million tons of rice (in terms of agricultural production) in the north-western region alone [6]. Moreover, during the 2006 drought in the north-western part of Bangladesh, the average crop production reduced by 25%–30% [40,41]. According to the Bangladesh Bureau of Statistics (BBS) [39], between 2009 and 2014, natural disasters in the country accounted for damages (agricultural products and infrastructure) to the tune of 0.60 million USD; of these, 5.74% damage and casualties were attributed to droughts, which accounted for 126.33 million USD. In addition to crops, drought also affected orchards, forests, and the environment. Overall, 20 drought-years were recorded during the study period, as shown in Table 1.
2.4. Calculation of Effective Drought Index (EDI)
Effective Drought Index (EDI) was developed by Byun and Wilhite [25] to monitor the duration and severity of droughts using the concept of effective precipitation (EP). They defined effective precipitation as a function of the current month’s rainfall and weighted rainfall over a defined preceding period, computed using a time-dependent reduction function. The EDI calculation process used in this study is as follows:
First, the stored water due to precipitation is accumulated over one year, while also considering the losses due to evaporation. In Equation (1), EP is the monthly cumulative effective precipitation; Pm is the precipitation for m months before the particular month, n is the duration of the preceding period, and i is the duration of aggregate rainfall, initialised at 12 months (overall precipitation duration). Therefore, the actual drought index is calculated for one year from the onset date of precipitation. For instance, if 100 mm of rainfall occurs particularly in 1 month, the weight applied to that month with time will decrease gradually, reaching 0 after 12 months.
Second, the mean effective precipitation (MEP) is calculated for each calendar month. The MEP is calculated for the ith value of each calendar month. Therefore, the MEP of January is the mean of 30 values for January collected throughout 30 y.
Third, the deviation of EP (DEP) is determined from the MEP (Equation (2)). A negative DEP indicates a drier than the average climate. If the DEP is continuously negative, i in Equation (1) is increased by the number of months for which DEP is negative. In other words, the number of dry months is added to 12 months. For example, if the negative DEP continues for two months, i is 14, and Equations (1)–(3) are re-calculated. Finally, the DEP is standardised, where ST (DEP) indicates the standard deviation of each month’s DEP. Using these functions, the EDI helps us consider the standardised deficit or surplus, of the deposited water quantity.
2.5. Definition of Drought Characteristics
The level of dryness is classified according to the EDI classification proposed by Kim et al. [26], as shown in Table 2. In this study, droughts were categorised based on duration, as shown in Table 3.
A negative value implies that the region is drier; conversely, a positive value (>0) indicates that the region is wetter. In this study, each drought event is analysed in terms of drought duration and severity.
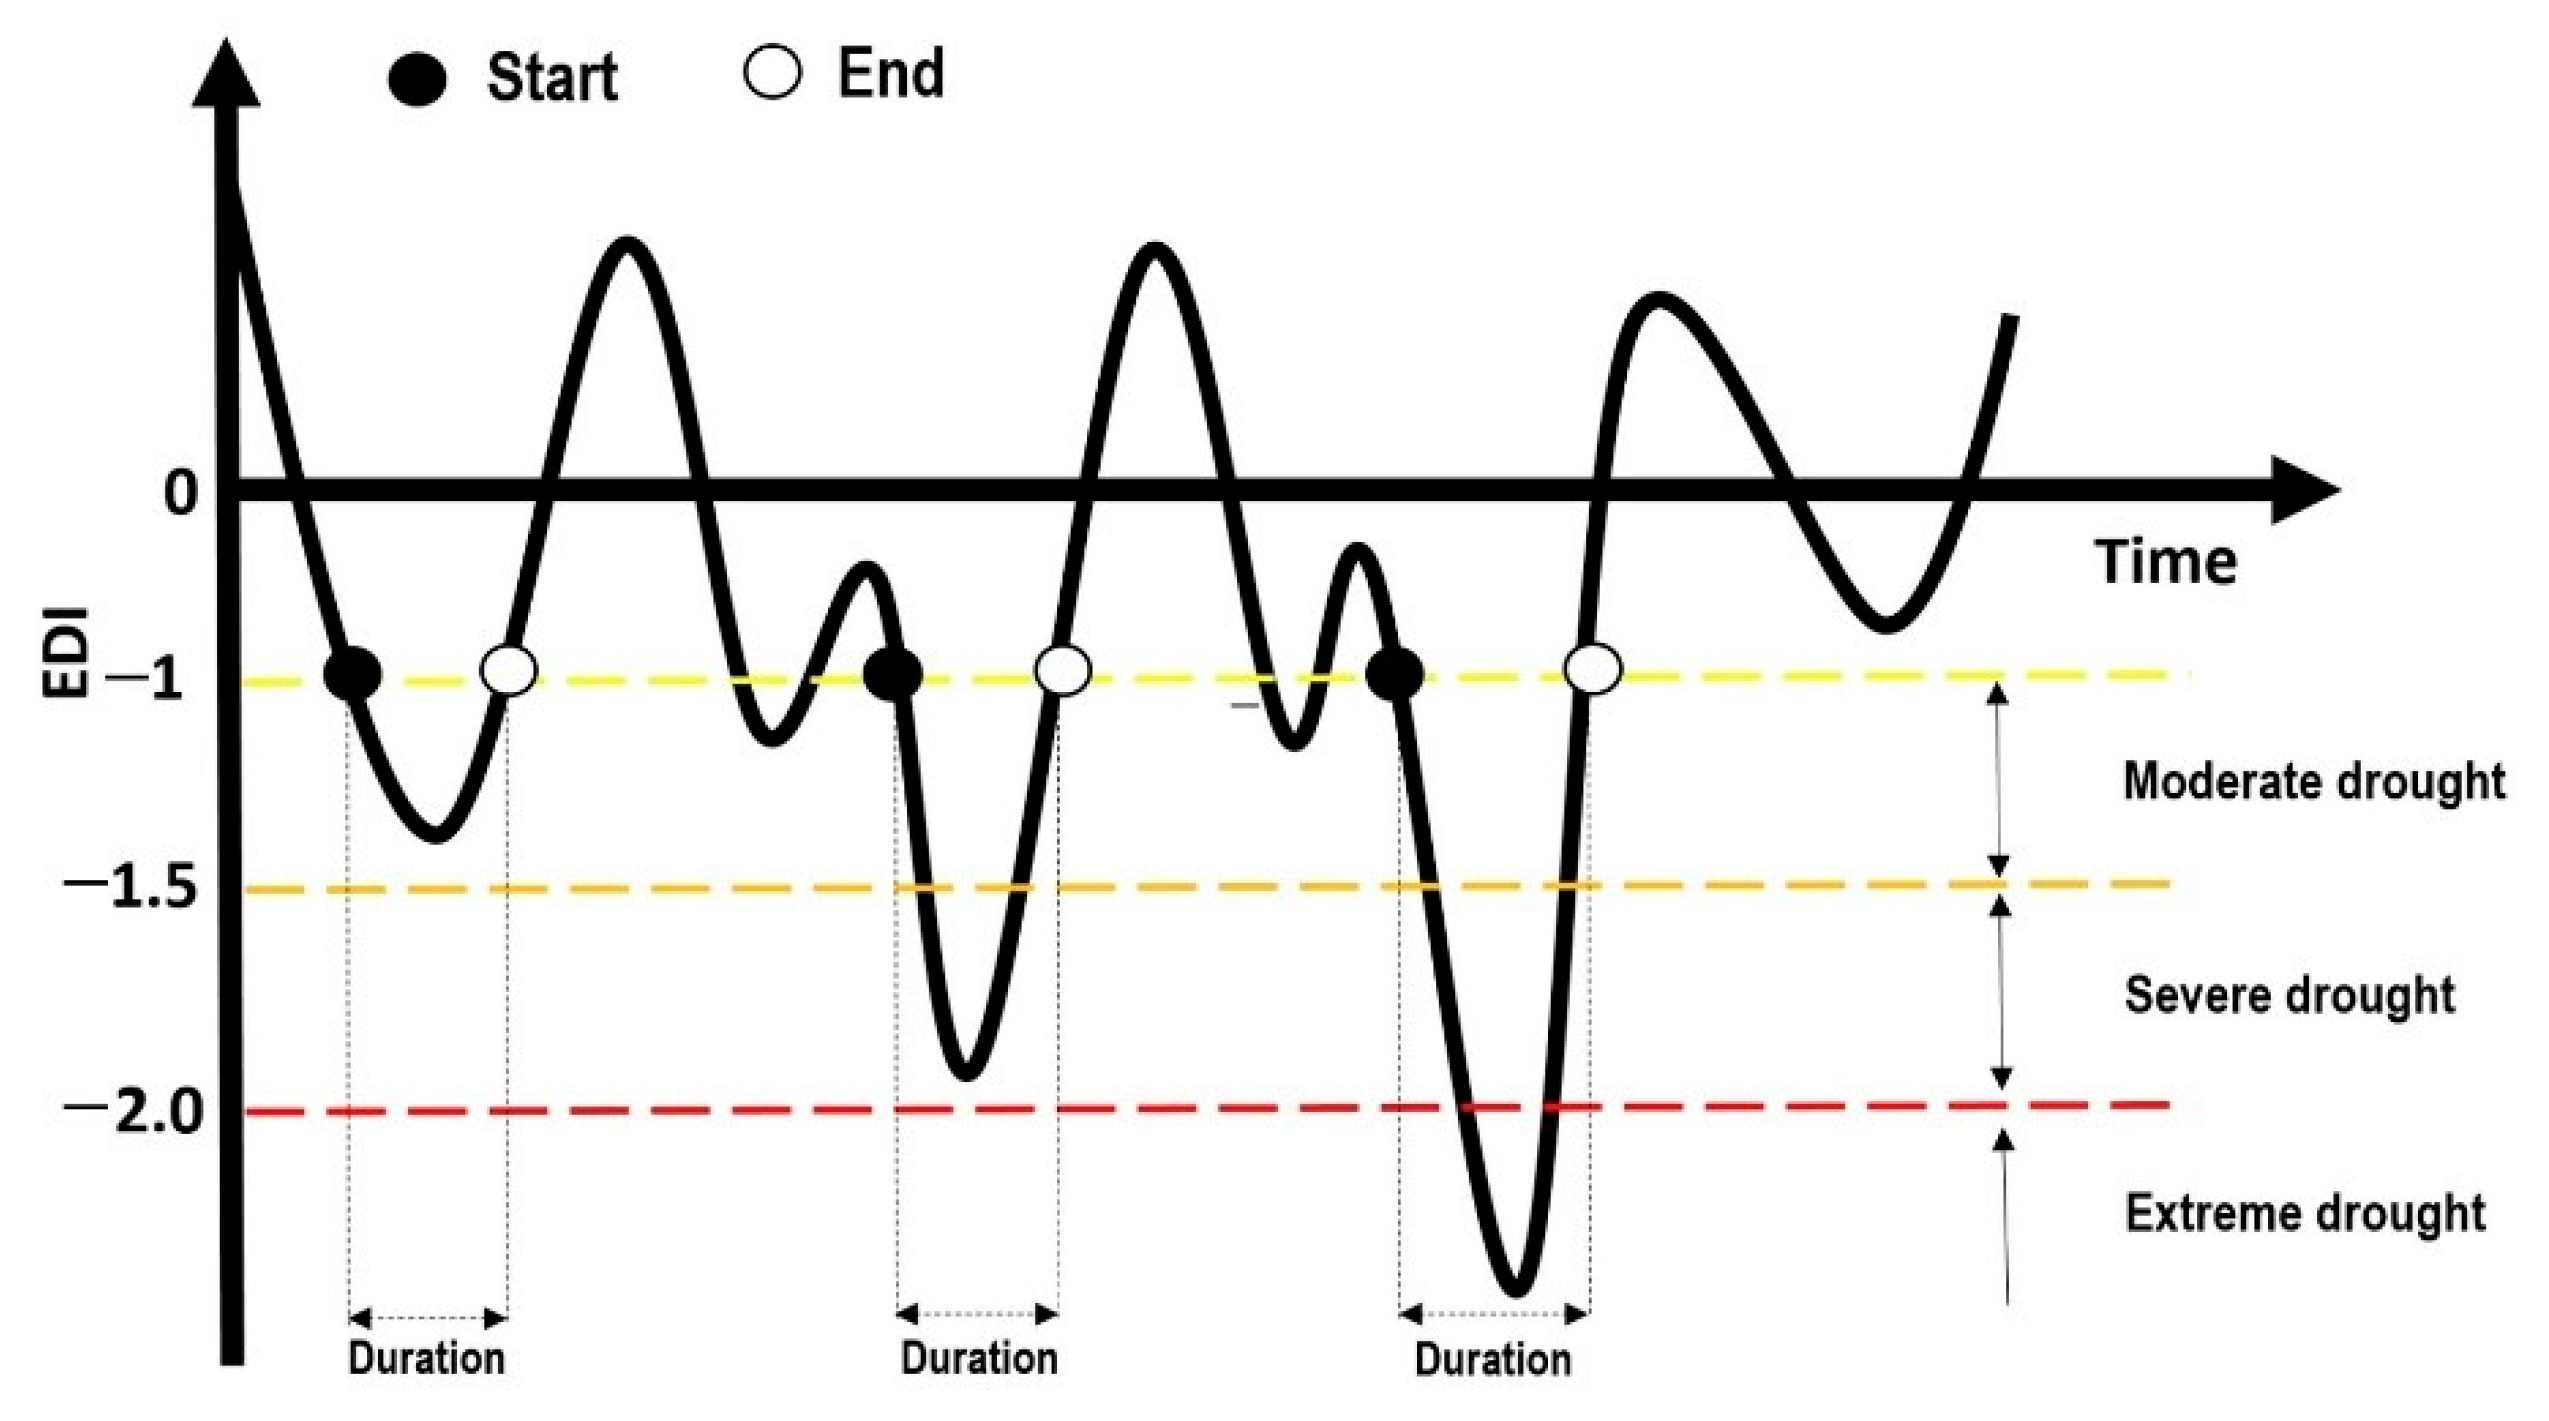
In this study, the date of drought onset is considered to be the month in which the EDI first reaches −1.0, and the termination date is considered to be the month when the EDI regains the value of −1.0. The duration between the start and the end date is defined as the drought duration, as shown in Figure 4.
Drought frequency is represented by the number of events (months) per quinquennial as well as by the number of events per 35 years (the whole period).
In addition to duration and severity, the areal extent is also regarded as a major characteristic of drought. In this study, the Inverse Distance Weight (IDW) algorithm was used to spatially extrapolate the monthly EDI data to the entire study area. Then, the interpolated maps are analysed for the four different regions to estimate the areas under different severities of droughts for each month. In this study, the zonal statistics as a table function of ArcGIS software (v10.6) was used to calculate the areal extent. However, the IDW method has some limitations, which are discussed in the next sub-heading.
2.6. Inverse Distance Weighted Interpolation (IDW)
The Inverse Distance Weighted (IDW) method was considered in the study to interpolate the station based results across Bangladesh. The Inverse Distance Weighting (IDW) is an established deterministic method for drought mapping [16,48,49,50] and one of the most frequently used deterministic models in spatial interpolation [51]. The IDW is the intuitive and straightforward deterministic interpolation method based on the principle that sample values closer to the prediction location have more influence on the prediction value than sample values farther apart [52]. While this basic method is easy to implement and is available in almost any GIS (Geographic Information System), it has some well-known shortcomings that limit its practical applications [53,54,55].
2.7. Mann-Kendall (MK) Test
The non-parametric Mann–Kendall test [56,57] test is used for the trend identification for a given time series of environmental data, climate data, or hydrological data. The main purpose of the MK test is to statistically investigate if there is a monotonic upward or downward trend of the variable of interest over time. A monotonic upward (downward) trend means that the variable consistently increases (decreases) in time. In this test, the null hypothesis (H0) and the alternative hypothesis (Ha) respectively refer to the non-existence and existence of a trend. The MK test is calculated as:
with
where xi and xj respectively indicate the data values at times i and j, and n is the length of the data set. If S value is positive, it means the variable consistently increases through time, while negative value S indicates a decreasing trend.
It has been documented that when n ≥ 8, the statistic S is approximately normally distributed with the mean.
The mean of S is E[S] = 0 and the variance S is
where p indicates the number of tied groups, ti is the number of data points in the pth group. After the variance of time is provided in Equation (6), the standard Z can be expressed by Equation (7) as follows
The calculated Z value is compared with the standard normal distribution table with two-tailed confidence levels. When |Z| > Z1 − α 2/then Ho is rejected, and Ha is accepted, which means there is a significant trend. Otherwise, H0 is accepted, and Ha is rejected, which means the trend is not statistically significant. In this study, trends were tested with a significance level of α = 0.05. The null hypothesis of no trend is rejected if the absolute value of Z is greater than 1.96.
2.8. Linear Regression Estimator
The linear regression method is used to estimate the slope. The positive slope value indicates an increasing trend, while a negative value indicates a decreasing trend. The linear regression line can be computed as follows:
where x and y are the explanatory variable and the dependent variable, respectively, while b and a are the slope and intercept, respectively [58].
3. Results and Discussions
3.1. Reconstruction of Historical Drought
The drought over Bangladesh was analysed using the EDI method by using monthly rainfall time-series data (1981–2015). Average rainfall data from the stations in the individual sub-regions were used for calculating EDI. According to Dash et al. [17], the regional average rainfall data of neighbouring stations provide better information for drought diagnose when compared to the individual station analysis. Moreover, given that drought is a regional phenomenon, detecting historically recorded drought events using monthly rainfall time-series data from the stations is a challenging task.
The historical records of major drought events in Bangladesh were used in the study for validating the results obtained using EDI. In Bangladesh, historical drought records only recognise severe and extreme drought events as major droughts. Therefore, in this study, extreme (EDI ≤ −2.0) and severe (−2.0 < EDI ≤ −1.5) droughts were considered for the evaluation of the results obtained using EDI. The results show that the proposed method can detect reasonably historically recorded droughts.
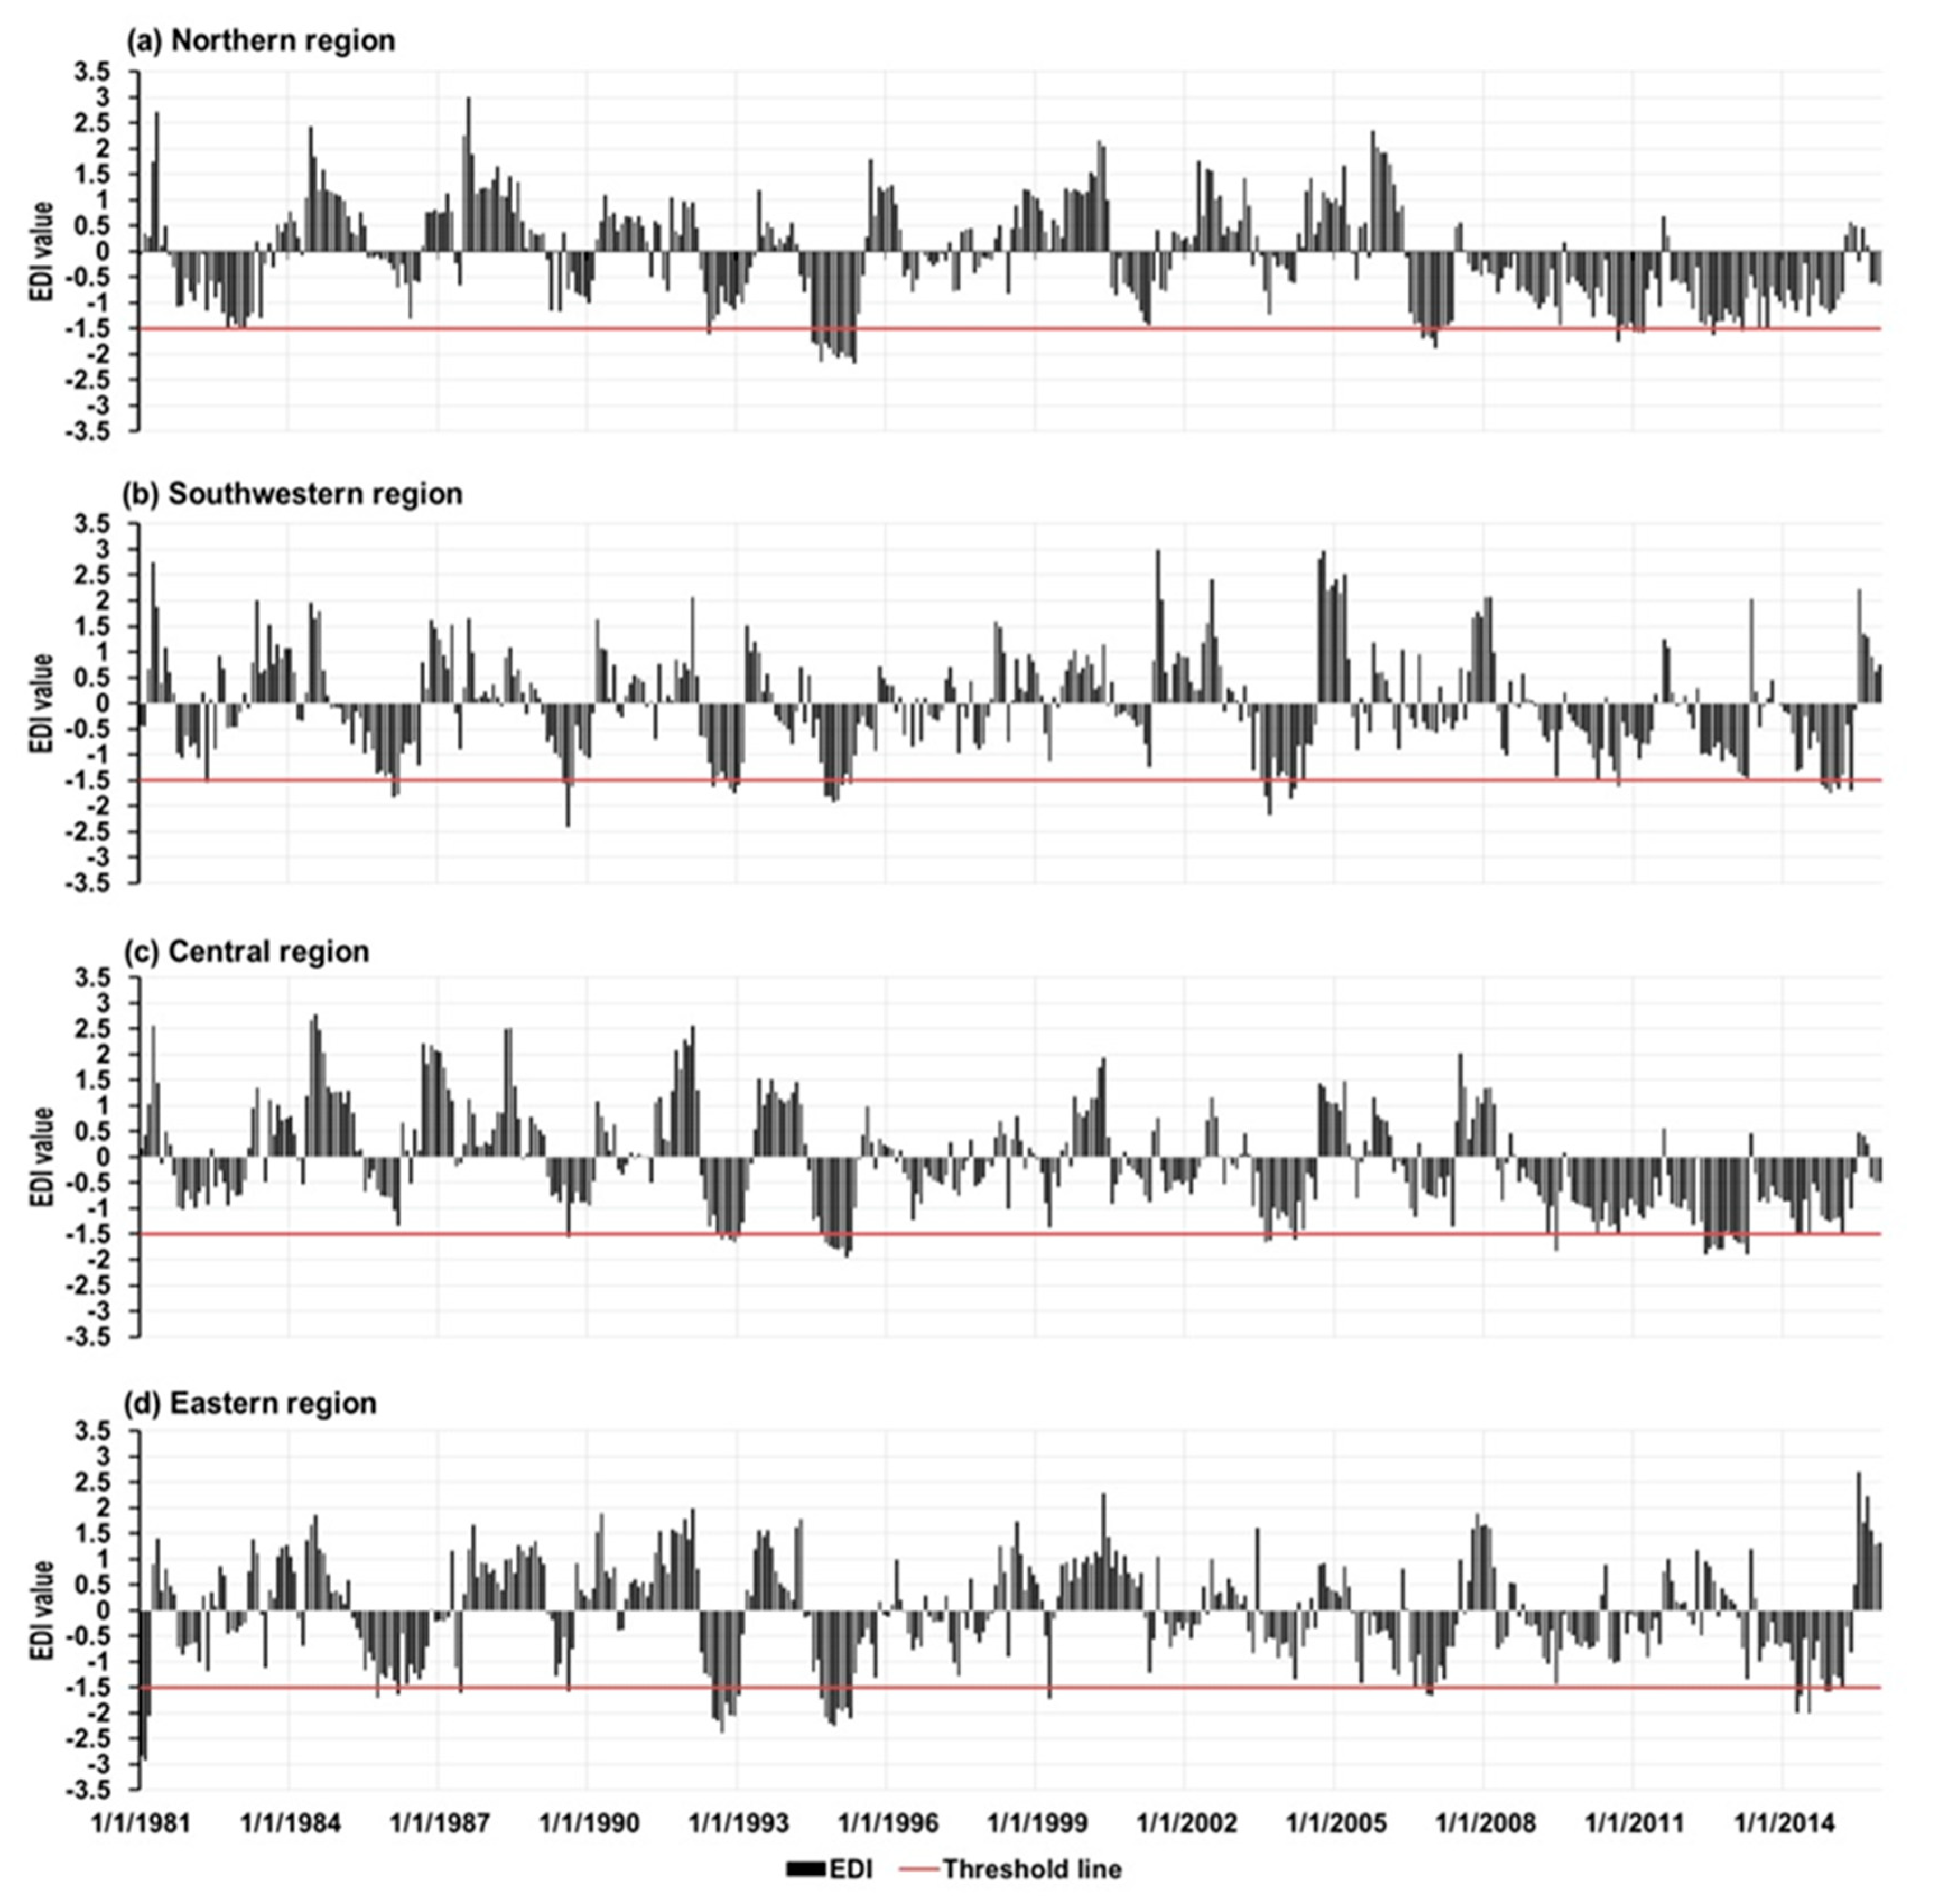
EDI detected twenty-one number of major drought years in different four regions of Bangladesh during the study period from 1981 to 2015, as shown in Figure 5. The drought years obtained from EDI calculations based on regional analysis could partially or fully identify most of the recorded drought years (Table 3), except for 1984 and 1988. However, the EDI values suggest that different parts of Bangladesh experienced droughts in 1993, 1999, 2003, 2004 and 2007, which were not included in historical drought records. It may be attributed to the relatively shorter duration of these droughts, which lasted for 1, 1, 2, 1, and 1 month in 1993, 1999, 2003, 2004, and 2007, respectively. In addition, poor documentation practices may also be responsible for the exclusion of these droughts in the historical drought records. It should be noted that droughts in Bangladesh are recorded based on the only crop damage criterion. Further, the results of this study pertaining to droughts 2003 and 2004 were partially supported by SPI-based studies [12,14]. Therefore, it can be said that EDI can be used to reproduce the real essence of drought events.
3.2. Temporal Variation of Drought
Temporal variations of drought characteristics are of great significance for understanding the long-term drought conditions. The temporal variations of drought severity in different four regions were shown in Figure 5. As the number of stations in each regions is not homogeneous, it might lead to uncertainty in comparison to regional trends of drought severity with each other.
To examine the temporal variation in the characteristics of drought, Mann-Kendall (MK) trend test was applied at different four regions to detect the potential trends of EDI values at a significance level of α = 0.05 for different areas of Bangladesh. The obtained results are presented in Table 4. Results show that there are negative (decreasing) trends in all regions. The declining EDI values observed from the analysis signifies an increasing drought severity for the study area. The most significant decreasing trend in EDI values was observed in the central region; however, this decreasing trend was milder in the south-west regions. It can be said that the drought severity shows an overall increasing trend in the study area.
3.3. Drought Frequency Considering the Severity
The severity of a drought event was defined based on the lowest EDI value for each event. The total study period was divided into seven quinquennial periods (1981–1985, 1986–1990, 1991–1995, 1996–2000, 2001–2005, 2006–2010, 2011–2015) for understanding the temporal changes in the frequency of droughts over time. For each period, the number of events for each level of severity was enumerated at each station and averaged over the separated region, as shown in Table 5. The drought events showed an increasing trend in terms of drought frequency.
The results showed that the highest number of drought events (24) was observed in the central region (R3), and the lowest number (15) was observed in the eastern part (R4). For the regions R1–R4, 5.39%, 6.67%, 7.66% and 3.27% of the total drought events were classified as severe; on the other hand, 3.19%, 2.86%, 1.23%, and 2.18% were classified as extreme. The remainder of the drought events (67.73%) were classified as moderate droughts. The highest number of extreme drought events, accounting for 1.36% of the total drought events, was observed in the eastern region during 1981–1985, followed by 1.09% in the southwestern region during the last quinquennial period. No extreme drought events were observed in all regions during 1995–2000. Likewise, no extreme drought events were observed in the northern region, eastern region and central region during 1986–1990, 2001–2010 and 1986–2010, respectively. However, the highest number of extreme drought events (3.19%) was observed in the northern region (R3), while the lowest number (1.23%) was observed in the central region during the study period. Moreover, increased frequencies of extreme drought were found in the south-western and central areas, followed by the northern region, during the last quinquennial.
The highest number of severe drought events (1.72% of total drought events) was observed in the northern region (R1) during the last quinquennial, followed by the central region (1.53% of total drought events), during 1991–95 and 2006–10, respectively. On the other hand, the lowest number (0.14% of total drought events) was observed in the eastern region during 1995–2000. No severe drought events were observed in the eastern region during 1986–1990. Moreover, all categories of droughts showed shown an increasing trend in terms of frequency over the study period (with the exception except extreme drought in the eastern region). Thus, from the above, the northern region experiences extreme droughts, whereas the central region experiences severe drought. Moreover, all categories of droughts have shown increased frequency during the last quinquennial from 2011 to 2015.
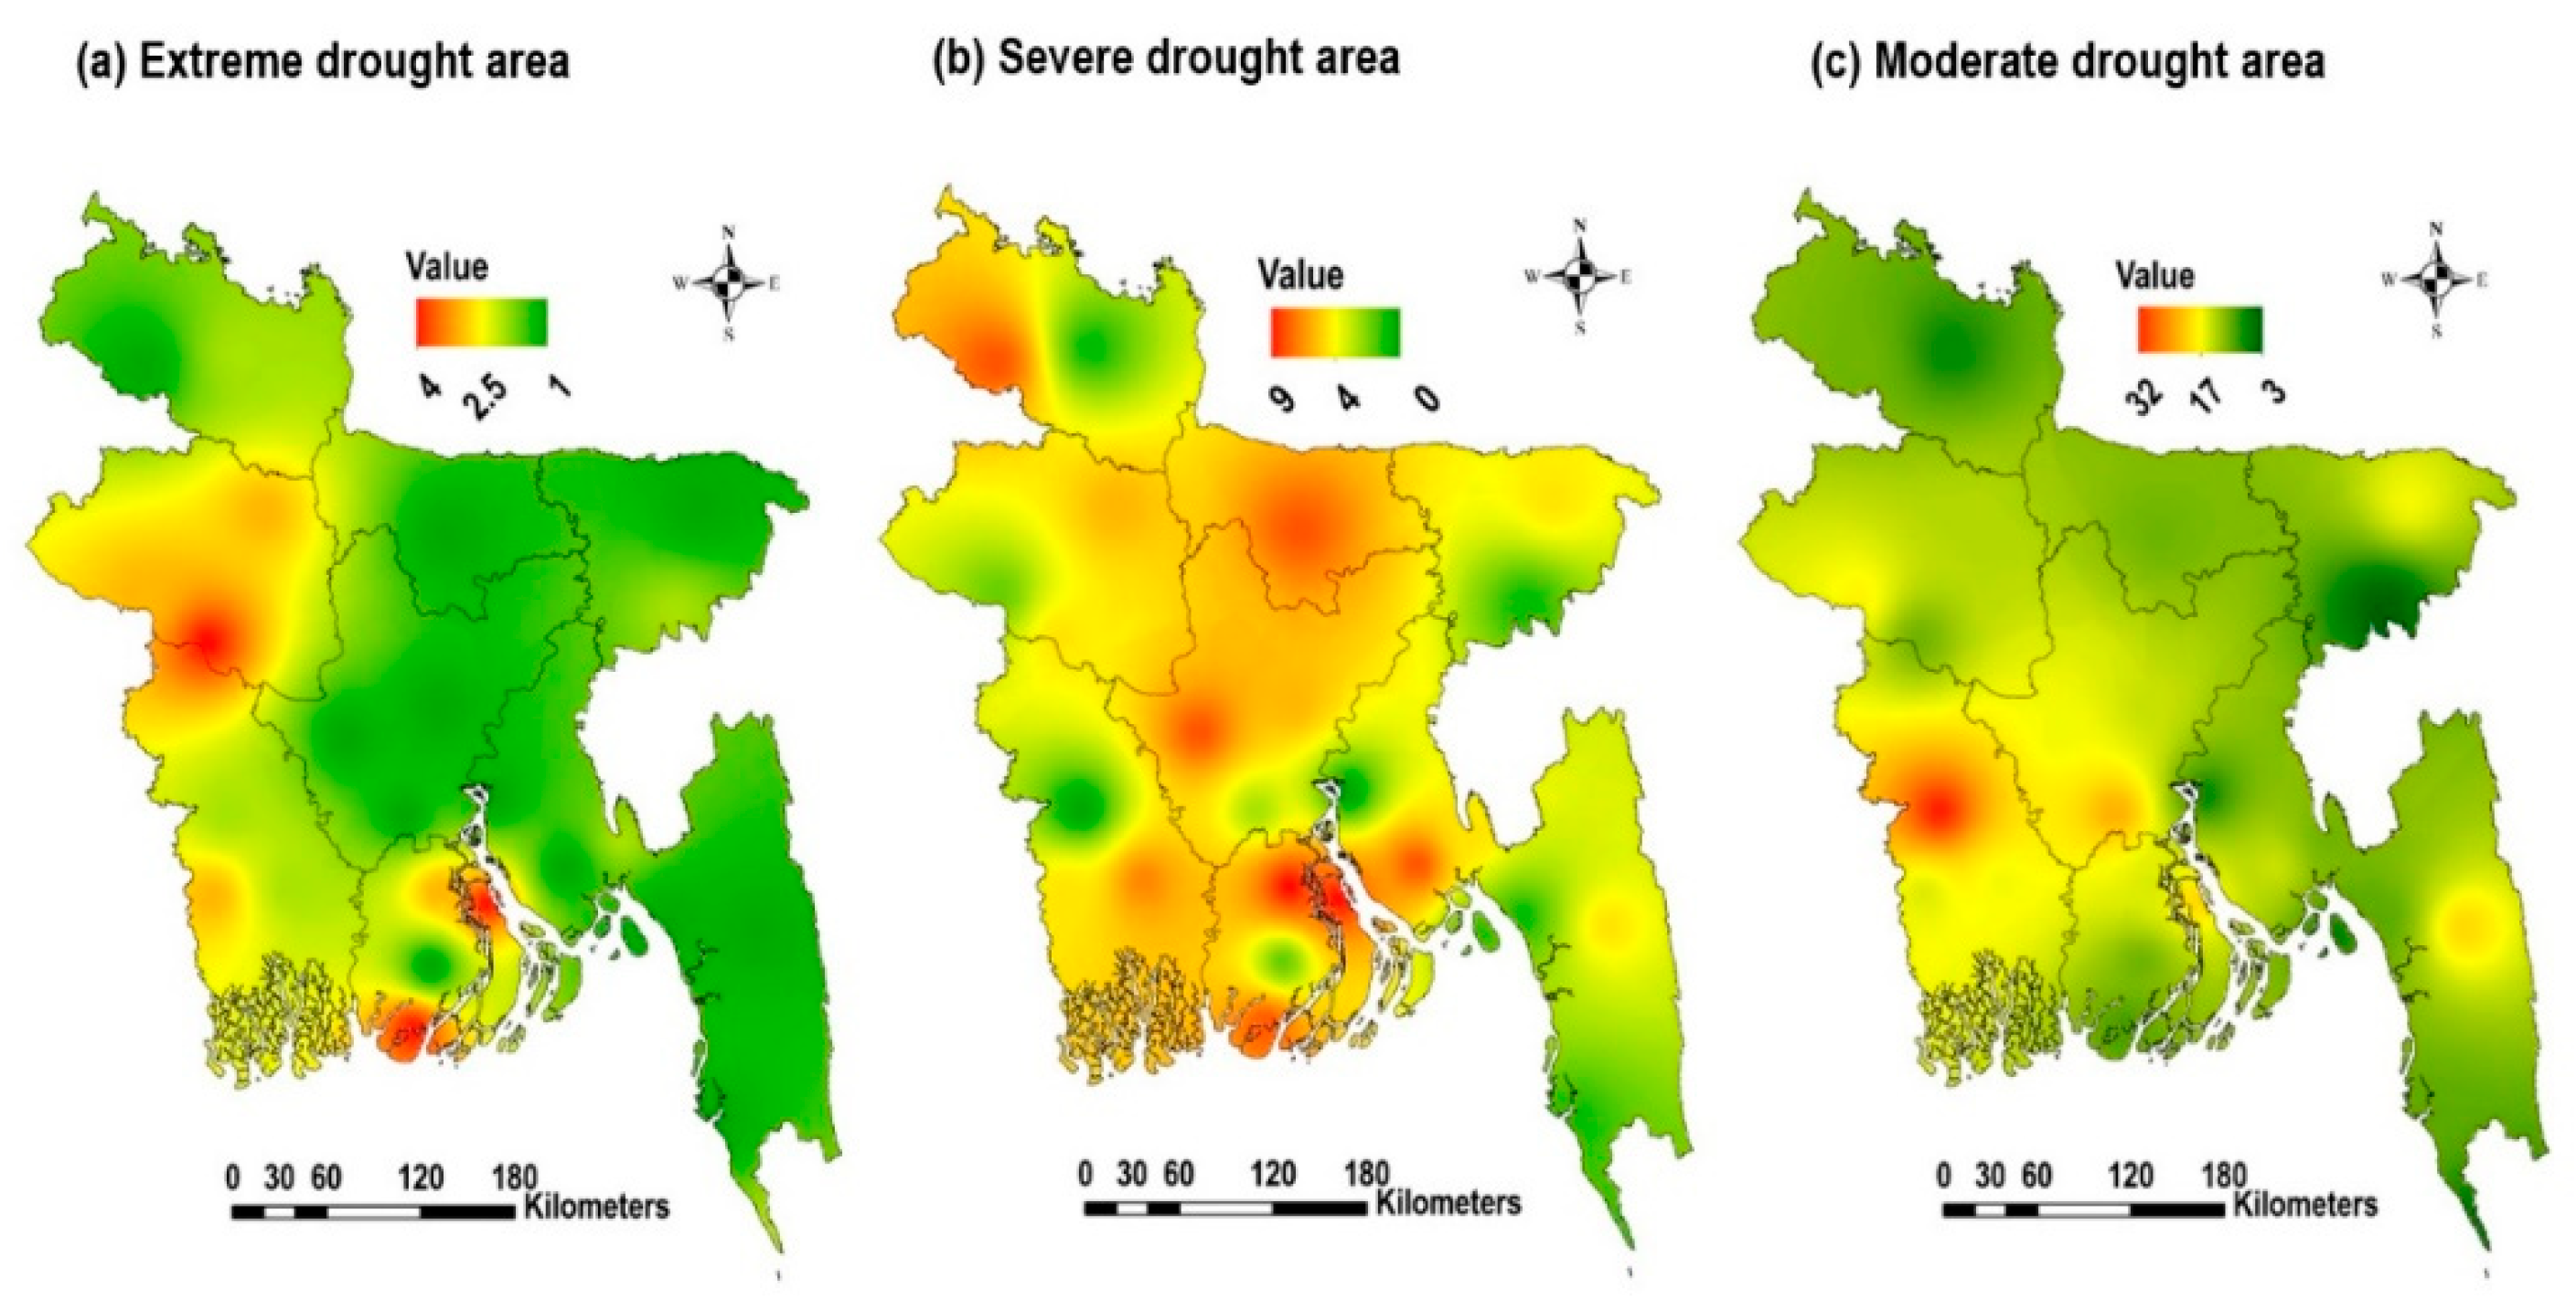
The spatial pattern of drought frequency by drought category (moderate, severe, extreme) was investigated based on the total number of drought events occurring during the entire study period. The total number of drought events accumulated during the study period at each station for each level of severity (Table 2) were then interpolated using the IDW algorithm (Figure 6). However, the IDW method has some limitations in the GIS interface, which are discussed previously.
The spatial analysis of drought can help in identifying the areas frequently affected by drought as well as delineating the most drought-prone regions. Figure 6 illustrates the spatial pattern of the averaged drought frequency over the study period by drought category, based on the level of severity. The results suggest that the occurrence of drought events varies by region as well as severity. Comparatively, it was observed that moderate droughts occurred more frequently than severe and extreme droughts during the study period.
The western part of north Bangladesh and a small portion along the coastal area in the southwest region were extreme drought-prone regions, as shown in Figure 6a. The severe drought-prone regions were found in the northern, southwest and central areas (Figure 6b). Further, the spatial pattern suggests that most of Bangladesh is moderately drought-prone and a higher drought frequency was observed in the south-western regions (Figure 6c). The spatial analysis of the occurrence of droughts (different categories) indicates that the northern, south-eastern, and central regions of the country are comparatively more vulnerable to drought. Extreme droughts were observed most frequently in the western part of the country. However, the eastern part of the country was observed to be less vulnerable to droughts.
Therefore, this result agrees with the previous studies on drought occurrences in Bangladesh that were based on SPI indices. For example, Rafiuddin et al. [1] stated that the northern, south-eastern and central regions are the most severe drought-prone regions in Bangladesh. They studied droughts over Bangladesh during the period between 1961 and 1990 using an SPI time scale of 1-month, 3-months, and 6-months. According to Rahman and Lateh [14], the northern, north-western, western, south-western and central regions of Bangladesh were more prone to drought based on the 3-month time scale of SPI indices during the period between 1971 and 2010. However, Hasan et al. [59] pointed out that the frequency of extreme drought increased in the north-western and decreased in the eastern regions of Bangladesh, based on 3-month time scale SPI indices. They also expressed that extreme drought events reduced, while severe and moderate drought events increased. The results of this study are in agreement with previous studies; however, extreme drought was shown to have increased in frequency during the last quinquennial (2010–2015) because of the recent changes in the precipitation pattern.
3.4. Drought Frequency Based on the Duration
The frequency of droughts by event duration at a regional scale, as shown in Table 6. The frequency of droughts was determined based on the average number of drought events for the stations within each region and categorized durations. It can be seen that short-term droughts lasting less than 3-months have a higher occurrence rate than the droughts lasting longer than 3-months.
According to Table 6, the short-term droughts comprised 68.51% of the total drought events that occurred in all the regions (R1–R4) during the entire study period. In Bangladesh, short-term droughts are generally observed more frequently because the country receives more than 100 mm rainfall in the nine months between March and October; thus, droughts in Bangladesh rarely last for extended periods.
In addition, the frequency of short-term droughts showed an increasing trend over the study period for all regions; the highest frequency (4.91%) was observed in the central region during 2001–2005, followed by the southwestern region (4.77%) during 2010–2015. The frequency of medium-term drought also showed an increasing trend in the northern and eastern regions, while a decreasing trend was observed in the other areas. In particular, the highest number of medium-term droughts (1.47%) were observed in the northern region during 2006–2010. Interestingly, the occurrence of long-term drought showed a decreasing trend in the southwestern region. The highest number of long-term drought events (1.23%) were observed in the central (R3) region during the period between 1986–1990. The results suggest that the occurrence of extra long-term droughts in the eastern region decreased and an increasing trend was observed in other regions. The highest number of extra long-term drought events (1.53%) was observed in the central region during the last quinquennial period. In northern and southwestern regions, the occurrence of all categories of droughts showed an increasing trend during the last quinquennial; however, no medium-term and extra long-term droughts occurred in the central and eastern regions. In general, a lower frequency of drought occurrence was observed in the eastern region for the entire study period.
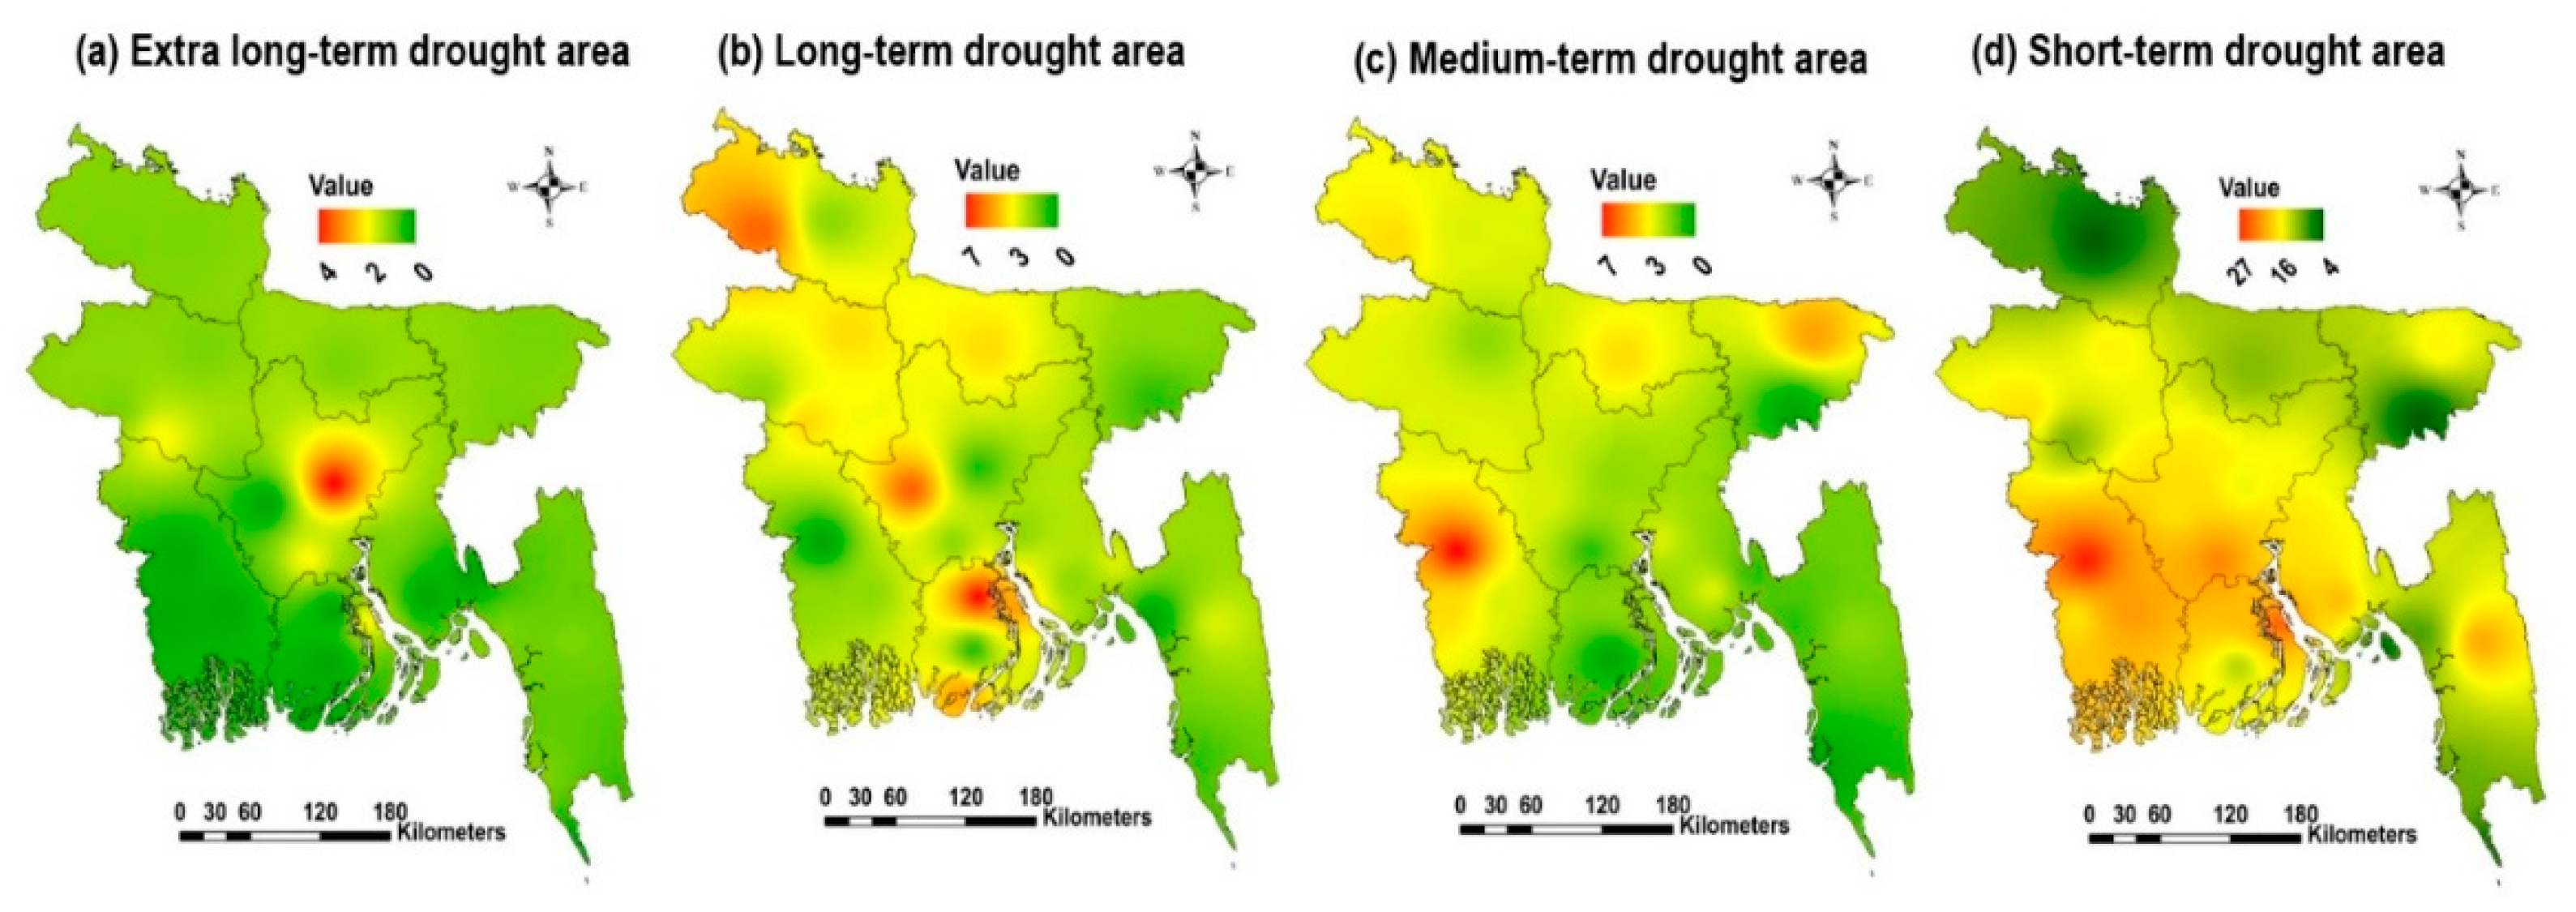
The spatial patterns of drought frequency by event duration were mapped based on the number of drought events for different drought durations (short-term, medium-term, long-term, and extra long-term). Figure 7 illustrates the spatial patterns of averaged drought frequency over the study period by event duration. As shown in Figure 7a, the extra long-term drought-prone area was mainly located in the central region. The long-term drought was found to be prominent in the northern, central and small parts of the southern region (Figure 7b). Medium drought-prone areas were observed in the northern and southern regions; however, their occurrence was more prominent in the south-western region (Figure 7c). Further, the spatial pattern suggests that most of the areas are very short-term drought-prone; on the other hand, a greater frequency was observed in the south-western regions (Figure 7d). The results indicate that, overall, the western and central regions are most vulnerable to drought.
3.5. Spatial Distribution of Seasonal Drought
In this study, in order to determine seasonal drought-prone areas, the spatial distributions of seasonal drought frequency were developed based on the averaged counts of drought events occurring during each cropping season (Pre-Kharif, Kharif and Rabi) of Bangladesh. Seasonal droughts were analyzed spatially based on the number of drought months occurring in each season by drought category (moderate, severe, and extreme). The total number of drought months in each season accumulated by category at each station during the study period was then interpolated using the IDW algorithm (Figure 8). The spatial analysis of seasonal drought helps to identify areas that are most vulnerable to drought. In 2010, Bangladesh Agricultural Research Council (BARC) produced three different maps for Pre-Kharif, Kharif and Rabi seasons by considering soil and climate factors such as available moisture-holding capacity, soil percolation rate, temperature, and rainfall uncertainty [60]. These maps were used to validate the agricultural-drought prone areas derived from the results of the present study.
The Pre-Kharif season is characterized by irregular rainfall and high temperatures (>40 °C in March/May). This climate trend has adverse effects on all Pre-Kharif crops such as T. aus, particularly in regions where the agricultural infrastructure limited. The spatial distribution of extreme, severe, and moderate droughts during the Pre-Kharif season is shown in Figure 8a–c. The observed map indicates the small region in the north-eastern part of Bangladesh, which is covered by Rajshahi station and its neighborhood areas, is prone to extreme droughts, as shown in Figure 8d. This may be attributed to the changes in precipitation patterns between 2002–2015 in this region. Rainfall data analysis for the Pre-Kharif season indicates a decreasing trend in rainfall in Dhaka station (0.78% per year), which was more severe than that in Rajshahi station (0.27% per year) during the period between 2002–2015. Therefore, it can be said that the Dhaka station and its surrounding regions experienced extreme drought in the recent past.
During the study period, the major share of rainfall (78.5%) in Bangladesh was received during the Kharif season. Therefore, rainfall during the Kharif season is critical to the agriculture production and food security of Bangladesh. Moreover, this rainfall is the major source of groundwater recharge. Therefore, any deficit in rainfall during the Kharif season severely affects Kharif crops. In addition, non-replenishment of groundwater adversely affects groundwater-based irrigation during the Rabi and Pre-Kharif seasons. Therefore, droughts occurring during the Kharif season are most hazardous for Bangladesh compared to any other cropping season [4]. According to Selvaraju and Baas [3], droughts in the period between June/July and October result from dry conditions in the highland areas, especially in the north-western region. Drought affects the critical reproductive stages of T. Aman rice, thereby reducing its yield, particularly in those areas with low soil moisture-holding capacity. In addition, such droughts also have a significant impact on fisheries and other household-level activities.
The spatial distribution of extreme, severe, and moderate droughts during the Kharif season is shown in Figure 8e–g, respectively. The results suggest that extreme droughts frequently occurred in the northwest and middle of the eastern part of Bangladesh. Further, the occurrence of severe droughts was prominent in the central and a small part of the northern region (Figure 8f). Moreover, the northern, southwestern and central regions were found to be susceptible to moderate droughts (Figure 8g). However, the observed map indicated that the eastern part of the country was not vulnerable to extreme and severe droughts during the Kharif season, particularly at Srimangal station and its surrounding areas (Figure 8h). It can be attributed to the recent changes in the rainfall pattern in that area. It is evident that recently, the average rainfall has shown a decreasing trend in Kharif season; the average annual rainfall decreased at a rate of 0.08% per year during the period between 2002–2015; on the other hand, an increasing trend was observed (rate of 0.07% per year) during the period between 1981–2001. Therefore, the drought-prone areas must be updated to reflect the recent changes in the weather characteristics over Bangladesh.
Rabi droughts are believed to occur due to the cumulative effect of dry days and low soil moisture. This drought affects all Rabi crops, such as Boro rice, wheat, pulses, and potatoes. The spatial distribution of extreme, severe and moderate droughts during the Rabi season is shown in Figure 8i–k, respectively. The frequency of moderate droughts during the Rabi season is higher in the central and southwestern regions (Figure 8k). The spatial distributions of extreme, severe and moderate droughts during Rabi season developed in this study exhibit considerable similarities to the observed map.
3.6. Variation of the Drought-Affected Area
The spatiotemporal variation in the drought-affected regions was evaluated based on the monthly EDI values determined for the 27 stations during the study period. The interpolated maps were used to estimate the drought-affected areas in each month for different regions by each level of drought severity.
Linear regression methods were used to observe trends in the drought-affected areas at different significance levels (p = 0.001, 0.01, and 0.05) for the different regions of Bangladesh to examine the variations in the drought areas. Table 7 lists the percent changes in the drought-affected regions on a decade basis. Overall, the most significant increasing trend in terms of the drought-affected regions was observed in the central region; on the other hand, a decreasing trend was observed in the eastern region during the study period.
Table 7 shows that the greatest change in drought-affected area for moderate, severe, and extreme drought was 3.46% per decade in May, 1.38% per decade in March, and 0.32% per decade in May, respectively, within the central region. However, the most significant decreases in the drought-affected area were observed for extreme and severe drought with a rate of 0.34% per decade in February and 0.39% per decade in January–March, respectively, in the eastern region. Moreover, only a statistically significant increasing trend of the moderate drought was found in April within the same region. According to the drought records, the north-western regions of Bangladesh were most vulnerable to droughts [6]. However, this research indicates that the central region has recently emerged as the most drought vulnerable region, especially in March–May, because of the high rainfall variation in this area.
4. Conclusions
In this study, EDI was used to assess the spatiotemporal characteristics of agricultural droughts from 1981 to 2015 in Bangladesh. The performance of the EDI indices in terms of detecting droughts was evaluated through comparisons with historical drought records. The results showed that EDI indices are suitable tools for detecting, monitoring, and assessing drought conditions by regional analysis.
The study provides a comprehensive description of the severity, frequency, duration, and areal extent of drought during the study period (1981–2015) in Bangladesh. The results showed that the central region of Bangladesh experienced an increasing trend in terms of drought occurrence and severity, duration and areal extent; on the other hand, the opposite trend was observed in the eastern region. In terms of the areal extent, the highest increasing trend was observed during March-May in the central region because of the variability in rainfall. Moreover, all categories (based on severity and duration) of drought presented increased frequency during the last quinquennial period from 2011 to 2015, although with some exceptions. Spatial analysis revealed that drought occurred all over the country; however, it was more prominent in the central and western parts of the country and less frequent in the eastern region. Besides, the seasonal spatial analysis showed that extreme drought was prominent in the north-western and central parts of Bangladesh during the Kharif and Rabi seasons. The study showed that the central and northern regions of Bangladesh were more vulnerable to severe drought during all seasons. However, the north-western regions of Bangladesh were most vulnerable to droughts. However, the present study indicates that the central regions should be newly included as a drought-prone region because of the recent changes in the climatology, particularly in the Pre-Kharif season. Therefore, the central region of Bangladesh should be prioritised for developing future drought management strategies.
The study also showed that EDI could be a useful tool for identifying drought-prone areas, could find potential applications for monitoring climate change-induced drought evolution at a regional and national level in Bangladesh. The information on drought derived in this study will help researchers understand the recent spatiotemporal patterns of drought events over Bangladesh. The outcomes may be used in developing anticipative strategies to mitigate socio-economic losses as well as damages to agricultural production in the drought-prone regions of Bangladesh.
Author Contributions
M.K. contributions as a main author. M.K. and S.H. designed the research, analyzed the data and wrote the manuscript; S.H. supervised the study and providing critical evaluations of the manuscript. J.C. provided valuable intellectual content. M.-W.J. and H.J. helped in the preparation of the manuscript and subsequent revisions.
Funding
This work was supported by the National Research Foundation of Korea (NRF) grant funded by the Korea government [NRF-2016R1C1B1010074].
Acknowledgments
The authors acknowledge the Bangladesh Meteorological Department (BMD) for providing historical rainfall data used in this study. The authors also thank Md. Niaz Farhat Rahman, Senior scientific officer (Agricultural Statistics Division), Bangladesh Rice Research Institute for providing the missing and adjusted rainfall values. The authors are appreciative of Tofael Ahamed is an Associate Professor, Faculty of Life and Environmental Sciences, University of Tsukuba, for his critical comments on the early stage of the manuscript. Finally, the authors are immensely grateful to the reviewers for their comments on an earlier version of the manuscript.
Conflicts of Interest
The authors declare no conflict of interest.
References
- Rafiuddin, M.; Dash, B.K.; Khanam, F. Diagnosis of Drought in Bangladesh using Standardized Precipitation Index. In Proceedings of the International Conference on Environment Science and Engineering, Bali Island, Indonesia, 1–3 April 2011. [Google Scholar]
- Wilhite, D.A.; Glantz, M.H. Understanding: The Drought Phenomenon: The Role of Definitions. Water Int. 1985, 10, 111–120. [Google Scholar] [CrossRef]
- Selvaraju, R.; Baas, S. Climate Variability and Change: Adaptation to Drought in Bangladesh: A Resource Book and Training Guide; Food and Agriculture Organization of the United Nations: Rome, Italy, 2007; ISBN 978-92-5-105782-7. [Google Scholar]
- Alamgir, M.; Shahid, S.; Hazarika, M.K.; Nashrrullah, S.; Harun, S.B.; Shamsudin, S. Analysis of meteorological drought pattern during different climatic and cropping seasons in Bangladesh. J. Am. Water Resour. Assoc. 2015, 51, 794–806. [Google Scholar] [CrossRef]
- Zimmermann, M.; Glombitza, K.F.; Rothenberger, B. Disaster Risk Reduction Programme for Bangladesh; The Swiss Agency for Development and Cooperation (SDC), Directorate of Humanitarian Aid and SHA: Bern, Switzerland, 2010. [Google Scholar]
- Banglapedia. National Encyclopaedia of Bangladesh; Asiatic Society of Bangladesh: Dhaka, Bangladesh, 2019; Available online: http://en.banglapedia.org/index.php?title= Bangladesh (accessed on 17 March 2019).
- Fahad, M.G.R.; Saiful Islam, A.K.M.; Nazari, R.; Hasan, M.A.; Tarekul Islam, G.M.; Bala, S.K. Regional changes of precipitation and temperature over Bangladesh using bias-corrected multi-model ensemble projections considering high-emission pathways. Int. J. Climatol. 2007, 38, 1634–1648. [Google Scholar] [CrossRef]
- Gommes, R.; Petrassi, F. Rainfall variability and drought in Sub-Saharan Africa since 1960; Food and Agriculture Organization of the United Nations: Rome, Italy, 1996; Available online: http://www.fao.org/3/a-au042e.pdf (accessed on 17 March 2019).
- Mishra, A.K.; Singh, V.P. A review of drought concepts. J. Hydrol. 2010, 354, 202–216. [Google Scholar] [CrossRef]
- Dai, A. Drought under global warming: A review. Wiley Interdiscip. Rev. Clim. Chang. 2011, 2, 45–65. [Google Scholar] [CrossRef]
- Kamruzzaman, M.; Jang, M.W.; Hwang, S.; Jang, T. Evaluating the agricultural drought for Pre-Kharif season in Bangladesh using MODIS Vegetation Health Index. J. Korean Soc. Agric. Eng. 2018, 60, 53–61. [Google Scholar] [CrossRef]
- Mondal, M.A.H.; Ara, I.; Das, S.C. Meteorological Drought Index Mapping in Bangladesh Using Standardized Precipitation Index during 1981–2010. Adv. Meteorol. 2017, 2017, 4642060. [Google Scholar] [CrossRef]
- Miah, M.G.; Abdullah, H.M.; Jeong, C. Exploring standardized precipitation evapotranspiration index for drought assessment in Bangladesh. Env. Monit. Assess. 2017, 189, 547–562. [Google Scholar] [CrossRef]
- Rahman, M.R.; Lateh, H. Climate change in Bangladesh: A spatiotemporal analysis and simulation of recent temperature and rainfall data using GIS and time series analysis model. Theor. Appl. Climatol. 2017, 128, 27–41. [Google Scholar] [CrossRef]
- Islam, A.R.M.T.; Shen, S.; Hu, Z.; Rahman, M.A. Drought Hazard Evaluation in Boro Paddy Cultivated Areas of Western Bangladesh at Current and Future Climate Change Conditions. Adv. Meteorol. 2017, 2017, 3514381. [Google Scholar] [CrossRef]
- Alam, J.A.T.M.; Rahman, M.S.; Saadat, A.H.M. Monitoring Meteorological and agricultural drought dynamics in Barind region Bangladesh using standard precipitation index and Markov chain model. Int. J. Geom. Geosci. 2013, 3, 511–524. [Google Scholar]
- Dash, B.K.; Rafiuddin, M.; Khanam, F.; Islam, M.N. Characteristics of Meteorological Drought in Bangladesh. Nat. Hazards 2012, 64, 1461–1474. [Google Scholar] [CrossRef]
- Alam, A.T.M.; Saadat, A.H.M.; Rahman, M.S.; Barkotulla, M.A.B. Spatial analysis of rainfall distribution and its impact on agricultural drought at Barind region, Bangladesh. Rajshahi Univ. J. Environ. Sci. 2011, 1, 40–50. [Google Scholar]
- Shahid, S.; Behrawan, H. Drought risk assessment in the western part of Bangladesh. Nat. Hazards 2008, 46, 391–413. [Google Scholar] [CrossRef]
- McKee, T.B.; Doesken, N.J.; Kleist, J. The relationship of drought frequency and duration to time scales. In Proceedings of the 8th Conference on Applied Climatology, Anaheim, CA. USA, 17–22 January 1993; pp. 179–184. [Google Scholar]
- Palmer, W.C. Meteorological Drought; Research Paper 45; US Weather Bureau: Washington, DC, USA, 1965.
- Vicente-Serrano, S.M.; Beguería, S.; López-Moreno, J.I. A multi-scalar drought index sensitive to global warming: The standardized precipitation evapotranspiration index. J. Clim. 2010, 23, 1696–1718. [Google Scholar] [CrossRef]
- Wang, X.W.; Xie, H.J.; Guan, H.D.; Zhou, X.B. Different responses of MODIS-derived NDVI to root-zone soil moisture in semi-arid and humid regions. J. Hydrol. 2007, 340, 12–24. [Google Scholar] [CrossRef]
- Byun, H.R.; Kim, D.W. Comparing the Effective Drought Index and the Standardized Precipitation Index. In Economics of Drought and Drought Preparedness in a Climate Change Context; CIHEAM: Zaragoza, Spain, 2010; pp. 85–89. [Google Scholar]
- Byun, H.R.; Wilhite, D.A. Objective quantification of drought severity and duration. J. Clim. 1999, 12, 2747–2756. [Google Scholar] [CrossRef]
- Kim, D.W.; Byun, H.R.; Choi, K.S. Evaluation, modification, and application of the Effective Drought Index to 200-year drought climatology of Seoul Korea. J. Hydrol. 2009, 378, 1–12. [Google Scholar] [CrossRef]
- Pandey, R.P.; Dash, B.B.; Mishra, S.K.; Singh, R. Study of indices for drought characterization in KBK districts in Orissa (India). Hydrol. Process. 2008, 22, 1895–1907. [Google Scholar] [CrossRef]
- Morid, S.; Vladimir, S.; Moghaddasi, M. Comparison of Seven Meteorological drought indices for drought monitoring in Iran. Int. J. Climatol. 2006, 26, 971–985. [Google Scholar] [CrossRef]
- Jain, V.K.; Pandey, R.P.; Jain, M.K.; Byun, H.R. Comparison of drought indices for appraisal of drought characteristics in the Ken River Basin. Weather Clim. Extrem. 2015, 8, 1–11. [Google Scholar] [CrossRef]
- Kamruzzaman, M.; Cho, J.; Jang, M.; Hwang, S. Comparative Evaluation of Standardized Precipitation Index (SPI) and Effective Drought Index (EDI) for Meteorological Drought Detection over Bangladesh. J. Korean Soc. Agric. Eng. 2019, 61, 143–157. [Google Scholar] [CrossRef]
- Keka, A.I.; Matin, I.; Rahman, M.; Banu, D. Analysis of Drought in Eastern Part of Bangladesh. Daffodil Int. Univ. J. Sci. Technol. 2012, 7, 20–27. [Google Scholar] [CrossRef]
- Mondol, M.A.; Das, S.C.; Islam, M.N. Application of Standardized Precipitation Index to assess meteorological drought in Bangladesh. Jàmbá J. Disaster Risk Stud. 2016, 8. [Google Scholar] [CrossRef]
- Mamun, A.A.; Rahman, M.N.F.; Aziz, M.A.; Qayum, M.A.; Hossain, M.I.; Nihad, S.A.I.; Kabir, M.S. Identification of meteorological drought prone area in Bangladesh using Standardized Precipitation Index. J. Earth Sci. Clim. Chang. 2018, 9, 457. [Google Scholar] [CrossRef]
- Bangladesh Bureau of Statistics (BBS). Bangladesh Disaster-related Statistics 2015 Climate Change and Natural Disaster Perspectives; Ministry of Planning, Government of the People’s Republic of Bangladesh: Dhaka, Bangladesh, 2015.
- Paul, B.K. Coping mechanisms practiced by drought victims (1994/95) in North Bengal, Bangladesh. Appl. Geogr. 1998, 18, 355–373. [Google Scholar] [CrossRef]
- Habiba, U.; Hassan, A.W.R.; Shaw, R. Livelihood Adaptation in the Drought Prone Areas of Bangladesh. Climate Change Adaptation Actions in Bangladesh; Springer: Tokyo, Japan, 2013; pp. 227–252. ISBN 978-4-431-54248-3. [Google Scholar]
- Shahid, S. Recent trends in the climate of Bangladesh. Clim. Res. 2010, 42, 185–193. [Google Scholar] [CrossRef]
- Climate Change Cell (CCC). Characterizing Long-Term Changes of Bangladesh Climate in the Context of Agriculture and Irrigation; Department of Environment, Ministry of Environment and Forests, Government of the People’s Republic of Bangladesh: Dhaka, Bangladesh, 2009.
- WARPO-EGIC. An Atlas of Selected Maps and Spatial Data in Bangladesh; Water Resources Planning Organization: Dhaka, Bangladesh; Environmental and Geographic Information Center: Dhaka, Bangladesh, 1996. [Google Scholar]
- Rahman, A.A.; Alam, M.; Alam, S.S.; Uzzaman, M.R.; Rashid, M.; Rabbani, G. Risks, Vulnerability, and Adaptation in Bangladesh; UNDP Human Development Report; Bangladesh Centre for Advanced Studies (BCAS): Dhaka, Bangladesh, 2008. [Google Scholar]
- Habiba, U.; Shaw, R.; Hassan, A.W. Drought Risk and Reduction Approaches in Bangladesh. In Disaster Risk Reduction Approaches in Bangladesh, Disaster Risk Reduction; Springer: Tokyo, Japan, 2013; pp. 131–164. [Google Scholar]
- Wambua, R.M.; Mutua, B.M.; Raude, J.M. Performance of Standardized Precipitation Index (SPI) and Effective Drought Index (EDI) in Drought forecasting using Artificial Neural Networks (ANNs) for upper Tana River basin, Kenya. Int. J. Eng. Res. Technol. 2014, 3, 547–556. [Google Scholar]
- Kumar, C.K.; Chandola, V.K.; Kumar, R. Meteorological Drought Characterization Using Effective Drought Index (EDI) for Banswara District (Rajasthan), India. Int. J. Curr. Microbiol. App. Sci. 2018, 7, 3407–3416. [Google Scholar] [CrossRef]
- Deo, R.C.; Sahin, M. Application of the extreme learning machine algorithm for the prediction of monthly Effective Drought Index in eastern Australia. Atmos. Res. 2015, 153, 512–525. [Google Scholar] [CrossRef]
- Morid, S.; Smakhtin, V.; Bagherzadeh, K. Drought forecasting using artificial neural networks and time series of drought indices. Int. J. Climatol. 2007, 27, 2103–2111. [Google Scholar] [CrossRef]
- Smakhtin, V.U.; Hughes, D.A. Review, Automated Estimation, and Analyses of Drought Indices in South Asia; Working Paper 83; International Water Management Institute: Colombo, Sri Lanka, 2004. [Google Scholar]
- Kamruzzaman, M.; Jang, M.-W.; Cho, J.; Hwang, S. Future Changes in Precipitation and Drought Characteristics over Bangladesh under CMIP5 Climatological Projections. Water 2019, 11, 2219. [Google Scholar] [CrossRef]
- Patel, N.R.; Chopra, P.; Dadhwal, V.K. Analyzing spatial patterns of meteorological drought using standardized precipitation index. Meteorol. Appl. 2007, 14, 329–336. [Google Scholar] [CrossRef]
- Ali, M.G.; Younes, K.; Esmaeil, A.; Fatemeh, T. Assessment of geostatistical methods for spatial analysis of SPI and EDI drought indices. World Appl. Sci. J. 2011, 15, 474–482. [Google Scholar]
- Attorre, F.; Alfo, M.; De Sanctis, M.; Francesconi, F.; Bruno, F. Comparison of interpolation methods for mapping climatic and bioclimatic variables at regional scale. Int. J. Climatol. 2007, 27, 1825–1843. [Google Scholar] [CrossRef] [Green Version]
- Lu, G.Y.; Wong, D.W. An adaptive inverse-distance weighting spatial interpolation technique. Comput. Geosci. 2008, 34, 1044–1055. [Google Scholar] [CrossRef]
- Moazami, M.; Feiznia, S.; Kholghi, M.; Malekian, A. Using SPI and PN indices for determination of drought in the Fars Province. J. Appl. Hydrol. 2015, 2, 1–9. [Google Scholar]
- Burrough, P.A. Soil information systems. In Geographical Information Systems: Principles and Applications; Goodchild, M.F., Maguire, D.J., Rhind, D.W., Eds.; Longman/New York, John Wiley & Sons Inc.: Harlow, UK, 1991; Volume 2, pp. 153–164. [Google Scholar]
- Franke, R.; Nielson, G. Scattered data interpolation and applications: A tutorial and survey. In Geometric Modelling: Methods and Applications; Hagen, H., Roller, D., Eds.; Springer: Berlin, Germany, 1991; pp. 131–160. [Google Scholar]
- Watson, D.F. Contouring: A Guide to the Analysis and Display of Spatial Data; Pergamon: Oxford, UK, 1992. [Google Scholar]
- Mann, H.B. Non-parametric tests against trend. Econometrica 1945, 13, 245–259. [Google Scholar] [CrossRef]
- Kendall, M.G. Rank Correlation Methods; Griffin: London, UK, 1975. [Google Scholar]
- Gocic, M.; Trajkovic, S. Analysis of precipitation and drought data in Serbia over the period 1980–2010. J. Hydrol. 2013, 494, 32–42. [Google Scholar] [CrossRef]
- Hasan, M.A.; Saiful Islam, A.K.M.; Bokhtiar, S.M. Future change of the metrological drought over Bangladesh using high-resolution climate scenarios. In Proceedings of the International Conference on Climate Change Impact and Adaptation (I3CIA-2013), Gazipur, Bangladesh, 15–17 November 2013. [Google Scholar]
- Bangladesh Agricultural Research Council (BARC). New Airport Road; Farmgate: Dhaka, Bangladesh, 2010.
Figure 1.
Location of meteorological station and regions in the study area.

Figure 2.
Elevation map (left) and land use map (right) of Bangladesh.

Figure 3.
(a) Monthly distribution of rainfall four different regions of Bangladesh and. (b) Spatial distribution of rainfall from 1980 to 2015.
Figure 3.
(a) Monthly distribution of rainfall four different regions of Bangladesh and. (b) Spatial distribution of rainfall from 1980 to 2015.

Figure 4.
The schematic illustration of drought characteristics (duration, severity) with EDI time series. (Adopted from Kamruzzaman et al. [47]).
Figure 4.
The schematic illustration of drought characteristics (duration, severity) with EDI time series. (Adopted from Kamruzzaman et al. [47]).

Figure 5.
EDI values calculated from observed rainfall data at (a) northern (5 stations), (b) south-western (9 stations), (c) central (4 stations), and (d) eastern (9 stations) sub-regions of Bangladesh during 1981–2015.
Figure 5.
EDI values calculated from observed rainfall data at (a) northern (5 stations), (b) south-western (9 stations), (c) central (4 stations), and (d) eastern (9 stations) sub-regions of Bangladesh during 1981–2015.

Figure 6.
Spatial distribution of droughts during 1981–2015: (a) Extreme; (b) Severe; (c) Moderate severities.
Figure 6.
Spatial distribution of droughts during 1981–2015: (a) Extreme; (b) Severe; (c) Moderate severities.

Figure 7.
Spatial pattern of drought events during 1981–2015: (a) Extra long-term; (b) Long-term; (c) Medium-term; (d) Short-term drought duration.
Figure 7.
Spatial pattern of drought events during 1981–2015: (a) Extra long-term; (b) Long-term; (c) Medium-term; (d) Short-term drought duration.

Figure 8.
Spatial distribution of seasonal drought in Bangladesh during 1981–2015: Upper row indicates the results for Pre-Kharif season with (a) Extreme; (b) Severe; (c) Moderate Severities, and (d) Observed distribution, middle row shows the results for Kharif season with (e) Extreme; (f) Severe; and (g) Moderate Severities and (h) Observed distribution and bottom row is for the Rabi season with (i) Extreme; (j) Severe; (k) Moderate severities; and (l) Observed distribution. The observed agricultural drought maps (right column) were developed by BARC in 2000 (Source of the observed map: http://maps.barcapps.gov.bd/index.php).


Table 1.
Historical records of drought years and drought-affected areas and the results of drought detection using the Effective Drought Index (EDI).
Table 1.
Historical records of drought years and drought-affected areas and the results of drought detection using the Effective Drought Index (EDI).
| Year | Historical Major Drought * | EDI Based Major Drought (Present Study) | ||
|---|---|---|---|---|
| Recorded | Affected Areas | Classified | Affected Areas | |
| 1981 | recorded | WC | Partially identified † | ER |
| 1982 | recorded | WC | Partially identified | SWR |
| 1983 | recorded | WC | Partially identified | NR |
| 1984 | recorded | WC | Not identified | |
| 1985 | recorded | WC | Partially identified | ER |
| 1986 | recorded | WC | Partially identified | SWR and ER |
| 1987 | recorded | WC | Partially identified | ER |
| 1988 | recorded | WC | Not identified | - |
| 1989 | recorded | ER, SWR, and CR | Identified | ER, SWR, and CR |
| 1992 | recorded | WC | Identified | WC |
| 1993 | - | - | Identified | SWR and ER |
| 1994 | recorded | NR, SWR, and CR | Identified | WC |
| 1995 | recorded | NR, SWR, and CR | Identified | WC |
| 1997 | - | - | - | - |
| 1999 | - | - | Identified | ER |
| 2002 | - | - | - | - |
| 2003 | - | - | Identified | CR |
| 2004 | - | - | Identified | SWR |
| 2006 | recorded | NR | Identified | NR |
| 2007 | - | - | Identified | NR |
| 2009 | recorded | NR, SWR, and CR | Identified | CR |
| 2010 | recorded | NR, SWR, and CR | Identified | NR, SWR, and CR |
| 2011 | recorded | NR, SWR, and CR | Partially identified | NR and CR |
| 2012 | recorded | NR, SWR, and CR | Partially identified | NR and CR |
| 2013 | recorded | NR, SWR, and CR | Identified | NR, SWR, and CR |
| 2014 | recorded | SWR, CR, and ER | Identified | WC |
| 2015 | recorded | SWR | Identified | SWR |
WC = Whole country, NR = Northern region, SWR = South-western region, CR = Central region, ER = Eastern region. * Observation Source: Banglapedia [6], Dash et al. [17], BBS [34], CCC [38], WARPO-EGIC [39], Personal communication with BMD staff (2017); † Partially indicates the cases that EDI detected the recorded partial areas.
Table 2.
Drought classification based on severity [26].
Table 2.
Drought classification based on severity [26].
| EDI Value | Category |
|---|---|
| −1.00 to −1.49 | Moderate Drought |
| −1.50 to −1.99 | Severe Drought |
| −2 or less | Extreme Drought |
Table 3.
Drought classification based on drought duration.
| Duration (Months) | Category |
|---|---|
| Months ≤ 3 | Short-term |
| 6 ≥ Month > 3 | Medium-term |
| 12 ≥ Month > 6 | Long-term |
| Months > 12 | Extra long-term |
Table 4.
Mann-Kendall test results for EDI.
| Northern Region (R1) | South-Western Region (R2) | Central Region (R3) | Eastern Region (R4) | |
|---|---|---|---|---|
| Z value | −5.89 | −2.65 | −7.91 | −2.70 |
| Types of trend | decreasing | decreasing | decreasing | decreasing |
The significant trend at 95% confidence level.
Table 5.
Regional drought events by severity in seven quinquennial periods from 1981 to 2015.
| Spatial Range | Northern Region (R1) | South-Western Region (R2) | Central Region (R3) | Eastern Region (R4) | |
|---|---|---|---|---|---|
| Classification (Severity) | |||||
| No. of Station | 5 | 9 | 4 | 9 | |
| 1981 to 1985 | Moderate | 1.00 (1.23%) | 2.22 (2.72%) | 1.50 (1.84%) | 1.11 (1.36%) |
| Severe | 0.60 (0.74%) | 0.44 (0.54%) | 0.50 (0.61%) | - | |
| Extreme | 0.40 (0.49%) | 0.33 (0.41%) | 0.25 (0.31%) | 1.11 (1.36%) | |
| 1986 to 1990 | Moderate | 1.60 (1.96%) | 2.00 (2.45%) | 1.00 (1.23%) | 1.44 (1.77%) |
| Severe | 0.20 (0.25%) | 1.00 (1.23%) | 0.75 (0.92%) | 0.78 (0.95%) | |
| Extreme | - | 0.22 (0.27%) | - | 0.11 (0.14%) | |
| 1991 to 1995 | Moderate | 1.60 (1.96%) | 1.33 (1.63%) | 2.00 (2.45%) | 1.56 (1.91%) |
| Severe | 0.80 (0.98%) | 0.56 (0.68%) | 1.25 (1.53%) | 0.56 (0.68%) | |
| Extreme | 0.80 (0.98%) | 0.56 (0.68%) | - | 0.22 (0.27%) | |
| 1995 to 2000 | Moderate | 1.80 (2.21%) | 2.44 (3.00%) | 2.50 (4.90%) | 1.11 (1.36%) |
| Severe | 0.20 (0.25%) | 0.56 (0.68%) | 0.5 (1.23%) | 0.11 (0.14%) | |
| Extreme | - | - | - | - | |
| 2001 to 2005 | Moderate | 1.60 (1.96%) | 1.78 (2.18%) | 4.00 (4.90%) | 1.89 (2.31%) |
| Severe | 0.20 (0.25%) | 0.89 (1.09%) | 1.00 (1.23%) | 0.22 (0.27%) | |
| Extreme | 0.20 (0.25%) | 0.11 (0.14%) | - | - | |
| 2006 to 2010 | Moderate | 1.80 (2.21%) | 2.44 (3.00%) | 2.75 (3.37%) | 1.89 (2.31%) |
| Severe | 1.00 (1.23%) | 1.00 (1.23%) | 1.25 (1.53%) | 0.22 (0.27%) | |
| Extreme | 0.80 (0.98%) | 0.22 (0.27%) | - | - | |
| 2011 to 2015 | Moderate | 2.80 (3.43%) | 3.44 (4.22%) | 2.75 (3.37%) | 1.67 (2.04%) |
| Severe | 1.40 (1.72%) | 1.00 (1.23%) | 1.00 (1.23%) | 0.78 (0.95%) | |
| Extreme | 0.40 (0.49%) | 0.89 (1.09%) | 0.75 (0.92%) | 0.33 (0.41%) | |
| Average number of regional drought (1981–2015) | 19.20 (±5.36) | 23.44 (±8.40) | 23.75 (±3.30) | 15.22 (±7.89) | |
Parenthesis are expressed as the percentage of total drought events that occurred during the study period.
Table 6.
Regional drought events by duration in seven quinquennial periods from 1981 to 2015.
| Spatial Range | Northern Region (R1) | South-Western Region (R2) | Central Region (R3) | Eastern Region (R4) | |
|---|---|---|---|---|---|
| Classification (Duration) | |||||
| No. of Station | 5 | 9 | 4 | 9 | |
| 1981 to 1985 | Short-term | 1.00 (1.23%) | 2.33 (2.86%) | 1.50 (1.84%) | 1.44 (1.77%) |
| Medium-term | 0.20 (0.25%) | 0.44 (0.54%) | 0.25 (0.31%) | 0.11 (0.14%) | |
| Long-term | 0.60 (0.74%) | 0.22 (0.27%) | 0.50 (0.61%) | 0.11 (0.41%) | |
| Extra long-term | 0.20 (0.25%) | - | - | 0.22 (0.27%) | |
| 1986 to 1990 | Short-term | 1.40 (1.72%) | 2.22 (2.72%) | 1.00 (1.23%) | 1.67 (2.04%) |
| Medium-term | 0.20 (0.25%) | 0.56 (0.68%) | 0.50 (0.61%) | 0.22 (0.27%) | |
| Long-term | 0.20 (0.25%) | 0.44 (0.54%) | 1.00 (1.23%) | 0.22 (0.27%) | |
| Extra long-term | - | - | - | 0.22 (0.27%) | |
| 1991 to 1995 | Short-term | 2.00 (2.21%) | 1.22 (1.50%) | 1.25 (1.53%) | 1.33 (1.64%) |
| Medium-term | 0.40 (0.49%) | 0.33 (0.41%) | 0.50 (0.61%) | 0.11 (0.14%) | |
| Long-term | 0.40 (0.49%) | 0.89 (1.09%) | - | 0.11 (0.95%) | |
| Extra long-term | 0.40 (0.49%) | - | 0.25 (0.31%) | 0.78 (0.95%) | |
| 1996 to 2000 | Short-term | 1.40 (1.72%) | 2.56 (3.13%) | 2.5 (3.06%) | 1.22 (1.50%) |
| Medium-term | 0.20 (0.25%) | 0.22 (0.27%) | 0.50 (0.61%) | - | |
| Long-term | 0.40 (0.49%) | 0.22 (0.27%) | - | - | |
| Extra long-term | - | - | - | 0.11 (0.14%) | |
| 2001 to 2005 | Short-term | 1.60 (1.96%) | 2.33 (2.86%) | 4.00 (4.91%) | 2.11 (2.59%) |
| Medium-term | - | 0.11 (0.14%) | 0.50 (0.61%) | - | |
| Long-term | 0.40 (0.49%) | 0.22 (0.27%) | 0.25 (0.31%) | - | |
| Extra long-term | - | 0.11 (0.14%) | 0.25 (0.31%) | - | |
| 2006 to 2010 | Short-term | 1.40 (1.72%) | 3.22 (3.95%) | 3.25 (3.98%) | 1.56 (1.91%) |
| Medium-term | 1.20 (1.47%) | 0.33 (0.41%) | - | 0.44 (0.41%) | |
| Long-term) | 0.60 (0.74%) | - | 0.50 (0.61%) | 0.44 (0.41%) | |
| Extra long-term | 0.40 (0.49%) | 0.11 (0.14%) | 0.25 (0.31%) | 0.33 (0.14%) | |
| 2011 to 2015 | Short-term | 2.60 (3.19%) | 4.47 (4.76%) | 2.75 (3.37%) | 2.00 (2.45%) |
| Medium-term | 0.80 (0.98%) | 0.68 (0.68%) | - | 0.33 (0.41%) | |
| Long-term | 1.00 (1.23%) | 0.95 (0.95%) | 0.75 (0.92%) | 0.33 (0.41%) | |
| Extra long-term | 0.20 (0.25%) | 0.14 (0.14%) | 1.25 (1.53%) | 0.44 (0.54%) | |
| Average number of drought (1981–2015) | 19.20 (±5.36) | 23.44 (±8.40) | 23.75 (±3.30) | 15.22 (±7.89) | |
Parenthesis are expressed as the percentage of total drought events that occurred during the study period.
Table 7.
Trends per decade regional series of the monthly drought area.
| Region | Drought Category | Drought Area Increase/(-)Decrease (% per Decade) During 1981–2015 | |||||||||||
|---|---|---|---|---|---|---|---|---|---|---|---|---|---|
| January | February | March | April | May | June | July | August | September | October | November | December | ||
| R1 | Extreme | 0.15 | 0.17 | 0.22 | 0.01 | −0.07 | −0.02 | 0.12 | 0.12 | 0.24 | 0.05 | 0.12 | 0.09 |
| Severe | 0.33 | 0.30 | 0.55 | 0.10 | 0.11 | 0.14 *** | 0.87 * | 0.77 ** | 0.40 | −0.18 | −0.02 | 0.06 | |
| Moderate | 1.61 | 1.05 | 1.37 * | 1.15 | 2.21 *** | 0.36 * | 1.69 | 1.46 * | 1.12 | 1.63 * | 1.68 * | 1.20 * | |
| Total | 2.09 | 1.52 | 2.14 * | 1.26 | 2.25 * | 0.48 ** | 2.68 | 2.35 ** | 1.76 | 1.50 | 1.78 | 1.35 | |
| R2 | Extreme | −0.02 | 0.02 | 0.09 | 0.04 | 0.08 | 0.02 | 0.03 | 0.06 | 0.08 | 0.05 | 0.08 | 0.04 |
| Severe | 0.03 | 0.25 | 0.34 | 0.52 | 0.43 | 0.24 ** | 0.22 | 0.07 | 0.40 | 0.03 | 0.05 | 0.05 | |
| Moderate | 0.18 | 0.45 | 1.34 | 1.30 * | 1.75 *** | 0.89 | 0.55 | 0.44 | 0.17 | 0.36 | 0.42 | 0.14 | |
| Total | 0.19 | 0.72 | 1.77 | 1.86 | 2.26 ** | 1.15 | 0.8 | 0.57 | 0.65 | 0.44 | 0.55 | 0.23 | |
| R3 | Extreme | 0.05 * | 0.07 ** | 0.13 *** | 0.36 | 0.32 * | 0.00 | 0.08 * | 0.00 | 0.05 * | 0.07 * | 0.03 | 0.04 |
| Severe | 0.71 ** | 0.81 ** | 1.38 ** | 0.84 | 0.66 ** | 0.49 ** | 1.07 *** | 0.31 * | 1.21 ** | 0.59 | 0.56 | 0.62 | |
| Moderate | 1.60 * | 1.76 * | 2.15 ** | 2.71 *** | 3.46 *** | 1.62 ** | 2.08 *** | 1.30 | 0.53 | 1.25 | 1.30 | 1.37 | |
| Total | 2.36 ** | 2.64 ** | 3.66 *** | 3.91 *** | 4.44 *** | 2.11 ** | 3.23 *** | 1.61 * | 1.79 | 1.91 * | 1.89 | 2.03 * | |
| R4 | Extreme | −0.32 ** | −0.34 ** | −0.32 ** | −0.12 * | −0.13 ** | −0.07 ** | −0.05 | −0.08 * | −0.09 * | −0.13 * | −0.15 ** | −0.14 ** |
| Severe | −0.39 *** | −0.39 *** | −0.39 ** | 0.01 | −0.31 | −0.23 ** | −0.01 | −0.24 | −0.14 * | −0.3 ** | −0.35 ** | −0.33 ** | |
| Moderate | −0.65 | −0.18 | 0.65 | 1.33 * | 0.96 | −0.25 | 0.20 | −1.14 | −0.59 | −0.98 | −0.74 | −0.52 | |
| Total | −1.36 | −0.91 | −0.06 | 1.21 | 0.52 | −0.55 | 0.15 | −1.46 | −0.82 | −1.41 | −1.24 | −0.99 | |
Level of Significance 0.001 ‘***’, 0.01 ‘**’, 0.05 ′*’.
© 2019 by the authors. Licensee MDPI, Basel, Switzerland. This article is an open access article distributed under the terms and conditions of the Creative Commons Attribution (CC BY) license (http://creativecommons.org/licenses/by/4.0/).
Share and Cite
MDPI and ACS Style
Kamruzzaman, M.; Hwang, S.; Cho, J.; Jang, M.-W.; Jeong, H. Evaluating the Spatiotemporal Characteristics of Agricultural Drought in Bangladesh Using Effective Drought Index. Water 2019, 11, 2437. https://doi.org/10.3390/w11122437
AMA Style
Kamruzzaman M, Hwang S, Cho J, Jang M-W, Jeong H. Evaluating the Spatiotemporal Characteristics of Agricultural Drought in Bangladesh Using Effective Drought Index. Water. 2019; 11(12):2437. https://doi.org/10.3390/w11122437
Chicago/Turabian StyleKamruzzaman, Mohammad, Syewoon Hwang, Jaepil Cho, Min-Won Jang, and Hanseok Jeong. 2019. "Evaluating the Spatiotemporal Characteristics of Agricultural Drought in Bangladesh Using Effective Drought Index" Water 11, no. 12: 2437. https://doi.org/10.3390/w11122437
Note that from the first issue of 2016, this journal uses article numbers instead of page numbers. See further details here.