Assessment of Retrofitted Ramped Weirs to Improve Passage of Potamodromous Fish

 , , , , ,
  and
and 
Abstract
:1. Introduction
2. Materials and Methods
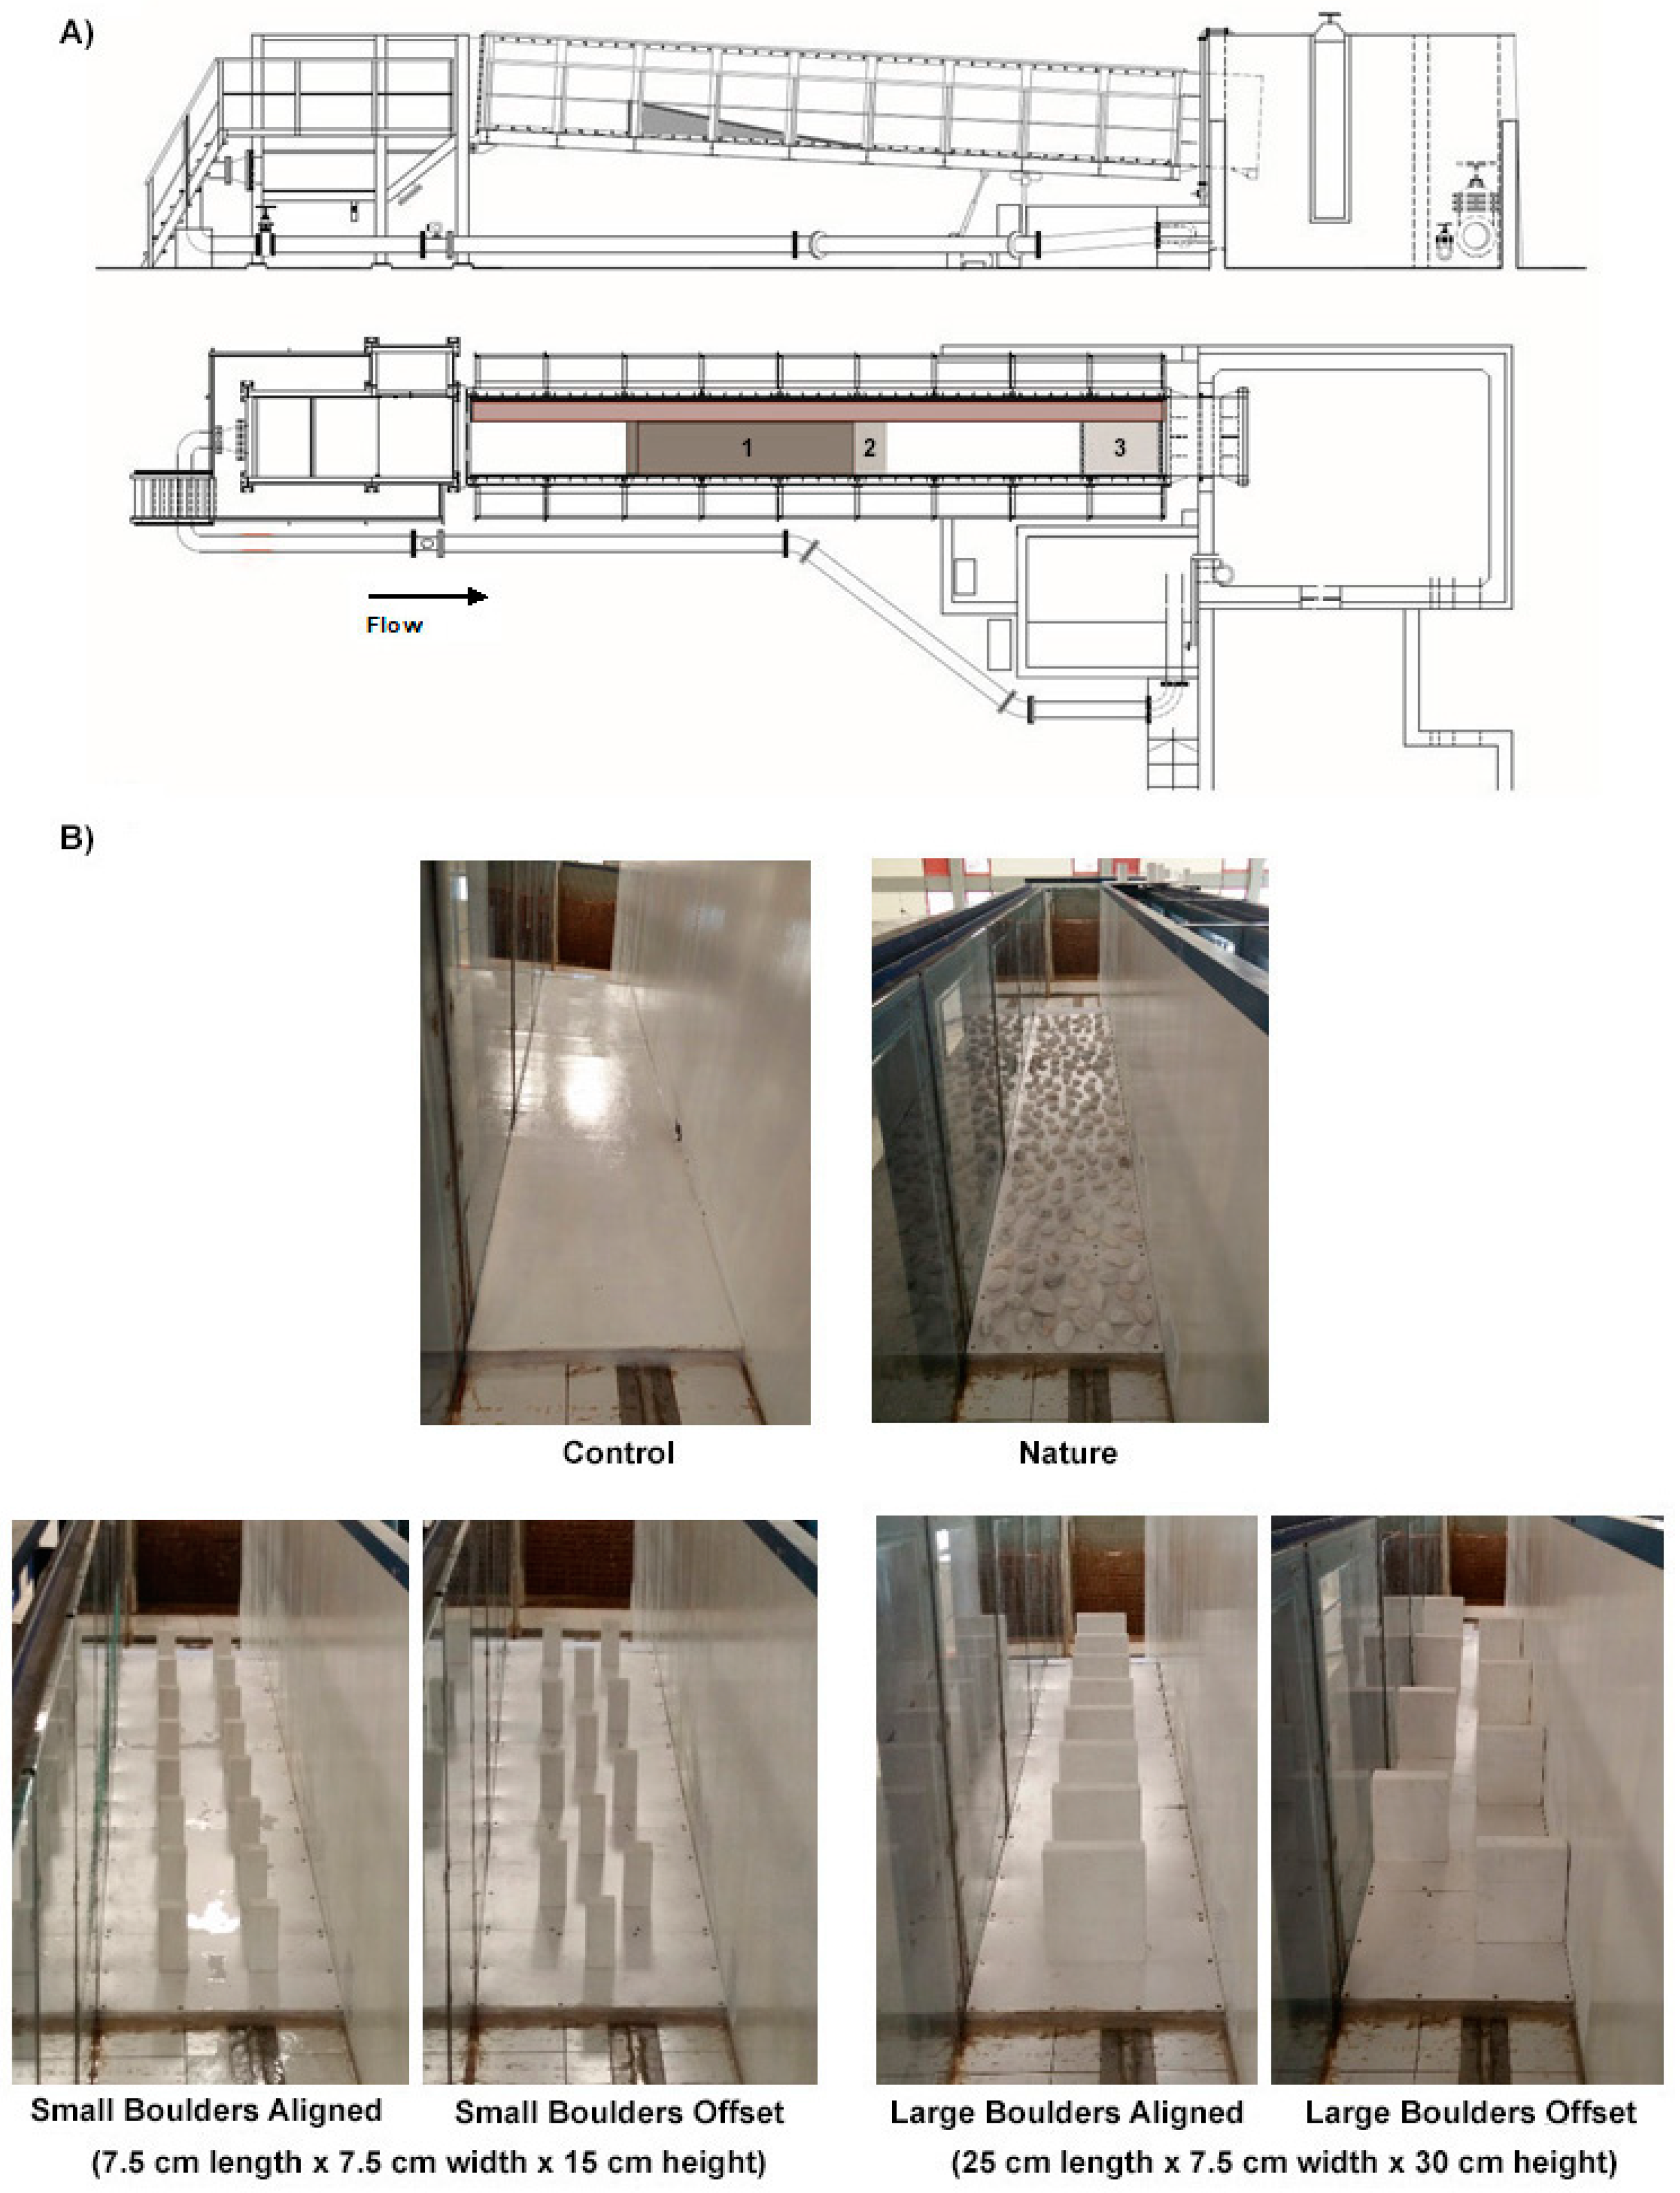
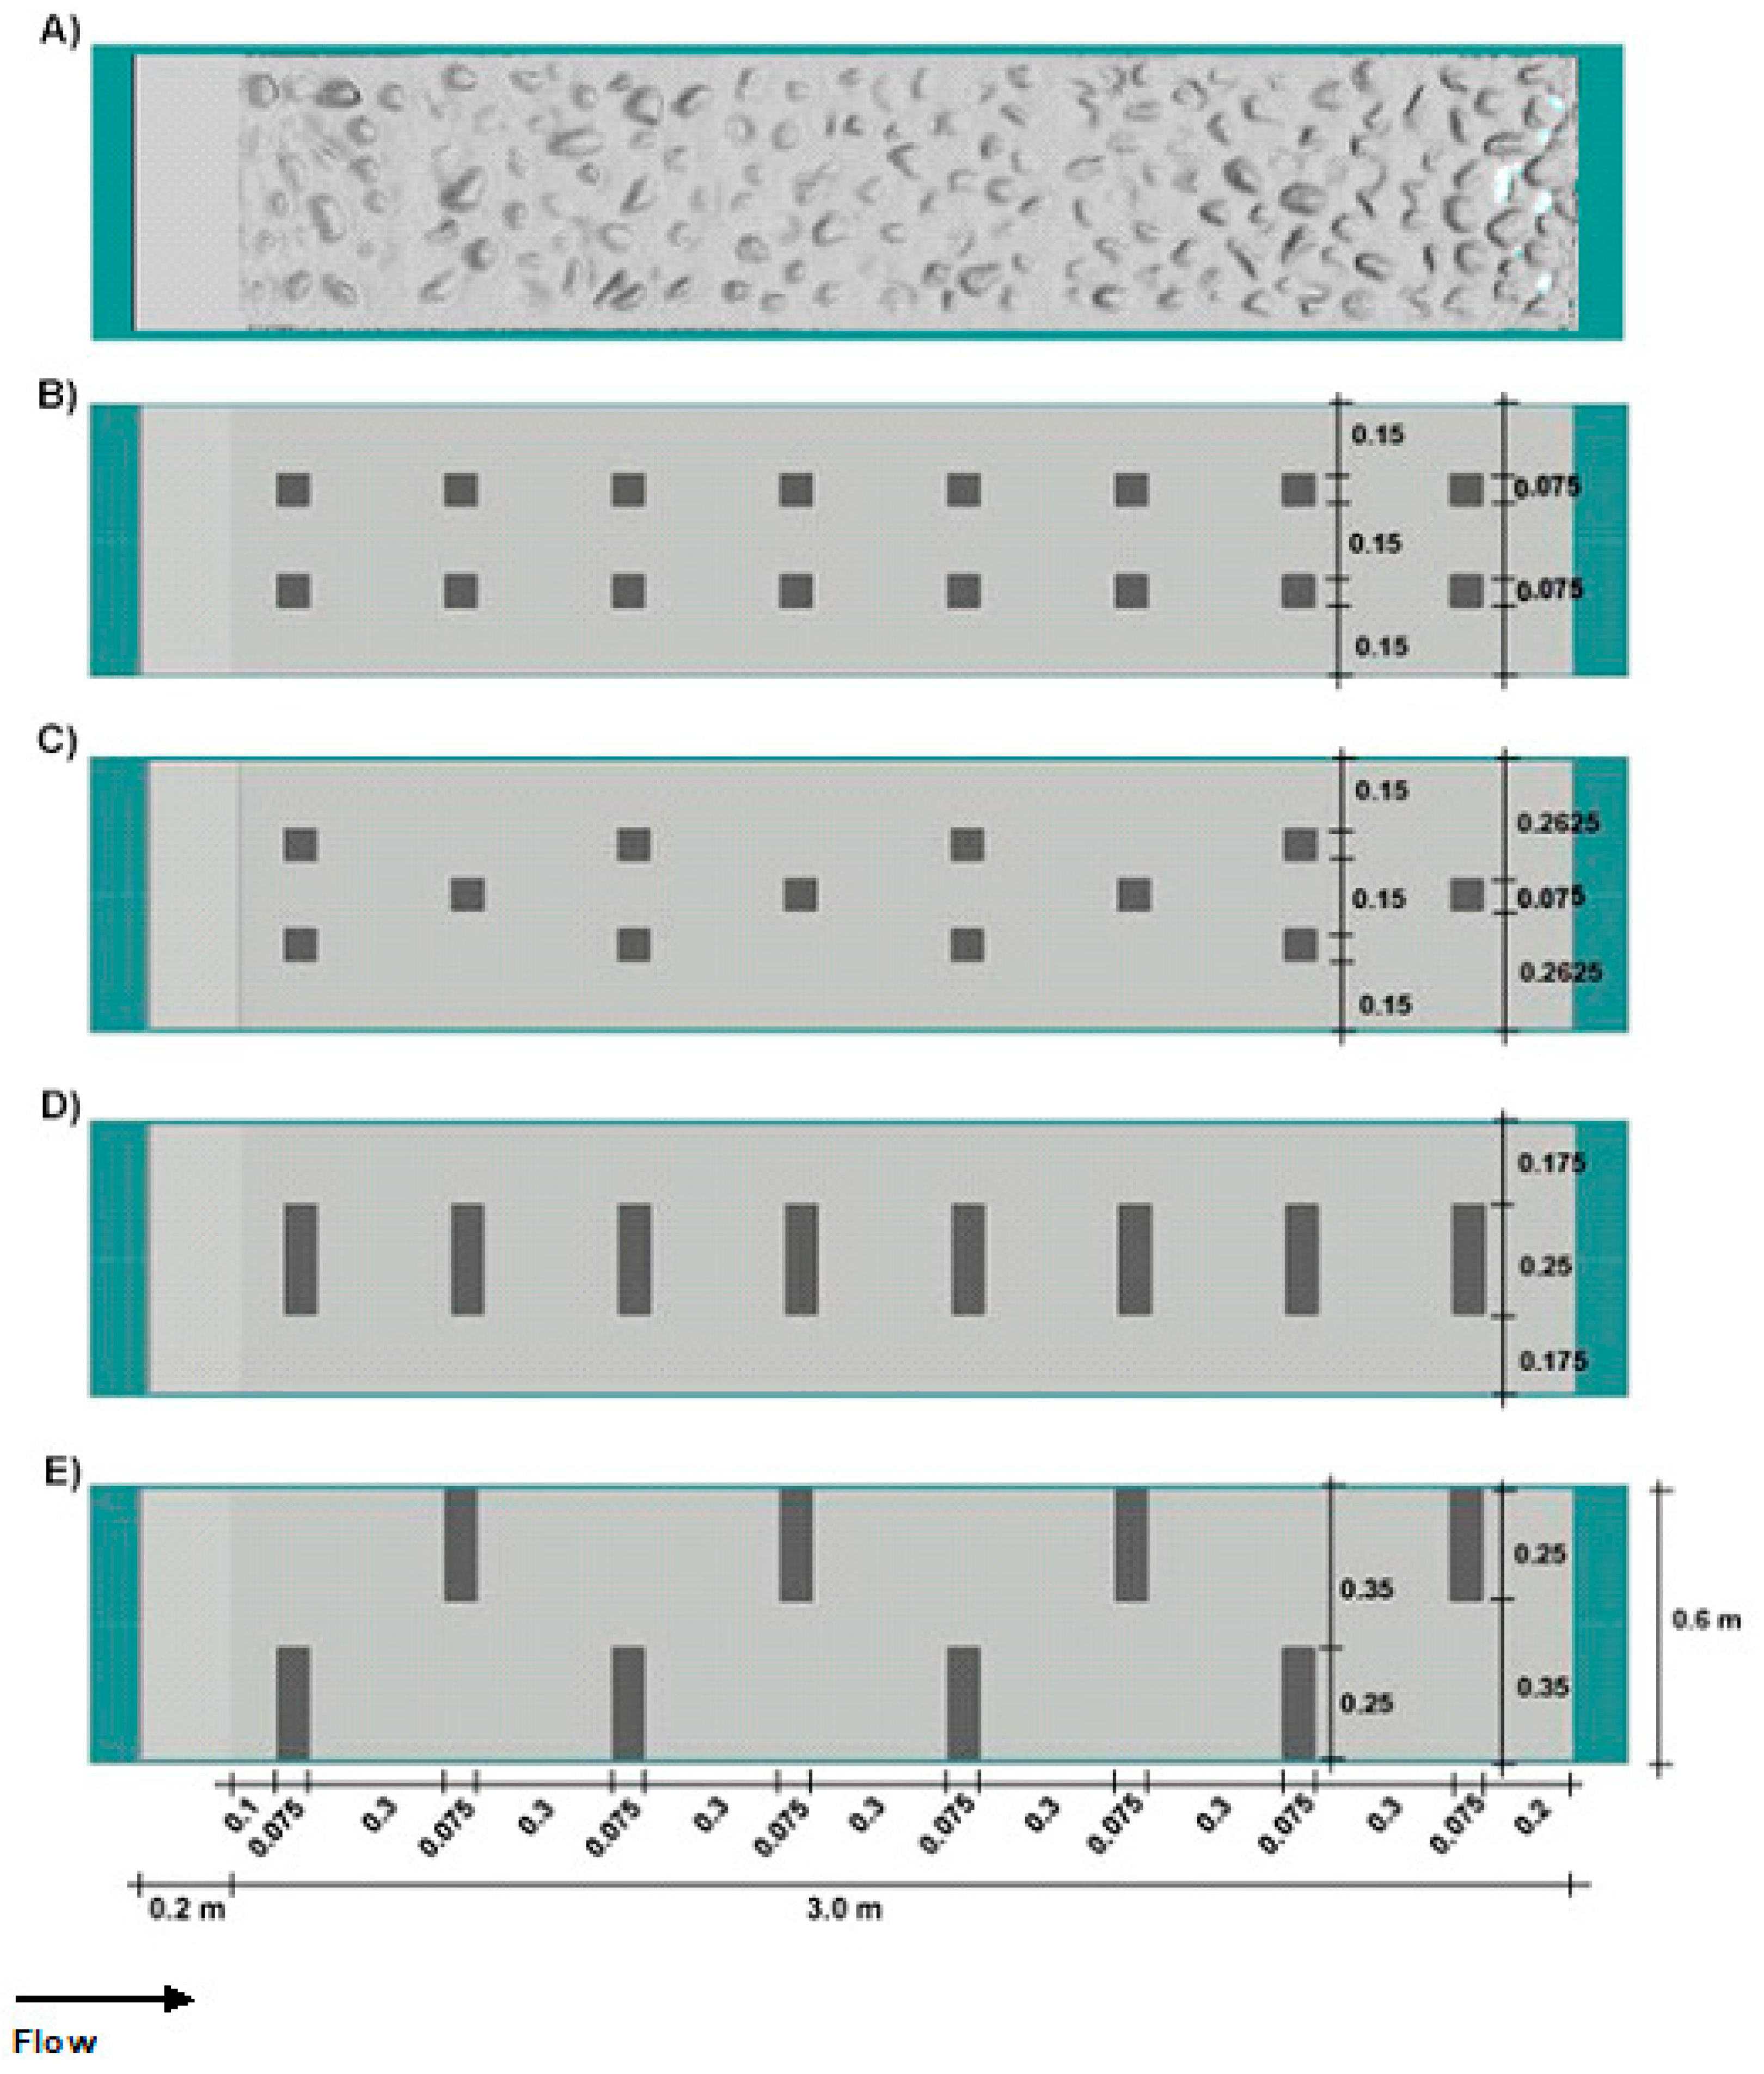
2.1. Experimental Facility
2.2. Fish Capture and Holding
2.3. Fish Experiments
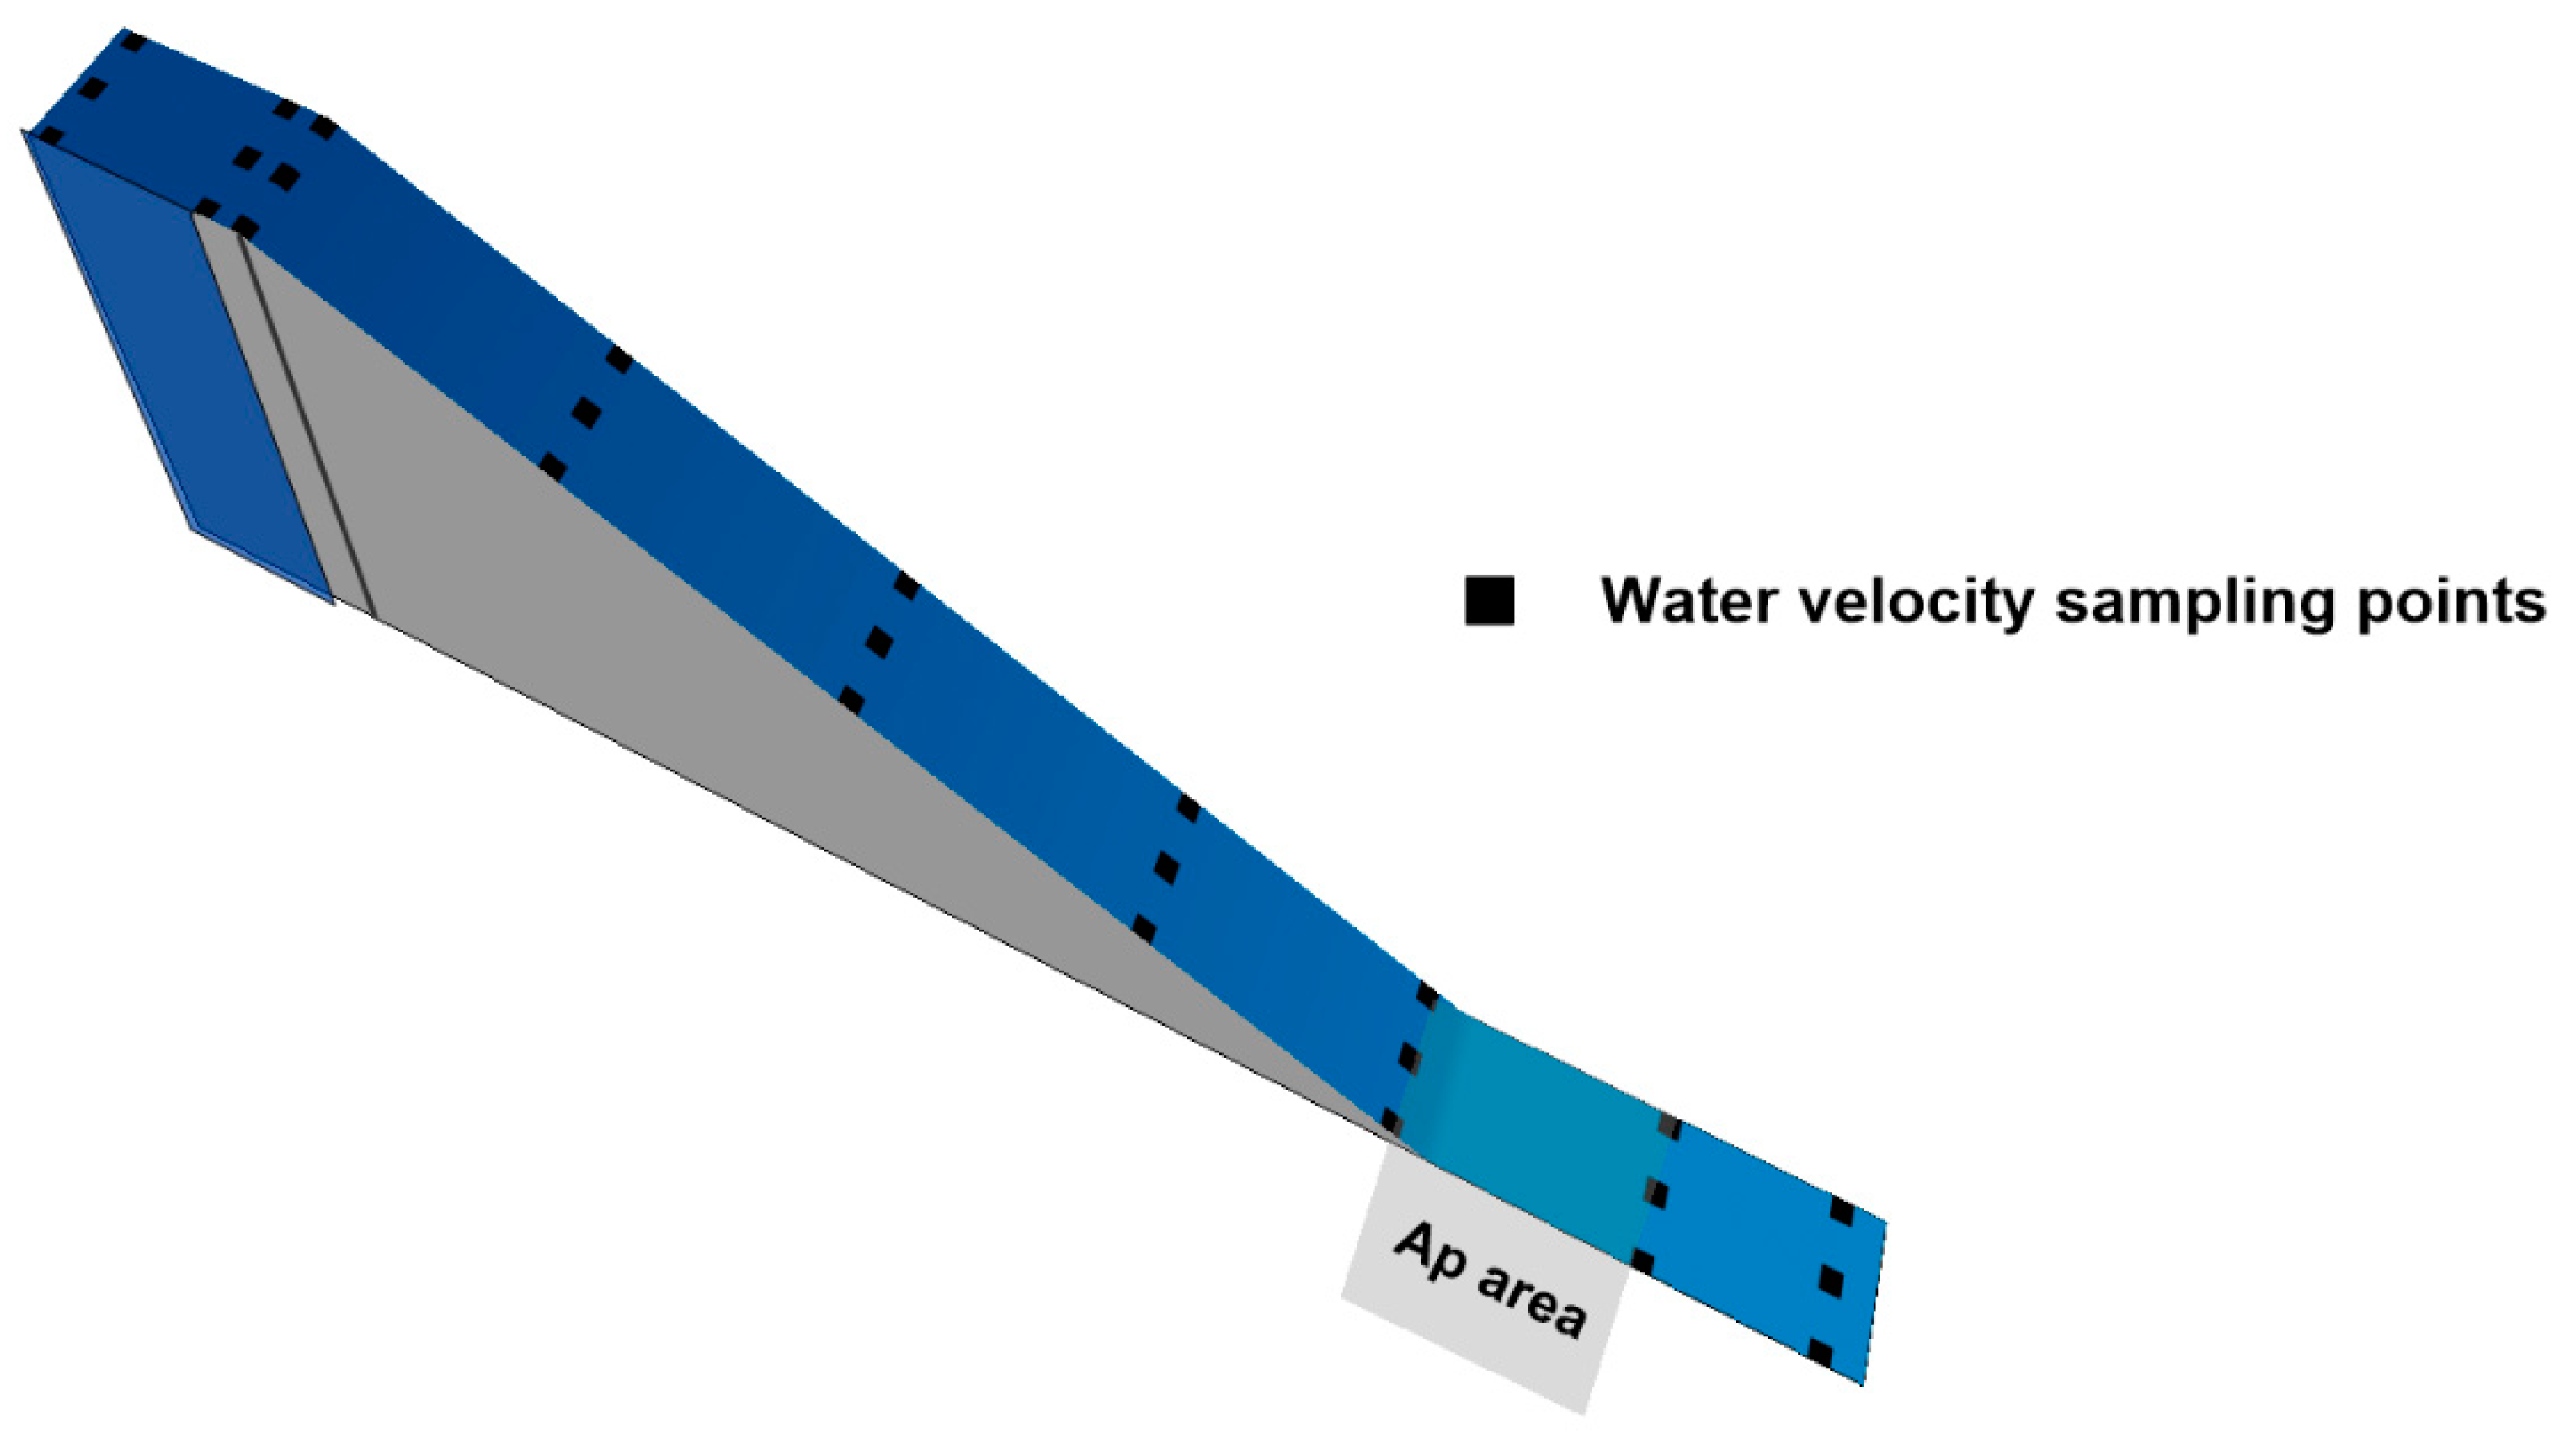
2.4. Hydrodynamic Modelling
3. Results
3.1. Fish Movements
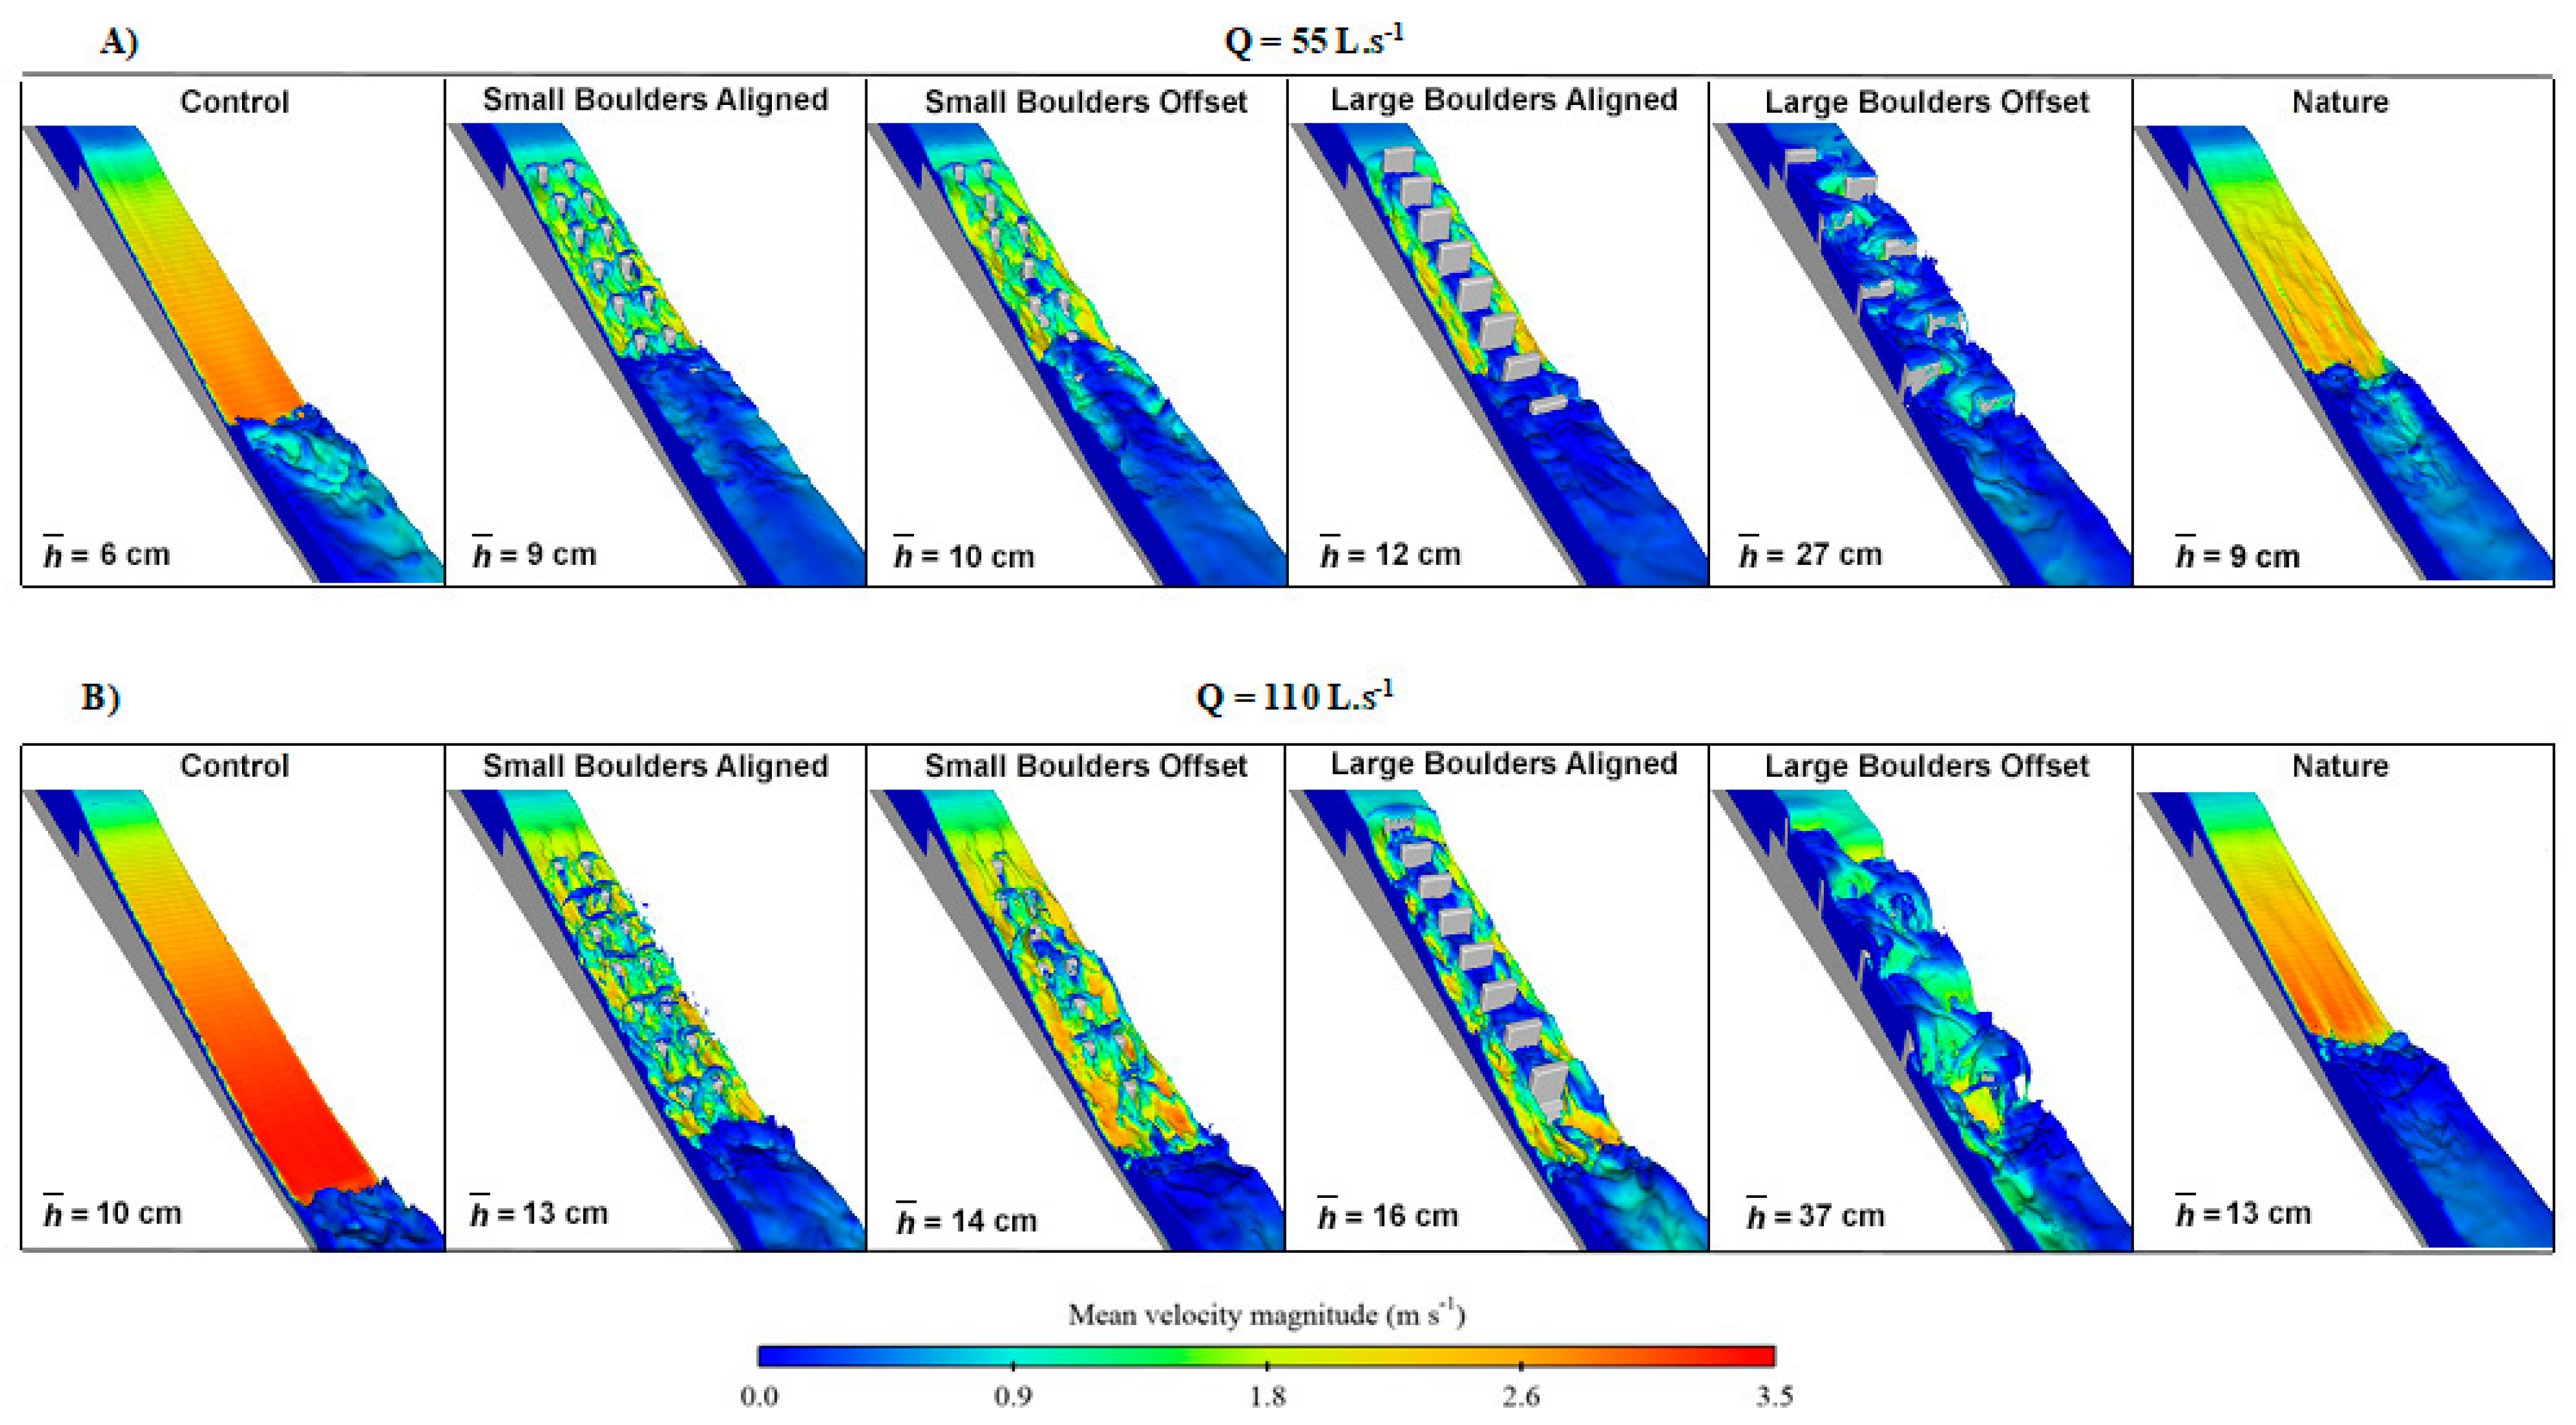
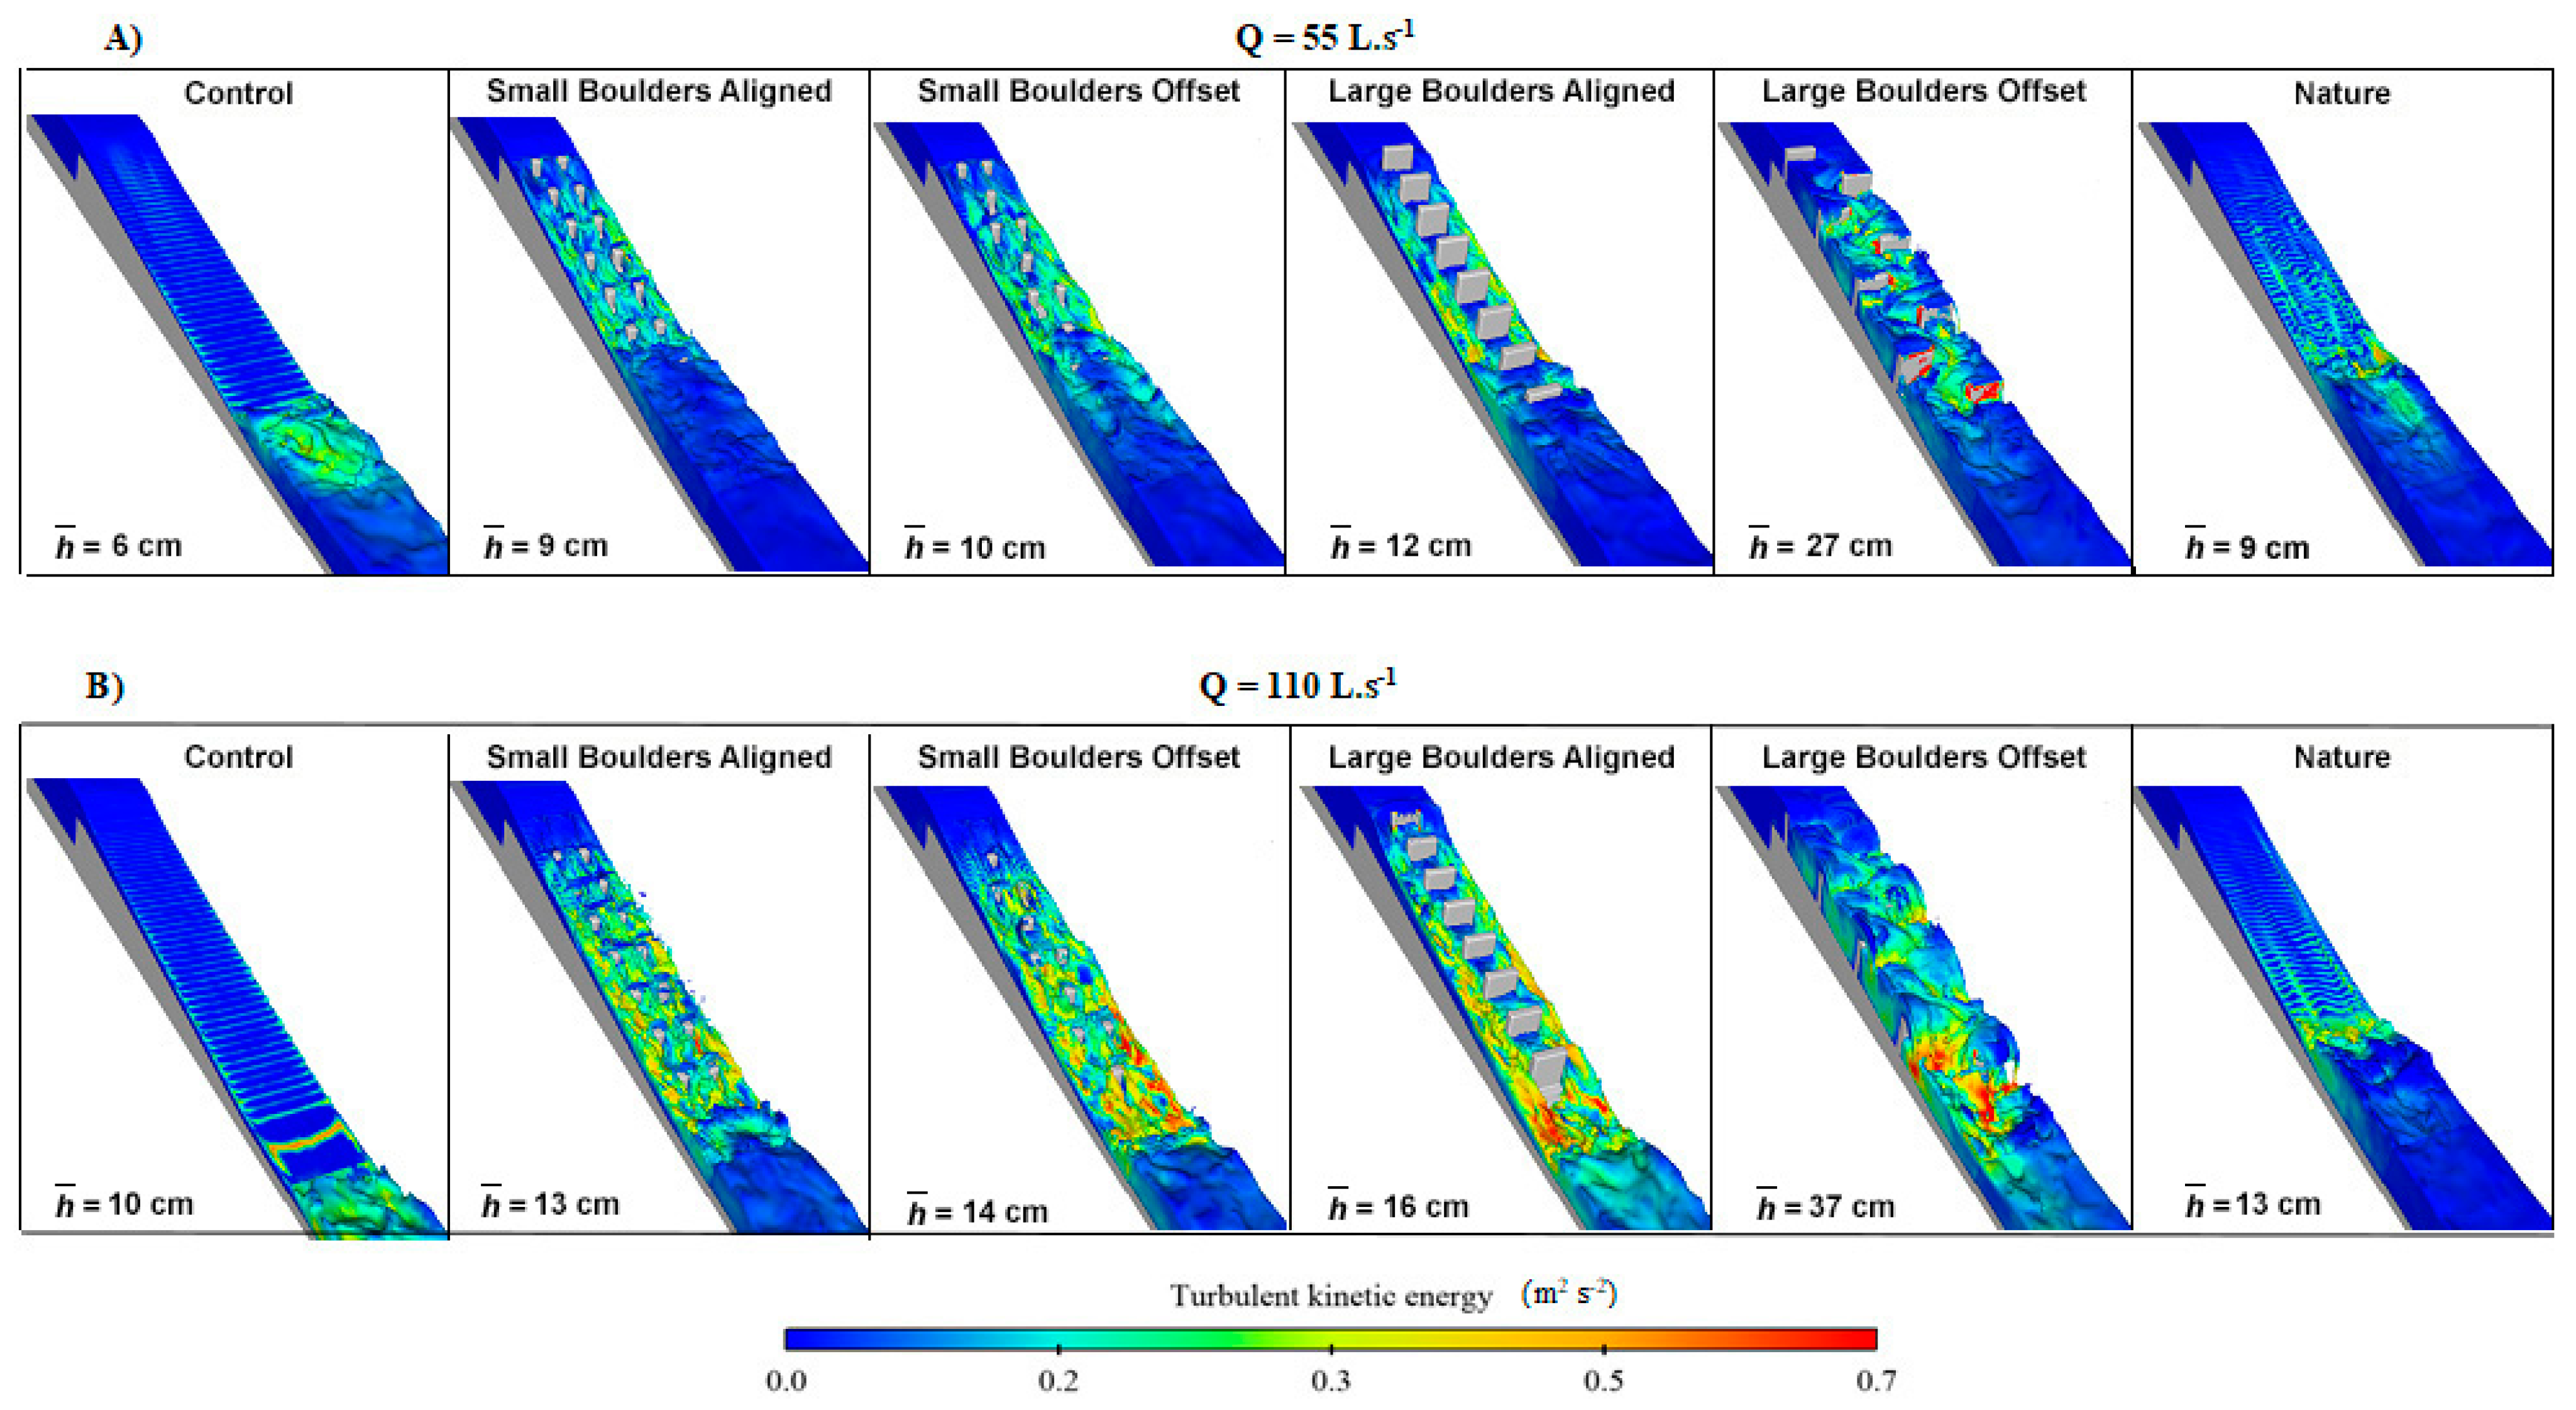
3.2. Hydrodynamics
4. Discussion
5. Conclusions
Author Contributions
Funding
Acknowledgments
Conflicts of Interest
References
- Nilsson, C.; Reidy, C.A.; Dynesius, M.; Revenga, C. Fragmentation and flow regulation of the world’s large river systems. Science 2005, 308, 405–408. [Google Scholar] [CrossRef] [PubMed]
- Gozlan, R.E.; Karimov, B.K.; Zadereev, E.; Kuznetsova, D.; Brucet, S. Status, trends, and future dynamics of freshwater ecosystems in Europe and Central Asia. Inland Waters 2019, 9, 78–94. [Google Scholar] [CrossRef]
- Reid, A.J.; Carlson, A.K.; Creed, I.F.; Eliason, E.J.; Gell, P.A.; Johnson, P.T.; Kidd, K.A.; MacCormack, T.J.; Olden, J.D.; Ormerod, S.J.; et al. Emerging threats and persistent conservation challenges for freshwater biodiversity. Biol. Rev. 2019, 94, 849–873. [Google Scholar] [CrossRef] [PubMed]
- Lucas, M.C.; Bubb, D.H.; Jang, M.; Ha, K.; Masters, J.E.G. Availability of and access to critical habitats in regulated rivers: Effects of low-head barriers on threatened lampreys. Freshwater Biol. 2009, 54, 621–634. [Google Scholar] [CrossRef]
- Baudoin, J.M.; Burgun, V.; Chanseau, M.; Larinier, M.; Ovidio, M.; Sremski, W.; Steinbach, P.; Voegtle, B. Assessing the Passage of Obstacles by Fish. Concepts, Design and Application; Onema: Paris, France, 2014; p. 200. [Google Scholar]
- Branco, P.; Amaral, S.D.; Ferreira, M.T.; Santos, J.M. Do small barriers affect the movement of freshwater fish by increasing residency? Sci. Total Environ. 2017, 581–582, 486–494. [Google Scholar] [CrossRef]
- Birnie-Gauvin, K.; Franklin, P.; Wilkes, M.; Aarestrup, K. Moving beyond fitting fish into equations: Progressing the fish passage debate in the Anthropocene. Aquat. Conserv. 2019, 29, 1095–1105. [Google Scholar] [CrossRef]
- Ordeix, M.; González, G.; Sanz-Ronda, F.J.; Santos, J.M. Restoring fish migration in the rivers of the Iberian Peninsula. In From Sea to Source 2.0. Protection and Restoration of Fish Migration in Rivers Worldwide; Brink, K., Gough, P., Royte, J., Schollema, P.P., Wanningen, H., Eds.; World Fish Migration Foundation: Groningen, The Netherlands, 2018; pp. 174–179. [Google Scholar]
- Amaral, S.D.; Branco, P.; Silva, A.T.; Katopodis, C.; Viseu, T.; Ferreira, M.T.; Pinheiro, A.N.; Santos, J.M. Upstream passage of potamodromous cyprinids over small weirs: The influence of key-hydraulic parameters. J. Ecohydraulics 2016, 1, 79–89. [Google Scholar] [CrossRef]
- Solà, C.; Ordeix, M.; Pou-Rovira, Q.; Sellarès, N.; Queralt, A.; Bardina, M.; Casamitjana, A.; Munné, A. Longitudinal connectivity in hydromorphological quality assessments of rivers. The ICF index: A river connectivity index and its application to Catalan rivers. Limnetica 2011, 30, 273–292. [Google Scholar]
- [FAO] Food and Agriculture Organization of the United Nations; Deutscher Verband für Wasserwirtschaft und Kulturbau e.V. Fish Passes—Design, Dimensions and Monitoring; Food and Agriculture Organization of the United Nations (FAO): Rome, Italy, 2002; p. 119. [Google Scholar]
- Habitat Restoration for Diadromous Fish in River Mondego, Portugal. Available online: http://www.rhpdm.uevora.pt/index.html (accessed on 2 September 2019).
- Baker, C.F. Effect of ramp length and slope on the efficacy of a baffled fish pass. J. Fish Biol. 2014, 84, 491–502. [Google Scholar] [CrossRef]
- Kemp, P.S.; O’Hanley, J.R. Procedures for evaluating and prioritising the removal of fish passage barriers: A synthesis. Fisheries Manag. Ecol. 2010, 17, 297–322. [Google Scholar] [CrossRef]
- Sanz-Ronda, F.J.; Ruiz-Legazpi, J.; Bravo-Córdoba, F.J.; Makrakis, S.; Castro-Santos, T. Sprinting performance of two Iberian fish: Luciobarbus bocagei and Pseudochondrostoma duriense in an open channel flume. Ecol. Eng. 2015, 83, 61–70. [Google Scholar] [CrossRef]
- Katopodis, C.; Gervais, R. Fish Swimming Performance Database and Analyses; Fisheries and Oceans Canada Canadian Science Advisory Secretariat: Ottawa, ON, Canada, 2016; p. 550. [Google Scholar]
- Newton, M.; Dodd, J.A.; Barry, J.; Boylan, P.; Adams, C.E. The impact of a small-scale riverine obstacle on the upstream migration of Atlantic Salmon. Hydrobiologia 2018, 806, 251–264. [Google Scholar] [CrossRef]
- Ovidio, M.; Capra, H.; Philippart, J.C. Field protocol for assessing small obstacles to migration of brown trout Salmo trutta, and European grayling Thymallus thymallus: A contribution to the management of free movement in rivers. Fisheries Manag. Ecol. 2007, 14, 41–50. [Google Scholar] [CrossRef]
- Harris, J.H.; Kingsford, R.T.; Peirson, W.; Baumgartner, L.J. Mitigating the effects of barriers to freshwater fish migrations: The Australian experience. Mar. Freshwater Res. 2016, 68, 614–628. [Google Scholar] [CrossRef]
- Knapp, M.; Montgomery, J.; Whittaker, C.; Franklin, P.; Baker, C.; Friedrich, H. Fish passage hydrodynamics: Insights into overcoming migration challenges for small-bodied fish. J. Ecohydraulics 2019. [Google Scholar] [CrossRef]
- Santos, J.M.; Branco, P.J.; Silva, A.T.; Katopodis, C.; Pinheiro, A.N.; Viseu, T.; Ferreira, M.T. Effect of two flow regimes on the upstream movements of the Iberian barbel (Luciobarbus bocagei) in an experimental pool-type fishway. J. Appl. Ichthyol. 2013, 29, 425–430. [Google Scholar] [CrossRef]
- Santos, J.M.; Branco, P.; Katopodis, C.; Ferreira, T.; Pinheiro, A. Retrofitting pool-and-weir fishways to improve passage performance of benthic fishes: Effect of boulder density and fishway discharge. Ecol. Eng. 2014, 73, 335–344. [Google Scholar] [CrossRef]
- Muraoka, K.; Nakanishi, S.; Kayaba, Y. Boulder arrangement on a rocky ramp fishway based on the swimming behavior of fish. Limnologica 2017, 62, 188–193. [Google Scholar] [CrossRef]
- Rodgers, E.M.; Heaslip, B.M.; Cramp, R.L.; Riches, M.; Gordos, M.A.; Franklin, C.E. Substrate roughening improves swimming performance in two small-bodied riverine fishes: Implications for culvert remediation and design. Conserv. Physiol. 2017, 5, cox034. [Google Scholar] [CrossRef]
- Plesiński, K.; Bylak, A.; Radecki-Pawlik, A.; Mikołajczyk, T.; Kukuła, K. Possibilities of fish passage through the block ramp: Model-based estimation of permeability. Sci. Total Environ. 2018, 631–632, 1201–1211. [Google Scholar] [CrossRef]
- Goodrich, H.R.; Watson, J.R.; Cramp, R.L.; Gordos, M.A.; Franklin, C.E. Making culverts great again. Efficacy of a common culvert remediation strategy across sympatric fish species. Ecol. Eng. 2018, 116, 143–153. [Google Scholar] [CrossRef]
- Wang, H.; Chanson, H. Modelling upstream fish passage in standard box culverts: Interplay between turbulence, fish kinematics, and energetics. River Res. Appl. 2018, 34, 244–252. [Google Scholar] [CrossRef]
- Johnson, K.; Wait, L.E.; Monk, S.K.; Rader, R.; Hotchkiss, R.H.; Belk, M.C. Effects of substrate on movement patterns and behavior of stream fish through culverts: An experimental approach. Sustainability 2019, 11, 470. [Google Scholar] [CrossRef]
- Katopodis, C.; Aadland, L.P. Effective dam removal and river channel restoration approaches. Int. J. River Basin Manag. 2006, 4, 153–168. [Google Scholar] [CrossRef]
- Towler, B.; Mulligan, K.; Haro, A. Derivation and application of the energy dissipation factor in the design of fishways. Ecol. Eng. 2015, 83, 208–217. [Google Scholar] [CrossRef]
- Liao, J.C. A review of fish swimming mechanics and behavior in altered flows. Philos. T. Roy. Soc. B 2007, 362, 1973–1993. [Google Scholar] [CrossRef]
- Elder, J.; Coombs, S. The influence of turbulence on the sensory basis of rheotaxis. J. Com. Physiol. A 2015, 201, 667–680. [Google Scholar] [CrossRef]
- Landsman, S.J.; McLellan, N.; Platts, J.; van den Heuvel, M.R. Nonsalmonid versus salmonid passage at nature-like and pool-and-weir fishways in Atlantic Canada, with special attention to Rainbow smelt. Trans. Am. Fish. Soc. 2018, 147, 94–110. [Google Scholar] [CrossRef]
- Hughes, S.J.; Santos, J.; Ferreira, T.; Mendes, A. Evaluating the response of biological assemblages as potential indicators for restoration measures in an intermittent Mediterranean river. Environ. Manag. 2010, 46, 285–301. [Google Scholar] [CrossRef]
- Santos, J.M.; Reino, L.; Porto, M.; Oliveira, J.; Pinheiro, P.; Almeida, P.R.; Cortes, R.; Ferreira, M.T. Complex size-dependent habitat associations in potamodromous fish species. Aquat. Sci. 2011, 73, 233–245. [Google Scholar] [CrossRef]
- Benitez, J.P.; Matondo, B.N.; Dierckx, A.; Ovidio, M. An overview of potamodromous fish upstream movements in medium-sized rivers, by means of fish passes monitoring. Aquat. Ecol. 2015, 49, 481–497. [Google Scholar] [CrossRef]
- Katopodis, C.; Williams, J.G. The development of fish passage research in a historical context. Ecol. Eng. 2012, 28, 407–417. [Google Scholar] [CrossRef]
- Costa, M.J.; Boavida, I.; Almeida, V.; Cooke, S.J.; Pinheiro, A.N. Do artificial velocity refuges mitigate the physiological and behavioural consequences of hydropeaking on a freshwater Iberian cyprinid? Ecohydrology 2018, 11, e1983. [Google Scholar] [CrossRef]
- Romão, F.; Branco, P.; Quaresma, A.L.; Amaral, S.D.; Pinheiro, A.N. Effectiveness of a multi-slot vertical slot fishway versus a standard vertical slot fishway for potamodromous cyprinids. Hydrobiologia 2018, 816, 153–163. [Google Scholar] [CrossRef]
- Vogt, J.; Soille, P.; De Jager, A.; Rimaviciute, E.; Mehl, W.; Foisneau, S.; Bodis, K.; Dusart, J.; Paracchini, M.L.; Haastrup, P.; et al. A Pan-European River and Catchment Database; European Commission, Joint Research Centre, Institute for Environment and Sustainability: Ispra, Italy, 2007. [Google Scholar]
- Amaral, S.D.; Branco, P.; Katopodis, C.; Ferreira, M.T.; Pinheiro, A.N.; Santos, J.M. Passage Performance of Potamodromous Cyprinids over an Experimental Low-Head Ramped Weir: The Effect of Ramp Length and Slope. Sustainability 2019, 11, 1456. [Google Scholar] [CrossRef] [Green Version]
- [CEN] European Committee for Standardization. Water Quality: Sampling of Fish with Electricity; The European Standard EN 14011; European Committee for Standardization: Brussels, Belgium, 2003. [Google Scholar]
- Stammler, K.L.; Corkum, L.D. Assessment of fish size on shelter choice and intraspecific interactions by round gobies Neogobius melanostomus. Environ. Biol. Fish. 2005, 73, 117–123. [Google Scholar] [CrossRef]
- Santos, J.M.; Ferreira, M.T.; Godinho, F.N.; Bochechas, J. Efficacy of a nature-like bypass channel in a Portuguese lowland river. J. Appl. Ichthyol. 2005, 21, 381–388. [Google Scholar] [CrossRef]
- Romão, F.; Santos, J.M.; Katopodis, C.; Pinheiro, A.N.; Branco, P. How Does Season Affect Passage Performance and Fatigue of Potamodromous Cyprinids? An Experimental Approach in a Vertical Slot Fishway. Water 2018, 10, 395. [Google Scholar] [CrossRef] [Green Version]
- Anderson, M.J.; Gorley, R.N.; Clarke, K.R. PERMANOVA+ For PRIMER: Guide to Software and Statistical Methods; PRIMER-E: Plymouth, UK, 2008. [Google Scholar]
- Anderson, M.J. A new method for non-parametric multivariate analysis of variance. Austral Ecol. 2001, 26, 32–46. [Google Scholar] [CrossRef]
- Anderson, M.J. Permutational Multivariate Analysis of Variance (PERMANOVA). Wiley StatsRef Stat. Ref. Online 2017. [Google Scholar] [CrossRef]
- Hirt, C.W.; Nichols, B.D. Volume of fluid (VOF) method for the dynamics of free boundaries. J. Comput. Phys. 1981, 39, 201–225. [Google Scholar] [CrossRef]
- Flow-3D Version 11.2; User Manual; Flow Science Inc.: Santa Fe, NM, USA, 2016.
- Hirt, C.W.; Sicilian, J.M. A porosity technique for the definition of obstacles in rectangular cell meshes. In Proceedings of the 4th International Conference on Numerical Ship Hydrodynamics, Washington, DC, USA, 24–27 September 1985. [Google Scholar]
- Duguay, J.M.; Lacey, R.W. Numerical study of an innovative fish ladder design for perched culverts. Can. J. Civil Eng. 2016, 43, 173–181. [Google Scholar] [CrossRef] [Green Version]
- Kolden, E.; Fox, B.D.; Bledsoe, B.P.; Kondratieff, M.C. Modelling whitewater park hydraulics and fish habitat in Colorado. River Res. Appl. 2016, 32, 1116–1127. [Google Scholar] [CrossRef]
- Quaresma, A.L.; Romão, F.; Branco, P.; Ferreira, M.T.; Pinheiro, A.N. Multi slot versus single slot pool-type fishways: A modelling approach to compare hydrodynamics. Ecol. Eng. 2018, 122, 197–206. [Google Scholar] [CrossRef]
- Mankoff, K.D.; Russo, T.A. The Kinect: A low-cost, high-resolution, short range 3D camera. Earth Surf. Proc. Land. 2013, 38, 926–936. [Google Scholar] [CrossRef]
- Celik, I.B.; Cehreli, Z.N.; Yavuz, I. Index of Resolution Quality for Large Eddy Simulations. J. Fluid. Eng. 2005, 127, 949–958. [Google Scholar] [CrossRef]
- Pope, S.B. Turbulent Flows; Cambridge University Press: Cambridge, UK, 2000. [Google Scholar]
- Heimerl, S.; Hagmeyer, M.; Echteler, C. Numerical flow simulation of pool-type fishways: New ways with well-known tools. Hydrobiologia 2008, 609, 189–196. [Google Scholar] [CrossRef]
- Quaranta, E.; Katopodis, C.; Revelli, R.; Comoglio, C. Turbulent flow field comparison and related suitability for fish passage of a standard and a simplified low gradient vertical slot fishway. River Res. Appl. 2017, 33, 1295–1305. [Google Scholar] [CrossRef]
- Quaranta, E.; Katopodis, C.; Comoglio, C. Effects of bed slope on the flow field of vertical slot fishways. River Res. Appl. 2019, 35, 656–668. [Google Scholar] [CrossRef]
- Sanagiotto, D.G.; Rossi, J.B.; Bravo, J.M. Applications of computational fluid dynamics in the design and rehabilitation of nonstandard vertical slot fishways. Water 2019, 11, 199. [Google Scholar] [CrossRef] [Green Version]
- Feurich, R.; Boubée, J.; Olsen, N.R.B. Improvement of fish passage in culverts using CFD. Ecol. Eng. 2012, 47, 1–8. [Google Scholar] [CrossRef]
- Baki, A.B.; Zhu, D.Z.; Rajaratnam, N. Flow simulation in a Rock-Ramp Fish Pass. J. Hydraul. Eng. 2016, 142, 04016031. [Google Scholar] [CrossRef]
- Fuentes-Pérez, J.F.; Silva, A.T.; Tuhtan, J.A.; García-Vega, A.; Carbonell-Baeza, R.; Musall, M.; Kruusmaa, M. 3D modelling of non-uniform and turbulent flow in vertical slot fishways. Environ. Modell. Softw. 2018, 99, 156–169. [Google Scholar] [CrossRef]
- Blocken, B.; Gualtieri, C. Ten iterative steps for model development and evaluation applied to Computational Fluid Dynamics for Environmental Fluid Mechanics. Environ. Modell. Softw. 2012, 3, 1–22. [Google Scholar] [CrossRef]
- Amaral, S.D.; Branco, P.; Katopodis, C.; Ferreira, M.T.; Pinheiro, A.N.; Santos, J.M. To swim or to jump? Passage behaviour of a potamodromous cyprinid over an experimental broad-crested weir. River Res. Appl. 2018, 34, 1–9. [Google Scholar] [CrossRef]
- Goerig, E.; Castro-Santos, T. Is motivation important to brook trout passage through culverts? Can. J. Fish. Aquatic Sci. 2017, 74, 885–893. [Google Scholar] [CrossRef] [Green Version]
- Pavlov, D.S.; Lupandin, A.I.; Skorobogatov, M.A. The effects of flow turbulence on the behavior and distribution of fish. J. Ichthyol. 2000, 40, S232–S261. [Google Scholar]
- Katopodis, C.; Cai, L.; Johnson, D. Sturgeon survival: The role of swimming performance and fish passage research. Fish. Res. 2019, 212, 162–171. [Google Scholar] [CrossRef]
- Plesiński, K.; Gibbins, C.N.; Radecki-Pawlik, A. Effects of interlocked carpet ramps on upstream movement of brown trout Salmo trutta in an upland stream. J. Ecohydraul. 2019. [Google Scholar] [CrossRef]
- Bunt, C.M.; Katopodis, C.; McKinley, R.S. Attraction and passage efficiency of white suckers and small mouth bass by two Denil fishways. N. Am. J. Fish. Manag. 1999, 19, 793–803. [Google Scholar] [CrossRef]
- Calles, O.; Greenberg, L. Connectivity is a two-way street—The need for a holistic approach to fish passage problems in regulated rivers. River Res. Appl. 2009, 25, 1268–1286. [Google Scholar] [CrossRef]
- Bunt, C.M.; Castro-Santos, T.; Haro, A. Reinforcement and Validation of the Analyses and Conclusions Related to Fishway Evaluation Data from Bunt et al.: ‘Performance of Fish Passage Structures at Upstream Barriers to Migration’. River Res. Appl. 2016, 32, 2125–2137. [Google Scholar] [CrossRef]
- Roscoe, D.W.; Hinch, S.G. Effectiveness monitoring of fish passage facilities: Historical trends, geographic patterns and future directions. Fish Fish. 2010, 11, 12–33. [Google Scholar] [CrossRef]
- Cooke, S.J.; Hinch, S.G.; Wikelski, M.; Andrews, R.D.; Kuchel, L.J.; Wolcott, T.G.; Butler, P.J. Biotelemetry: A mechanistic approach to ecology. Trends Ecol. Evol. 2004, 19, 334–343. [Google Scholar] [CrossRef]
- Cooke, S.J.; Hinch, S.G. Improving the reliability of fishway attraction and passage efficiency estimates to inform fishway engineering, science, and practice. Ecol. Eng. 2013, 58, 123–132. [Google Scholar] [CrossRef]
- Silva, A.T.; Katopodis, C.; Santos, J.M.; Ferreira, M.T.; Pinheiro, A.N. Cyprinid swimming behaviour in response to turbulent flow. Ecol. Eng. 2012, 44, 314–328. [Google Scholar] [CrossRef] [Green Version]
- Branco, P.; Boavida, I.; Santos, J.M.; Pinheiro, A.; Ferreira, M.T. Boulders as building blocks: Improving habitat and river connectivity for stream fish. Ecohydrology 2013, 6, 627–634. [Google Scholar] [CrossRef]


| Retrofitting Designs (RD) | |||||||
|---|---|---|---|---|---|---|---|
| Q | Control | Small Boulders Aligned | Small Boulders Offset | Large Boulders Aligned | Large Boulders Offset | Nature | |
| Ap | 55 110 | 377 28 | 646 155 | 532 103 | 389 22 | 655 34 | 411 95 |
| At | 55 110 | 132 20 | 300 79 | 178 46 | 153 10 | 314 20 | 308 25 |
| S | 55 110 | 12 3 | 1 7 | 0 5 | 7 3 | 7 6 | 23 12 |
| AE % | 55 110 | 35 71 | 46 51 | 34 45 | 39 46 | 48 59 | 75 26 |
| PE % | 55 110 | 9 15 | 0 9 | 0 11 | 5 30 | 2 30 | 8 48 |
| Retrofitting Design (RD) | |||||
|---|---|---|---|---|---|
| P | Control | Small Boulders Aligned | Small Boulders Offset | Large Boulders Aligned | Large Boulders Offset |
| Small Boulders Aligned | 0.22 | ||||
| Small Boulders Offset | 0.01 | 0.65 | |||
| Large Boulders Aligned | 0.30 | 0.79 | 0.29 | ||
| Large Boulders Offset | 0.72 | 0.45 | 0.12 | 0.65 | |
| Nature | 0.02 | 0.01 | <0.01 | 0.01 | 0.02 |
© 2019 by the authors. Licensee MDPI, Basel, Switzerland. This article is an open access article distributed under the terms and conditions of the Creative Commons Attribution (CC BY) license (http://creativecommons.org/licenses/by/4.0/).
Share and Cite
Amaral, S.D.; Quaresma, A.L.; Branco, P.; Romão, F.; Katopodis, C.; Ferreira, M.T.; Pinheiro, A.N.; Santos, J.M. Assessment of Retrofitted Ramped Weirs to Improve Passage of Potamodromous Fish. Water 2019, 11, 2441. https://doi.org/10.3390/w11122441
Amaral SD, Quaresma AL, Branco P, Romão F, Katopodis C, Ferreira MT, Pinheiro AN, Santos JM. Assessment of Retrofitted Ramped Weirs to Improve Passage of Potamodromous Fish. Water. 2019; 11(12):2441. https://doi.org/10.3390/w11122441
Chicago/Turabian StyleAmaral, Susana D., Ana L. Quaresma, Paulo Branco, Filipe Romão, Christos Katopodis, Maria T. Ferreira, António N. Pinheiro, and José M. Santos. 2019. "Assessment of Retrofitted Ramped Weirs to Improve Passage of Potamodromous Fish" Water 11, no. 12: 2441. https://doi.org/10.3390/w11122441