Article

Factors Affecting Consumption of Water from a Newly Introduced Safe Drinking Water System: The Case of Managed Aquifer Recharge (MAR) Systems in Bangladesh

by
Muhammad Badrul Hasan
1,2,
Peter P. J. Driessen
2,
Shantanu Majumder
1,
Annelies Zoomers
3 and
Frank van Laerhoven
2,*
1
Department of Political Science, University of Dhaka, Dhaka 1000, Bangladesh
2
Copernicus Institute of Sustainable Development, Utrecht University, 3584 CB Utrecht, The Netherlands
3
Department of Human Geography and Planning, Utrecht University, 3584 CB Utrecht, The Netherlands
*
Author to whom correspondence should be addressed.
Water 2019, 11(12), 2459; https://doi.org/10.3390/w11122459
Submission received: 15 October 2019 / Revised: 11 November 2019 / Accepted: 20 November 2019 / Published: 23 November 2019
(This article belongs to the Special Issue Challenges in Supplying Safe Drinking Water in Rural Communities)

Abstract

:
Rather than committing exclusively to one drinking water option, households in Bangladesh often use a portfolio of sources that, in varying ways, to varying extents satisfy one or more out of several preferences they hold with regard to their drinking water. What happens if a new option is added to that mix? In communities of Bangladesh’ Southwestern coastal region where a new option (managed aquifer recharge, or MAR) was recently introduced, we observe variation in the extent to which this source contributes to satisfying households’ drinking water needs. Using multiple linear regression (n = 636 households), we found that perceived risk, costs, taste, self-efficacy, and form and intensity of competition with alternative drinking water options matter significantly.

1. Introduction

Despite remarkable progress, ensuring access of all to safe drinking water services worldwide still remains a major concern [1,2,3]. It is estimated that only 55% of the world’s rural populations have access to safe drinking water sources [4]. Drinking water scarcity leads to the spread of water borne diseases, and it thwarts the socio-economic development [5]. Prüss-Üstün et al. [6] estimate that in developing countries, every year, 1.5 million children die before the age of five due to reasons related to drinking water quality. Population growth and climate change are expected to worsen water scarcity across the world [7,8]. Also, Bangladesh experiences severe scarcity of drinking water, especially in its rural areas [9]. About 13% of the total population in the country has no access to safe drinking water [10]. Every year, a rural child below five years suffers from, on average, 4.6 events of diarrhea, leading to the death of approximately 2.3 thousand children [11]. Water scarcity is more acute in the Southwestern coastal areas due to salinity intrusion, arsenic contamination, frequent natural disaster, and human-made alteration of natural settings [12].
In order to address drinking water scarcity in the region, over the last three decades, both the government and national or local non-governmental organizations (NGOs), often financed by donors and international NGOs, have supported the introduction of multiple new rural drinking water systems, such as pond sand filters (PSF), rain water harvesting systems (RWHS), and reverse osmosis. The problem that we address in this paper is that many of those newly introduced drinking water solutions have unfortunately proven to be unable to (fully) deliver on the promise of adding significantly to the effort of mitigating the problem of drinking water scarcity [13,14,15].
One of the most recent attempts to solve water scarcity in the region uses managed aquifer recharge, or MAR. MAR was introduced in 2010 by a consortium of Dhaka University’s Geology Department (DU), the Department of Public Health Engineering (DPHE) and the Acacia Water—a Dutch consultancy firm—funded by the Dutch Embassy in Bangladesh and UNICEF. It is supposed to be operated and maintained by the local community. In a MAR system, water is collected from ponds and rooftop rainwater. After passing through a sand filter, the water is infiltrated into the aquifer to create a bubble of fresh water. Users can subsequently abstract the water using standard hand tube-wells. Compared to other major systems in the area, MAR is contamination-free and cyclone-proof, and it is reliable as it provides water in sufficient quantities throughout the year. In terms of operation and maintenance costs, MAR can be less expensive than the available alternatives. It is relatively easy to operate. These are all claims that MAR shares with the drinking water systems mentioned in the preceding paragraph.
The hydrogeological and technical feasibility of MAR is more or less established [16,17]. However, as with previous attempts to introduce new and improved drinking water technologies [18,19,20], getting communities to actually use MAR will, without a doubt, prove to be difficult. Households do not rely exclusively on one sole drinking water source but use instead a portfolio of options. This portfolio of local drinking water options consists of sources that vary due to a range of factors that actual and prospective users attach preferences to. Predicting what exactly pushes people away from old drinking water routines and habits (that may be unsafe), and pulls them towards a newly introduced, presumably safe(r), cheaper, and/or (more) reliable alternative, requires us to acknowledge this.
In an attempt to fill this knowledge gap, we seek to establish which factors might impact people’s choice to use water from MAR. Building on the work of others before us [21,22,23,24,25], we here focus on psychological factors and, add to that, the context-specific level of competition of the newly introduced option with alternative drinking water solutions.

2. Explaining Variation in the Use of New Drinking Water Systems

There are a handful of theories and models that identify factors that might explain variation in the use of water and sanitation systems in developing countries. Among these, the Protection Motivation theory [26] and the Health Action Process Approach [27] have identified risk perception as a key factor while the Theory of Planned Behavior considers attitude, normative, and ability factors as the most significant factors driving choices to engage in a certain type of behavior (such as starting to use a new drinking water system) [28,29]. Drawing insights from these theories, Mosler [21] offers the RANAS model. In this model, psychological factors are clustered in five separate blocks, namely Risk, Attitudinal, Normative, Ability, and Self-regulation factors.
Risk factors regard the perceived likelihood of getting sick from using water from a particular source and the consequences thereof. Attitudinal factors regard instrumental beliefs (i.e., the opinions of actual and prospective MAR users about effort and costs associated with using MAR) and affectional beliefs (i.e., the opinions of actual and prospective MAR users about the taste of MAR water). Normative factors regard descriptive norms (i.e., perceptions of which behaviors are typically performed) and injunctive norms (i.e., perceptions of which behaviors are typically approved or disapproved of by important others). Ability factors regard the belief in one’s capabilities to organize and execute the course of actions required to manage prospective situations (i.e., self-efficacy) and knowing how to perform the behavior (i.e., action knowledge). Self-regulation factors include coping and planning (i.e., how the person plans to cope with distractions and barriers), and commitment (i.e., how committed a person is to the new behavior).
The importance of demand for the adoption of new and improved drinking water systems is well understood [13]. Still, we observe that both government and non-government organizations in low-income countries follow an approach that is largely supply-driven, i.e., community end-users are not or hardly involved in decisions about the physical infrastructure or its governance [30]. Attempts to understand why people do or do not use these new and improved water drinking systems often do not consider the fact that such systems are not introduced in a vacuum: they compete with other, both newly introduced and already functioning drinking water solutions, all with varying levels of safety and reliability, and other factors that might affect preferences. Households are observed to use and rely on a variety of such sources at the same time. Therefore, it may be unrealistic to expect that the newly introduced option will replace what is already out there. Instead, it is more likely that it will occupy a place (that may range from unimportant to dominant) within the portfolio of options that households use or consider using.
We offer a model that combines the relevant psychological factors highlighted in the RANAS model with the expectation that newly introduced drinking water systems have to compete with what is already out there.

3. Materials and Methods

The study took place in three south-western coastal districts of Bangladesh. Here, drinking water scarcity is severe due to salinity intrusion, arsenic contamination, tidal surges, and drought [31,32]. In most parts of this area, neither shallow nor the deep tube-wells are feasible due to a lack of suitable aquifers at reasonable depths [13]. Hoque [33] found that an estimated 30 million people are unable to collect potable drinking water due to a lack of available safe water sources.

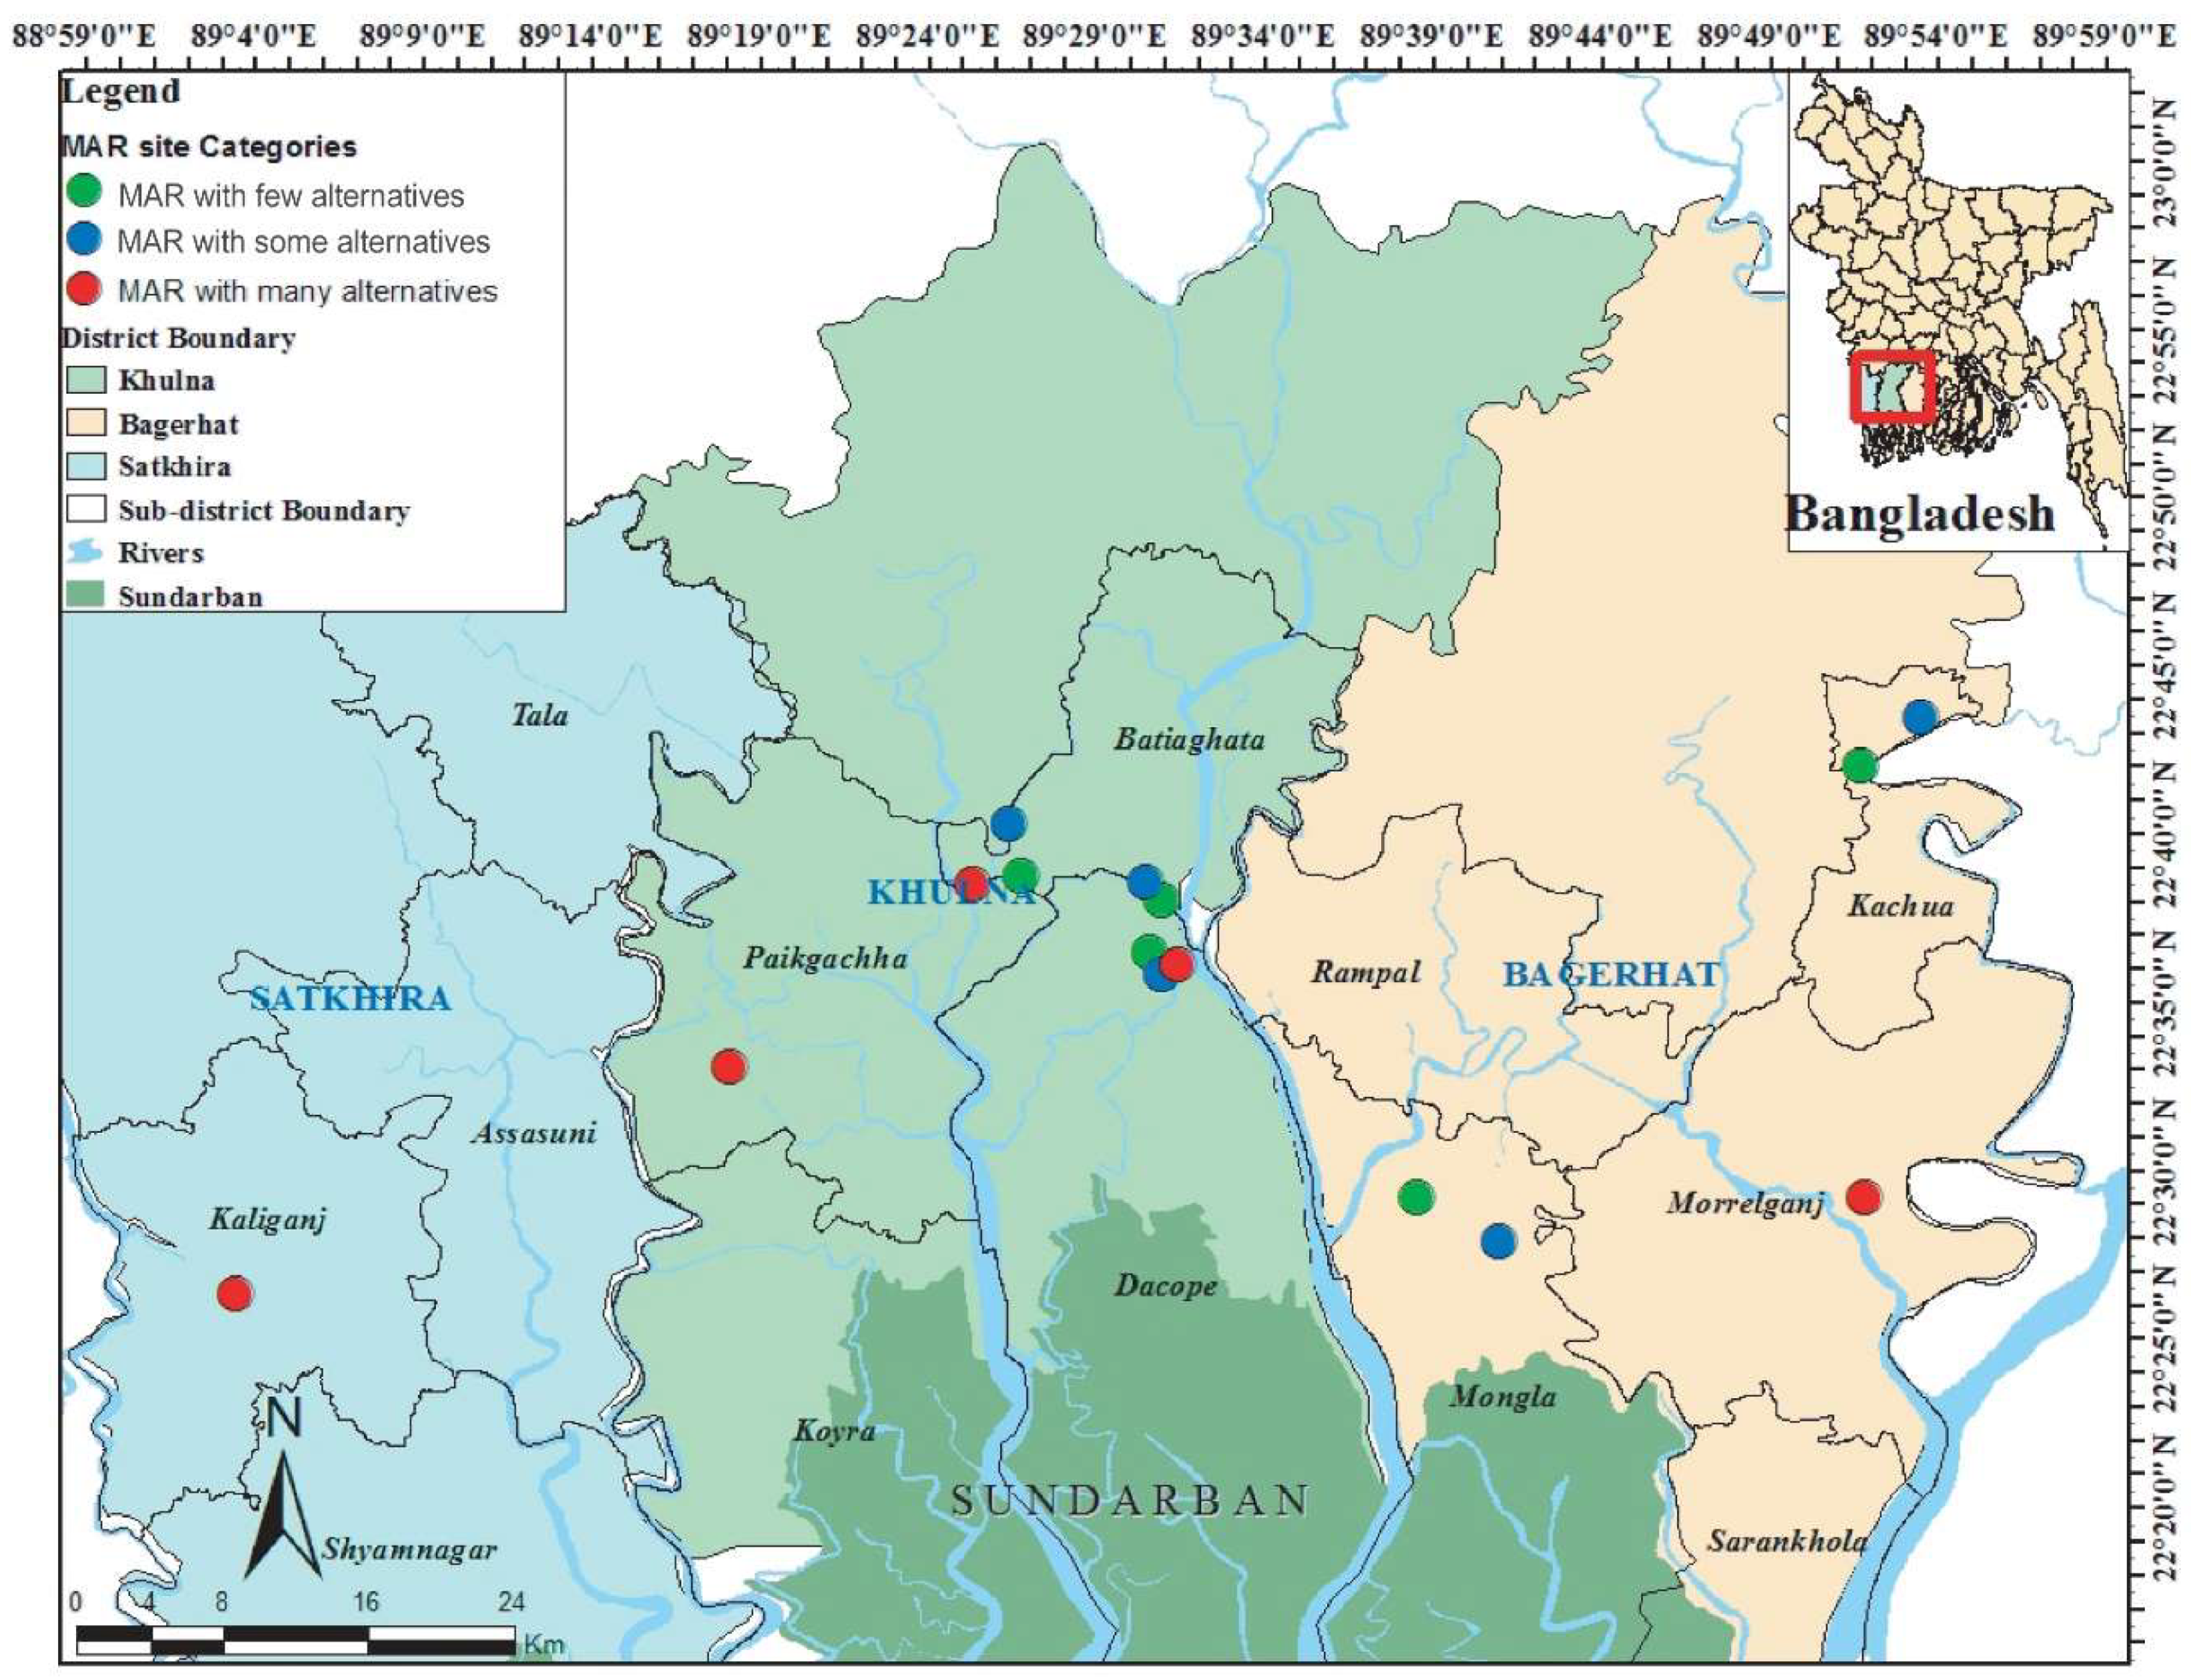
3.1. Sample Selection

By the time of our data collection, a total of 66 MAR sites were in place in the districts of Khulna, Bagerhat, and Satkhira. To serve our study objectives, we grouped all of these 66 MAR communities into three categories based on the number of alternative options available within the community, such as MAR sites with a few alternatives (i.e., 1–2 alternative water options are available); MAR sites with some alternatives (i.e., 3 alternatives besides MAR are known to be available in the community); and finally, MAR sites with many alternatives (more than 3 alternative options are available). Following a purposive sampling method, we chose 15 MAR communities in total (i.e., 5 from each category) (Figure 1). At each site selected for our samples, we followed a random route sampling method [34] to select the households for a survey (for details, see Table 1).

3.2. Operationalization

A standardized questionnaire was developed, pre-tested, and then finalized to assess the consumption level of MAR and the factors expected to influence variation in these consumption levels. These factors include both psychological factors and factors related to the level of competition MAR faces from other options. The questionnaire was translated from English to Bengali and then re-translated from Bengali into English to check the quality of translation. The dependent variable of this study is the percentage of MAR water in the total of water consumed for drinking purposes, during the dry season. To determine this, participants were asked to estimate the number of pitchers fetched from different water sources on a typical day during the dry season. To minimize a recall bias, the survey was administered during the dry season. The total water consumption from MAR was converted into a percentage of the total water consumption. This percentage can range from 0% to 100%. For the measurement of most variables, we used a forced-choice (ipsative) format (with four options) that forces respondents to form an opinion, as the safe, neutral option is removed [35]. Taste, smell, and color were measured using a Likert rating-scale (with five options) because, here, neutral options matter. The availability of water alternatives was scored on 3-point scale (see Table 2).

3.3. Data Collection

Data was collected through household surveys and informal interviews with the community members. Between December 2018 and February 2019, we conducted a total of 780 household surveys from 15 MAR sites with randomly selected households through a semi-structured questionnaire. Respondents were both users and non-users of MAR. A research team comprising seven graduate students of a local university assisted us in carrying out surveys. They were provided with guidelines and training on interviewing techniques. Before starting the final surveys, we conducted a pilot survey with 50 respondents from 3 MAR communities (one from each sample category) in order to ensure that respondents understood the questions as we intended. Interviewers conducted interviews with the person in the selected household that was responsible for water collection. Before starting the interview, every respondent was informed in detail about the study and their verbal consent was requested. Each interview took around 30–40 min on average. In addition, we also conducted informal interviews with local elected representatives and informal leaders (2 from each community). Moreover, data were collected by reviewing official documents, field reports, and annual reports at Dhaka University’s MAR office.

3.4. Data Analysis

Firstly, an independent sample T-test was computed to compare users and non-users of MAR in the overall sample regarding their demographic characteristics. Secondly, a Pearson chi-square (χ2) test was performed to assess the correlation between the consumption of MAR (user and non-users) and the availability of varying levels of alternative options. Thirdly, multiple linear regression was conducted to identify the significant psychological and contextual determinants of consumption level of MAR water at a multi-variate level.

4. Results

Households seek to satisfy their various drinking water preferences by relying on a portfolio of sources. Each source may satisfy another aspect of the household’s range of preferences. Therefore, we expected that the number of households that reported to use MAR water during the dry season would drop as more drinking water alternatives besides MAR were available. After all, households will benefit from the extra options to satisfy additional, different drinking water preferences. With a chi-square test, we could corroborate this expectation (p = 0.000). When few alternatives besides MAR are available, 45.8% of our respondents indicate using MAR water. When there are many alternatives available, this percentage drops to 17.3%. Figure 2 shows the percentage of respondents that report considering a particular system as either their most or their second most important drinking water source during the dry season.
In Table 3, we present the descriptive statistics for the variables used in our model.
A linear regression analysis was conducted to identify the significant factors explaining variation in the consumption of MAR water. Table 4 shows the correlations between predictor and dependent variables (r), unstandardized regression coefficient (B), the standardized regression coefficient (β), standard error of B (SE B), adjusted R2 and the significance level (p-value). The basic assumptions of normality, linearity, homoscedasticity of residuals, and independence of errors were checked and found to apply.
The regression analysis reveals that out of the 16 explanatory variables in our model, 10 factors correlate significantly at the 10% level with our dependent variable: in accordance with our expectation, perceived vulnerability, factual knowledge, perceived costs, perceived taste, descriptive norms, injunctive norms, and self-efficacy, all correlate positively with the percentage of households’ total drinking water needs that are covered by MAR. Also, as expected, the availability of alternative options correlates negatively. Contrary to our expectation, action knowledge and coping planning correlate negatively with our dependent variable. Altogether, the adjusted R2 indicates that 55.5% of the variation in the percentage of consumption of MAR water out of the total amount of water consumed was predicted by the 16 independent variables in our model.

5. Discussion and Conclusions

The novelty of our study regards the recognition of the fact that households in Bangladesh’s coastal areas, just like in many other places in the world, (can) use a wide range of drinking water options—that can be both relatively safe (e.g., MAR, deep tube-well, and reverse osmosis) or relatively unsafe (e.g., surface or pond water, or water from an unsafe shallow tube-well, or contaminated rain water harvesting container). People do not necessarily stick to one single source. We found that 36% of all households in our study report relying on more than one source to satisfy their drinking water needs during the peak of the dry season. Therefore, rather than explaining why households would or would not be willing to adopt one particular safe drinking water technology, we opted for explaining variation in the proportion of water from a safe option (i.e., MAR) within the entire portfolio of options used by a household. Related to this, we leave room in our analysis for the acknowledgment of the notion of competition between drinking water options that are being introduced and championed by a variety of (rival) agencies and organizations.
One might expect to find more or less the same service level experienced by people that live in the same area. However, we observe that although the service level (i.e., supply) may be similar (i.e., we sampled households in communities where we knew a MAR site was operation), households’ use of these services (i.e., demand) vary significantly. In our sample, on average, about 29% of households’ drinking water needs are covered by MAR water, but the standard deviation is 40.72. What explains this considerable variation?
We found that risk factors, i.e., the extent to which people perceive to be vulnerable to contracting a disease from drinking MAR water, strongly affect the proportion of MAR water that is consumed at the household level. The more people trust MAR water not to make them sick, the higher the proportion of MAR water in the total household drinking water consumption during the peak of the dry season. This expected finding is in line with findings of earlier research that regards, in particular, the propensity to use arsenic-safe water options in Bangladesh [22].
We also conclude that factual knowledge is a significant factor influencing the level of water consumption from a relatively safe source, such as MAR: the more one knows about medical conditions that can result from drinking unsafe water and about ways to prevent and/or treat these, the higher the proportion of MAR water that is consumed in a household during the peak of the dry season. This finding is convergent with Huber and Mosler [36], who found that knowledge was an important factor affecting safe water consumption in Ethiopia.
Furthermore, perceived costs emerged as a significant factor from our analysis. When people have the impression that the costs associated with using MAR water are reasonable, they will use it more often. This finding is not surprising and is consistent with earlier studies [37].
Also, as expected, we observe that the more people like the taste of MAR water, the more they will consume it. Perception or reputation play a role here, as well: when people think MAR water has a bad taste, they are less eager to use MAR systems. This finding is also in line with earlier research [36,37,38].
We found that normative factors (i.e., injunctive and descriptive norms) are significantly associated with the level of household consumption of MAR water: The more people perceive others—especially others that matter—to approve of MAR, the higher the level MAR water consumption in a household. This finding is consistent with earlier studies [22,37,38,39,40] that find that social norms are an important driver of the consumption of safe drinking water in Bangladesh and elsewhere.
The stronger the belief in one’s capabilities to organize and execute the required course of actions required—operationalized here by means of a question about the respondent’s belief that she would be able to use as much MAR water as needed during the peak of the dry season—the higher the proportion of MAR water in their portfolio. As expected, people prefer reliable options—i.e., options that provide good quality water when it is needed—over sources that are less trustworthy.
Regarding the consumption of MAR water under varying levels of available alternatives, our findings reveal that people appear less interested in MAR when there are more alternatives available in a community. This may be due to the fact that MAR systems might not live up to people’s expectations about costs, taste, or reliability. It may also be related to the fact that as the number of options increases, people will seek to benefit from these extra options to satisfy additional, different drinking water preferences. This finding is consistent with Komives et al. [25], who found that a drinking water source is more likely to be sustainable if it is the only source available in the community.
What is surprising is the significant but negative association between action knowledge and MAR water consumption levels. This appears to signify that the more people trust the MAR user committee to be able to manage the operation of the MAR system, the lower the proportion of MAR water in the total household water consumption during the dry season. We suspect that this is related to the fact that people who do not use MAR systems think they are well-run, whereas people that do use the systems know that this is not always the case. Also, the significant, but negative association between coping planning and MAR water consumption levels is unexpected: if people think there is a plan regarding what to do when the MAR system gets broken, we see the amount of MAR water they use drops. Also, here we suspect that non-users think such plans exist, whereas MAR users know that this is not always the case.
Based on our findings, we recommend the following to those involved in safe rural drinking water provision in Bangladesh or in similar regions elsewhere in the world. First, realize that the people you target have already solved part of their drinking water problems—i.e., people do not live where there is no drinking water. As our regression results show, the perceptions of people vary according to the number of available drinking water options. Also, realize that you may not be the only one who is, who has been, or who will be attempting to introduce a new and improved drinking water solution. So, rather than parachuting a new and improved drinking water system into a community from the top, first assess the number and nature of drinking water solutions that are already available, evaluate community preferences and perceptions [41], and create new or tap into existing local participatory capacities to align what you offer with these demands [42].
Second, and related to the above, appreciate that rather than committing exclusively to one drinking water option, households may use a portfolio of sources that, in varying ways, to varying extents satisfy one or more out of several preferences they have with regard to their drinking water needs. The size and composition of that portfolio may depend on local supply, time (i.e., season), the specifics of a family drinking water needs (i.e., family size and composition), household characteristics (e.g., income and location), and norms of the wider community that the household is a part of. Do not target full and exclusive acceptance of the drinking water option that you are advocating for.
Third, and related to the above, realize that you are asking a lot when expecting people to switch routines that regard drinking water. In addition to focusing on hardware (i.e., making sure that the physical infrastructure works optimally), also focus on software activities (i.e., activities regarding the changing of people’s behavior) [24]. Our results indicate that in order to get households on board of the newly introduced safe drinking water option, they must be convinced of the fact that the water from that source is safe. They must be provided with factual knowledge about the link between drinking water and getting sick. They must be convinced of the fact that the new drinking water system is reliable in the sense that it provides all the water that is needed when it is needed. Also, the systems get a reputation for producing drinking water that is of foul taste and is expensive, which must be avoided. Furthermore, rather than targeting individual households, create a community level norm that approves of the use of the source in question. Software activities go hand-in-hand with hardware activities: engineering efforts must guarantee that MAR water is safe and tasty and that the systems are reliable and reasonably priced.

Author Contributions

Conceptualization: M.B.H., F.v.L., P.P.J.D., S.M. and A.Z.; data curation: M.B.H.; formal analysis: M.B.H., F.v.L. and P.P.J.D.; funding acquisition: F.v.L.; investigation: M.B.H.; methodology: M.B.H. and F.v.L.; project administration: F.v.L.; supervision: F.v.L., P.P.J.D., S.M. and A.Z.; validation: M.B.H.; writing—original draft: M.B.H., F.v.L., P.P.J.D., S.M. and A.Z.

Funding

This research was funded by the Netherlands Organization for Scientific Research (NWO), grant number W.07.69.107. The research is part of the DeltaMAR project, carried out by a consortium of partners consisting of Utrecht University, Technical University Delft, Dhaka University, and Acacia Water. DeltaMAR is part of NWO’s Urbanizing Deltas of the World (UDW) program.

Acknowledgments

We thank all respondents. We are grateful for the feedback we received from colleagues in the UDW DeltaMAR project and from participants in the DeltaMAR project stakeholder meetings in Khulna, Bangladesh, 14–15 November 2018. This work was completed while MBH was a graduate student in the Copernicus Institute of Sustainable Development of Utrecht University, particularly working for the DeltaMAR project, part of the Urbanizing Deltas of the World (UDW) program of the Netherlands Organization for Scientific Research (NWO).

Conflicts of Interest

The authors declare no conflicts of interest. The funder had no role in the design of the study; in the collection, analyses, or interpretation of data; in the writing of the manuscript, or in the decision to publish the results.

References

  1. Moretto, L.; Faldi, G.; Ranzato, M.; Rosati, F.N.; Ilito Boozi, J.P.; Teller, J. Challenges of water and sanitation service co-production in the global South. Environ. Urban. 2018, 30, 425–443. [Google Scholar] [CrossRef]
  2. Peters, C.N.; Baroud, H.; Hornberger, G.M. Multicriteria decision analysis of drinking water source selection in southwestern Bangladesh. J. Water Resour. Plan. Manag. 2019, 145, 05019004. [Google Scholar] [CrossRef]
  3. Van Houtven, G.L.; Pattanayak, S.K.; Usmani, F.; Yang, J.C. What are households willing to pay for improved water access? Results from a meta-analysis. Ecol. Econ. 2017, 136, 126–135. [Google Scholar] [CrossRef]
  4. WHO/UNICEF, JMP. 2017 Annual Report WHO/UNICEF Joint Monitoring Programme for Water Supply, Sanitation and Hygiene (JMP). Available online: https://washdata.org/sites/default/files/documents/reports/2018-07/JMP-2017-annual-report.pdf (accessed on 22 November 2019).
  5. Veldkamp, T.I.E.; Wada, Y.; de Moel, H.; Kummu, M.; Eisner, S.; Aerts, J.C.J.H.; Ward, P.J. Changing mechanism of global water scarcity events: Impacts of socioeconomic changes and inter-annual hydro-climatic variability. Glob. Environ. Chang. 2015, 32, 18–29. [Google Scholar] [CrossRef]
  6. Prüss-Üstün, A.; Bos, R.; Gore, F.; Bartram, J. Safer Water. Better Health: Costs, Benefits and Sustainability of Interventions to Protect and Promote Health; World Health Organization: Geneva, Switzerland, 2008. [Google Scholar]
  7. Kiguchi, M.; Shen, Y.; Kanae, S.; Oki, T. Re-evaluation of future water stress due to socio-economic and climate factors under a warming climate. Hydrol. Sci. J. 2014, 60, 14–29. [Google Scholar] [CrossRef]
  8. Schewe, J.; Heinke, J.; Gerten, D.; Haddeland, I.; Arnell, N.W.; Clark, D.B.; Dankers, R.; Eisner, S.; Fekete, B.M.; Colón-González, F.J.; et al. Multimodel assessment of water scarcity under climate change. Proc. Natl. Acad. Sci. USA 2014, 111, 3245–3250. [Google Scholar] [CrossRef]
  9. Murshed, S.B.; Kaluarachchi, J.J. Scarcity of fresh water resources in the Ganges Delta of Bangladesh. Water Secur. 2018, 4–5, 8–18. [Google Scholar] [CrossRef]
  10. WHO/UNICEF. WHO/UNICEF Joint Monitoring Programme (JMP) for Water Supply and Sanitation, Bangladesh; World Health Organization: Geneva, Switzerland, 2015. [Google Scholar]
  11. Piechulek, H.; Al-Sabbir, A.; Mendoza-Aldana, J. Diarrhea and ARI in rural areas of Bangladesh. Southeast. Asian J. Trop. Med. Public Health 2003, 34, 337–342. [Google Scholar]
  12. Afroz, S.; Cramb, R.; Grunbuhel, C. Collective management of water resources in coastal Bangladesh: Formal and substantive approaches. Hum. Ecol. 2016, 44, 17–31. [Google Scholar] [CrossRef]
  13. Hoque, B.A.; Hoque, M.M.; Ahmed, T.; Islam, S.; Azad, A.K.; Ali, N.; Hossain, M.; Hossain, M.S. Demand-based water options for arsenic mitigation: An experience from rural Bangladesh. Public Health 2004, 118, 70–77. [Google Scholar] [CrossRef]
  14. Shafiquzzaman, M.; Azam, M.S.; Moshima, I.; Nakajima, J. Technical and social evaluation of arsenic mitigation in rural bangladesh. J. Health Popul. Nutr. 2009, 27, 674–683. [Google Scholar] [CrossRef] [PubMed]
  15. Hossain, M.; Rahman, S.N.; Bhattacharya, P.; Jacks, G.; Saha, R.; Rahman, M. Sustainability of arsenic mitigation interventions: An evaluation of different alternative safe drinking water options provided in Matlab, an arsenic hot spot in Bangladesh. Front. Environ. Sci. 2015, 3, 1–15. [Google Scholar] [CrossRef]
  16. Obergfell, C.; Bakker, M.; Maas, K. Estimation of average diffuse aquifer recharge using time series modeling of groundwater heads. Water Resour. Res. 2019, 55, 2194–2210. [Google Scholar] [CrossRef]
  17. Antoniou, E.A.; Stuyfzand, P.J.; van Breukelen, B.M. Reactive transport modeling of an aquifer storage and recovery (ASR) pilot to assess long-term water quality improvements and potential solutions. Appl. Geochem. 2013, 35, 173–186. [Google Scholar] [CrossRef]
  18. Fielding, K.S.; Gardner, J.; Leviston, Z.; Price, J. Comparing public perceptions of alternative water sources for potable use: The case of rainwater, stormwater, desalinated water, and recycled water. Water Resour. Manag. 2015, 29, 4501–4518. [Google Scholar] [CrossRef]
  19. Leviston, Z.; Nancarrow, B.E.; Tucker, D.I.; Porter, N.B. Predicting Community Behaviour: Indirect Potable Reuse of Wastewater Through Managed Aquifer Recharge; Land and Water Science Report 2906; CSIRO: Canberra, Australia, 2006. [Google Scholar]
  20. Wu, Z.; McKay, J.; Keremane, G. Issues affecting community attitudes and intended behaviours in stormwater reuse: A case study of Salisbury, South Australia. Water 2012, 4, 835–847. [Google Scholar] [CrossRef]
  21. Mosler, H.J. A systematic approach to behavior change interventions for the water and sanitation sector in developing countries: A conceptual model, a review, and a guideline. Int. J. Environ. Health Res. 2012, 22, 431–449. [Google Scholar] [CrossRef]
  22. Inauen, J.; Hossain, M.M.; Johnston, R.B.; Mosler, H.J. Acceptance and use of eight arsenic-safe drinking water options in Bangladesh. PLoS ONE 2013, 8. [Google Scholar] [CrossRef]
  23. Kundu, D.K.; Gupta, A.; Mol, A.P.J.; Nasreen, M. Understanding social acceptability of arsenic-safe technologies in rural Bangladesh: A user-oriented analysis. Water Policy 2016, 18, 318–334. [Google Scholar] [CrossRef]
  24. Peal, A.J.; Evans, B.E.; van der Voorden, C. Hygiene and Sanitation Software: An Overview of Approaches; Water Supply and Sanitation Collaborative Council: Geneva, Switzerland, 2010. [Google Scholar]
  25. Komives, K.; Akanbang, B.; Thorsten, R.; Tuffuor, B.; Wakeman, W.; Larbi, E.; Bakalian, A.; Whittington, D. Post-construction support and the sustainability of rural water projects in Ghana. In Proceedings of the 33rd WEDC International Conference, Accra, Ghana, 7–11 April 2008; pp. 1–294. [Google Scholar]
  26. Floyd, D.L.; Prentice-Dunn, S.; Rogers, R.W. A meta-analysis of research on protection motivation theory. J. Appl. Soc. Psychol. 2000, 30, 407–429. [Google Scholar] [CrossRef]
  27. Schwarzer, R. Modeling health behavior change: How to predict and modify the adoption and maintenance of health behaviors. Appl. Psychol. 2008, 57, 1–29. [Google Scholar] [CrossRef]
  28. Ajzen, I. The theory of planned behavior. Organ. Behav. Hum. Decis. Process. 1991, 50, 179–211. [Google Scholar] [CrossRef]
  29. Ajzen, I.; Driver, B.L. Application of the theory of planned behavior to leisure choice. J. Leis. Res. 1992, 24, 207–224. [Google Scholar] [CrossRef]
  30. Whittington, D.; Davis, J.; Prokopy, L.; Komives, K.; Thorsten, R.; Lukacs, H.; Bakalian, A.; Wakeman, W. How well is the demand-driven, community management model for rural water supply systems doing? Evidence from Bolivia, Peru and Ghana. Water Policy 2009, 11, 696–718. [Google Scholar] [CrossRef]
  31. Islam, M.; Ali Akber, M.; Atikul Islam, M. Willingness to pay for improved drinking water in Southwest coastal Bangladesh. Water Sci. Technol. Water Supply 2019, 19, 1–10. [Google Scholar] [CrossRef]
  32. Mahmuduzzaman, M.; Ahmed, Z.U.; Nuruzzaman, A.K.M.; Ahmed, F.R.S. Causes of salinity intrusion in coastal belt of Bangladesh. Int. J. Plant Res. 2014, 4, 8–13. [Google Scholar] [CrossRef]
  33. Hoque, M.R. Access to Safe Drinking Water in Rural Bangladesh: Water Governance by DPHE; BRAC University: Dhaka, Bangladesh, 2009. [Google Scholar]
  34. Hoffmeyer-Zlotnik, J.H.P. New sampling designs and the quality of data. Dev. Appl. Stat. 2003, 19, 205–217. Available online: http://mrvar.fdv.uni-lj.si/pub/mz/mz19/abst/hoff.htm (accessed on 22 November 2019).
  35. Bartram, D. Increasing validity with forced-choice criterion measurement formats. Int. J. Sel. Assess. 2007, 15, 263–272. [Google Scholar] [CrossRef]
  36. Huber, A.C.; Mosler, H.J. Determining behavioral factors for interventions to increase safe water consumption: A cross-sectional field study in rural Ethiopia. Int. J. Environ. Health Res. 2013, 23, 96–107. [Google Scholar] [CrossRef]
  37. Heri, S.; Mosler, H.J. Factors affecting the diffusion of solar water disinfection: A field study in Bolivia. Health Educ. Behav. 2008, 35, 541–560. [Google Scholar] [CrossRef]
  38. George, C.M.; Inauen, J.; Perin, J.; Tighe, J.; Hasan, K.; Zheng, Y. Behavioral determinants of switching to arsenic-safe water wells: An Analysis of a randomized controlled trial of health education interventions coupled with water arsenic testing. Health Educ. Behav. 2017, 44, 92–102. [Google Scholar] [CrossRef] [PubMed]
  39. Mosler, H.J.; Blöchliger, O.R.; Inauen, J. Personal, social, and situational factors influencing the consumption of drinking water from arsenic-safe deep tubewells in Bangladesh. J. Environ. Manag. 2010, 91, 1316–1323. [Google Scholar] [CrossRef] [PubMed]
  40. Inauen, J.; Mosler, H.J. Developing and testing theory-based and evidence-based interventions to promote switching to arsenic-safe wells in Bangladesh. J. Health Psychol. 2014, 19, 1483–1498. [Google Scholar] [CrossRef] [PubMed] [Green Version]
  41. Anthonj, C.; Fleming, L.; Cronk, R.; Godfrey, S.; Ambelu, A.; Bevan, J.; Sozzi, E.; Bartram, J. Improving monitoring and water point functionality in rural Ethiopia. Water 2018, 10, 1591. [Google Scholar] [CrossRef] [Green Version]
  42. Jiménez, A.; LeDeunff, H.; Giné, R.; Sjödin, J.; Cronk, R.; Murad, S.; Takane, M.; Bartram, J. The enabling environment for participation in water and sanitation: A conceptual framework. Water 2019, 11, 308. [Google Scholar] [CrossRef] [Green Version]
Figure 1. Study areas.
Water 11 02459 g001
Figure 2. Most and 2nd most important drinking water sources (combined) during the peak of the dry season (clustered per varying service levels). For example, in communities with few drinking water alternatives besides MAR, 29% of all respondents indicate that managed aquifer recharge is their most or second most important drinking water source during the peak of the dry season.
Water 11 02459 g002
Table 1. Sampling in the study.
Sub-SamplesCommunity NameSub-SistrictDistrictMAR Sites (#)Respondents (Survey)Interviewees (Experts)Households (per Community) *Average Income ($/Month) **Average Education (years) **Average Household Size **Travel Time to Nearest Urban Center (min) ***
MAR with a few alternatives (1–2 options)BarunparaBatiaghataKhulna135248614474.2340
BhogobotipurBatiaghataKhulna157227613164.4045
ChalnaDacopeKhulna155232617694.9820
South ChadpaiMonglaBagerhat162242614164.8230
Boyer singa guccho gramKochuaBagerhat14927212944.9440
MAR with some alternatives (3 options)KayemkhulaBotiaghataKhulna157217013864.4245
KollansreeBotiaghataKhulna155236013644.8460
DuariaraMonglaBagerhat156215219084.5450
AchbuaDacopKhulna151266720694.4560
GazaliaKachuaBagerhat148236515864.8140
MAR with many alternatives (>3 options)LaxmikhulaPaikgachaKhulna148222014275.2160
KalikabariMorrelgonjBagerhat149240714474.6930
Chalna bazarDacopKhulna148227812064.4615
BigordanaPaikgachaKhulna153220315674.1745
Thekra RahimpurKaligonjSatkhira157242115174.7240
Total157315780304829
* Data obtained from the respective local administrations; ** Calculation based on data obtained from the survey applied to our sample; *** Data obtained from local key respondents. Numbers are based on the form of transportation that is most commonly used in the respective communities.
Table 2. Operationalization of the variables.
Dependent VariableDefinitionAssessmentResponse Options
Consumption of MAR water (in percentage)The percentage of total drinking water used during the dry season that comes from MAR How many pitchers of water from the following water sources do you collect for drinking purposes on a typical day during the peak of the dry season (i.e., April)? Open (all possible sources—including MAR—are presented to the respondent)
Risk
Perceived vulnerabilityA person’s subjective perception of his/her risk of contracting a diseaseWhat do you think is the chance that you will get sick from using MAR water?Four-point scale from high risk (4) to no risk at all (1).
Perceived severityperson’s perception of the seriousness of the consequences of contracting a diseaseImagine you contracted a disease (e.g., like arsenicosis, cholera or diarrhea) from your drinking water source, how severe would the impact be on your daily life?Four-point scale from very severe (4) to not severe at all (1)
Factual knowledgeAn understanding of how a person could become affected by a disease transmitted by drinking waterFactual knowledge about (i) actual contamination levels of MAR water, (ii) the actual medical conditions that may occur from drinking MAR water, and (iii) the treatment of MAR water.Four-point scale from no knowledge (1) to maximum knowledge (4)
Attitude
Instrumental beliefsOpinion about the distance of the MAR siteHow far is the MAR site located from your house? Four-point scale from very far (4) to not far at all (1)
Opinion about the costs of MARHow expensive do you think it is for you to contribute to the operation and maintenance of MAR? Four-point scale from very expensive (1) to very cheap (4)
Opinion about the accessibility of the MAR siteHow accessible do you think the MAR system is? Four-point scale from not accessible (1) to very accessible (4)
Affective beliefsOpinion about the taste of MAR waterDo you like the taste of the water from the MAR system? Five-point from “I dislike it very much” (1) to “I like it very much” (5)
Opinion about the smell of MAR waterDo you like the smell of the water from the MAR system? Five-point from “I dislike it very much” (1) to “I like it very much” (5)
Opinion about the color of MAR waterDo you like the color of the water from the MAR system? Five-point from “I dislike it very much” (1) to “I like it very much” (5)
Norms
Descriptive normPerceptions of which behaviors are typically performedHow many people in this neighborhood outside your family collect water from the MAR system? Four-point scale from almost nobody (1) to almost everybody (4)
Injunctive normPerceptions of which behaviors are typically approved or disapproved of by important othersDo people that are important to you rather approve or disapprove of using water from the MAR system?Four-point scale from strongly disapprove (1) to strongly approve (4)
Ability
Self-efficacyThe belief in one’s capabilities to organize and execute the course of actions required to manage prospective situationsHow certain are you that you can collect as much safe water as you need from this source during the peak of the dry season from the MAR system?Four-point scale from not at all certain (1) to completely certain (4)
Action knowledgeKnowing how to perform the behaviorHow capable do you think the user committee responsible for MAR is?Four-point scale from not capable at all (1) to very capable (4)
Self-regulation
Coping planningHow the person plans to cope with distractions and barriersDo MAR users have a plan regarding what to do when the MAR system gets broken?Four-point scale from no detailed plan (1) at all to very detailed plan (4)
CommitmentHow committed the person is to the new behavior (i.e., using MAR water)Do you feel committed to collect water from the MAR system? Four-point scale from not at all committed (1) to completely committed (4)
Context
Alternative optionsThe level of competition that MAR faces in a communityHow many drinking water options alternative to the MAR system do you have in your community?Three-point scale from many alternatives (3) to few alternatives (1)
Table 3. Descriptive statistics.
FactorsSub-FactorsDescriptive Statistics
nRangeMSD
RiskPerceived vulnerability636(1–4)2.701.09
Perceived severity636(1–4)1.840.78
Factual knowledge636(1–4)2.400.68
AttitudePerceived distance636(1–4)2.460.93
Perceived cost636(1–4)2.410.98
Accessibility636(1–4)2.471.06
Perceived Taste636(1–5)3.481.37
Perceived Smell636(1–5)3.081.44
Color636(1–5)4.161.20
NormsDescriptive norm636(1–4)2.150.98
Injunctive norm636(1–4)2.321.07
AbilitySelf-efficacy636(1–4)3.320.89
Action knowledge636(1–4)2.770.96
Self-regulationCoping planning636(1–4)2.220.86
Commitment636(1–4)2.351.20
ContextAvailability of alternative options636(1–3)2.140.81
Total household water consumption780open23.278.56
% MAR water in total household water consumption636open29.3940.72
Table 4. Linear regression analysis results.
FactorsSub-FactorsCorrelationRegression Analysis
RBSE Bβtp-Value
RiskPerceived vulnerability0.4224.0161.2370.1083.2460.001 ***
Perceived severity0.0780.3901.416−0.008−0.2750.783
Factual knowledge0.2537.2391.6820.1224.3040.000 ***
AttitudePerceived distance0.1782.3221.5050.0531.5420.123
Perceived cost0.1542.0291.1870.0491.7090.088 *
Accessibility0.2501.4531.3290.0381.0940.274
Perceived Taste0.3482.8411.0440.0962.7210.007 ***
Perceived Smell0.250−1.0270.937−0.036−1.0960.273
Color0.145−0.8481.002−0.025−0.8460.398
NormsDescriptive norm0.58311.2011.4090.2707.9500.000 ***
Injunctive norm0.67816.1091.4320.42411.2460.000 ***
AbilitySelf-efficacy0.2942.2511.3500.0491.6670.096 *
Action knowledge0.182−2.7141.238−0.064−2.1930.029 **
Self-regulationCoping planning−0.089−3.0571.545−0.065−1.9790.048 **
Commitment0.2930.3750.9780.0110.3840.701
ContextAvailability of alternative options0.236−2.9371.670−0.058−1.7590.079 *
* p < 0.10, ** p < 0.05, *** p < 0.0; adjusted R2 = 555.

