A Novel and Facile Method to Characterize the Suitability of Metallic Iron for Water Treatment
by
 , ,
, ,
Mesia Lufingo
1,* ,
,
Arnaud Igor Ndé-Tchoupé
2,
Rui Hu
3,
Karoli N. Njau
1 and
Chicgoua Noubactep
3,4,* 1
Department of Water and Environmental Science and Engineering, Nelson Mandela African Institution of Science and Technology, Arusha 23311, Tanzania
2
Department of Chemistry, Faculty of Sciences, University of Douala, Douala B.P. 24157, Cameroon
3
School of Earth Science and Engineering, Hohai University, Fo Cheng Xi Road 8, Nanjing 211100, China
4
Department of Applied Geology, Universität Göttingen, Goldschmidtstraße 3, D-37077 Göttingen, Germany
*
Authors to whom correspondence should be addressed.
Water 2019, 11(12), 2465; https://doi.org/10.3390/w11122465
Submission received: 30 September 2019
/
Revised: 15 November 2019
/
Accepted: 21 November 2019
/
Published: 23 November 2019
(This article belongs to the Section Wastewater Treatment and Reuse)
Abstract
:Metallic iron (Fe0) materials have been industrially used for water treatment since the 1850s. There are still many fundamental challenges in affordably and reliably characterizing the Fe0 intrinsic reactivity. From the available methods, the one using Fe0 dissolution in ethylenediaminetetraacetic acid (EDTA—2 mM) was demonstrated the most applicable as it uses only four affordable chemicals: Ascorbic acid, an ascorbate salt, EDTA and 1,10-Phenanthroline (Phen). A careful look at these chemicals reveals that EDTA and Phen are complexing agents for dissolved iron species. Fe3-EDTA is very stable and difficult to destabilize; ascorbic acid is one of the few appropriate reducing agents, therefore. On the other hand, the Fe2-Phen complex is so stable that oxidation by dissolved O2 is not possible. This article positively tests Fe0 (0.1 g) dissolution in 2 mM Phen (50 mL) as a characterization tool for the intrinsic reactivity, using 9 commercial steel wool (Fe0 SW) specimens as probe materials. The results are compared with those obtained by the EDTA method. The apparent iron dissolution rate in EDTA (kEDTA) and in Phen (kPhen) were such that 0.53 ≤ kEDTA (μg h−1) ≤ 4.81 and 0.07 ≤ kPhen (μg h−1) ≤ 1.30. Higher kEDTA values, relative to kPhen, are a reflection of disturbing Fe3 species originating from Fe2 oxidation by dissolved O2 and dissolution of iron corrosion products. It appears that the Phen method considers only the forward dissolution of Fe0. The Phen method is reliable and represents the most affordable approach for characterizing the suitability of Fe0 for water treatment.
1. Introduction
Inadequate access to safe drinking water (and sanitation) is the most pervasive problem currently afflicting the developing world [1,2,3,4,5,6]. Moreover, water scarcity is expected to grow worse in the coming decades, even in regions currently considered water-rich [1,7]. Therefore, new robust, efficient, affordable, and applicable water treatment technologies are urgently needed [1,7,8]. Ideally, such innovative technologies should be simple to operate and maintain, be able to function without electricity and be based on local resources and skills [2,4,5]. Filtration on metallic iron (Fe0) beds has been discussed in the literature as such an applicable technology for universal access to safe drinking water to low-income communities [9,10].
The design, construction, and management of Fe0-based filtration systems is a typical civil engineering task. The management comprises filter maintenance, waste disposal, and Fe0 recycling [2,11,12,13]. Such projects can be made sustainable and large scale applicable by science-basing the design [8,12,14,15,16]. This design should consider the Fe0 life cycle as Fe0 is the ′heart′ of the system. Characterizing the Fe0 life cycle [17] starts and ends with carefully characterizing (1) the intrinsic reactivity of each used material, (2) its time-dependent corrosion kinetic, and (3) the impact of its corrosion products (FeCPs) on the hydraulic conductivity (permeability loss) of the designed filter [18]. Although all three aspects are known from the mainstream iron corrosion literature, available knowledge has not yet been summarized to enable a science-based design of Fe0-based filters [10,12,15,18,19]. The present work is focused on characterizing the Fe0 intrinsic reactivity. It is just recalled here that (1) each Fe0 specimen has its own intrinsic reactivity [20,21,22], (2) the time-dependent corrosion kinetic of Fe0 corrosion is best described in investigations for modeling the cracking of reinforced concrete structures [23,24,25] and (3) the volumetric expansive nature of iron corrosion [26] is the first cause of permeability loss in Fe0-based filters [14,27,28,29,30].
Information regarding the Fe0 intrinsic reactivity is largely confusing because ′reactivity′ and ′efficiency′ are often randomly interchanged [12,15,31,32]. A representative example is a recent article by [33] entitled “Enhanced reactivity and electron selectivity of sulfidated Fe0 toward chromate under aerobic conditions”, wherein the authors comparatively presented results of Cr6 removal in the Fe0/H2O versus S-Fe0/H2O systems. S-Fe0 is a sulfidated specimen, a Fe0/S composite. For each Fe0 specimen, the S-Fe0/H2O system was more efficient at removing Cr6 than the Fe0/H2O system: 7.5- and 10.7-fold greater removal efficient [33]. This good experimental observation was interpreted by considering an increase of the Fe0 specific surface area (aspect 1) because of the enrichment of Cr6 anions in the FeSx layer. Additionally, the FeSx layer (shielding Fe0) is anion-selective (aspect 2). Both aspects (1 and 2) were reported to favor ′selective′ electron transfer from the Fe0 core to Cr6 because FeSx is electronic conductive. While this interpretation is accepted, it has not out ruled alternative views. For example, (1) sulfidation increases electron mobility in the composite, and thus the intrinsic reactivity, (2) Fe0 is corroded by water to produce Fe2 (and H2), and Cr6 is reduced by Fe2 [34,35,36]. Additionally, the Fe0 surface is permanently shielded by a positively charged oxide-scale [37,38,39,40,41] attracting Cr6 anions. The evidence that alloying with S (sulfidation) enhances the intrinsic reactivity of each Fe0 should not be misinterpreted as “sulfidation improves the Fe0 efficiency” because designing an efficient system is a site-specific task. For example, if a more reactive material is unnecessarily used at a given site, rapid system clogging will be the net result: Initially efficient but not sustainable [2].
Reliable information about the intrinsic reactivity of Fe0 materials is crucial in designing efficient and sustainable Fe0-based filters [9,18,20,22,42,43,44,45,46,47,48,49]. Li et al. [22] recently reviewed information about appropriately selecting Fe0 materials for water treatment and environmental remediation. They presented an extensive overview of available tools to characterize Fe0 materials including the determination of the specific surface area, the in situ characterization of corrosion processes and the characterization of Fe0 morphology and size. They highlighted that, because of the complexity of the Fe0/H2O system and the uniqueness of each Fe0 specimen, different characterization tools should be employed together to facilitate the deployment of the next generation sustainable Fe0-based remediation systems. This statement is in tune with efforts that have culminated in the use of ethylenediaminetetraacetic acid (EDTA) to characterize the Fe0 intrinsic reactivity some 15 years ago [45].
The present work is a continuation of an effort to characterize the intrinsic reactivity of Fe0 specimens based on the kinetics of their dissolution in a dilute solution of complexing agents. Previous works were based on Fe0 dissolution in EDTA [9,20,21,45,50,51]. The interpretation of achieved results was complicated by the evidence that EDTA dissolves amorphous Fe3-components of iron corrosion products (FeCPs) as well [51,52]. This is due to the extreme stability of the Fe3-EDTA complex [53,54,55,56]. Therefore, characterizing the intrinsic reactivity of very reactive Fe0 material such as steel wool specimens (Fe0 SW) was very challenging [51]. In other words, developing a tool to reliably characterize the intrinsic reactivity of Fe0 SW would be a progress for the Fe0 remediation community. The purpose of this study was to develop an experimental method to characterize the intrinsic reactivity of Fe0 SW using their initial dissolution in 1,10-Phenanthroline (ortho-Phenanthroline or Phen). Nine (9) commercial Fe0 SW were used. The selection of Phen was justified by the extreme stability of the Fe2-Phen complex [53,55]: (1) avoiding any further oxidation of Fe2 from Fe0 dissolution and (2) non-addressing any Fe3 species already available in the system [52]. Parallel experiments using EDTA were performed and the results are comparatively discussed.
2. Materials and Methods
2.1. Solutions
Working solutions were prepared from a monohydrated 1,10-Phenanthroline (Phen) (Merck, Darmstadt, Germany) and a disodium salt of ethylenediaminetetraacetic (EDTA) (Merk, Darmstadt, Germany). An iron standard solution (1000 mgL−1, NIST® (Gaithersburg, MD, USA)) from HACH (Loveland, CO, USA) was used to calibrate the spectrophotometer. Other used chemicals included ascorbic acid, hydrochloric acid, and nitric acid. All used chemicals were of analytical grade.
2.2. Fe0 Materials
A total of nine (9) locally available commercial steel wool (Fe0 SW) specimens were purchased from East Africa Steel Wool (Ind.) Limited in Dar Es Salaam (Tanzania) and used. The tested 9 Fe0 SW covered all grades of steel wools. Table 1 summarizes the main characteristics of the materials together with their elemental composition.
2.3. Experimental Procedure
2.3.1. Elemental Composition of Used Fe0 SW
The procedure presented by [57] was used. A solution containing HNO3 (70%), HCl (35%) and de-ionized water was prepared at a 1:1:1 ratio by volume. Analytes were prepared by adding 12 mL of the mixed acid solution to 0.5 g of Fe0 SW in a beaker. The beaker was covered with a watch glass, and after 10 min pre-digestion at room temperature (23 ± 2 °C), the solution was gradually heated on a hotplate for approximately 30 min to 200 °C. After cooling for about 15 min, the sample digest was made up to 100 mL with de-ionized water, and an aliquot was transferred to a 50 mL auto-sampler vial for analysis. Then, 1 mL of the sample was diluted with de-ionized water to a mark in a 250 mL volumetric flask prior to Inductively Coupled Plasma (ICP) analysis.
2.3.2. Iron Dissolution
Iron dissolution studies were accomplished by using 0.10 g of each Fe0 SW in 50 mL of the complexing agent (2 mM Phen, 6 mM Phen, and 2 mM EDTA) for up to 5 days (120 h). The experiments were performed with the conventional quiescent experimental protocol for the EDTA test [45]. Tested SW specimens were cut into 2 to 3 cm before weighing and submerged in 50 mL graduated plastic cell-star tubed (narrow beakers) containing EDTA or O-Phen. All experiments were performed in triplicates, protected from direct sunlight.
2.3.3. Analytical Method
The aqueous iron concentration was determined with a Rayleigh UV/VIS Spectrophotometer (Beijing Beifen-Ruili Analytical Instruments (group) Co., Ltd., Beijing, China), at a wavelength of 510 nm using a 1.0 cm cuvette. The instrument was calibrated for iron concentration ≤10 mg L−1. An ascorbate buffer was used to reduce Fe3-EDTA before adding Phen for Fe2 complexation before Fe determination. Samples from the Phen experiments were treated in the same way as the same calibration curve was used [21].
2.3.4. Expression of Results
The basic idea of using complexing agents to characterize the intrinsic reactivity of Fe0 materials is that iron dissolution (from Fe0 and FeCPs) is initially a linear function of the time [45]. Thus, for a certain time frame (t1 > t0) after the initiation of the experiment (t0) the total iron concentration ([Fe]t) as defined in Equation (1) is a linear function (of time).
[Fe]t = a × t + b
Therefore, the goal of this study was to identify the time frame for the linearity of Equation (1). The regression coefficients (a and b) are characteristic for each Fe0 specimen. In fact, “a” is the rate of Fe dissolution from Fe0 while “b” gives an estimation of the amount of FeCPs on the material or the fraction thereof that is dissolved by the used complexing agent (here EDTA and Phen). For the EDTA and Phen dissolution experiments, the corresponding values are termed as kEDTA and kPhen, respectively. Herein, kEDTA and kPhen values were obtained from Microsoft Excel 2017 (Microsoft, Redmond, WA, USA).
3. Results and Discussion
The results of elemental analysis are presented in Table 1. It is seen that all 9 specimens are made up of at least 98.4 % Fe. Accordingly, differences in intrinsic reactivity are due to the manufacturing process (not accessible) and to the distribution of the remaining 1.4% alloying elements. Relevant elements are Co, Cr, Cu, Ni, and Pb (Table 1). For both Grade 00 specimens (very fine: SW3 and SW9) differences can also be attributed to the surface oxidation state.
3.1. Appropriateness of the Experimental Approach
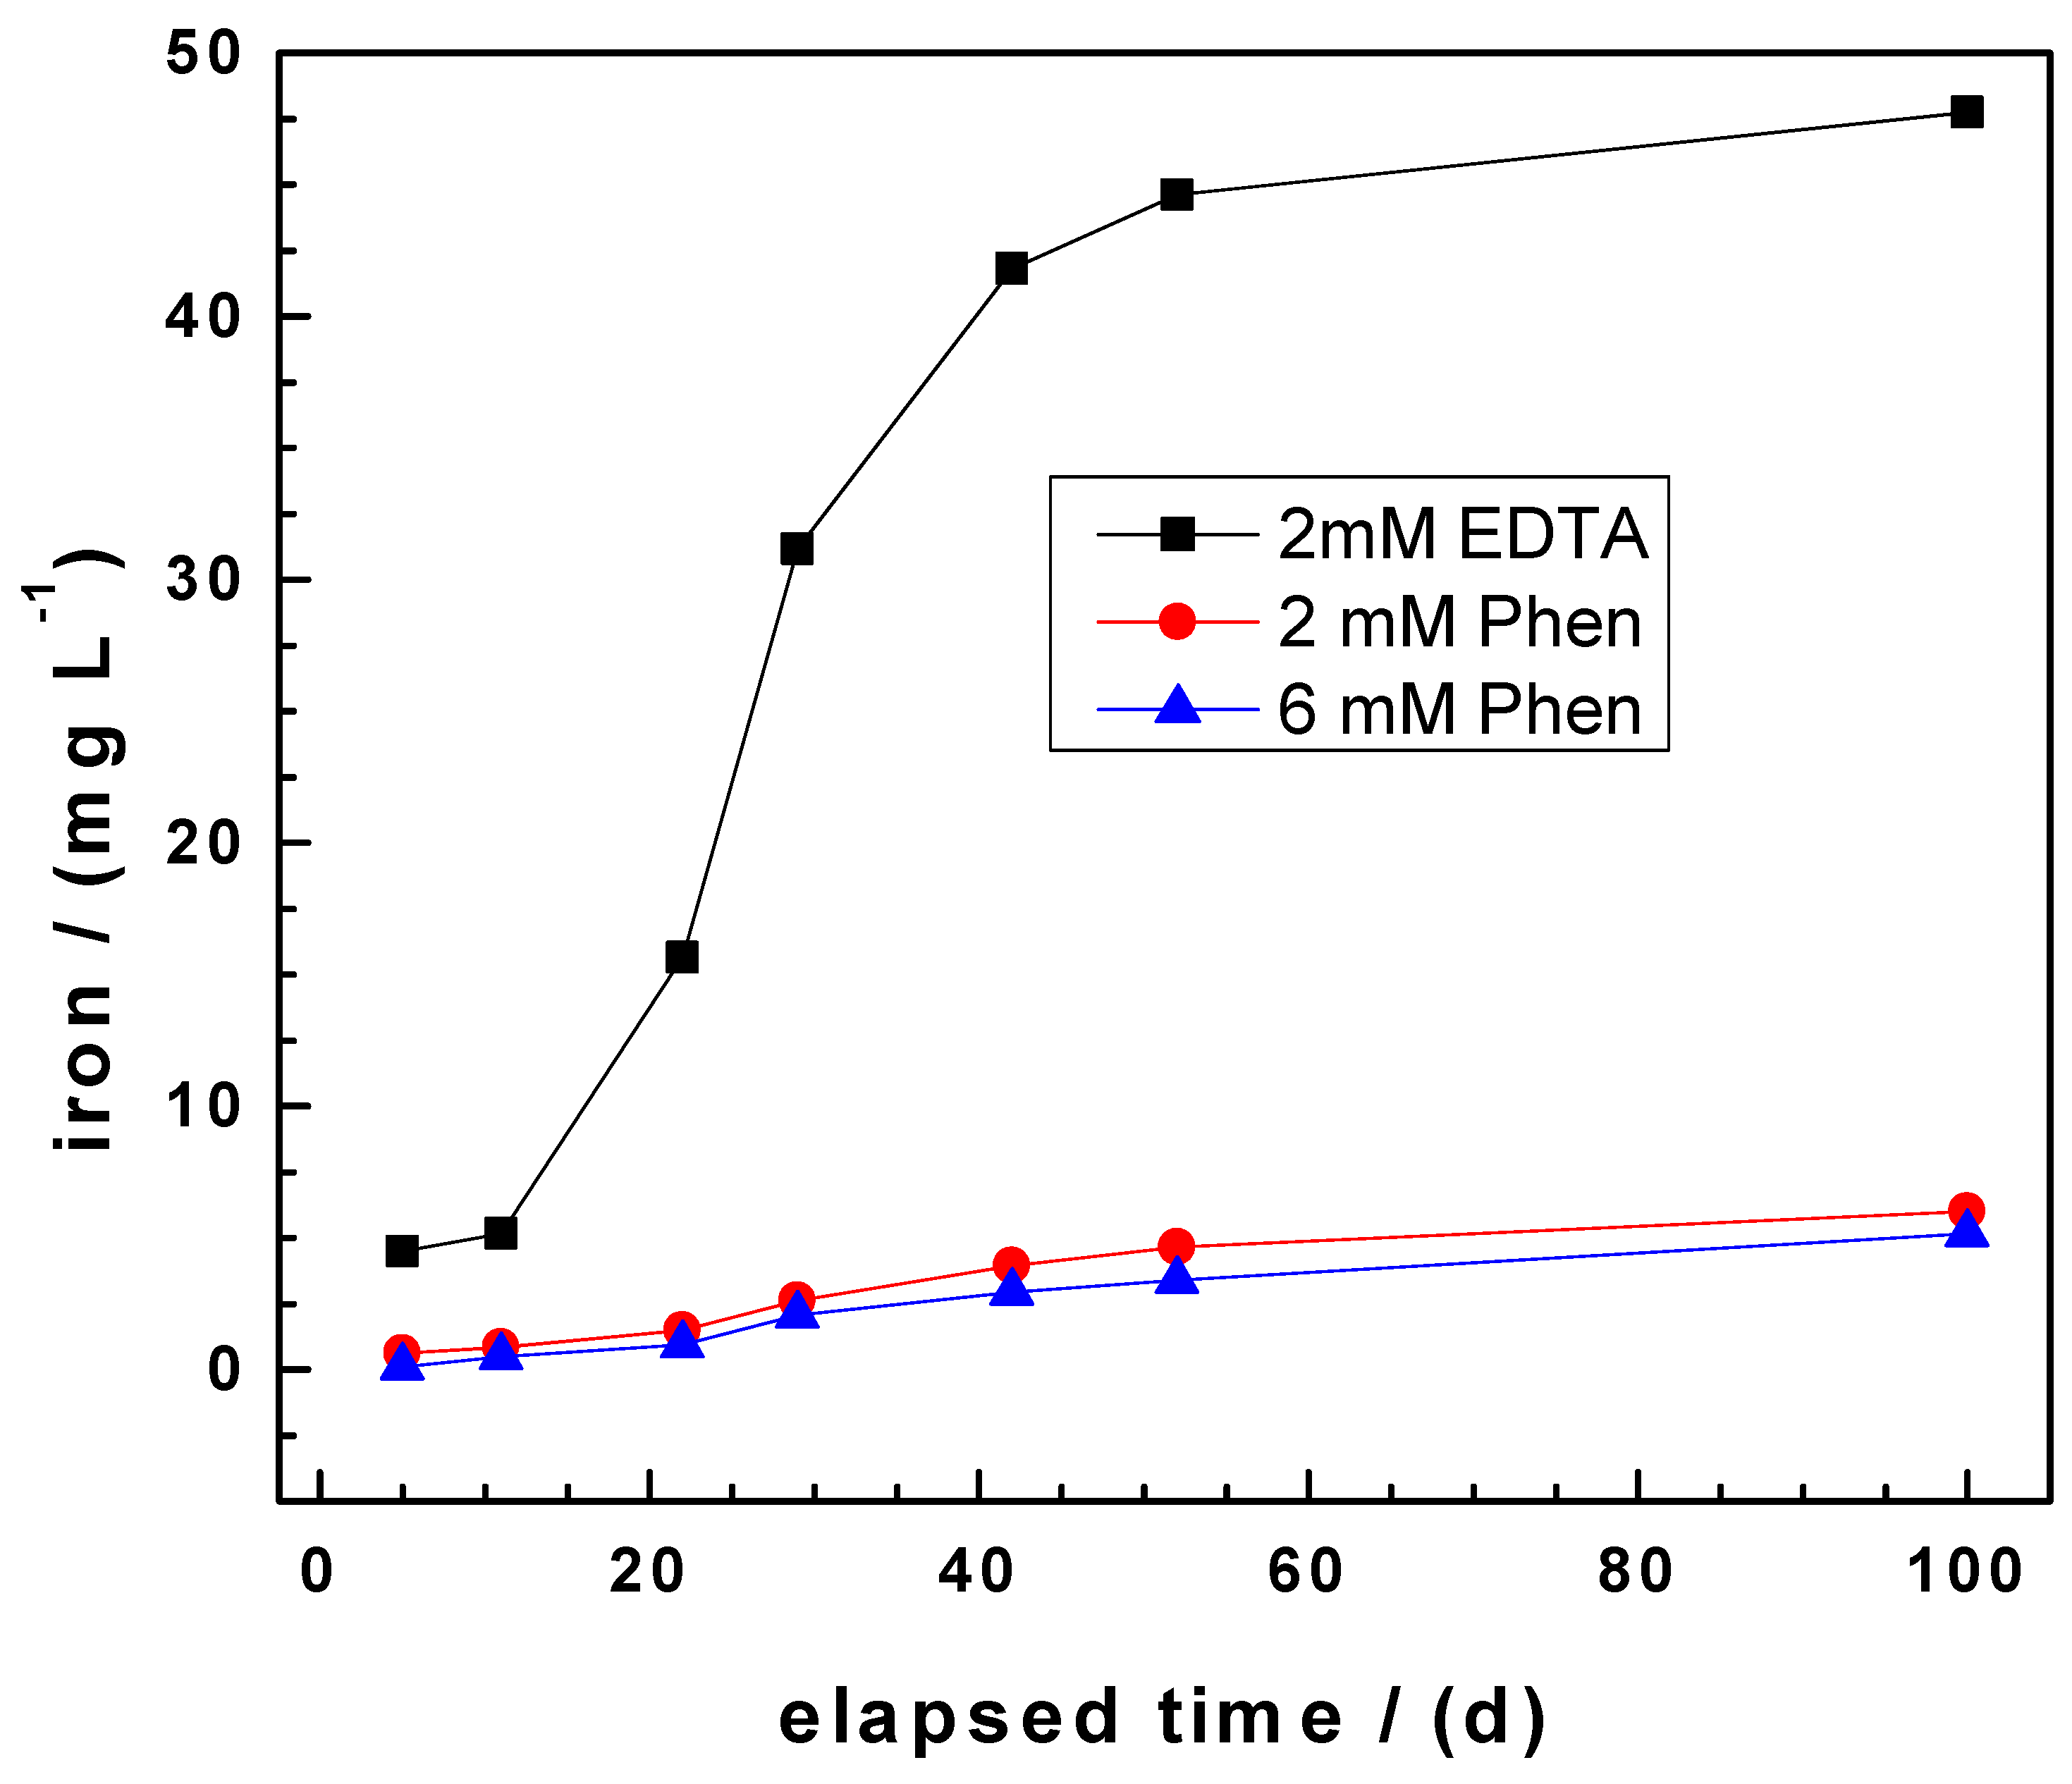
Figure 1 compares the results of SW9 dissolution in three different solutions: 2 mM EDTA, 2 mM Phen, and 6 mM Phen. EDTA dissolved far more iron than Phen (up to 40 mg L−1 vs. less than 8 mg L−1). Furthermore, there was no difference in the extent of iron dissolution in 2 mM and 6 mM Phen. It should be kept in mind that 6 mM Phen (Fe:Phen = 1:3) corresponds to 2 mM EDTA (Fe:EDTA = 1:1) in the stoichiometry of Fe complexation by both agents. The differential behavior from Figure 1 is explained by considering the chemistry of the system. In fact, in both cases, Fe0 was corroded by water (H2O or H+) according to Equation (2).
Fe0 + 2 H+ ⇒ Fe2+ + H2
Fe2+ + Phen ⇒ (Fe-Phen)2+
4 Fe2+ + O2 + 2 H+ ⇒ 4 Fe3+ + 2 OH−
Fe3+ + EDTA ⇒ (Fe-EDTA)3+
FeOOH + EDTA + 3 H+ ⇒ (Fe-EDTA)3+ + 2 H2O
In the presence of Phen, Fe2+ is complexed to form very stable Fe-Phen (Equation (3)) which blocks the Fe2+ oxidation by dissolved oxygen (Equation (4)). In the presence of EDTA, Fe2+ oxidation to Fe3+ (Equation (4)) is rather accelerated because (Fe-EDTA)3+ is more stable than (Fe-EDTA)2+ [53,55,58]. Resulting Fe3+ is then complexed by EDTA (Equation (5)). It should be recalled that (Fe-EDTA)3+ is not destabilized by many inorganic reducing agents, including hydroxylamine. Hydroxylamine is used in the standard spectrophotometric method to reduce Fe3 species prior to the formation of the characteristic orange complex of Fe2-Phen [59]. Lastly, amorphous Fe3 corrosion products are (at least partly) dissolved in EDTA (Equation (6)). Amorphous Fe2 corrosion products, if available, would dissolve both in EDTA and Phen [52].
The discussion until now clearly shows that the Phen method was (1) not sensible to dissolved oxygen and (2) less sensible to the presence of atmospheric corrosion products on Fe0 than the EDTA method. Thus, the Phen method was free from an inherent limitation of the EDTA method making its application for characterizing (1) very reactive materials and (2) fine Fe0 specimens containing large amounts of atmospheric corrosion products [20,51]. Hildebrandt [51] recently presented an original approach to address the second challenge. This consisted of reducing the mass of Fe0 SW from 0.1 g to 0.01 g in 50 mL of the EDTA solution. Even then, a linear relationship between the elapsed time and the dissolved iron concentration (Equation (1)) was difficult to obtain [51]. The perfect linearity observed for Phen in Figure 1 confirms that using the Phen method practically only Fe0 oxidative dissolution was characterized [60]. Hu et al. [52] recently presented the first application of the Phen test for granular Fe0 materials.
3.2. Evidencing the Non-Linear Kinetic of Iron Corrosion
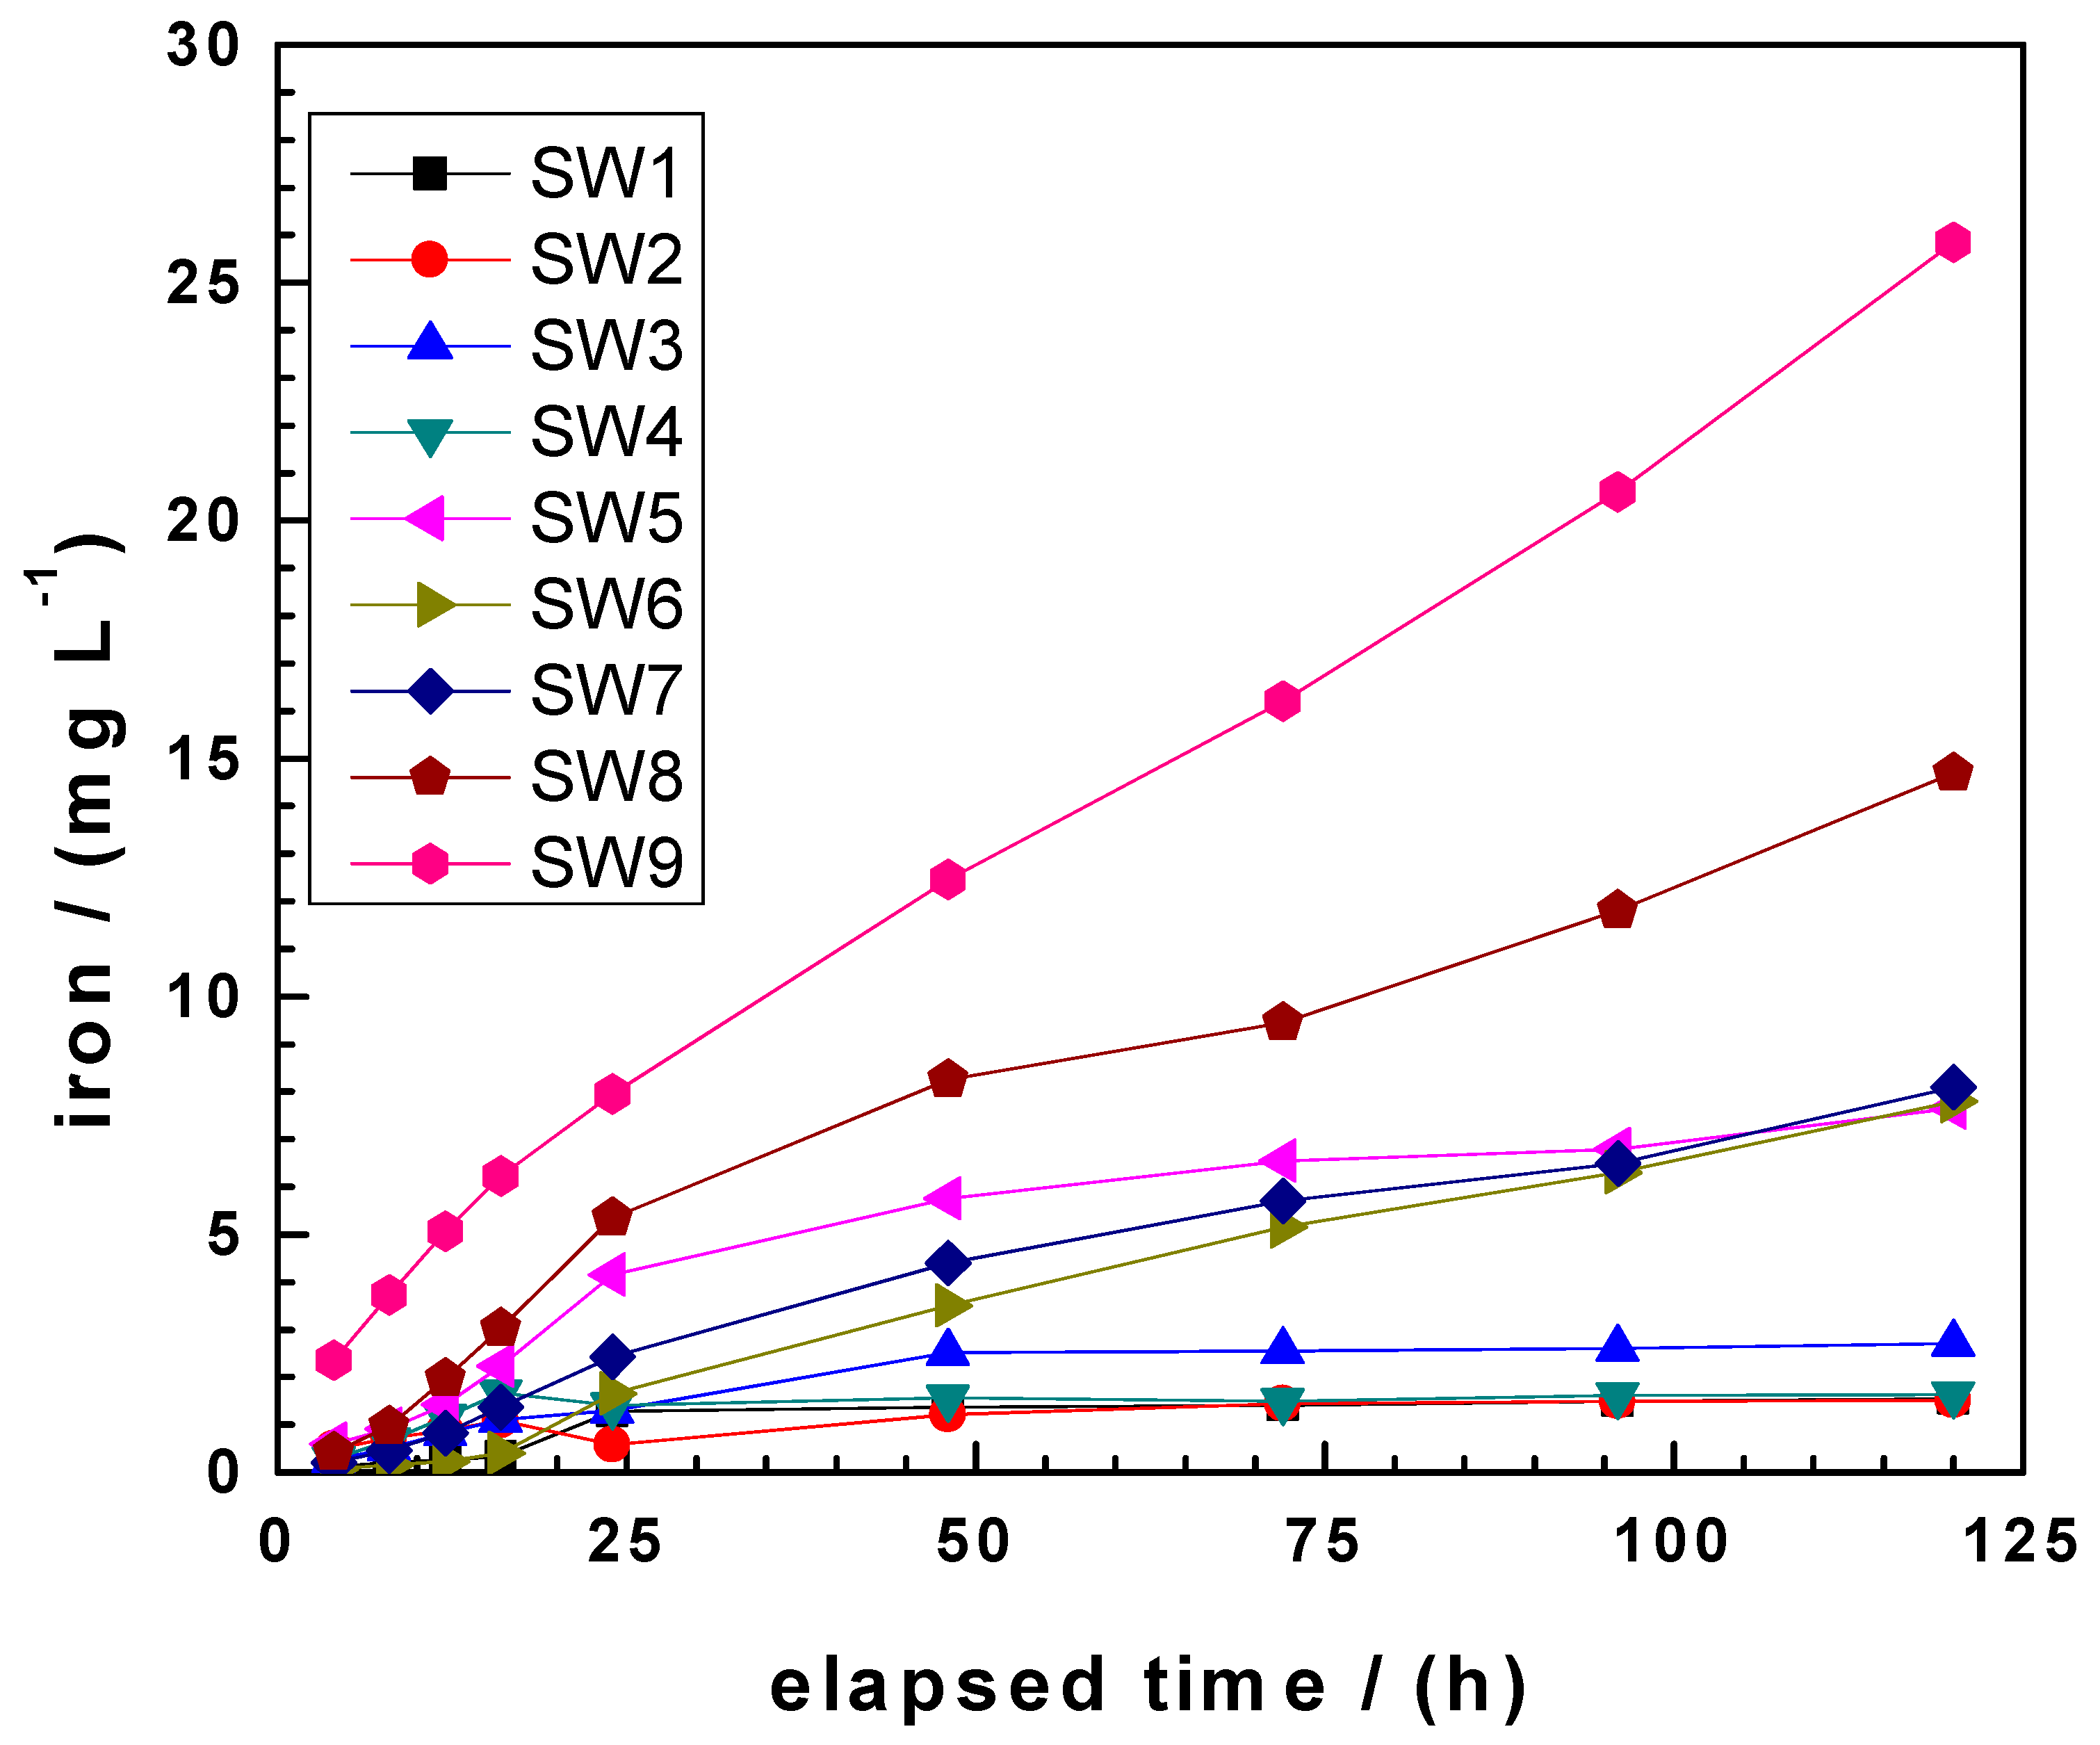
Figure 2 compares changes of iron concentration as a function of time for the 9 tested Fe0 SW in 2 mM Phen for up to 120 h. For all materials, Fe values increased progressively with the experimental duration, even after 120 h of contact. However, a linear increase was observed only during the first 24 h (1 day). In the Fe0/Phen/H2O system, there is no (porous) oxide scale which could justify slow mass transfer into the bulk solution. The solution was also not saturated (Section 3.1). Hence, at longer experimental times, the data indicated the occurrence of a chemical reaction that was slow and specific to each Fe0 SW specimen. This is the first time that the differential kinetics of Fe0 oxidative dissolution was clear evidence in short-term quiescent batch experiments.
Compared to granular Fe0 used in EDTA tests [20], filamentous Fe0 SW was more reactive, but the same mass (0.1 g) could not achieve iron saturation (112 mg L−1). It is recalled that the EDTA test was stopped after 4 days because saturation was approached for more reactive granular samples [45]. As discussed above, dissolution of atmospheric corrosion products also occurred in EDTA. The data in Figure 2 show that the most reactive Fe0 SW used herein could not dissolve 30 mg L−1 of iron in 2 mM Phen after 120 days. The reason has been that only the slow forward dissolution of Fe0 was addressed. This evidence makes the Phen test more reliable that the EDTA test. In addition to using fewer chemicals than the EDTA test, the Phen test was also more affordable [52,60].
In a purely analytical perspective, it is recalled that samples from the Phen test, despite already depicting the orange coloration of Fe-Phen complexes, should be treated in the same way like the calibration standards. In this study ascorbic acid was used because of parallel experiments with EDTA [21]. In routine Phen tests, all other reducing agents (e.g., hydroxylamine) can be used, but the authors recommend ascorbic acid for its less toxicity and even its better affordability [59].
3.3. Comparing kEDTA and kPhen Values
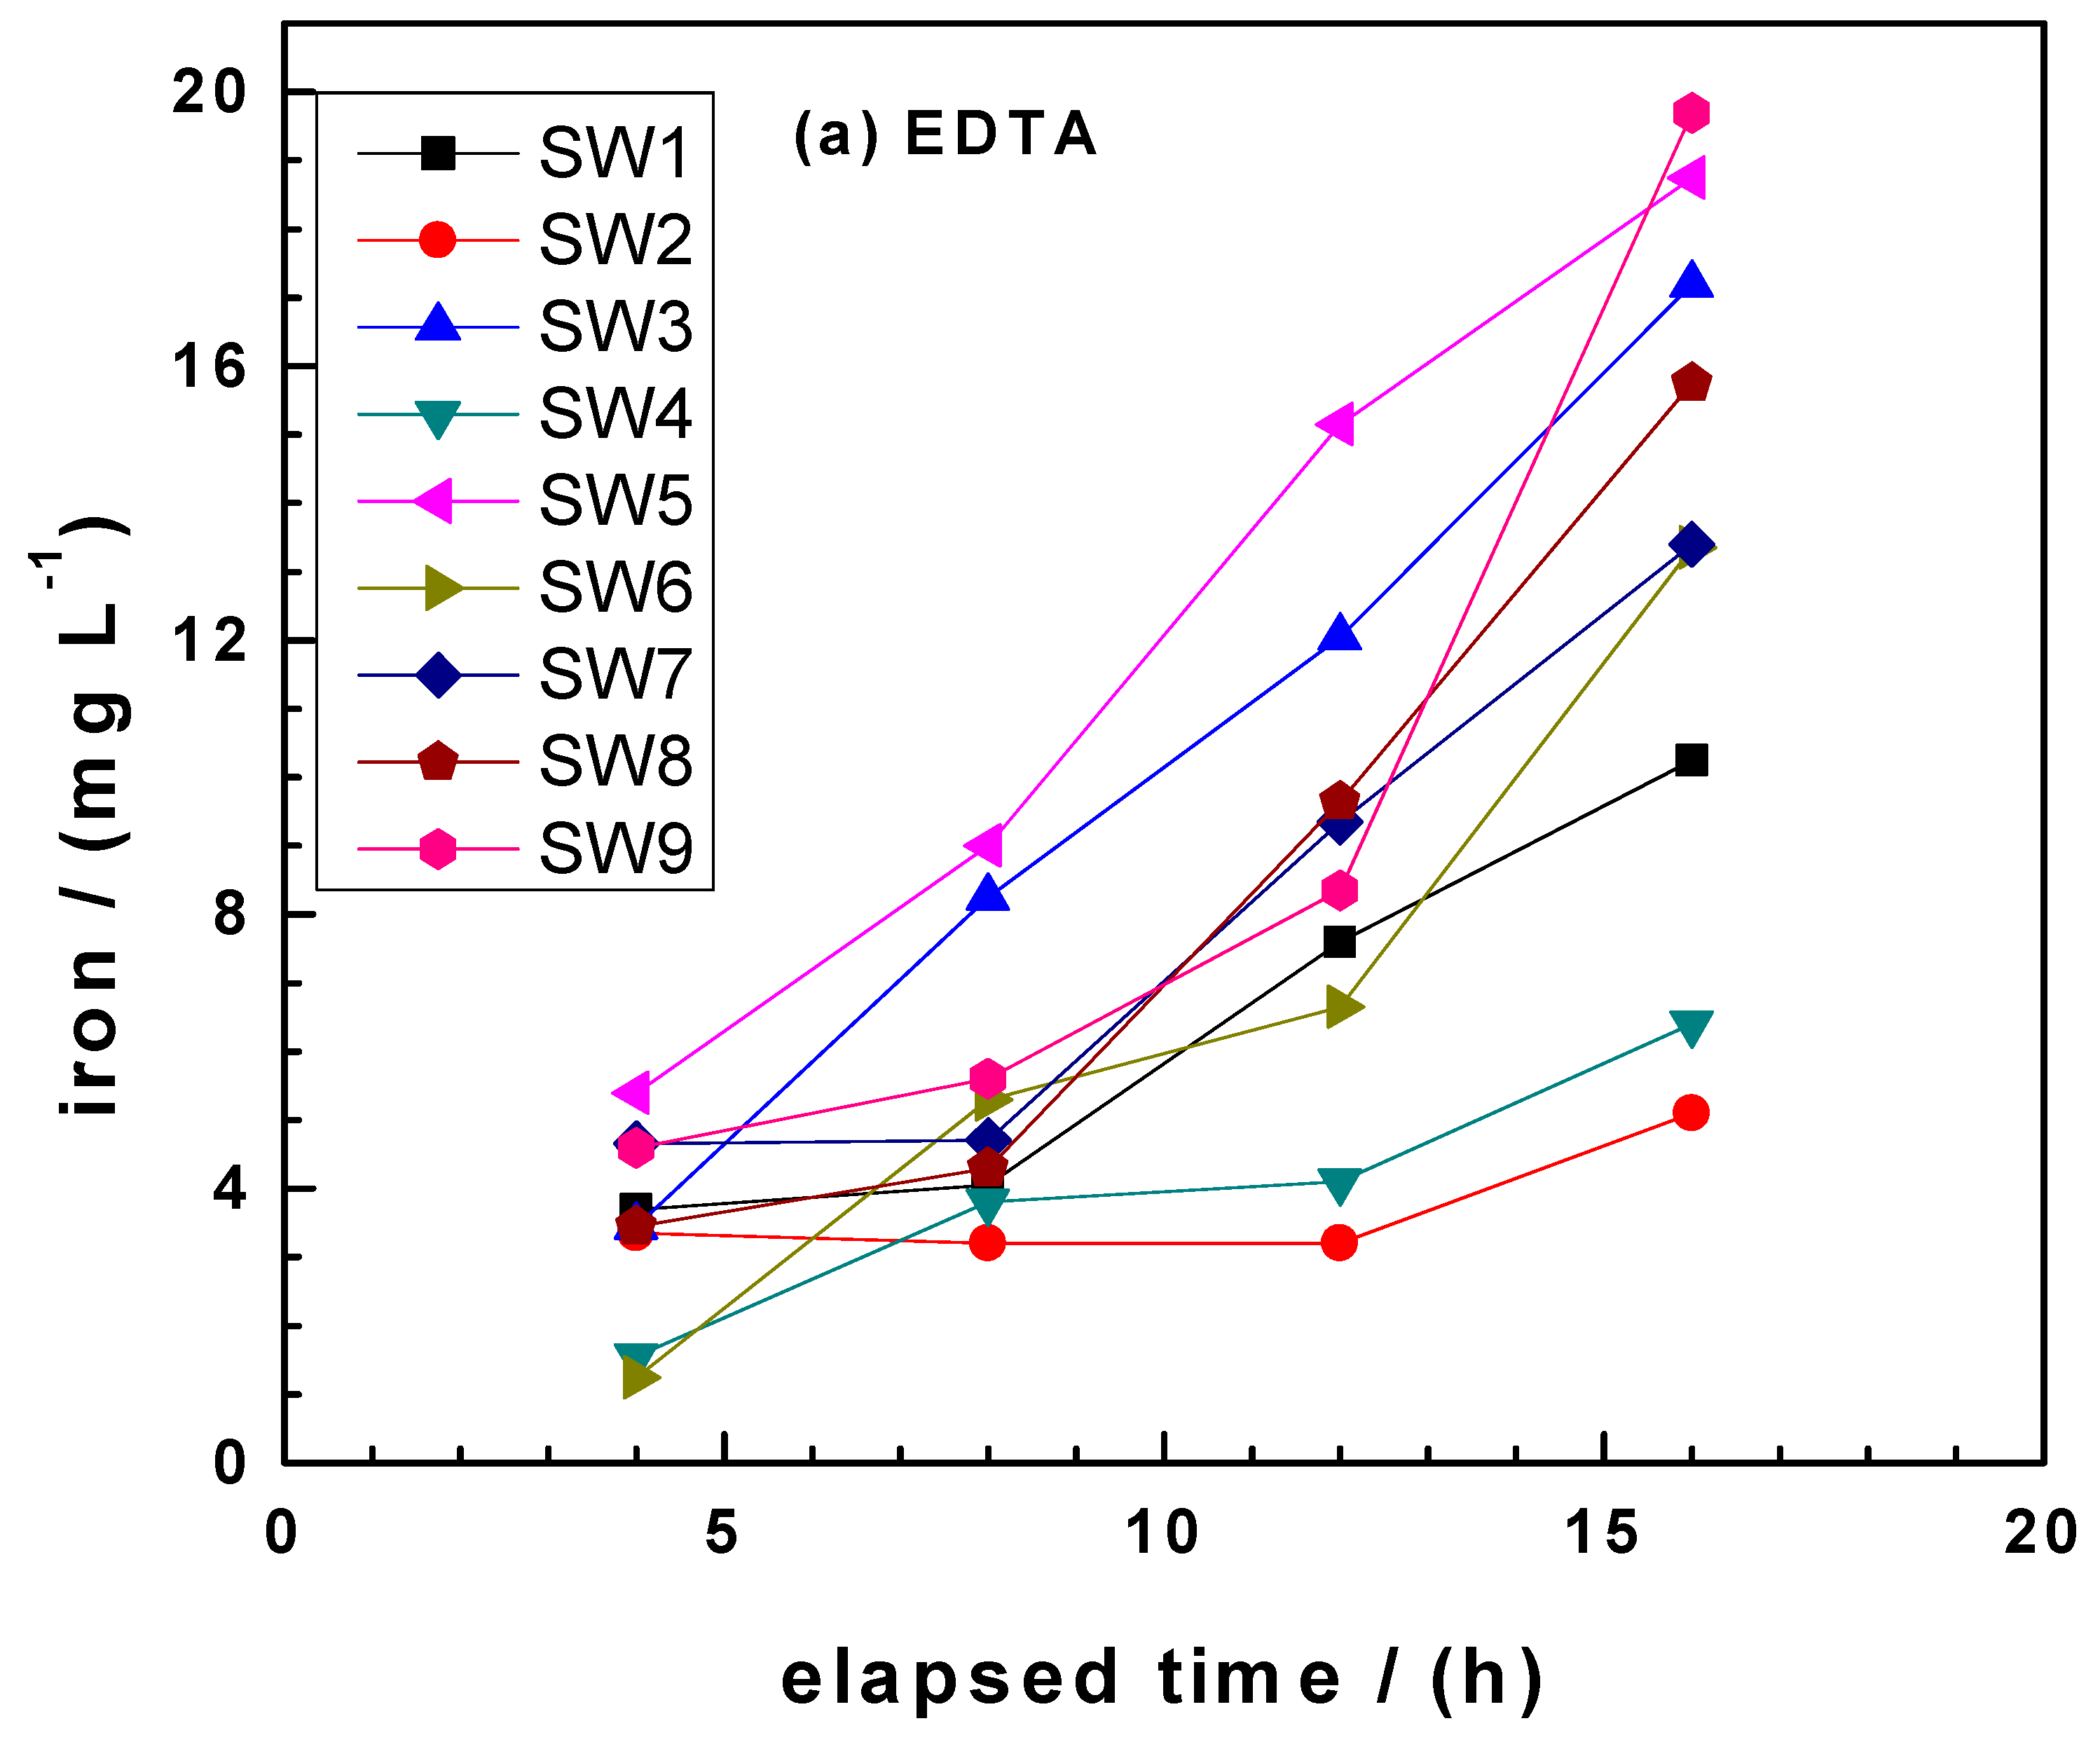
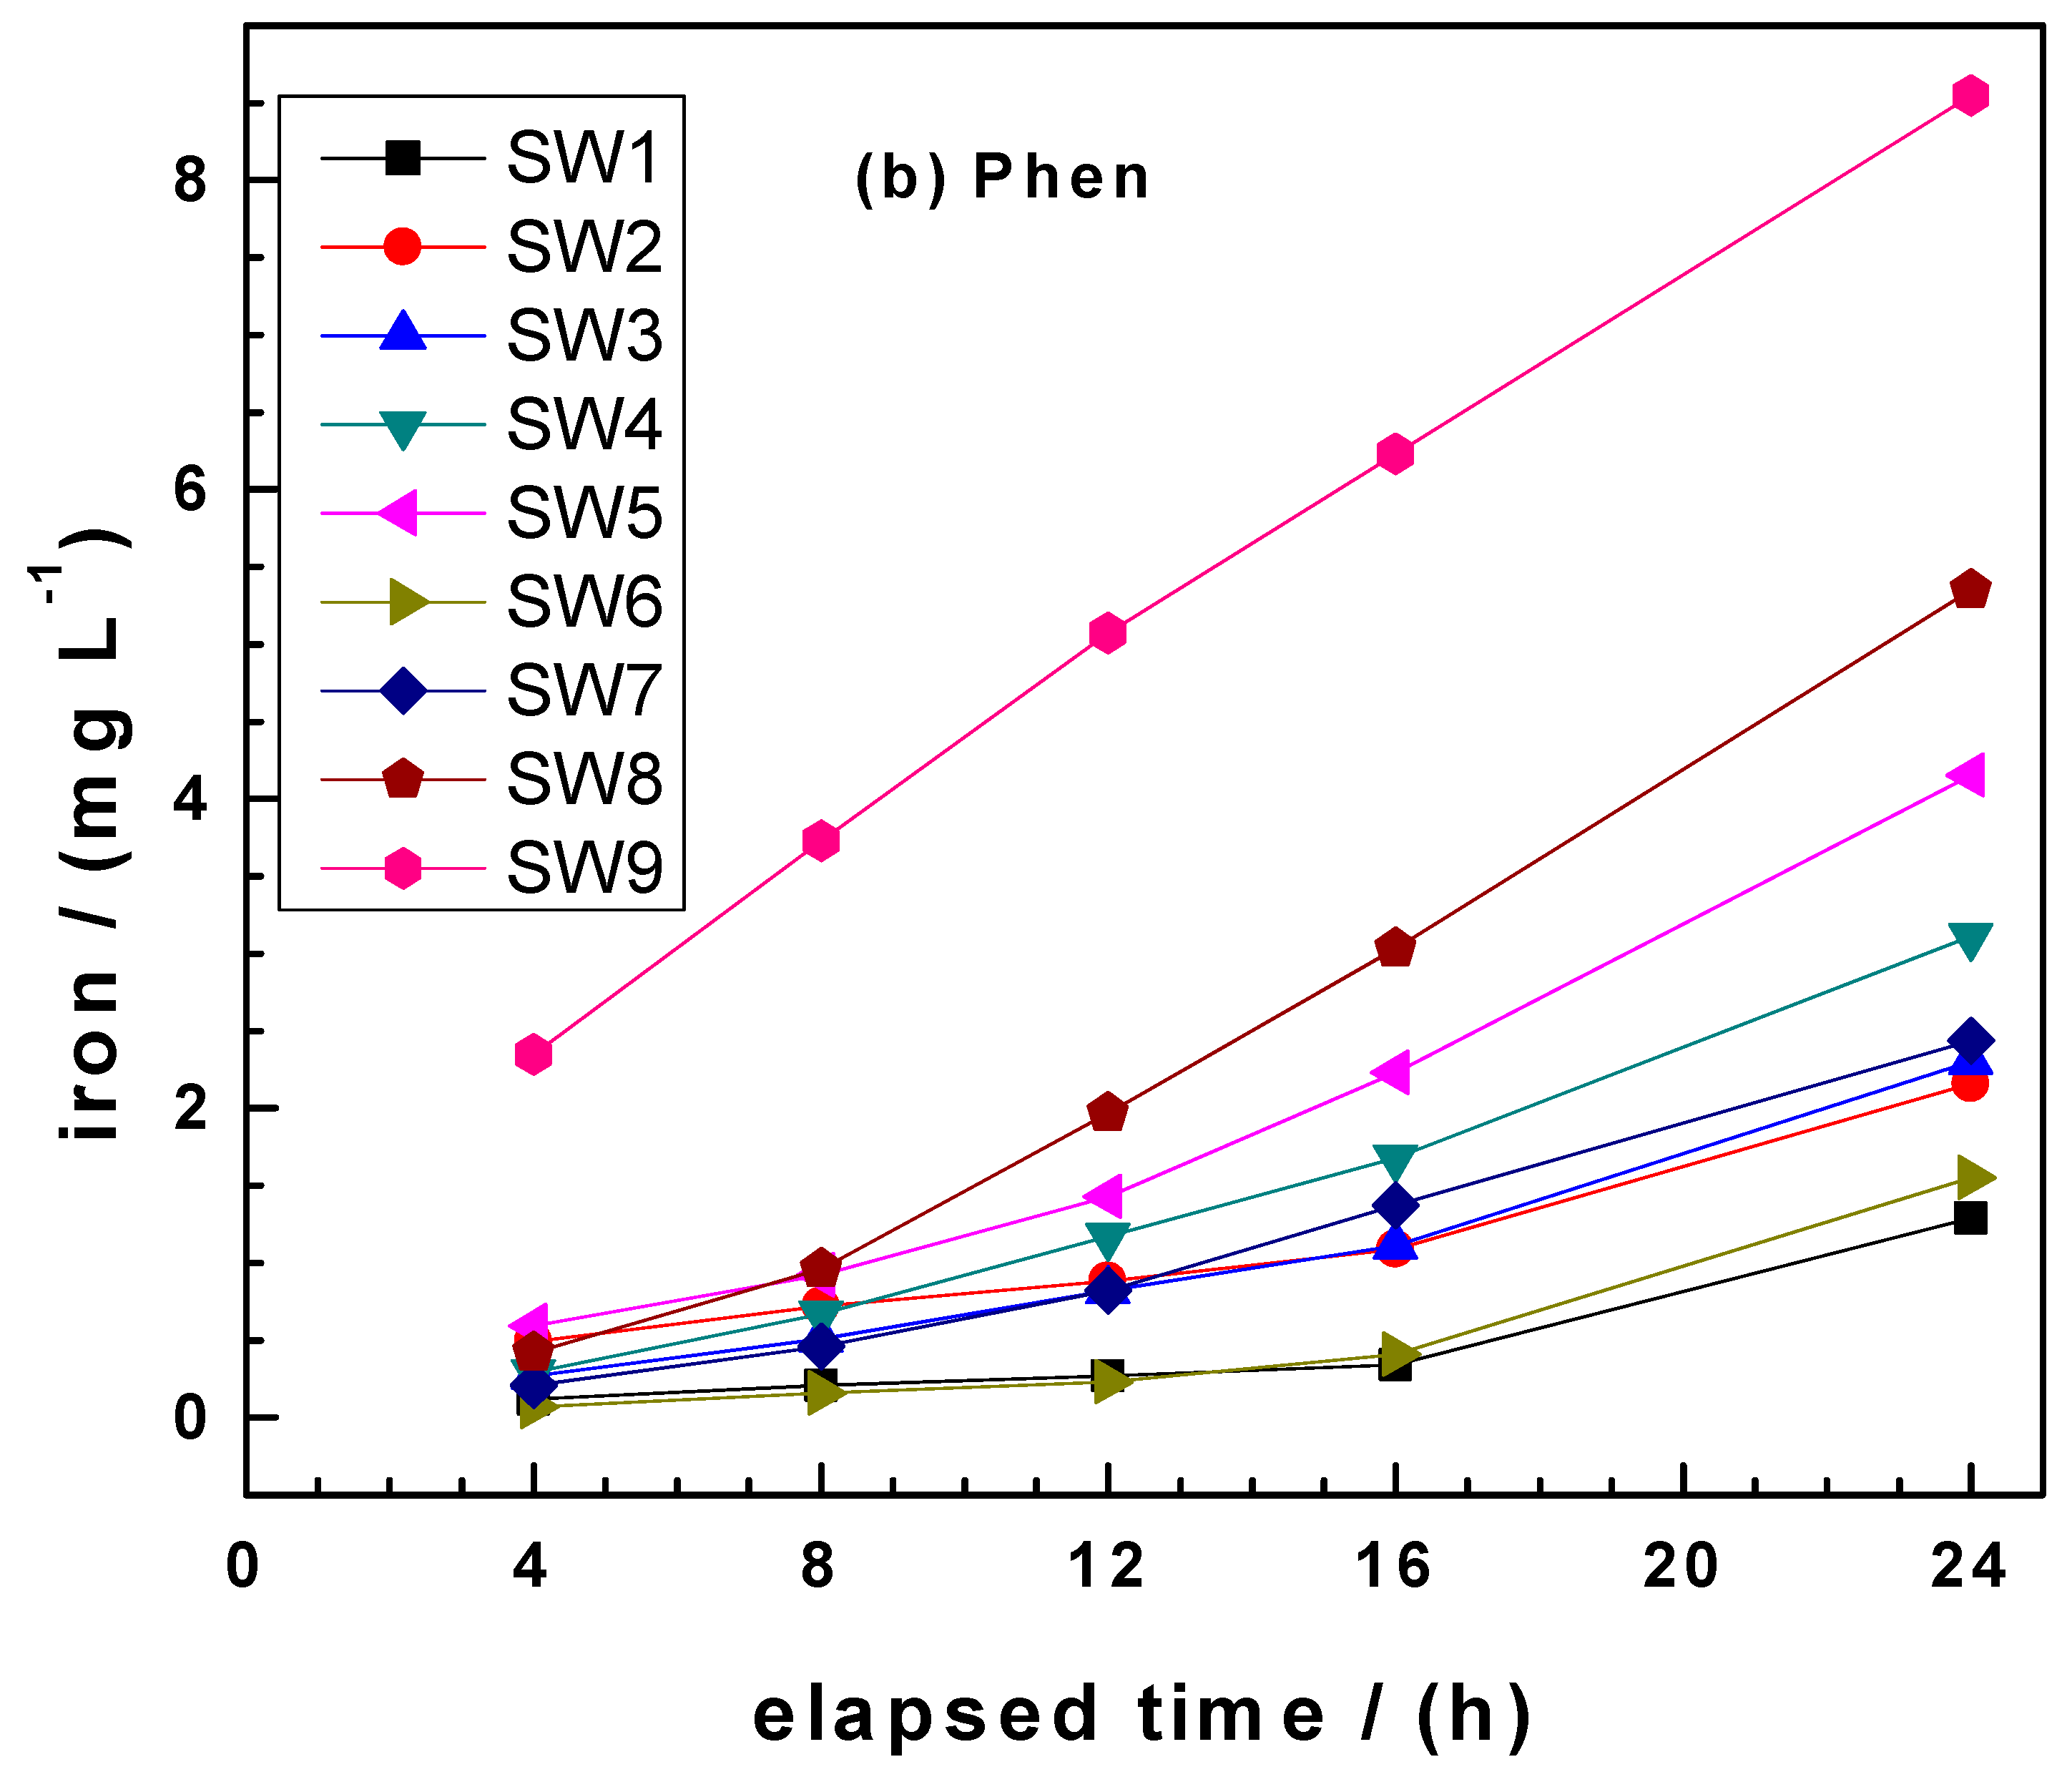
Figure 3 summarizes the results of iron dissolution in EDTA (Figure 3a) and Phen (Figure 3b) for 16 h. Figure 3a depicts a large variability of the standard deviation (results not shown) which results from various amounts of atmospheric corrosion products initially available on the SW specimens and the evidence that dissolved O2 accelerates iron dissolution. For the experiments with Phen (Figure 3b), no such variability was observed as the Phen test is neither sensible to Fe3 species nor to dissolved O2 (Section 3.1). Calculations showed that 2 to 16 times more iron was dissolved in the EDTA systems than in the corresponding Phen systems. Extending the experimental duration to 120 h (5 days) revealed differential behaviors for individual Fe0 SW specimens (Section 3.2, Figure 2). The general trend is that iron dissolution from the coarsest material (SW8) was progressive through the end of the experiments (Figure 2). This trend was also observed for SW9, which was the most reactive by virtue of its “pre-oxidized” surface state.
Table 2 summarizes the k values for both tests for 5 experimental points (N = 5) and an experimental duration of 24 h, corresponding to linearity. The ‘a’ and R2 values are also given. The R2 values for EDTA vary between 0.534 for SW2 and 0.994 for SW3. For Phen all R2 values were larger than 0.94, confirming the better suitability of the Phen test as already discussed (see also [52]). As concerning the ‘b’ values, it is seen that for the EDTA test, four from nine values are negative and large in absolute values (b > 1.03 mg). For the Phen test, only three values are positive but all low (0.055, 0.312, and 1.100 mg), while the 6 negative numbers are very low, (< 0.6 mg). The negative ‘b’ values from the Phen test were due to the very slow kinetics for iron dissolution from less reactive samples (Figure 3b) while negative value from EDTA test was attributed to dissolved O2 and atmospheric corrosion products [20,21,52]. The most important parameters from these tests are the k values.
The k values from Table 2 enable a better classification of the order of reactivity of the tested SW specimens. In 2 mM EDTA and Phen, the increasing order of reactivity are:
- EDTA: SW2 < SW4 < SW1 < SW7 < SW6 < SW8 < SW3 < SW5 < SW9.
- Phen: SW1 < SW6 < SW2 < SW3 < SW7 < SW4 < SW5 < SW8 < SW9.
In both cases, SW9 was the most reactive, while SW1 and SW6 were the least reactive (Figure 2 and Figure 3). While the results from the Phen test are more reliable (forward iron dissolution), more research is needed to ascertain whether in the long term the specimens depicting very similar reactivity herein could be differentiated. One curious observation herein is that it is rather the coarsest sample (SW8) which exhibited the largest kPhen value from the brand new materials. Based on the larger surface area depicted by finer materials, the opposite would have been expected. It is recalled that SW9 was from a different origin and had a pre-oxidized surface.
Certainly, the dynamic process of iron dissolution from concentric layers of Fe0 atoms making up the SW filaments cannot be linear [61,62]. Effects similar to “case hardening” for food and wood drying will lead to “surface hardened layers” [63,64,65] leading to differential kinetics/extents of Fe dissolution for different particle size ranges. In other words, the extent of restricted corrosion rates through resulting surface hardened layers will be different for different grades of Fe0 SW. The results of this research suggest that “case hardening” implies that Fe0 is easier to dissolve from coarser SW than from finer. However, such a conclusion cannot be drawn without considering the manufacturing and storage processes of the different specimens [20].
Comparing the kPhen values having in mind the elemental composition (Table 1) would suggest, for SW8 and SW9, that the Ni content is essential for the Fe0 reactivity. Both samples practically only differ in their Ni content: 0.10 for SW8 and 0.03 for SW9. However, such a key conclusion cannot be drawn based on one example. It has to be remembered that the goal of this research is to screen and recommend Fe0 specimens for further research. On the other hand, designing an efficient Fe0-based water treatment includes selecting the best material to solve a site-specific problem. This might imply purposefully selecting a low reactive material, able to generate satisfactory amounts of corrosion products to achieve water treatment standards for a long time.
Figure 3b shows, interestingly, that iron dissolution from most SW specimens did not take place immediately upon addition of the Phen solution. Iron quantitative dissolution started after a lag time of up to 6 h. Such a lag time was already documented in the process of nitrate removal in Fe0/H2O systems [66,67]. The results herein justified why this was not a typical/general observation. A researcher using SW9 would not necessarily observe a lag time because iron dissolution is comparatively rapid.
3.4. Discussion
The need for applicable methods to (1) assesses the intrinsic reactivity of Fe0 materials and (2) assure their quality control is inherent to the technology and has been recognized in the very early stage of its recent development (post 1990). Summarizing, the experience of the first decade of research [43] recognized difficulties in correlating parameters that had been individually demonstrated to significantly impact the efficiency of remediation systems using Fe0. Relevant parameters include chemical composition, cooling history, feedstock’s processing, kiln firing atmosphere, specific surface area, surface morphology, and type and amount of oxide coatings. The need to further explore these relationships in future research was expressed. However, this effort was not really continued and the Fe0 reactivity was mainly characterized using selected Fe0 specimens and various kinds of pollutants (e.g., Cr6, methylene blue, nitrate, trichloroethylene) [44,47]. The reactivity of the materials was then reflected by the rate constants of their degradation. However, possible probing reactants are inherently different in their chemistry and rate constants vary by several orders of magnitude, making achieved results of limited guidance in selecting Fe0 for the practice [47,49]. Some few pollutant-independent characterization methods have been presented and are summarized below in the chronological order of their publication in the peer-reviewed literature. They are briefly commented.
Reardon [42] presented H2 evolution at neutral pH values as a tool to characterize the reactivity of iron. Probably due to the large Fe0 amount needed to quantitatively produce H2 and the long duration of the experiments, this method has not been considered [21]. Noubactep [68] presented H2 evolution in HCl (initial pH = 2) as a more rapid mean for the same purpose. This tool was completely ignored, perhaps because of the clear different mechanism of H2 evolution at pH < 4.0 (compared to the field situation pH > 6.0). Noubactep et al. [45] presented the EDTA method which was independently introduced two years later by Pierce et al. [50]. The EDTA method has been continuously used and revisited by Noubactep and collaborators as summarized in [21,52]. Kim et al. [47] introduced a method to measure the ‘reductive power’ of Fe0. A tri-iodide/iodide system (I3−/I−, iodine method) was used for the oxidative dissolution of Fe0 specimens and the rate constant of I3− reduction used to characterize the Fe0 reactivity. The iodine method has not considered all previous methods, perhaps because it uses a redox reaction. Li et al. [49] introduced a method based on the Fe3/Fe0 redox reaction (ferric method), which consists of adding a concentrated Fe3 solution (up to 3000 mg L−1) to a Fe0 specimen and quantifying the increase in iron concentration after 4 h. The ferric method seems very simple but ferric iron must be available, and strong dilution must precede iron determination, up to factor 100. Lastly, the Phen method presented in this study uses only one chemical, that is also used in all other methods if the iron is to be determined by spectrophotometry using the 1,10 Phenanthroline method [60]. It is thus not only the simplest but also the most affordable. The Phen test has successfully characterized the intrinsic reactivity of steel wool specimens while using the same mass of material (0.1 g) used for the EDTA test. It is obvious that this test will work for coarser materials. In the meantime, Hu et al. [52] have already validated the Phen test using eight commercial granular materials. The major merit of the Phen test is that it uses the same mass of material (0.1 g) regardless of the size and aggregation state (e.g., filamentous, granular).
The well-established common process implying water decontamination by Fe0 materials is their oxidative dissolution (corrosion). Whether the contaminant is then adsorbed or chemically transformed (oxidized or reduced), oxidation of Fe0 to Fe2 (Equation (2)) is the first step [10,30]. Precisely, this process is characterized by the Phen method and is neither disturbed by dissolved O2 nor atmospheric FeCPs. Therefore, kPhen values provide a reliable and confident parameter to characterize reactive Fe0 materials. Following the roadmap of [18], it is time to build a significant kPhen database for available Fe0 materials to prepare their systematic testing in long-term column experiments. Once a significant number of materials differing in their kPhen values are tested in such long-term experiments, it will be possible to reliably recommend selected ones for the site-specific design of field Fe0/H2O systems. In other words, the data provided herein are a clear starting point for the design of future laboratory, pilot, and field-scale studies for the design of the next generation Fe0 remediation systems to achieve the United Nations Sustainable Development Goals (UN SDGs) [18]. Further work should also use other affordable approaches like the methylene blue method (MB method) [69] to quickly access the impact of various parameters of the system efficiency. The MB method takes advantage of the differential affinity of MB toward sand and iron oxides (FeCPs). Thus, a system containing sand and Fe0 discolors always lesser MB the more sand is in situ coated by FeCPs.
The results presented herein also clarify the influence of complexing agents (including EDTA and Phen) on the efficiency of Fe0/H2O systems. Complexing agents are often used to avoid the precipitation of Fe(OH)3 and, thus, to clarify the mechanisms of contaminant removal in Fe0/H2O systems [58,70,71]. Despite 25 years of intensive research, the reaction mechanism is still controversially discussed [72,73,74,75]. The present study confirms that both EDTA and Phen avoid iron precipitation before the solution is saturated (e.g., [Fe] > 112 mg L−1 for 2 mM EDTA). The results also suggest that (1) contaminant reduction should be quantitative in the presence of both EDTA and Phen because Fe0 dissolution is accelerated or (2) any observed contaminant reduction in their presence results from Fe2 oxidation (electrons from Fe2). Case (2) suggests that contaminant reduction is only observed in the presence of EDTA as Phen blocs Fe2 oxidation. Exactly, this was observed by [58] investigating aqueous Cr6 removal as influenced by EDTA, NaF, and Phen. Indirectly, [58] have demonstrated that aqueous Cr6 is removed only when Fe precipitates. Their observation is thus consistent with the concept that adsorption and co-precipitation are the fundamental mechanisms of contaminant removal in Fe0/H2O systems [4,10,73,74,75,76].
4. Conclusions
Iron dissolution in 2 mM 1,10-Phenanthroline (Phen test) provides an accurate and reliable method to characterize the intrinsic reactivity of Fe0 materials for water treatment. The Phen test uses only one reagent, is environmentally friendly, and takes just 16 h. Here, it is conducted with a conventional spectrophotometer in a low-equipped laboratory, and it is thus universally applicable. The Phen test can be further developed to be used to assess the long-term kinetics of iron corrosion to help design sustainable filtration systems. This simple method is ready to serve as a universal testing procedure for Fe0 suppliers and is a standard candidate procedure for testing Fe0 materials for environmental applications.
Author Contributions
M.L., A.I.N.-T., R.H., K.N.N., and C.N. contributed equally to manuscript compilation and revisions.
Funding
This research was funded by The African Development Bank (AfDB), grant number 2100155032816.
Acknowledgments
Rajabu Mohamedi, Emanus Emmanuel Kamulasi, and Dativa Paschal Makundi (Iringa Water Quality Laboratory, Water Quality Services Division, Ministry of Water, P.O. Box 570 Iringa Tanzania) are acknowledged for their analytical work support in iron dissolution studies. Anna Mhongole (Faculty of Education, Mkwawa University College of Education, MUCE, P.O. Box 2513 Iringa Tanzania) is acknowledged for her insightful comments during the preparation of the manuscript. The manuscript was improved by insightful comments of anonymous reviewers from Water. We acknowledge support by the German Research Foundation and the Open Access Publication Funds of the Göttingen University.
Conflicts of Interest
The authors declare no conflict of interest.
References
- Shannon, M.A.; Bohn, P.W.; Elimelech, M.; Georgiadis, J.G.; Marinas, B.J.; Mayes, A.M. Science and technology for water purification in the coming decades. Nature 2008, 452, 301–310. [Google Scholar] [CrossRef] [PubMed]
- Hussam, A. Contending with a development disaster: Sono filters remove arsenic from well water in Bangladesh. Innovations 2009, 4, 89–102. [Google Scholar] [CrossRef]
- Noubactep, C.; Schöner, A.; Woafo, P. Metallic iron filters for universal access to safe drinking water. Clean Soil Air Water 2009, 37, 930–937. [Google Scholar] [CrossRef]
- Noubactep, C. The fundamental mechanism of aqueous contaminant removal by metallic iron. Water SA 2010, 36, 663–670. [Google Scholar] [CrossRef]
- Banerji, T.; Chaudhari, S. A cost-effective technology for arsenic removal: Case study of zerovalent iron-based iit bombay arsenic filter in west bengal. In Water and Sanitation in the New Millennium; Nath, K., Sharma, V., Eds.; Springer: New Delhi, India, 2017. [Google Scholar]
- Noubactep, C. Editorial for the Special Issue: Filters in Drinking Water Treatment. Water 2019, 11, 522. [Google Scholar] [CrossRef]
- Gonzalez-Perez, A.; Persson, K.M.; Lipnizki, F. Functional channel membranes for drinking water production. Water 2018, 10, 859. [Google Scholar] [CrossRef]
- Hering, J.G.; Maag, S.; Schnoor, J.L. A call for synthesis of water research to achieve the sustainable development goals by 2030. Environ. Sci. Technol. 2016, 50, 6122–6123. [Google Scholar] [CrossRef]
- Noubactep, C.; Licha, T.; Scott, T.B.; Fall, M.; Sauter, M. Exploring the influence of operational parameters on the reactivity of elemental iron materials. J. Hazard. Mater. 2009, 172, 943–951. [Google Scholar] [CrossRef]
- Hu, R.; Gwenzi, G.; Sipowo, R.; Noubactep, C. Water treatment using metallic iron: A tutorial review. Processes 2019, 7, 622. [Google Scholar] [CrossRef]
- Ngai, T.K.K.; Murcott, S.; Shrestha, R.R.; Dangol, B.; Maharjan, M. Development and dissemination of Kanchan™ Arsenic Filter in rural Nepal. Water Sci. Technol. Water Supply 2006, 6, 137–146. [Google Scholar] [CrossRef]
- Naseri, E.; Ndé-Tchoupé, A.I.; Mwakabona, H.T.; Nanseu-Njiki, C.P.; Noubactep, C.; Njau, K.N.; Wydra, K.D. Making Fe0-based filters a universal solution for safe drinking water provision. Sustainability 2017, 9, 1224. [Google Scholar] [CrossRef]
- Polonski, M.; Pawluk, K.; Rybka, I. Optimization model for the design of multi-layered permeable reactive barriers. IOP Conf. Ser. Mater. Sci. Eng. 2017, 245, 072017. [Google Scholar] [CrossRef]
- Domga, R.; Togue-Kamga, F.; Noubactep, C.; Tchatchueng, J.B. Discussing porosity loss of Fe0 packed water filters at ground level. Chem. Eng. J. 2015, 263, 127–134. [Google Scholar] [CrossRef]
- Makota, S.; Nde-Tchoupe, A.I.; Mwakabona, H.T.; Tepong-Tsindé, R.; Noubactep, C.; Nassi, A.; Njau, K.N. Metallic iron for water treatment: Leaving the valley of confusion. Appl. Water Sci. 2017, 7, 4177–4196. [Google Scholar] [CrossRef]
- Pawluk, K.; Polonski, M.; Wrzesiński, G.; Lendo-Siwicka, M. Two-objective optimization for optimal design of the multilayered permeable reactive barriers. IOP Conf. Ser. Mater. Sci. Eng. 2019, 471, 112044. [Google Scholar] [CrossRef]
- Higgins, M.R.; Olson, T.M. Life-cycle case study comparison of permeable reactive barrier versus pump-and-treat remediation. Environ. Sci. Technol. 2009, 43, 9432–9438. [Google Scholar] [CrossRef]
- Nanseu-Njiki, C.P.; Gwenzi, W.; Pengou, M.; Rahman, M.A.; Noubactep, C. Fe0/H2O filtration systems for decentralized safe drinking water: Where to from here? Water 2019, 11, 429. [Google Scholar] [CrossRef]
- Mwakabona, H.T.; Ndé-Tchoupé, A.I.; Njau, K.N.; Noubactep, C.; Wydra, K.D. Metallic iron for safe drinking water provision: Considering a lost knowledge. Water Res. 2017, 117, 127–142. [Google Scholar] [CrossRef]
- Btatkeu-K, B.D.; Miyajima, K.; Noubactep, C.; Caré, S. Testing the suitability of metallic iron for environmental remediation: Discoloration of methylene blue in column studies. Chem. Eng. J. 2013, 215–216, 959–968. [Google Scholar] [CrossRef]
- Hu, R.; Cui, X.; Xiao, M.; Qiu, P.; Lufingo, M.; Gwenzi, W.; Noubactep, C. Characterizing the suitability of granular Fe0 for the water treatment industry. Processes 2019, 7, 652. [Google Scholar] [CrossRef]
- Li, J.; Dou, X.; Qin, H.; Sun, Y.; Yin, D.; Guan, X. Characterization methods of zerovalent iron for water treatment and remediation. Water Res. 2019, 148, 70–85. [Google Scholar] [CrossRef] [PubMed]
- Williamson, S.J.; Clark, L.A. Pressure required to cause cover cracking of concrete due to reinforcement corrosion. Mag. Concr. Res. 2000, 52, 455–467. [Google Scholar] [CrossRef]
- Caré, S.; Nguyen, Q.T.; L’Hostis, V.; Berthaud, Y. Mechanical properties of the rust layer induced by impressed current method in reinforced mortar. Cement Concr. Res. 2008, 38, 1079–1091. [Google Scholar] [CrossRef]
- Zhao, Y.; Yu, J.; Jin, W. Damage analysis and cracking model of reinforced concrete structures with rebar corrosion. Corros. Sci. 2011, 53, 3388–3397. [Google Scholar] [CrossRef]
- Pilling, N.B.; Bedworth, R.E. The oxidation of metals at high temperatures. J. Inst. Met. 1923, 29, 529–591. [Google Scholar]
- Caré, S.; Crane, R.; Calabrò, P.S.; Ghauch, A.; Temgoua, E.; Noubactep, C. Modeling the permeability loss of metallic iron water filtration systems. Clean Soil Air Water 2013, 41, 275–282. [Google Scholar] [CrossRef]
- Moraci, N.; Lelo, D.; Bilardi, S.; Calabrò, P.S. Modelling long-term hydraulic conductivity behaviour of zero valent iron column tests for permeable reactive barrier design. Can. Geotech. J. 2016, 53, 946–961. [Google Scholar] [CrossRef]
- Ndé-Tchoupé, A.I.; Lufingo, M.; Hu, R.; Gwenzi, W.; Ntwampe, S.K.O.; Noubactep, C.; Njau, K.N. Avoiding the use of exhausted drinking water filters: A filter-clock based on rusting iron. Water 2018, 10, 591. [Google Scholar] [CrossRef]
- Noubactep, C. Metallic iron for environmental remediation: Prospects and limitations. In A Handbook of Environmental Toxicology: Human Disorders and Ecotoxicology; D’Mello, J.P.F., Ed.; CAB International: Wallingford, UK, 2019; Chapter 36; pp. 531–544. [Google Scholar]
- Miyajima, K. Optimizing the design of metallic iron filters for water treatment. Freib. Online Geosci. 2012, 32, 1–60. [Google Scholar]
- Miyajima, K.; Noubactep, C. Characterizing the impact of sand addition on the efficiency of granular iron for water treatment. Chem. Eng. J. 2013, 262, 891–896. [Google Scholar] [CrossRef]
- Li, J.; Zhang, X.; Liu, M.; Pan, B.; Zhang, W.; Shi, W.; Guan, X. Enhanced reactivity and electron selectivity of sulfidated zerovalent iron toward chromate under aerobic conditions. Environ. Sci. Technol. 2018, 52, 2988–2997. [Google Scholar] [CrossRef] [PubMed]
- Gheju, M.; Balcu, I. Removal of chromium from Cr(VI) polluted wastewaters by reduction with scrap iron and subsequent precipitation of resulted cations. J. Hazard. Mater. 2011, 196, 131–138. [Google Scholar] [CrossRef] [PubMed]
- Gheju, M. Progress in understanding the mechanism of CrVI Removal in Fe0-based filtration systems. Water 2018, 10, 651. [Google Scholar] [CrossRef] [Green Version]
- Gheju, M.; Balcu, I. Sustaining the efficiency of the Fe0/H2O system for Cr(VI) removal by MnO2 amendment. Chemosphere 2019, 214, 389–398. [Google Scholar] [CrossRef] [PubMed]
- Sato, N. An overview on the passivity of metals. Corros. Sci. 1990, 31, 1–19. [Google Scholar] [CrossRef]
- Sato, N. Surface oxides affecting metallic corrosion. Corros. Rev. 2001, 19, 253–272. [Google Scholar] [CrossRef]
- Phukan, M. Characterizing the Fe0/sand system by the extent of dye discoloration. Freib. Online Geosci. 2015, 40, 1–70. [Google Scholar]
- Phukan, M.; Noubactep, C.; Licha, T. Characterizing the ion-selective nature of Fe0-based filters using azo dyes. Chem. Eng. J. 2015, 259, 481–491. [Google Scholar] [CrossRef]
- Phukan, M.; Noubactep, C.; Licha, T. Characterizing the ion-selective nature of Fe0-based filters using three azo dyes in batch systems. J. Environ. Chem. Eng. 2016, 4, 65–72. [Google Scholar] [CrossRef]
- Reardon, J.E. Anaerobic corrosion of granular iron: Measurement and interpretation of hydrogen evolution rates. Environ. Sci. Technol. 1995, 29, 2936–2945. [Google Scholar] [CrossRef]
- Landis, R.L.; Gillham, R.W.; Reardon, E.J.; Fagan, R.; Focht, R.M.; Vogan, J.L. An examination of zero-valent iron sources used in permeable reactive barriers. In Proceedings of the 3rd International Containment Technology Conference, Orlando, FL, USA, 10–13 June 2001; Florida State University: Tallahassee, FL, USA, 2001. [Google Scholar]
- Miehr, R.; Tratnyek, P.G.; Bandstra, Z.J.; Scherer, M.M.; Alowitz, J.M.; Bylaska, J.E. Diversity of contaminant reduction reactions by zerovalent iron: Role of the reductate. Environ. Sci. Technol. 2004, 38, 139–147. [Google Scholar] [CrossRef] [PubMed]
- Noubactep, C.; Meinrath, G.; Dietrich, P.; Sauter, M.; Merkel, B.J. Testing the suitability of zerovalent iron materials for reactive walls. Environ. Chem. 2005, 2, 71–76. [Google Scholar] [CrossRef]
- Reardon, E.J. Zerovalent irons: Styles of corrosion and inorganic control on hydrogen pressure buildup. Environ. Sci. Tchnol. 2005, 39, 7311–7317. [Google Scholar] [CrossRef] [PubMed]
- Kim, H.; Yang, H.; Kim, J. Standardization of the reducing power of zero-valent iron using iodine. J. Environ. Sci. Health. A 2014, 49, 514–523. [Google Scholar] [CrossRef] [PubMed]
- Birke, V.; Schuett, C.; Burmeier, H.; Friedrich, H.-J. Impact of trace elements and impurities in technical zero-valent iron brands on reductive dechlorination of chlorinated ethenes in groundwater. In Permeable Reactive Barrier Sustainable Groundwater Remediation; Naidu, R., Birke, V., Eds.; CRC Press: Boca Raton, FL, USA, 2015; pp. 87–98. ISBN 978-1-4822-2447-4. [Google Scholar]
- Li, S.; Ding, Y.; Wang, W.; Lei, H. A facile method for determining the Fe0 content and reactivity of zero valent iron. Anal. Methods 2016, 8, 1239–1248. [Google Scholar] [CrossRef]
- Pierce, E.M.; Wellman, D.M.; Lodge, A.M.; Rodriguez, E.A. Experimental determination of the dissolution kinetics of zero-valent iron in the presence of organic complexants. Environ. Chem. 2007, 4, 260–270. [Google Scholar] [CrossRef]
- Hildebrant, B. Characterizing the reactivity of commercial steel wool for water treatment. Freib. Online Geosci. 2018, 53, 1–80. [Google Scholar]
- Hu, R.; Ndé-Tchoupé, A.I.; Lufingo, M.; Xiao, M.; Nassi, A.; Noubactep, C.; Njau, K.N. The impact of selected pre-treatment procedures on iron dissolution from metallic iron specimens used in water treatment. Sustainability 2019, 11, 671. [Google Scholar] [CrossRef] [Green Version]
- Ibanez, J.G.; Gonzalez, I.; Cardenas, M.A.J. The effect of complex formation upon the redox potentials of metallic ions: Cyclic voltammetry experiments. J. Chem. Educ. 1988, 65, 173–175. [Google Scholar] [CrossRef]
- Rizvi, M.A.; Syed, R.M.; Khan, B. Complexation effect on redox potential of iron(III)−iron(II) couple: A simple potentiometric experiment. J. Chem. Educ. 2011, 88, 220–222. [Google Scholar] [CrossRef]
- Rizvi, M.A. Complexation modulated redox behavior of transition metal systems. Russ. J. Gen. Chem. 2015, 85, 959–973. [Google Scholar] [CrossRef]
- Bashir, S.; Rizwan, M.S.; Salam, A.; Fu, Q.; Zhu, J.; Shaaban, M.; Hu, H. Cadmium immobilization potential of rice straw-derived biochar, zeolite and rock phosphate: Extraction techniques and adsorption mechanism. Bull. Environ. Contam. Toxicol. 2018, 100, 727–732. [Google Scholar] [CrossRef] [PubMed]
- Sakai, K. Determination of Trace Elements in Steel Using the Agilent 7900 ICP-MS. Agilent Publications 5991-6116EN. 2015. Available online: https://www.agilent.com/cs/library/applications/5991-6116EN-appnote_7900_ICP-MS_steel_analysis.pdf (accessed on 11 October 2018).
- Zhou, H.; He, Y.; Lan, Y.; Mao, J.; Chen, S. Influence of complex reagents on removal of chromium(VI) by zero-valent iron. Chemosphere 2008, 72, 870–874. [Google Scholar] [CrossRef] [PubMed]
- Elmagirbi, A.; Sulistyarti, H.; Atikah, A. Study of ascorbic acid as iron(III) reducing agent for spectrophotometric iron speciation. J. Pure App. Chem. Res. 2012, 1, 11–17. [Google Scholar] [CrossRef] [Green Version]
- Lufingo, M. Investigation of Metallic Iron for Water Defluoridation. Master’s Thesis, Nelson Mandela African Institution of Science and Technology, Arusha, Tanzania, 2019. [Google Scholar]
- Noubactep, C.; Caré, S. Dimensioning metallic iron beds for efficient contaminant removal. Chem. Eng. J. 2010, 163, 454–460. [Google Scholar] [CrossRef] [Green Version]
- Noubactep, C. Research on metallic iron for environmental remediation: Stopping growing sloppy science. Chemosphere 2016, 153, 528–530. [Google Scholar] [CrossRef] [PubMed]
- Tarvainen, V.; Ranta-Maunus, A.; Hanhijärvi, A.; Forsén, H. The effect of drying and storage conditions on case hardening of scots pine and norway spruce timber. Maderas Ciencia y tecnología 2006, 8, 3–14. [Google Scholar] [CrossRef] [Green Version]
- Fernando, W.J.N.; Ahmad, A.L.; Shukor, S.R.; Lok, Y.H. A model for constant temperature drying rates of case hardened slices of papaya and garlic. J. Food Eng. 2008, 88, 229–238. [Google Scholar] [CrossRef]
- Noubactep, C.; Caré, S.; Crane, R. Nanoscale metallic iron for environmental remediation: Prospects and limitations. Water Air Soil Pollut. 2012, 223, 1363–1382. [Google Scholar] [CrossRef] [Green Version]
- Huang, C.P.; Wang, H.W.; Chiu, P.C. Nitrate reduction by metallic iron. Water Res. 1998, 32, 2257–2264. [Google Scholar] [CrossRef]
- Hao, Z.-W.; Xu, X.-H.; Wand, D.-H. Reductive denitrification of nitrate by scrap iron filings. J. Zhejiang Univ. Sci. B 2005, 6, 182–186. [Google Scholar] [CrossRef] [PubMed]
- Noubactep, C. Untersuchungen Zur Passiven In. Situ-Immobilisierung von U (VI) aus Wasser. Ph.D. Thesis, Institut für Geologie Freiberg, Freiberg, Germany, 2003. [Google Scholar]
- Btatkeu-K, B.D.; Tchatchueng, J.B.; Noubactep, C.; Caré, S. Designing metallic iron based water filters: Light from methylene blue discoloration. J. Environ. Manag. 2016, 166, 567–573. [Google Scholar] [CrossRef] [PubMed]
- Matheson, L.J.; Tratnyek, P.G. Reductive dehalogenation of chlorinated methanes by iron metal. Environ. Sci. Technol. 1994, 28, 2045–2053. [Google Scholar] [CrossRef] [PubMed]
- Liang, L.; Yang, W.; Guan, X.; Li, J.; Xu, Z.; Wu, J.; Huang, Y.; Zhang, X. Kinetics and mechanisms of pH-dependent selenite removal by zero valent iron. Water Res. 2013, 47, 5846–5855. [Google Scholar] [CrossRef] [PubMed]
- Guan, X.; Sun, Y.; Qin, H.; Li, J.; Lo, I.M.C.; He, D.; Dong, H. The limitations of applying zero-valent iron technology in contaminants sequestration and the corresponding countermeasures: The development in zero-valent iron technology in the last two decades (1994–2014). Water Res. 2015, 75, 224–248. [Google Scholar] [CrossRef] [PubMed]
- Noubactep, C. Metallic iron for environmental remediation: A review of reviews. Water Res. 2015, 85, 114–123. [Google Scholar] [CrossRef] [PubMed]
- Ebelle, T.C.; Makota, S.; Tepong-Tsindé, R.; Nassi, A.; Noubactep, C. Metallic iron and the dialogue of the deaf. Fresenius Environ. Bull. 2019, 28, 8331–8340. [Google Scholar]
- Hu, R.; Noubactep, C. Redirecting research on Fe0 for environmental remediation: The search for synergy. Int. J. Environ. Res. Public Health 2019, 16, 4465. [Google Scholar] [CrossRef] [Green Version]
- Noubactep, C. The operating mode of Fe0/H2O systems: Hidden truth or repeated nonsense? Fresenius Environ. Bull. 2019, 28, 8328–8330. [Google Scholar]
Figure 1.
Comparison of the dissolution rate of SW9 in ethylenediaminetetraacetic (EDTA, 2 mM) and 1,10 Phenantroline (Phen, 2 mM; 6 mM) solutions quiescent conditions for 83 h. Experimental conditions: mSW = 0.1 g, Vsolution = 50 mL. The represented lines are not fitting functions, they just connect the points to ease visualization.

Figure 2.
Comparison of the dissolution rate of the tested Fe0 SW specimens in 1,10 Phenantroline (Phen) under quiescent conditions for 120 h. Experimental conditions: mSW = 0.10 g, [Phen] = 2 mM, Vsolution = 50 mL. The represented lines are not fitting functions; they just connect the points to ease visualization.

Figure 3.
Comparison of the dissolution rate of the tested Fe0 SW specimens in (a) ethylenediaminetetraacetic (EDTA) and (b) 1,10 Phenantroline (Phen) under quiescent conditions for 24 h. Experimental conditions: miron = 0.10 g, [EDTA] = [Phen] = 2 mM, Vsolution = 50 mL. The represented lines are not fitting functions; they just connect the points to ease visualization. The regression parameters are listed in Table 2.


Table 1.
Major characteristics of tested metallic iron (Fe0) steel wool (SW) specimens. The elemental composition (%) was determined in this study. SW1 to SW8 originated from China and SW9 from Tanzania. SW1 to SW8 were brand new, direct from the manufacturer, while SW9 was bought on the market in Tengeru (Tanzania). SW9 was thus air oxidized to some extent. The n.d. stands for not detected.
| Material Code | Diameter (mm) | Grade Number | Name | Elemental Composition | |||||
|---|---|---|---|---|---|---|---|---|---|
| Fe | Co | Cu | Pb | Ni | Cr | ||||
| SW1 | 0.025 | 0000 | Super Fine | 99.15 | 0.01 | 0.03 | 0.40 | 0.09 | 0.32 |
| SW2 | 0.035 | 000 | Extra Fine | 99.21 | 0.05 | 0.12 | n.d. | 0.16 | 0.47 |
| SW3 | 0.04 | 00 | Very Fine | 99.25 | 0.05 | 0.16 | n.d. | 0.11 | 0.43 |
| SW4 | 0.05 | 0 | Fine | 99.08 | 0.05 | 0.27 | n.d. | 0.11 | 0.49 |
| SW5 | 0.06 | 1 | Medium | 98.37 | 0.05 | 1.00 | n.d. | 0.11 | 0.45 |
| SW6 | 0.075 | 2 | Medium Coarse | 99.14 | 0.04 | 0.27 | n.d. | 0.10 | 0.45 |
| SW7 | 0.09 | 3 | Coarse | 98.69 | 0.05 | 0.40 | 0.40 | 0.14 | 0.33 |
| SW8 | 0.1 | 4 | Extra Coarse | 99.27 | 0.04 | 0.28 | n.d. | 0.10 | 0.30 |
| SW9 | 0.04 | 00 | Very Fine | 99.62 | 0.01 | 0.02 | n.d. | 0.03 | 0.32 |
Table 2.
Corresponding correlation parameters (iron dissolution rate in EDTA (kEDTA) and in Phen (kPhen), b, R2) for the tested Fe0 SW specimens. As a rule, the more reactive a material is under given conditions, the larger the k value is. Experimental conditions: [EDTA] = [Phen] = 2 mM, room temperature 23 ± 2 °C, [Fe0] = 0.10 g, and Vsolution = 50 mL. The kEDTA, kPhen, and b values were calculated using Microsoft Excel 2017.
| Sample | EDTA | O-Phen | ||||||
|---|---|---|---|---|---|---|---|---|
| kEDTA | b | N | R2 | kPhen | b | N | R2 | |
| (μg h−1) | (mg) | (-) | (-) | (μg h−1) | (mg) | (-) | (-) | |
| SW1 | 2.320 | 0.600 | 5 | 0.9256 | 0.072 | 0.055 | 5 | 0.9931 |
| SW2 | 0.525 | 2.400 | 5 | 0.5338 | 0.1960 | 0.3050 | 5 | 0.9957 |
| SW3 | 4.505 | (-)1.025 | 5 | 0.997 | 0.2830 | (-) 0.03 | 5 | 0.9974 |
| SW4 | 1.385 | 0.250 | 5 | 0.7809 | 0.4670 | (-) 0.215 | 5 | 0.9956 |
| SW5 | 4.620 | 0.525 | 5 | 0.988 | 0.5430 | (-) 0.065 | 5 | 0.9635 |
| SW6 | 3.765 | (-)2.775 | 5 | 0.9342 | 0.1090 | (-) 0.055 | 5 | 0.9539 |
| SW7 | 3.090 | 0.300 | 5 | 0.8992 | 0.3840 | (-) 0.245 | 5 | 0.9700 |
| SW8 | 4.225 | (-)2.275 | 5 | 0.9216 | 0.8840 | (-) 0.615 | 5 | 0.9808 |
| SW9 | 4.805 | (-)2.45 | 5 | 0.7985 | 1.2980 | 1.1000 | 5 | 0.9984 |
© 2019 by the authors. Licensee MDPI, Basel, Switzerland. This article is an open access article distributed under the terms and conditions of the Creative Commons Attribution (CC BY) license (http://creativecommons.org/licenses/by/4.0/).
Share and Cite
MDPI and ACS Style
Lufingo, M.; Ndé-Tchoupé, A.I.; Hu, R.; Njau, K.N.; Noubactep, C. A Novel and Facile Method to Characterize the Suitability of Metallic Iron for Water Treatment. Water 2019, 11, 2465. https://doi.org/10.3390/w11122465
AMA Style
Lufingo M, Ndé-Tchoupé AI, Hu R, Njau KN, Noubactep C. A Novel and Facile Method to Characterize the Suitability of Metallic Iron for Water Treatment. Water. 2019; 11(12):2465. https://doi.org/10.3390/w11122465
Chicago/Turabian StyleLufingo, Mesia, Arnaud Igor Ndé-Tchoupé, Rui Hu, Karoli N. Njau, and Chicgoua Noubactep. 2019. "A Novel and Facile Method to Characterize the Suitability of Metallic Iron for Water Treatment" Water 11, no. 12: 2465. https://doi.org/10.3390/w11122465
Note that from the first issue of 2016, this journal uses article numbers instead of page numbers. See further details here.