1. Introduction
The 2010 FAO report “The wealth of waste: The economics of wastewater use in agriculture” [
1] highlights the critical need to identify and implement water management and treatment best practices to alleviate water scarcity and meet societal needs despite complex environmental, social, economic, and political pressures [
2,
3]. With over 70% of the world’s water use devoted to growing food and agricultural products [
1], and an ever-growing global population, creating systems that effectively use limited freshwater resources available is more crucial than ever. Optimizing conservation and reuse of water is important for one burgeoning area of agriculture: horticulture, and in particular nursery and greenhouse growers. In the United States alone, nursery and greenhouse growers irrigate some 267,000 hectares of land and contribute over
$14 billion to the national economy [
4,
5].
Water treatment technologies employ physical, chemical, and biochemical processes to remove phytopathogens, algae, and biofilm for safe water reuse [
6], and present opportunities for greenhouse and nursery growers to reduce contaminants returned to water resources while enhancing crop quality and protecting the surrounding environment [
7]. Examples of water treatment technologies currently used by greenhouse and nursery growers and beyond, include, but are not limited to the following: chemical treatment systems (e.g., chlorination, ozonation, peroxidation, and others), physical treatment systems (e.g., mechanical filters, sand filters, disc filters, activated carbon filter, and others), and biological treatment systems (e.g., vegetated/riparian buffers, constructed wetlands, bioreactors, and others). Despite these options and the availability of other water treatment technologies, nursery and greenhouse growers have been reluctant to adopt systems for water treatment [
8]. Bixio et al. [
9] argued the limited adoption of treatment technologies stems from their costs and maintenance requirements, which are prohibitive for many growers. Others [
6,
7,
10,
11] have argued that grower adoption of water treatment systems is constrained by the risks associated with phytopathogen transfer if technologies do not work consistently and efficiently. Furthermore, few studies have conducted a systematic analysis of how nursery and greenhouse growers make decisions about adopting or not adopting water treatment technologies, and what specific cognitive and social factors play a role in these processes.
The diffusion of innovations within a particular community is shaped by a series of individual decision-making and larger social factors: relative advantage, compatibility, complexity, observability, and trialability [
12]. Each factor (see
Table 1) outlines how, through each factor, a potential adopter weighs the various influences that drive how they conceptualize the innovation and its role within their current socio-technical system(s).
Recent qualitative analyses identified compatibility as a common factor driving how growers approach water management and treatment but disagree on which other factors play a direct role [
13,
14]. One study identified relative advantage and observability as the other two driving factors [
13], while the other identified complexity as a key factor [
14]. The lack of agreement on what factors play a role is complicated by the limited current understanding in the literature of what cognitive processes play a role in driving growers to choose specific elements of a particular innovation, and its function within their socio-technical systems over others. This study seeks to address this gap by examining how growers’ problem solving and critical thinking styles influence which diffusion factors drive their decision to or not to adopt water treatment technologies.
Critical thinking encompasses a variety of perspectives and definitions [
15]; in essence, though, critical thinking is the way in which a deliberate thought is couched within and is informed by intellectual principles [
16]. One “style” of critical thinking, the “way critical thinking is expressed, or performed, or done by an individual,” can be expressed as a spectrum ranging from a style characterized by seeking out information to one focused on addressing a problem [
17]. This study leverages one particular critical thinking style analysis tool—the University of Florida Critical Thinking Inventory (UFCTI)—which has proven useful in the context of studying decision-making in food and agricultural contexts [
18].
Individual problem-solving styles range from being adaptive to innovative, with the former preferring more structured settings where they can iterate on existing systems and the latter preferring more autonomy to create new solutions [
19,
20]. The inventory model derived from Kirton’s theory, the Kirton Adaptation Innovation Inventory (KAI), has recently been applied to the context of growers’ and their decision-making concerning water conservation [
21]. This previous study identified that growers who identified as more innovative perceived more opportunities to try conservation technologies before implementing them than did their self-identified, less adaptive counterparts [
21].
This study sought to compare how growers’ critical thinking and problem-solving styles influenced which factors they perceive to enable or hinder their ability to adopt water treatment technologies. Growers who perceived water treatment technologies to have a relative advantage, be more complex, and have opportunities for testing in operations were more likely to implement, and by association adopt, the new systems. However, when broken down by critical thinking and problem-solving style, growers who demonstrated a preference for critical thinking were less likely to perceive water treatment technologies as compatible with their existing operations. As discussed below, these results suggest that growers are interested in water treatment technologies but perceived significant barriers to their adoption—barriers that educational programs and communication efforts may play a role in overcoming.
2. Materials and Methods
2.1. Purpose and Objectives
The purpose of this study was to identify the most appropriate route to increase adoption of water treatment technologies among nursery and greenhouse growers. Specifically, this study addressed the following objectives:
Describe nursery and greenhouse growers’ perceptions of the characteristics of water treatment technologies.
Describe nursery and greenhouse growers’ problem-solving styles and critical thinking styles.
Determine if problem-solving style and critical thinking style predicted nursery and greenhouse growers’ perceived characteristics of water treatment technologies.
Determine if perceived characteristics of water treatment technologies predicted nursery and greenhouse growers’ level of water treatment technology implementation.
Determine if water treatment technology implementation predicted nursery and greenhouse growers’ continued use (long-term adoption) of water treatment technologies.
2.2. Data Collection and Population
The target population was greenhouse and nursery growers in the USA during the first half of 2017. Extension and research professionals working with the target audience provided an electronic mailing and participant list of 1166 growers who were contacted and asked to respond to the survey. The team secured a purposive sample of n = 192 respondents (16.5% response rate). Limitations to purposive sampling include response bias and overrepresentation leading to the inability to generalize the findings to the population of interest. Respondents were compared to non-respondents based on critical demographic characteristics using a series of Chi-square tests to reduce these effects. The results were not significant indicating the sample was representative of the target population.
All subjects gave their informed consent for inclusion before they participated in the study. The study was conducted in accordance with the University of Florida Institutional Review Board with an approved protocol (#15U0046). Among the respondents who provided demographic information, the majority reported being male (73.6%; f = 127); between the ages of 55 and 64 (42.6%; f = 55); not Hispanic or Latino (98.7%; f = 127); white (60.9%; f = 120); and possessing a four-year degree (62.8%; f = 81). Growers surveyed resided in 31 states, with the highest concentrations in Florida (19.4%; f = 25) and New York (13.2%; f = 17). Most growers surveyed had a gross annual sales ranging from either $10,000 to $99,999 (44.2%; f = 57) or $1,000,000 to $9,999,999 (20.2%; f = 26).
2.3. Survey Instrumentation
Following a previously outlined model [
21], this study implemented a researcher-developed survey instrument to analyze how critical thinking style and problem-solving style influenced how growers conceptualize water treatment technology innovations and their adoption. The survey began by asking respondents to provide demographic information using seven categorical questions. The questions requested respondents indicate their gender, age, ethnicity (Hispanic/Latino(a)/Chicano(a) or non-Hispanic/Latino(a)/Chicano(a)), race, highest educational level obtained, state of residence, and gross annual sales.
Critical thinking style was measured using the University of Florida Critical Thinking Inventory (UFCTI) [
17]. The UFCTI measures preference for critical thinking modes on a scale ranging from “preference for engaging” tending toward the lowest possible score of 26 to a “preference for seeking” tending toward the highest possible score of 130 (see
Table 2). These measurements were taken as per the UFCTI protocol [
17], in which respondents were asked to indicate the degree to which you agree or disagree with the statements as they relate to how you naturally tend to approach situations. Twenty statements and responses were measured on a five-point Likert-type scale aligned to the following value statements: strongly disagree, disagree, neither agree nor disagree, agree, and strongly agree.
Problem-solving style was measured using the published KAI protocol [
22]. The KAI measures preference for problem solving style on a scale ranging from adaptive problem-solving style tending toward the lowest possible score of 32 to innovative problem-solving style tending toward the highest possible score of 160 (see
Table 2). Respondents answered the KAI items as part of a series of questions on their problem-solving processes. These questions consisted of a series of 32 slider-type, Likert scale framed KAI items and were provided to respondents as a series of questions about how they solve problems. Items were preceded by the following directive: please use the slider next to each item listed below to indicate how easy or difficult you find it to present yourself, consistently, over a long period as the person each statement represents. Responses ranged on this scale from 5 = very hard to 1 = very easy.
Questions pertaining to respondents’ perceptions of diffusion characteristics were researcher-developed. The first two factors within the Diffusion of Innovations framework, compatibility and trialability, were measured using a five-point Likert scale where respondents indicated their level of agreement along the following series of value statements: strongly disagree, disagree, neither agree nor disagree, agree, and strongly agree. Compatibility was measured using a series of four statements measured along the aforementioned Likert scale: Water treatment technologies are easy to implement into existing facilities, Water treatment technologies are simple to maintain and update, Water treatment technologies will delay the production of goods, and Water treatment technologies are easy to install. Similarly, trialability was measured using the following three related statements: Water treatment technologies are easy to try, Water treatment technologies are readily available to test before being installed, and the opportunity to try water treatment technology is not available to me. To measure complexity, a five-point semantic differential scale was used; on this scale, respondents indicated their perception ranging between the following pairs of adjectives: Complex to Simple; Easy to Difficult to Understand; Clear to Unclear; Confusing to Straightforward; and Complicated to Not Complicated. Relative advantage was measured by asking respondents to indicate their agreement along a scale ranging from 1 = strongly disagree to 5 = strongly agree with the following phrase: Current water treatment technologies are better than what I have used in the past.
Two nested multiple-choice questions were used to measure observability. The first question was Have you had the opportunity to observe others using or demonstrating new water treatment technologies and practices you are not currently using. Respondents were given the option of answering “yes” or “no” to this question. If they answered yes, respondents were then asked to answer the following question: How likely are you to adopt the new water treatment technologies or practices you observed someone else using? Answers to this question were measured on a five-point Likert type scale ranging where 1 = I will not install the new technology, 2 = Not very likely, 3 = Somewhat likely, 4 = Likely, and 5 = Very likely. Respondents’ implementation and adoption of water treatment practices were assessed using a series of binary questions where they were asked to (1) select “yes” or “no” to whether they had a adopted a particular water treatment technology, and (2) to select from the options they indicated “yes” to indicate which were still in use. Of the water treatment technologies available, the survey covered the widest swath of options which included the following 12 water treatment technologies: floating wetlands, filter socks, bioreactors, activated carbon filters, constructed wetlands, carbon/denitrification walls, vegetated channels, vegetated buffers/riparian buffers, physical treatments (UV, membrane, etc.), algal turf scrubbers, mechanical filters, and chemical treatment. Detailed descriptions of each treatment technology are provided in
Table 3.
Instrument validity, audience relevance, and construct and face validity were established through an expert panel assessment [
28,
29,
30,
31]. This panel consisted of experts in nursery and greenhouse water management, agricultural and extension programming and communication, and survey methods. In addition, the survey was pilot tested with a group of agricultural sciences students interested in water treatment and horticulture, and minor adjustments were made the instrument in response to how they took the survey and their feedback.
2.4. Data Analysis Approach
The indices for compatibility, trialability, and complexity were created by averaging the scores for each respective set of questions answers, reversing scales where appropriate. The resulting Cronbach’s alphas of these scales were the following: compatibility, 0.644; trialability, 0.273; and complexity, 0.870. On each index, values could range from one to five, with five indicating the highest possible compatibility, highest trialability, or lowest complexity, respectively. An implementation score was created by summing up all yes responses to the twelve water treatment technology questions. Implementation scores could range from zero to 12. Similarly, an adoption score was created by summing yes responses to the technology’s respondents indicated were still in use. The UFCTI score was created by first summing responses to the 13 seeking survey items, then summing responses to the seven engagement survey items and multiplying the engagement score by 1.833. The two final scores are then summed resulting in an overall critical thinking score. The KAI score was created by summing the 32 items comprised in the inventory.
To determine if problem-solving style and critical thinking style predicted perceived characteristics of water treatment technologies, SPSS (version 23.0; IBM Corp., Armonk, NY, USA) was used to conduct linear regressions with KAI and UFCTI scores as the input variables and compatibility, trialability, and complexity as the outcome variables through three independent analyses. Relative advantage and observability were single, Likert-type scale items that were classified as categorical for analyses. Therefore, two multinomial logistic regression analyses were used with KAI and UFCTI scores as the input variables and relative advantage and observability as the two separate outcome variables. Five linear regression analyses were used to determine if perceived characteristics of water treatment technologies predicted implementation. In each case, the dependent variable was the innovation characteristic and the implementation index the independent variable. An additional linear regression analysis was used to determine if implementation influences growers’ adoption of water treatment technologies, with implementation as the independent and long-term adoption as the dependent variable.
4. Discussion
Growers with an engaging critical thinking styles perceived water treatment technologies as more compatible with their operation than those with a seeking critical thinking style. Growers who perceived water treatment technologies were more trialable, less complex, or had a relative advantage over current practices were more likely to implement these technologies; and, by association, those who had implemented these technologies were more likely to adopt them into their formal operations. These results are somewhat analogous to those found previously [
21] with the exception that observability did not play a statistically significant role in shaping how growers implement water treatment technologies, and complexity did not play a statistically significant role in shaping how growers implement water conservation technologies [
21]. Why growers respond differently to water treatment technologies versus water conservation technologies is, at this stage, unclear. However, one factor that may be driving the observed results is that few growers in the nursery and greenhouse industry have implemented the water treatment technologies studied in this research as compared to those who implemented water conservation technologies in previous studies [
21]. With little to no industry connections implementing water treatment technologies, growers may simply have no point of reference from which to make claims about seeing these systems in action.
Another key result from this study that differs from work conducted on water conservation technologies is the importance of critical thinking style on how growers perceive water treatment technologies. In previous research on water conservation, critical thinking style did not impact any of the facets that drive the diffusion of specific innovations [
21]. The observations from this study show a different result for water treatment technologies, as growers who self-identify as having a seeking critical thinking style were less likely to perceive that water treatment technologies were compatible with their existing operations. This relationship may be a product of how growers see their existing operations and, potentially, perceptions that existing systems may be incompatible with water treatment technologies.
Though no statistically significant relationships between either relative advantage and observability were regressed with KAI or UFCTI scores, there were statistically significant interactions between KAI score and a change in perceived relative advantage. Growers who exhibited a more innovative problem-solving style were less likely to change their perception of the relative advantage of water treatment technologies from strongly disagree to agree or strongly agree. With those growers surveyed exhibiting an overall innovative problem-solving style this phenomenon may be a product of growers’ overall tendencies and, as a result, more reflective of the idea that growers’ perceptions of water treatment technologies may be well established.
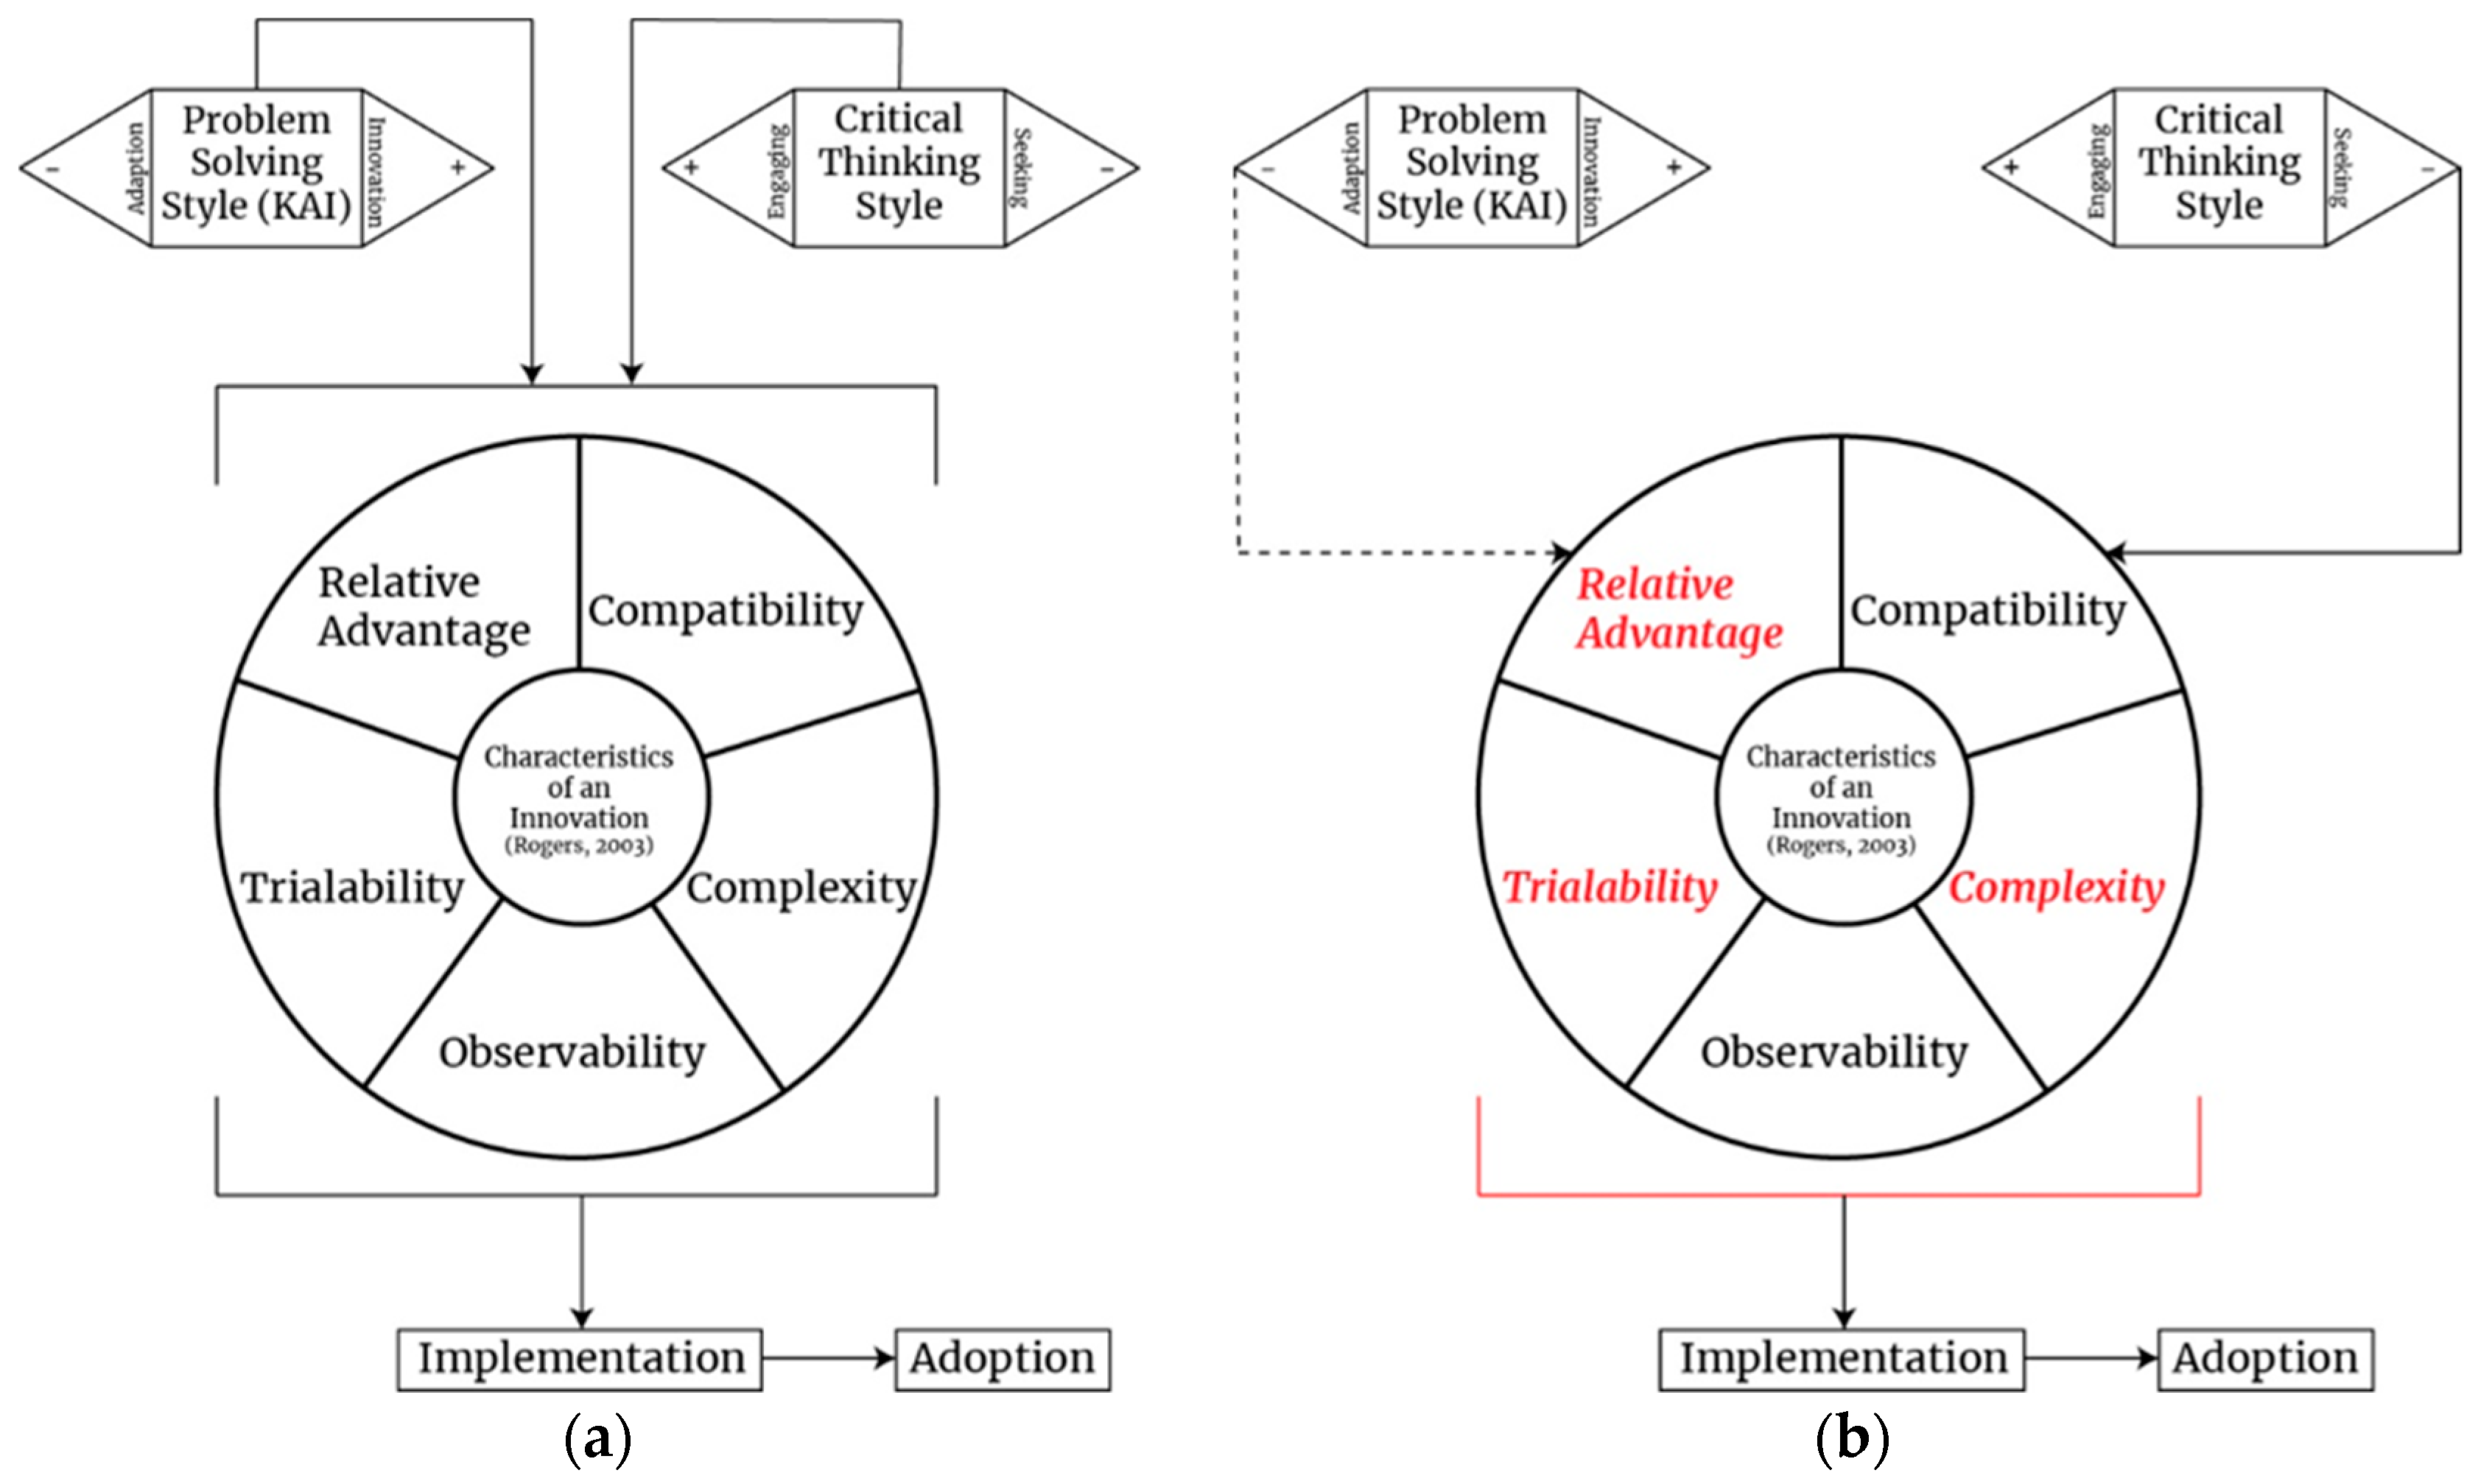
The findings demonstrated growers’ perception of trialability, complexity, and relative advantage play a significant role in driving the implementation of water treatment technologies. Furthermore, and unlike in previous research on growers’ perceptions of water conservation technologies, growers who demonstrated a more seeking critical thinking style were less likely to see water treatment technologies as compatible with their existing operations. These trends are summarized in
Figure 1 using two visual models: (
a) the initial theoretical framework leveraged in this analysis and (
b) the revised framework as defined by the statistical model implemented above.
Based on these results, extension programs should be developed to reduce the perceived complexity of new technologies while offering an opportunity to try them before fully implementing. Conducting field days where new technologies are introduced, and nursery and greenhouse growers get hands on experience with their functions, applicability and use may reduce the sense of fear and skepticism that comes with a new, complex technology. In addition to face-to-face opportunities, online videos should be developed to highlight aspects of the technology in use showcasing how to not only use the technology, but how to adapt it to different growing environments and troubleshoot common issues. Making videos available online in an asynchronous environment would provide growers with the support they need at the time they need it most—when the technology is not working how they expected. Highlighting the relative advantages of the new technology in the videos may also assist growers with a seeking critical thinking style (who will most likely find the videos when seeking information) overcome their inability to find the relative advantage of the new technology—another challenge identified in the revised framework. Finally, offering online courses that allow growers to learn how to implement a new technology from anywhere around the world would assist in decreasing perceived complexity.
The new application of the Diffusion of Innovations framework, coupled with an analysis of critical thinking and problem-solving styles, highlights opportunities for developing more granular approaches to understanding the role of sustainability-focused technologies in the greenhouse and nursery grower sector. For the purposes of this study, an important result is that growers show an interest in water treatment technologies and are willing to adopt them long-term once implemented. However, there is a perception amongst the group that water treatment technologies are incompatible with existing operations. Incompatibility may be driven by a number of factors, including financial, technological, and social, that are not explicitly addressed in this study. Future research should seek to parse out these elements to develop a more comprehensive model of the socio-technological regime under which growers situate adoption practices. Such a model could provide not only a more fine-grained analysis of adoption practices in the industry, but also give structured guidance to extension professionals on how to further create targeted programming to generate interest and, ideally, long-term adoption of new systems.

 ,
, 

