Water Environment Management and Performance Evaluation in Central China: A Research Based on Comprehensive Evaluation System


1
Business School, Institute of Belt-Road Urban & Regional Development, Dalian University of Foreign Languages, Dalian 116044, China
2
Business School, University of Shanghai for Science and Technology, Shanghai 200093, China
3
School of Information Management and Engineering, Fintech Research Institute, Shanghai University of Finance and Economics, Shanghai 200433, China
*
Author to whom correspondence should be addressed.
†
All the authors contributed equally to this work.
Water 2019, 11(12), 2472; https://doi.org/10.3390/w11122472
Submission received: 23 October 2019
/
Revised: 21 November 2019
/
Accepted: 22 November 2019
/
Published: 24 November 2019
(This article belongs to the Special Issue Socioeconomic Indicators for Sustainable Water Management)
Abstract
:As a developing country with insufficient water resources, China’s water environment management and performance evaluation have important research value. The three provinces (Henan, Hubei, and Hunan) in central China with typical significance in geographical location and water resources governance were selected as research objects in this paper. Based on the principal component analysis (PCA) method and the pressure-state-response (PSR) model, a comprehensive evaluation system for the water environment in those three provinces during 2011–2017 was established in this paper. The evaluation results show that: (1) The water environment management and performance evaluation of the three provinces in central China were generally poor in 2011–2012, but the overall trend was rising; (2) in 2013–2014, the situation was improved compared to the previous two years, but needed further enhancement; (3) in 2015–2017, the water environment management and performance of the three provinces showed significant improvement. Among them, the Hubei Province had the highest water environment evaluation value (1.692), and the Henan Province had the most significant progress (from 0.043 to 1.671). The contributions of this paper are: (1) The comprehensive evaluation model based on PCA and the PSR model was constructed to analyze the sustainable development of water environment in central China; (2) the performance evaluation system for water environment management, which could comprehensively evaluate the performance of water environment treatment and effectively reveal the correlation between various indicators, was established. The principal factors in water environment management can be obtained by this evaluation system. Based on the analysis of the reasons underlying the above changes, the corresponding policy recommendations for improving water environment management and performance in central China were suggested in order to provide a reference for further improvement of water environment management in developing countries.
1. Introduction
Water is the source of life, the key to production, and the foundation of ecology [1,2,3]. Water is one of the most valuable and irreplaceable resources in the world, on which all the life on Earth depends for survival and development [4,5,6]. With the rapid development of the economy, population explosion, rapid industrial growth, and surging water consumption, the sustainable development of the water environment is receiving more and more attention from all sectors of the society. In 1972, the first United Nations Conference on Environment and Development predicted that after the oil crisis, the next crisis would be the water crisis [7]. In 2000, the World Ministerial Conference and the World Water Symposium both made “Water Safety in the 21st Century” the key topic of the conference [8,9].
China is a country with severe water shortages. It has a total freshwater resource of 2800 billion cubic meters, accounting for 6% of the global water resources, and is ranked fourth after Brazil, Russia, and Canada. However, China’s per capita water resource is only 2200 cubic meters, which is only one-quarter of the world average and ranked 121st in the world, thus making China one of the 13 countries in the world with the poorest per capita water resources [10,11,12]. Therefore, the sustainable development of the water environment has become a research hotspot, together with other environmental safety topics [13,14,15,16].
Sustainable development means “satisfying the current needs and pursuits of the people, while not causing harm to the needs and pursuits of future generations” [17,18]. Water resources are closely linked with people’s daily lives, which makes the sustainable development of the water environment one of the hottest topics today. The studies on water environment safety have mainly focused on the urban area [19,20]. There have been very few studies on the sustainability of regional water environment. In order to alleviate the constraints of water problems on China’s economic and social development, the central government has implemented the strategies of “safeguarding sustainable economic and social development with the sustainable utilization of water resources” and “coordinated development of the population, resources and the environment” as China’s water environment management strategies of the 21st century [21].
Geographically speaking, central China extends from the middle reaches of the Yellow River to the middle and lower reaches of the Yangtze River, covering the three provinces of Henan, Hubei and Hunan. Its location is of strategic importance—it has the Beijing-Tianjin-Hebei city cluster of the North China Plain to its north, it is neighbored by the Yangtze River Delta of Eastern China to its east, it reaches the Pearl River Delta in Southern China to its south, and it is connected to the Sichuan Basin and Guanzhong Plain to its west [22,23]. Given the fact that these neighboring regions all experience frequent water pollution incidents, with the rapid economic development of China, central China has also seen significant aggravation in water pollution accompanied by water environment quality deterioration. central China is rich in water resources, with a high population density. Due to the considerable impact of human activities, as well as poor hydrodynamic conditions in this region, pollutants cannot diffuse easily and the water pollution issue deserves sufficient attention [24]. Regarding the current situation, the central government has specifically formulated and proposed the “Rise of central China Strategy”, which is expected to fundamentally enhance central China’s ability to pursue sustainable development [25]. Therefore, this paper selected the performance of water environment management and sustainable development in central China as the research object, which has important implications to the water environment improvement and sustainable development of developing regions.
Although the existing literatures have made many explorations on the sustainable development of water environment (please refer to the “Literature Review”), there are few studies that combine the principal component analysis (PCA) method and the pressure-state-response (PSR) model to construct a performance evaluation system to take advantage of both methods. Therefore, two contributions may be made by this paper to enrich existing researches:
- (1)
- A comprehensive evaluation model based on PCA and the PSR model was constructed to analyze the sustainable development of water environment in central China. The main advantage of PCA is that it can effectively reorganize discrete variables by mathematical statistical methods and reflect the data characteristics by a few variables. The main advantage of the PSR model is that it highlights the causal relationship between the environment and the stress facing the environment, as well as the mutual restriction and interaction between the three layers of stress, state, and response. Hence, the comprehensive evaluation model in this paper can determine a few composite variables from various variables to replace the existing variables by mathematical dimension reduction methods to explore the causal relationship between human activities and environmental changes based on the evaluation of the sustainability of environmental systems.
- (2)
- A performance evaluation system for water environment management, which could comprehensively evaluate the performance of water environment treatment and effectively reveal the correlation between various indicators, was established. The principal factors in water environment management can be obtained by this evaluation system. Therefore, the evaluation indicator system and the weights of different indicators in this system can be determined for quantitative calculation by substituting the standardized values into the indicator system. This performance evaluation system can be used to evaluate the performance of water environment management and sustainable development. After careful selection of specific indicators and use of official statistics from the three provinces in central China, the objectivity of calculation results was ensured in this paper to contribute to evaluate the performance of water environment management and sustainable development in China.
The structure of this paper is as follows: Section 2 is the literature review, Section 3 introduces the research methods used in this paper, Section 4 lists the calculation results, Section 5 analyzes the water environment management and performance evaluation of the three provinces in central China from 2011 to 2017, and Section 6 summarizes the findings in this paper and provides corresponding policy recommendations.
2. Literature Review
It is generally agreed by the academia that performance evaluation should consider various factors including efficiency, effectiveness, and satisfaction [26,27,28].
Among the existing studies, Lu et al. established a credibility-based optimization model for water resources management in South central China to show the confidence level of the optimal management strategies. Their results indicated that an aggressive strategy should be considered if system benefit is not the major concern of the government. They also suggested that part of system benefit could be sacrificed to protect local groundwater resources [29].
Cai et al. used the composite index method to conduct a spatiotemporal analysis of water resources vulnerability in China. They found that water resources in north and central China are more vulnerable than in the western area. Moreover, water pollution was worsening remarkably in central China, and water resource shortage has been one of the most serious challenge for sustainable development there [30].
Yao et al. investigated the 14 antibiotics in groundwater and surface water at the Jianghan Plain in central China. They demonstrated that the total concentrations of antibiotics in the spring samples were higher than those in summer and winter. By the risk quotient and mixture risk quotient methods, they evaluated the environmental risks for surface water and groundwater in central China [31].
Hu et al. analyzed 13 antibiotics in the Hanjiang River, one of the main rivers in central China. Their results showed that the hazard quotients of antibiotics were higher in the sediment than those in the water body of the Hanjiang River. Moreover, antibiotic mixtures posed higher ecological risks to water resource in central China than aquatic organisms [32].
Jia et al. constructed an index system to quantify the water environmental carrying capacity. They showed that the potential of water environmental carrying capacity is decreasing from the east China to the west. Moreover, the water resource vulnerability in the west is higher than that of central China [33].
Zhou et al. established a non-radial directional distance function to measure the performance of water use and wastewater emission. Their results indicated that eastern China performs better than central China, with the average technology gap of 51%. Since the technological heterogeneity directly affected the environmental efficiency of industrial water in China, they also assessed the technological efficiency of each province and provided corresponding improvement targets for them [34].
3. Materials and Methods
3.1. Principal Component Analysis
The PCA method was first introduced by the American statistician Pearson in the study of biological theory [35]. The main idea is to reorganize discrete variables by mathematical statistical methods and attempt to reflect the data characteristics by a few variables [36,37,38]. This method determines a few composite variables from various variables to replace the existing variables by mathematical dimension reduction methods, such that these composite variables contain as much amount of information as the original variables and are independent from each other. This method could remove overlapping information in quantitative analysis in order to reflect the same amount of information with a minimum number of mathematical variables [39,40].
The PCA method uses variance as a measure of information amount. It attempts to reorganize the various existing variables with certain correlation with each other into a new set of mutually independent composite variables to replace the existing variables. If the first linear combination selected, i.e., the first composite variable, is denoted as , and the information amount carried by each variable is measured by the variance, then the larger the value, the larger the amount of information is contained. Therefore, among all the linear combinations, the with the largest variance should be selected. Such is also called the first principal component. If the first principal component could not sufficiently represent all the information contained in the original variables, a second linear combination should be considered. In order to effectively reflect the information in the original variables, the information contained by does not need to be covered by again. By applying the same mathematical method, , i.e., the second principal component, could be obtained given that . By the same methods, the third, the fourth, the fifth, … and the pth principal component could be determined.
Based on this method, this paper constructed a matrix of water environment sample data of central China:
where stands for the jth indicator of the ith data.
(1) Standardize the raw data :
The in the above equation is the observed sample data and is the standardized data, where is the average of the jth indicator:
is the standard deviation of the jth indicator:
(2) Construct a correlation coefficient matrix for the standardized data :
is a matrix in which the element can be defined as:
(3) Calculate Eigenvalues and Eigenvectors
In the above formula, is the eigenvalue and is an identity matrix of the same order as . By solving the above formula, the eigenvalues can be obtained. The eigenvalues were further sorted by value. The eigenvalue represents the variance of the ith principal component, reflecting the degree of influence of each principal component.
(4) Calculate the Contribution Rate of Each Component
- The contribution rate of Principal Component to the variance can be written as:
- The cumulative contribution rate of the first principal components to the variance can be written as:
(5) Determine the Principal Components
Based on the standardized raw data, the contribution rates of different principal components can be obtained by substituting the principal components into the expressions above.
3.2. The Comprehensive Evaluation Method Based on the PSR Model
The PSR model was developed by Rapport and Friend in Canada to assess the impact of human activities on the ecological environment [41]. This model highlights the causal relationship between the environment and the stress facing the environment, as well as the mutual restriction and interaction between the three layers of stress, state, and response [42,43,44]. The main purpose of the PSR model is to explore the causal relationship between human activities and environmental changes based on the evaluation of the sustainability of environmental systems [45,46]. Therefore, the PSR model can be used to study the sustainable development of the water environment in central China.
The water environment is a dynamic environment. This paper adopted the PSR model to study the changes in water environment in central China during the study period and to further analyze the sustainability of the water environment. To evaluate water environment sustainability under the PSR framework based on the construction of distance function and discrete coefficients, the formula following formula was used:
In the above formula, is the coordination degree function, and , , and represent the scores corresponding to the pressure, state, and response layers, respectively. The closer the scores under the pressure, state, and response layers to each other, the closer the coordination coefficient is to , indicating a better sustainability level.
3.3. Comprehensive Evaluation of the Performance of Water Environment Management and Sustainable Development
Through calculation based on the above method, this paper constructed an evaluation indicator system and determined the weights of different indicators in this system. Next, this paper performed quantitative calculation by substituting the standardized values into the indicator system. The specific method is:
In the formula above, is the water environment management index, is the indicator value, and is the weight of the indicator. This index can be used to evaluate the performance of water environment management and sustainable development. As can be seen from the above formula, the value of the index should range from [0, 1].
3.4. Indicator Selection and Data Source
In the selection of specific indicators, this paper emphasized the principle of comprehensiveness and objectivity to ensure that the indicator system could comprehensively evaluate the performance of water environment management and sustainable development. The data of the indicators were all from official statistics to ensure the objectivity of calculation results, and the study period was from 2011 to 2017 [47,48,49,50,51]. The finalized indicator system is shown in Table 1.
In the above table, the indicators of the pressure layer were measured by the discharge of major pollutants. The lower the indicator value, the lower the pressure on the water resources caused by pollutant emission during economic development. The indicators of the state layer were divided into two categories: The gross domestic product and the change in population. The higher the indicator value, the bigger achievement in water quality improvement. The indicators of the response layer represent the expenditure or investment of the government in order to take actions against water pollution. The higher the indicator value, the more emphasis the local government has put on water pollution control and the stronger the enforcement.
4. Results
Based on the model and methodology introduced in Section 3, as well as the indicators selected, this paper obtained the below calculation results from the PSR model (as shown in Table 2):
As can be seen from the eigenvalues and variance contribution rates in Table 2, there were five indicators whose eigenvalues are greater than 1, which thus became the candidates of the principal component variables. These variables are: NH3-N Emissions, Natural Population Growth Rate, Mercury Emissions, Regional Secondary Industry Output, and Investment in Ecosystem Construction and Protection, whose cumulative variance contribution rate reached 82.44%, indicating that the five principal component variables could explain 82.44% of the information contained in the 21 indicators. These principal component variables were then sorted by their variance contribution rates and expressed as Z1, Z2, Z3, Z4, and Z5 respectively. The factor variance contribution rates are shown in Table 3 below.
The rotated factor load matrix indicates the correlation between the 21 indicators and the five principal components, as shown in Table 4.
It can be seen from Table 4 that:
- (1)
- The indicators that are strongly correlated with Principal Component Z1 include: ZP3, ZP2, and ZP4;
- (2)
- The indicators that are strongly correlated with Principal Component Z2 include: ZS5, ZS3, and ZR3;
- (3)
- The indicators that are strongly correlated with Principal Component Z3 include: ZP6, ZS1, and ZP5;
- (4)
- The indicators that are strongly correlated with Principal Component Z4 include: ZS2, ZS4, and ZP1;
- (5)
- The indicators that are strongly correlated with Principal Component Z5 include: ZR6, ZR4, and ZP7.
Therefore, Z1 and Z3 could be defined as the principal components of the stress layer, which comprehensively reflect the overall conditions of the pressure indicators; Z2 and Z4 could be defined as the principal components of the state layer, which comprehensively reflect the overall improvement of the state indicators; and Z5 could be defined as the principal component of the response layer, which comprehensively reflects the overall conditions of the response indicators.
Based on the calculation method introduced in Section 3, this paper further obtained the expressions of Z1, Z2, Z3, Z4, and Z5 (see Equations (12)–(16) below):
The component score matrix of Equations (12)–(16) is also shown in Table A1. The evaluation scores of the above five principal components can be integrated into one Comprehensive Evaluation Index Z, as shown in (17) below:
5. Discussion
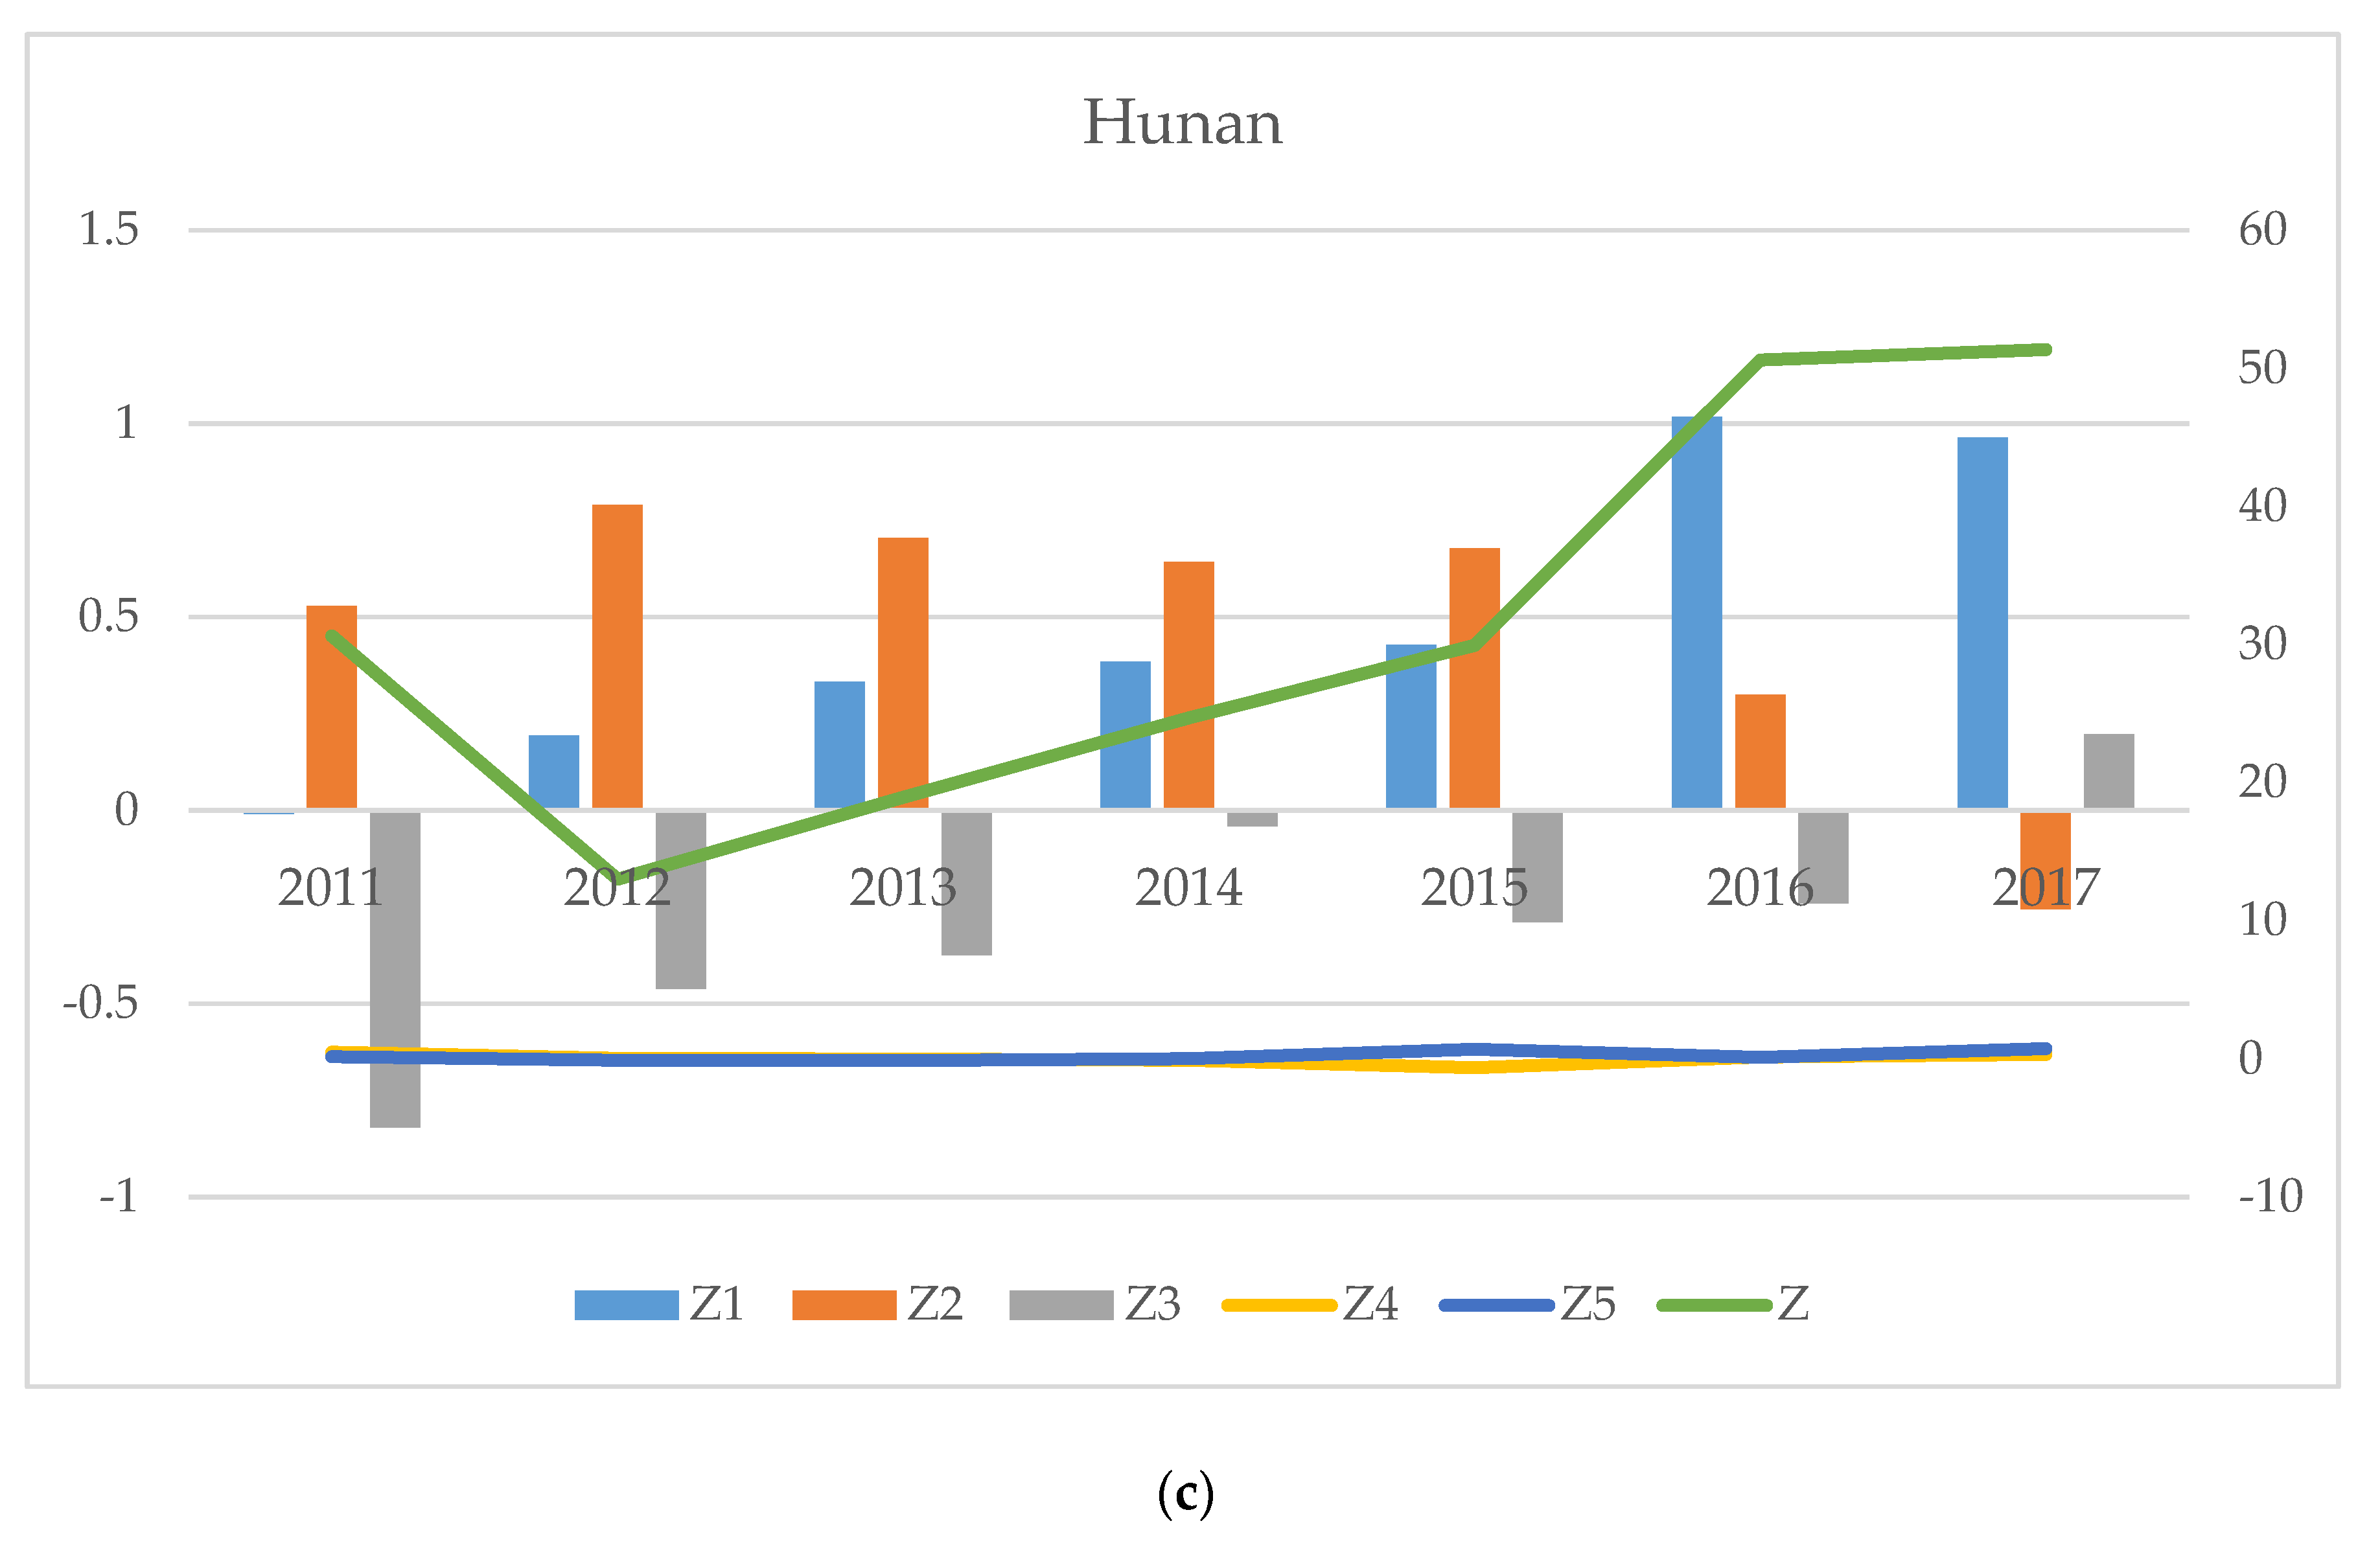
Based on the above expressions of the Pressure Index Z1, the State Improvement Index Z2, the Response Index Z3, and the Comprehensive Evaluation Index Z, this paper obtained the scores of each index in each of the central China provinces within the study period and made further comparison on the index scores by year and by province, respectively (see Figure 1 below and Table A2).
This paper further discretized the Comprehensive Evaluation Index (Sustainability Index) Z in order to define the corresponding intervals for each sustainability level. The results are shown in Figure 2 below and Table A3:
Per the common standards followed by academic researches, a discretized evaluation value between 0 and 0.3 indicates a poor level of sustainable development, a discretized evaluation value between 0.3 and 0.6 indicates a medium level of sustainability, a discretized evaluation value between 0.6 and 0.9 indicates a good level of sustainability, and a discretized evaluation value above 0.9 indicates an excellent level of sustainable development [52,53]. It can be seen from the data in Table A3 that the level of sustainable development of the three provinces in central China during 2011 and 2012 was generally poor, but it was on an improvement trend. The overall level of sustainable development was in the medium range during 2013 and 2014, which improved compared with the previous two years, but there was still room for improvement. By 2015–2016, due to the government’s strong implementation of environmental protection policies, strengthened environmental protection supervision, and the introduction of a series of laws and regulations such as the Environmental Protection Law, the sense of responsibility for environmental protection became deeply rooted in the hearts of the people [54,55,56]. Therefore, during this period and beyond 2017, the sustainability level of the water environment in these provinces has seen huge improvements.
It can be noted by sorting the discretized comprehensive evaluation scores in 2017 that the Hubei Province had the best sustainability level in water environment, the Henan Province achieved the biggest improvement in terms of water environment sustainability, and the Hunan Province’s sustainability level in water environment was medium. Overall, the sustainability level of water environment in central China has improved.
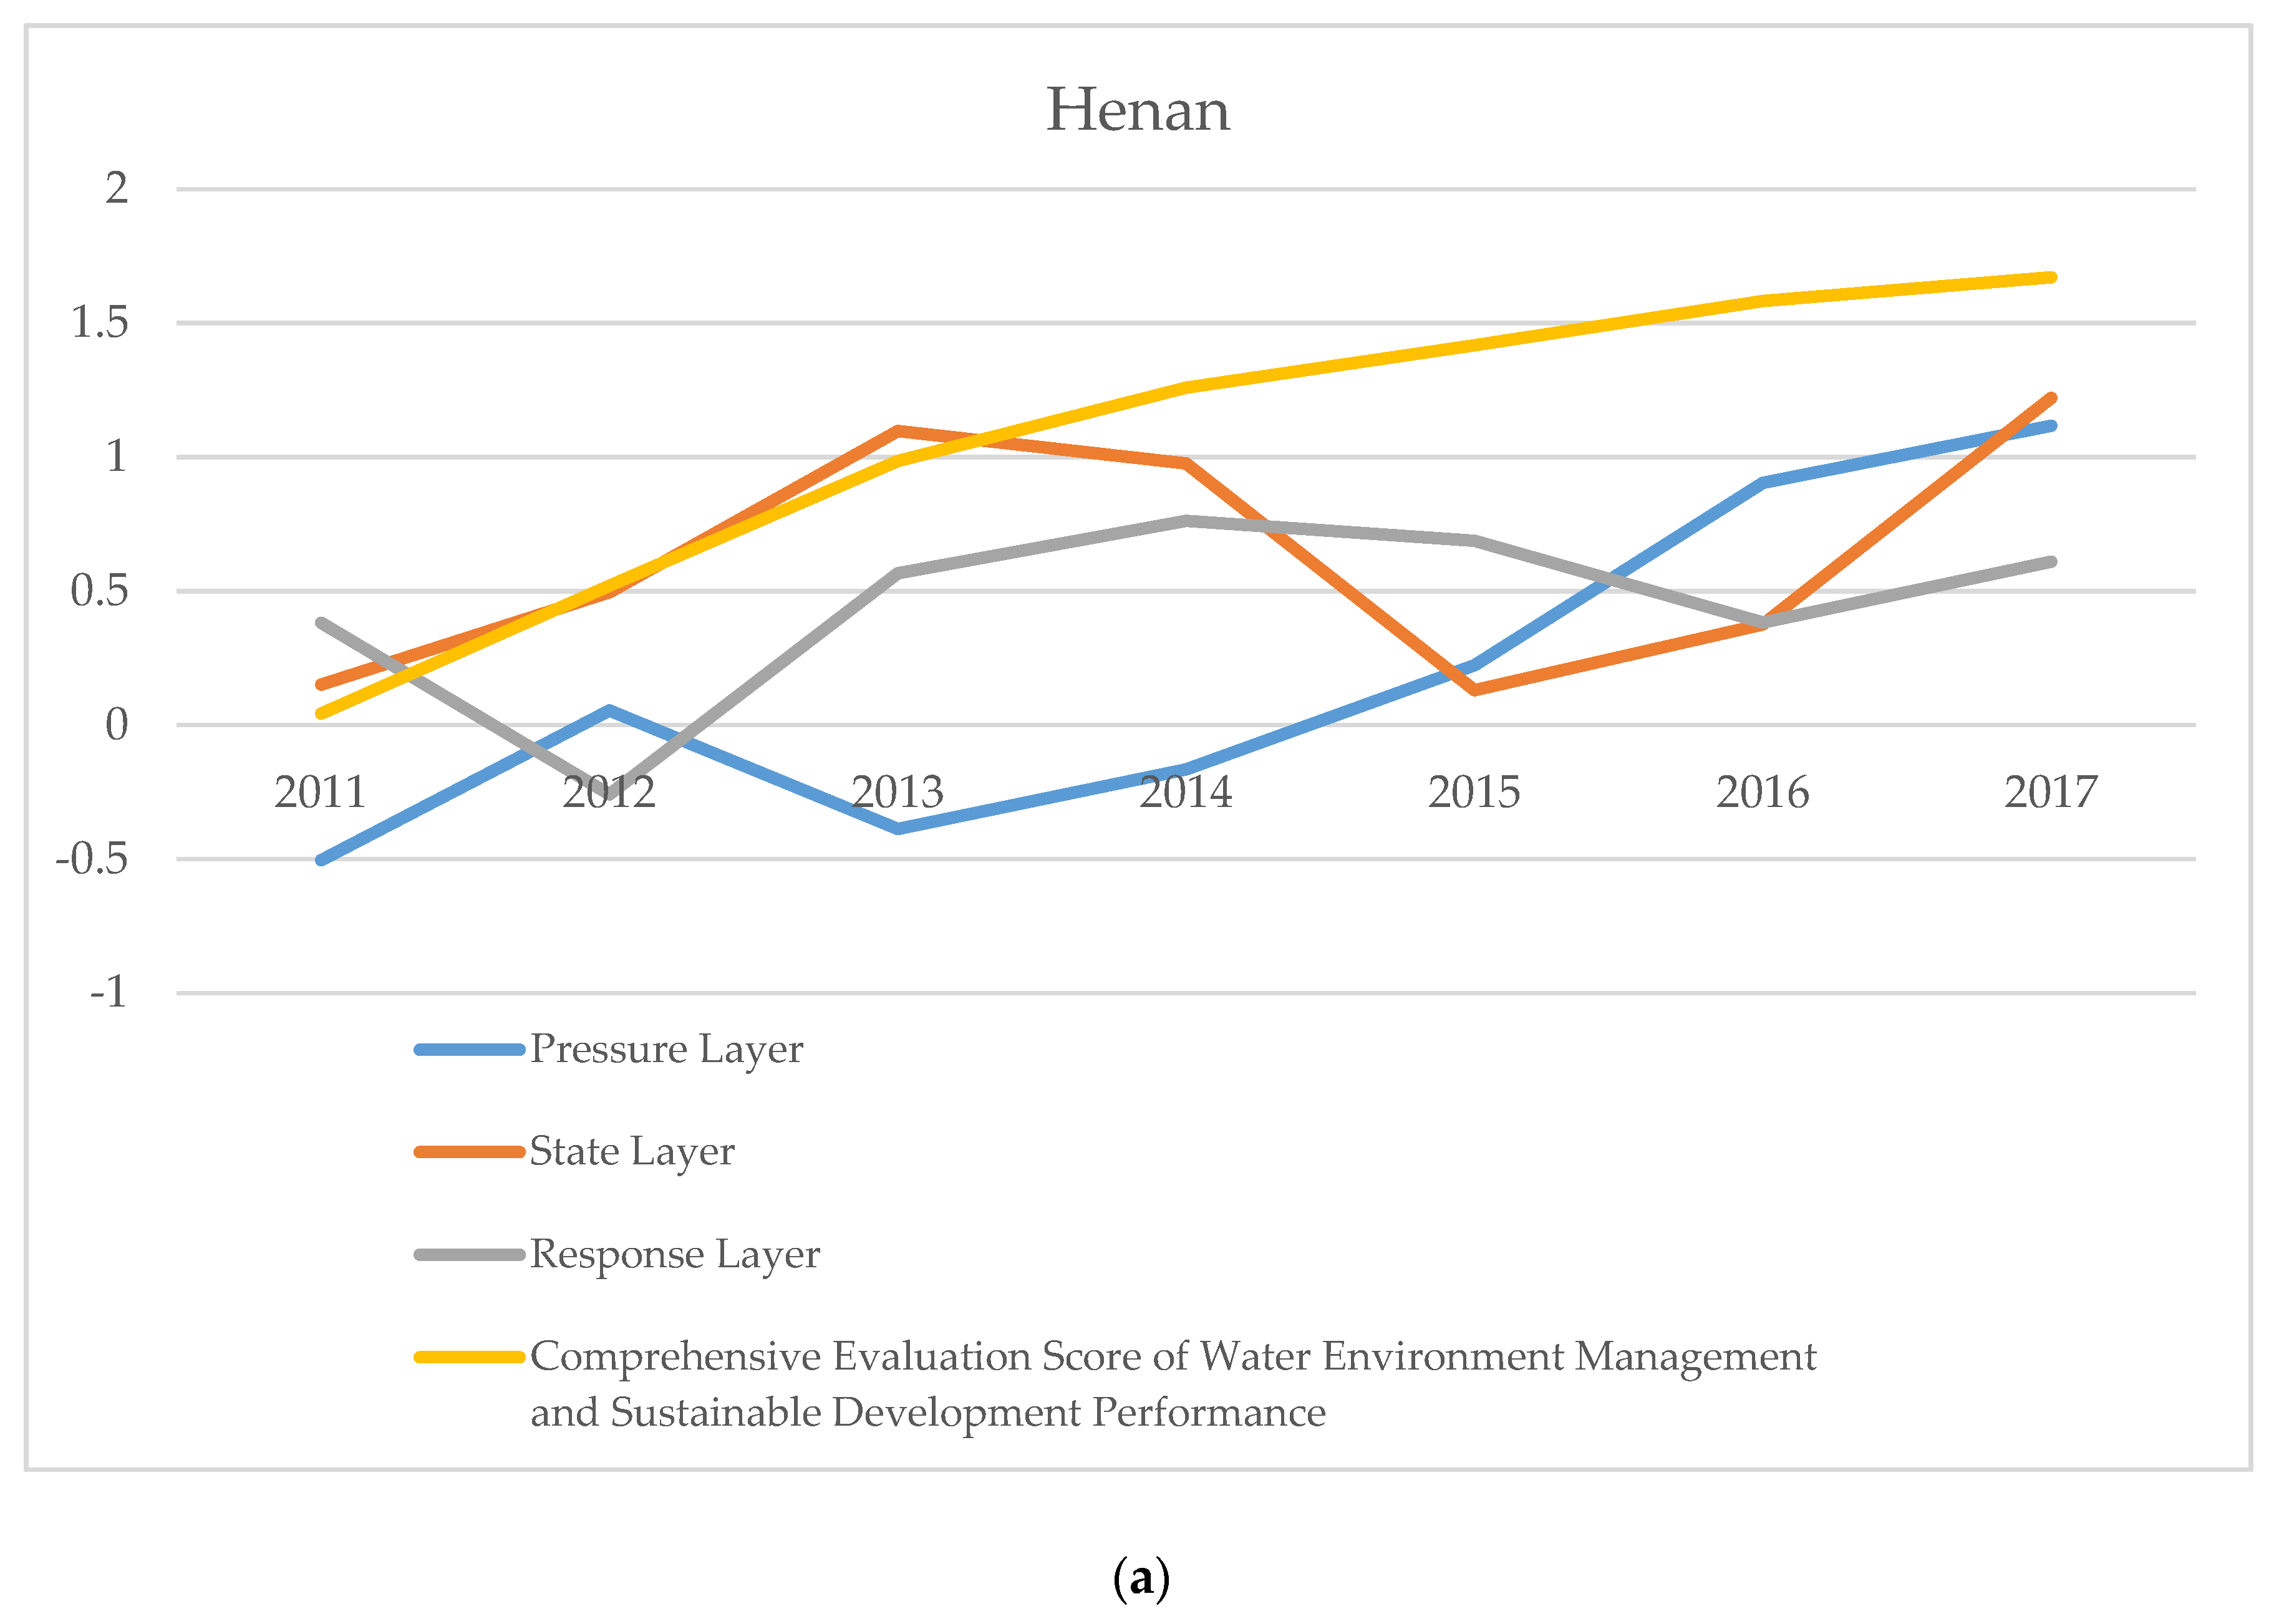
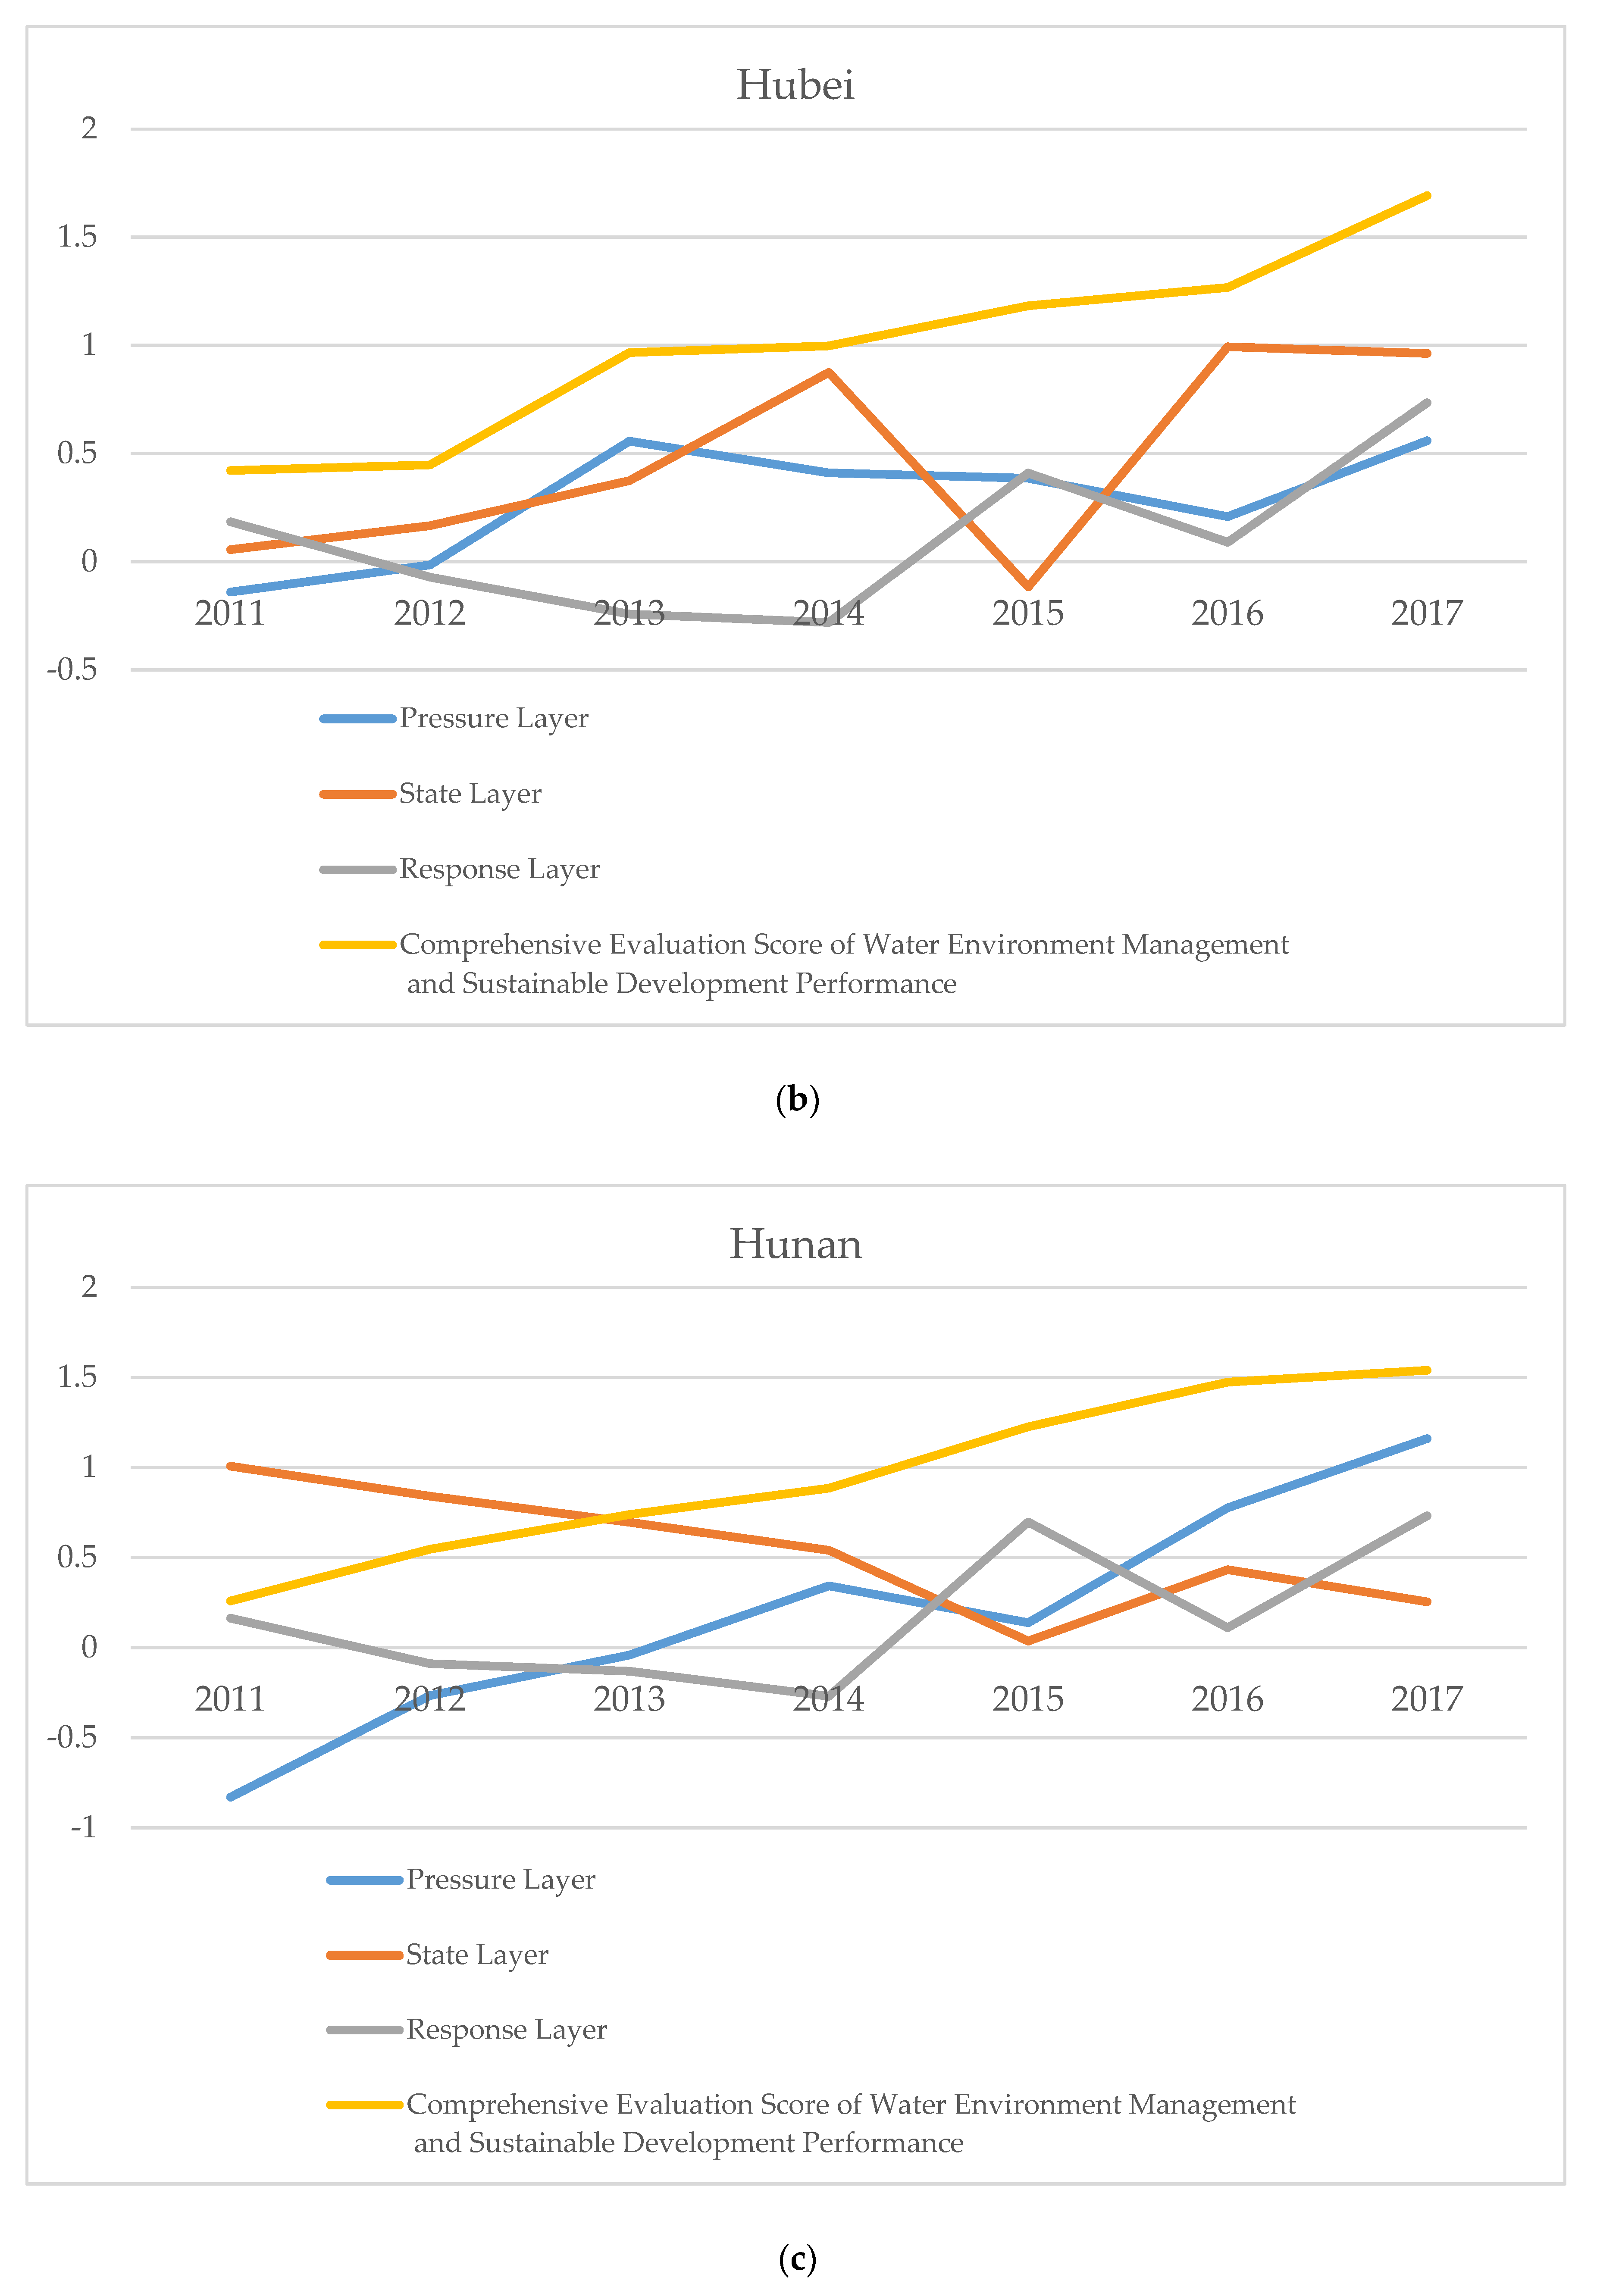
Based on Section 3.3, this paper further calculated the comprehensive evaluation scores of the water environment management and sustainable development performance in the three provinces of central China (see Figure 3 below and Table A4).
The period chosen by this paper, 2011–2017, is an important development stage ranging from the beginning of China’s “Twelfth Five-Year Plan (2011–2015)” to the mid-term of “Thirteen Five-Year Plan (2016–2020)”. During this period, the threat to China’s water environment intensified. The three provinces of central China also took corresponding measures to govern their own water environment, which led to continuous improvement in the sustainable development of their water environment. It can be seen that the sustainability level of the water environment in central China showed a gradual improvement trend during the study period, with the largest improvement seen during 2011–2014. Among them, the Henan Province experienced a particularly significant improvement in water environment sustainability during the study period. Analysis of the principal component values of the Henan Province showed that in recent years, the Henan Province experienced huge improvements in the values of principal components Z1, Z2, and Z3, and the corresponding indicators with the largest correlation degree with these three are, respectively, NH3-N (Ammonia Nitrogen Emission), Natural Population Growth Rate, and the Investment Amount in Ecosystem Construction and Protection.
- (1)
- Ammonia nitrogen refers to the nitrogen in water in the form of free ammonia and ammonium ions. Human activities have caused nitrogenous substance to enter the water environment mainly through untreated urban household wastewater and industrial wastewater, as well as various kinds of leachates. The main reason why ammonia nitrogen exceeds the acceptable standard is that the designed size of the sewage treatment facility is too small and the treatment equipment is underloaded, so the free ammonia in the sewage cannot fully complete the nitrification reaction. In addition, excessive sewage discharge has also resulted in a sharp increase in ammonia nitrogen, which has seriously hammered the sustainable development of the water environment. During the study period, the Henan Province strictly regulated sewage discharge, achieved an overall balance of water resources by reducing ammonia nitrogen emissions, strengthened the promotion of water resource protection, and made great efforts to enhance the sense of responsibility of all sectors of society for water resource protection [57]. At the same time, the Henan Province actively introduced highly efficient energy-saving technologies to timely process the sewage, regularly investigated and monitored the sources of water pollution, and conducted statistical analysis on sewage treatment results to derive the performance of water pollution control during defined periods of time, which helped the Henan Province achieve satisfactory water environment management results [58].
- (2)
- As one of the key indicators defining the sustainability of water environment, the Natural Population Growth Rate reflects the relationship between human and the nature, as well as the social aspect of environmental protection, industrialization, and urbanization. As a populous province, the Henan Province strictly implemented the family planning policy in order to control the natural population growth rate and actively utilized market-based approaches to adjust the natural population growth rate in the context of the Chinese government gradually liberalizing the birth control policies in China [59,60], thus contributing to the sustainable development of the water environment.
- (3)
- As a response layer indicator for sustainable development, the Investment Amount in Ecosystem Construction and Protection reflects the sense of responsibility and commitment of the local enterprises and government regarding ecological environment construction. During the study period, the average annual investment in ecosystem construction and protection in the Henan Province was around 7 billion RMB [61], which exceeded the investment amount by other provinces. This also explains the significant improvement in water environment protection and sustainable development achieved by the Henan Province in the past five years.
The Hubei Province, which showed the best overall sustainability level during the study period, did not only take a series of measures in the above key areas that contribute to the sustainable development of water environment as the Henan Province [62], it also paid more attention to scientific and technological innovation, such as adopting the new clean wastewater treatment technology in the treatment and control of pollutants including mercury [63,64]. Therefore, the Hubei Province achieved outstanding pollution control results in terms of the pressure layer indicators such as ZP6.
Basing on the actual conditions of water environment management in the three provinces of central China and the availability of data, we mainly selected Afforestation Area, Constructed Wetland Area, Comprehensive Utilization of General Industrial Solid Waste, Investment in Industrial Wastewater Treatment, Investment in Industrial Waste Treatment, and Investment in Ecosystem. Construction and Protection were the indicators of results. In future research, we will further supplement the indicators as references to the real effects of the pressures and the corrections of the externalities caused by human activities. These indicators include, but are not limited to, the conditions and impact of the discharges of treated wastewater on the natural environment, the increase in corporate profits brought about by the recycling of wastewater, the costs saved by the recycling of wastewater (such as management fees and sewage charges), fines for compensation for water environmental treatment, etc.
6. Conclusions
This paper selected the performance of water environment management and sustainable development in the three provinces of central China as the research object and constructed a comprehensive evaluation system for water environment management and sustainable development by integrating the PCA method and the PSR model in order to comprehensively analyze the performance of water environment management and sustainability of development. The constructed evaluation system could comprehensively analyze the result of water environment treatment in a certain region and is able to effectively reveal the correlation between different indicators, thus determining the principal factors in water environment management. With the help of this system, this paper evaluated the performance of water environment management in the three provinces of central China from 2011 to 2017.
The results show that the sustainability level of the water environment in central China has shown an improvement trend during the study period, with the largest improvement seen during 2011–2014. The evaluation results vary among different provinces. The Henan Province has experienced the most significant improvement during the study period. Its comprehensive evaluation score of water environment management and sustainable development reached 1.671 in 2017, ranking second in central China. Overall, Hubei Province maintained the best water environment management and sustainable development level during the study period, with a comprehensive evaluation score of 1.692 in 2017.
The contributions of this paper are:
- (1)
- A comprehensive evaluation model based on PCA and the PSR model was constructed to analyze the sustainable development of water environment in central China. The main advantage of PCA is that it can effectively reorganize discrete variables by mathematical statistical methods and reflect the data characteristics by a few variables. The main advantage of the PSR model is that it highlights the causal relationship between the environment and the stress facing the environment, as well as the mutual restriction and interaction between the three layers of stress, state, and response. Hence, the comprehensive evaluation model in this paper can determine a few composite variables from various variables to replace the existing variables by mathematical dimension reduction methods, to explore the causal relationship between human activities and environmental changes based on the evaluation of the sustainability of environmental systems.
- (2)
- A performance evaluation system for water environment management, which could comprehensively evaluate the performance of water environment treatment and effectively reveal the correlation between various indicators, was established. The principal factors in water environment management can be obtained by this evaluation system. Therefore, the evaluation indicator system and the weights of different indicators in this system can be determined for quantitative calculation by substituting the standardized values into the indicator system. This performance evaluation system can be used to evaluate the performance of water environment management and sustainable development. After careful selection of specific indicators and use of official statistics from the three provinces in central China, the objectivity of calculation results was ensured in this paper to contribute to evaluate the performance of water environment management and sustainable development in China.
Based on the evaluation results, the authors proposed the following policy recommendations for the improvement of water environment management and sustainable development in central China:
- (1)
- Strengthen the promotion and education about the importance of sustainable development of the water environment, accelerate the accumulation of human capital in the provinces of central China, and raise people’s awareness of water conservation. The provinces of central China should further increase the investment in the education of water resource protection knowledge and technologies to the citizens, cultivate their awareness of ecological protection related to the water environment, help the citizens form a habit of reducing water resource input in production as well as reducing water pollution emissions in daily life, and enhance the public’s understanding of the ecological and social benefits of sustainable development of the water environment. At the same time, governments at all levels below the provincial level should place great emphasis on the sustainable development of the water environment, include it in the government’s key agenda, and effectively strengthen the protection of the water environment based on the actual local conditions.
- (2)
- Establish a long-term incentive mechanism for the sustainable development of the water environment. The distribution of precipitation, the layout of industrial and agricultural production, and the level of economic development vary greatly among the provinces of central China. It is important to comprehensively consider the regional differences and the economic feasibility for the local residents when establishing a long-term mechanism to motivate the sustainable development of the water environment. For example, special funds could be appropriated to support the technology upgrade of water pipelines and surface water delivery [65], as well as water recycling technologies that have higher costs such as the micro-irrigation technology [66]. At the same time, the local governments should reduce the administrative interventions during the promotion of water environment improvement technologies in order not to burden the residents and enterprises while promoting the sustainable development of water environment.
- (3)
- Further increase investment in fixed assets for water pollution control. Compared with general fixed asset investment, the investment in environmental pollution control has its own positive environmental externalities and environmental spillover effects apart from the benefits of increasing household consumption and stimulating demand for related industries [67]. Therefore, investment in pollution control has more social and environmental implications than general fixed asset investment. It should be noticed that although the growth rate of fixed assets investment in water pollution control in these three provinces of central China has been higher than that of the overall environmental investment in recent years, there is still a gap in the proportion of pollution control investment in national income when compared with the average level of developed countries [47]. Thus, the investment in water pollution control should be further increased in the future.
Therefore, the public participation and long-term incentive mechanism for the sustainable development of the water environment will be included in future research. Meanwhile, the indicators, which reflect the real effects of the pressures and the corrections of the externalities caused by human activities to make our research more perfect, will also be supplemented.
Author Contributions
Conceptualization, X.S. and J.W.; Methodology, Y.L. and G.Y.; Software, W.Y.; Validation, W.Y., G.Y. and J.W.; Formal Analysis, X.S. and J.W.; Data Curation, G.Y.; Writing—Original Draft Preparation, X.S. and W.Y.; Writing—Review & Editing, Y.L. and G.Y.; Visualization, W.Y. and J.W.; Project Administration, Y.L.
Funding
The second author is financially supported by the Humanities and Social Sciences Research Fund of the University of Shanghai for Science and Technology, and the Decision-making Consultation Research Project of Shanghai Municipal Government. The third author is financially supported by the National Natural Science Foundation of China (71771151), and the National Education Science “Twelfth Five-Year Plan”, Ministry of Education Key Funding Project (DIA110253). The authors gratefully acknowledge the above financial supports.
Conflicts of Interest
The authors declare no conflict of interest.
Appendix A. Component Score Matrix and Comprehensive Evaluation Results

Table A1.
Component Score Matrix.
| Indicator | Principal Component | ||||
|---|---|---|---|---|---|
| Z1 | Z2 | Z3 | Z4 | Z5 | |
| ZP1 | 0.073 | −0.127 | −0.255 | 0.281 | −0.012 |
| ZP2 | 0.115 | −0.056 | −0.036 | 0.087 | −0.022 |
| ZP3 | 0.115 | −0.053 | −0.029 | 0.071 | −0.025 |
| ZP4 | 0.115 | −0.057 | −0.041 | 0.120 | −0.068 |
| ZP5 | 0.062 | −0.002 | 0.062 | 0.008 | 0.156 |
| ZP6 | 0.022 | 0.073 | 0.184 | 0.018 | 0.108 |
| ZP7 | 0.046 | 0.052 | 0.038 | 0.005 | 0.262 |
| ZP8 | 0.078 | 0.045 | 0.066 | −0.123 | −0.209 |
| ZP9 | 0.075 | 0.021 | 0.024 | 0.085 | 0.127 |
| ZP10 | 0.102 | −0.392 | −0.007 | −0.200 | −0.152 |
| ZS1 | 0.072 | 0.035 | 0.070 | −0.044 | 0.085 |
| ZS2 | −0.011 | 0.085 | 0.136 | 0.429 | −0.093 |
| ZS3 | 0.029 | 0.285 | −0.052 | −0.097 | −0.118 |
| ZS4 | 0.049 | 0.104 | 0.045 | 0.07 | −0.041 |
| ZS5 | 0.016 | 0.297 | −0.057 | −0.104 | −0.084 |
| ZR1 | −0.006 | −0.038 | −0.103 | −0.057 | 0.670 |
| ZR2 | 0.111 | 0.001 | −0.097 | 0.000 | −0.228 |
| ZR3 | −0.184 | 0.253 | 0.244 | 0.167 | 0.012 |
| ZR4 | 0.071 | −0.024 | −0.485 | −0.128 | 0.043 |
| ZR5 | 0.025 | 0.112 | −0.357 | 0.020 | 0.094 |
| ZR6 | 0.125 | −0.031 | −0.128 | −0.315 | −0.044 |
Extraction Method: Principal Component Analysis Method. Rotation Method: Caesar Normalization Maximum Variance Method.
Table A2.
Comparison of Scores of Principal Component Indices and Sustainable Development Indices in Central China from 2011 to 2017.
Table A2.
Comparison of Scores of Principal Component Indices and Sustainable Development Indices in Central China from 2011 to 2017.
| Year | Province | Z1 | Z2 | Z3 | Z4 | Z5 | Z |
|---|---|---|---|---|---|---|---|
| 2011 | Henan | 0.201 | −0.372 | −0.705 | 0.221 | 0.381 | 1.182 |
| 2012 | Henan | 0.144 | 0.121 | −0.089 | 0.375 | 0.593 | 13.193 |
| 2013 | Henan | 0.156 | 0.706 | −0.444 | 0.391 | 0.866 | 18.309 |
| 2014 | Henan | 0.228 | 0.741 | −0.163 | 0.235 | 0.762 | 23.621 |
| 2015 | Henan | 0.505 | 0.378 | −0.283 | −0.509 | 0.588 | 25.463 |
| 2016 | Henan | 1.147 | 0.310 | −0.242 | 0.066 | −0.383 | 53.493 |
| 2017 | Henan | 0.791 | 0.650 | 0.326 | 0.570 | 0.209 | 53.558 |
| 2011 | Hubei | 0.075 | −0.178 | −0.215 | 0.234 | −0.045 | 20.368 |
| 2012 | Hubei | 0.239 | 0.015 | −0.253 | 0.151 | −0.071 | 9.275 |
| 2013 | Hubei | 0.176 | 0.603 | 0.381 | 0.473 | 0.242 | 23.973 |
| 2014 | Hubei | 0.176 | 0.610 | 0.235 | 0.265 | −0.141 | 18.821 |
| 2015 | Hubei | 0.438 | 0.035 | −0.053 | −0.550 | 0.110 | 17.756 |
| 2016 | Hubei | 1.108 | 0.536 | −0.899 | 0.458 | 0.090 | 52.328 |
| 2017 | Hubei | 1.015 | 0.561 | −0.456 | 0.402 | 0.735 | 56.589 |
| 2011 | Hunan | −0.009 | 0.529 | −0.820 | 0.478 | 0.163 | 30.614 |
| 2012 | Hunan | 0.194 | 0.790 | −0.461 | 0.051 | −0.089 | 13.000 |
| 2013 | Hunan | 0.333 | 0.704 | −0.375 | −0.008 | −0.131 | 18.949 |
| 2014 | Hunan | 0.385 | 0.642 | −0.042 | −0.103 | 0.027 | 24.689 |
| 2015 | Hunan | 0.428 | 0.678 | −0.289 | −0.641 | 0.697 | 29.943 |
| 2016 | Hunan | 1.017 | 0.299 | −0.240 | 0.134 | 0.111 | 50.603 |
| 2017 | Hunan | 0.963 | −0.256 | 0.197 | 0.311 | 0.732 | 51.362 |
Table A3.
The Comprehensive Evaluation Scores of the Sustainability Index after Discretization for Provinces in Central China from 2011 to 2017.
Table A3.
The Comprehensive Evaluation Scores of the Sustainability Index after Discretization for Provinces in Central China from 2011 to 2017.
| Number | Year | Province | Discretized Comprehensive Evaluation Value Z’’ |
|---|---|---|---|
| 1 | 2011 | Henan | 0.0208 |
| 2 | 2012 | Henan | 0.2316 |
| 3 | 2013 | Henan | 0.3215 |
| 4 | 2014 | Henan | 0.4147 |
| 5 | 2015 | Henan | 0.5471 |
| 6 | 2016 | Henan | 0.9392 |
| 7 | 2017 | Henan | 0.9403 |
| 8 | 2011 | Hubei | 0.0065 |
| 9 | 2012 | Hubei | 0.1628 |
| 10 | 2013 | Hubei | 0.4209 |
| 11 | 2014 | Hubei | 0.3304 |
| 12 | 2015 | Hubei | 0.6117 |
| 13 | 2016 | Hubei | 0.9187 |
| 14 | 2017 | Hubei | 0.9935 |
| 15 | 2011 | Hunan | 0.0108 |
| 16 | 2012 | Hunan | 0.2282 |
| 17 | 2013 | Hunan | 0.3327 |
| 18 | 2014 | Hunan | 0.4335 |
| 19 | 2015 | Hunan | 0.4379 |
| 20 | 2016 | Hunan | 0.8884 |
| 21 | 2017 | Hunan | 0.9018 |
Table A4.
Evaluation Values of Different Components in Provinces of Central China from 2011 to 2017.
Table A4.
Evaluation Values of Different Components in Provinces of Central China from 2011 to 2017.
| Year | Province | Pressure Layer | State Layer | Response Layer | Comprehensive Evaluation Score of Water Environment Management and Sustainable Development Performance |
|---|---|---|---|---|---|
| 2011 | Henan | −0.504 | 0.151 | 0.381 | 0.043 |
| 2012 | Henan | 0.054 | 0.496 | −0.259 | 0.520 |
| 2013 | Henan | −0.388 | 1.097 | 0.566 | 0.985 |
| 2014 | Henan | −0.165 | 0.976 | 0.762 | 1.259 |
| 2015 | Henan | 0.223 | 0.130 | 0.688 | 1.417 |
| 2016 | Henan | 0.904 | 0.376 | 0.383 | 1.582 |
| 2017 | Henan | 1.117 | 1.220 | 0.609 | 1.671 |
| 2011 | Hubei | −0.140 | 0.056 | 0.185 | 0.422 |
| 2012 | Hubei | −0.015 | 0.167 | −0.071 | 0.448 |
| 2013 | Hubei | 0.557 | 0.375 | −0.242 | 0.967 |
| 2014 | Hubei | 0.411 | 0.875 | −0.281 | 0.998 |
| 2015 | Hubei | 0.386 | −0.116 | 0.410 | 1.183 |
| 2016 | Hubei | 0.209 | 0.994 | 0.090 | 1.268 |
| 2017 | Hubei | 0.559 | 0.963 | 0.735 | 1.692 |
| 2011 | Hunan | −0.830 | 1.007 | 0.163 | 0.259 |
| 2012 | Hunan | −0.266 | 0.841 | −0.089 | 0.547 |
| 2013 | Hunan | −0.041 | 0.696 | −0.131 | 0.739 |
| 2014 | Hunan | 0.343 | 0.540 | −0.269 | 0.885 |
| 2015 | Hunan | 0.138 | 0.037 | 0.697 | 1.226 |
| 2016 | Hunan | 0.776 | 0.433 | 0.111 | 1.474 |
| 2017 | Hunan | 1.160 | 0.255 | 0.732 | 1.539 |
References
- Meng, C.; Wang, X.; Li, Y. An optimization model for water management based on water resources and environmental carrying capacities: A case study of the Yinma River Basin, Northeast China. Water 2018, 10, 565. [Google Scholar] [CrossRef]
- Yang, W.; Li, L. Efficiency evaluation and policy analysis of industrial wastewater control in China. Energies 2017, 10, 1201. [Google Scholar] [CrossRef]
- Yang, W.; Li, L. Analysis of total factor efficiency of water resource and energy in China: A study based on DEA-SBM model. Sustainability 2017, 9, 1316. [Google Scholar] [CrossRef]
- Jia, Y.; Shen, J.; Wang, H. Calculation of water resource value in nanjing based on a fuzzy mathematical model. Water 2018, 10, 920. [Google Scholar] [CrossRef]
- Li, L.; Yang, W. Total factor efficiency study on china’s industrial coal input and wastewater control with dual target variables. Sustainability 2018, 10, 2121. [Google Scholar] [CrossRef]
- Zhang, J.; Li, Y.; Liu, C.; Qu, Z.; Li, F.; Yang, Z.; Jiang, L.; Fu, J. Application of set pair analysis in a comprehensive evaluation of water resource assets: A case study of Wuhan City, China. Water 2019, 11, 1718. [Google Scholar] [CrossRef]
- Biswas, A.K. Water crisis: Current perceptions and future realities. Water Int. 1999, 24, 363–367. [Google Scholar] [CrossRef]
- Biswas, A.K. From mar del plata to Kyoto: An analysis of global water policy dialogue. Glob. Environ. Chang. 2004, 14, 81–88. [Google Scholar] [CrossRef]
- Rahaman, M.M.; Varis, O. Integrated water resources management: Evolution, prospects and future challenges. Sustain. Sci. Pract. Policy 2005, 1, 15–21. [Google Scholar] [CrossRef]
- Wang, S.; Fu, B.; Chen, H.; Liu, Y. Regional development boundary of China’s Loess Plateau: Water limit and land shortage. Land Use Policy 2018, 74, 130–136. [Google Scholar] [CrossRef]
- Cheng, B.; Li, H.; Yue, S.; Huang, K. A conceptual decision-making for the ecological base flow of rivers considering the economic value of ecosystem services of rivers in water shortage area of Northwest China. J. Hydrol. 2019, 578, 124126. [Google Scholar] [CrossRef]
- Liu, W.; Sun, F. Increased adversely-affected population from water shortage below normal conditions in China with anthropogenic warming. Sci. Bull. 2019, 64, 567–569. [Google Scholar] [CrossRef]
- Ferrero, G.; Bichai, F.; Rusca, M. Experiential learning through role-playing: Enhancing stakeholder collaboration in water safety plans. Water 2018, 10, 227. [Google Scholar] [CrossRef]
- Willet, J.; Wetser, K.; Vreeburg, J.; Rijnaarts, H.H.M. Review of methods to assess sustainability of industrial water use. Water Resour. Ind. 2019, 21, 100110. [Google Scholar] [CrossRef]
- Zhou, X. Spatial explicit management for the water sustainability of coupled human and natural systems. Environ. Pollut. 2019, 251, 292–301. [Google Scholar] [CrossRef]
- Shao, W.; Liu, J.; Zhang, H.; Yan, D.; Li, W. Countermeasure analysis on promoting drinking water safety in Shanshan County, Xinjiang Autonomous Region, China. Water 2018, 10, 1022. [Google Scholar] [CrossRef]
- Yang, W.; Li, L. Energy efficiency, ownership structure, and sustainable development: Evidence from China. Sustainability 2017, 9, 912. [Google Scholar] [CrossRef]
- Gao, H.; Yang, W.; Yang, Y.; Yuan, G. Analysis of the air quality and the effect of governance policies in China’s Pearl River Delta, 2015–2018. Atmosphere 2019, 10, 412. [Google Scholar] [CrossRef]
- Gunnarsdottir, M.J.; Gardarsson, S.M.; Figueras, M.J.; Puigdomènech, C.; Juárez, R.; Saucedo, G.; Arnedo, M.J.; Santos, R.; Monteiro, S.; Avery, L.; et al. Water safety plan enhancements with improved drinking water quality detection techniques. Sci. Total Environ. 2020, 698, 134185. [Google Scholar] [CrossRef]
- Xu, J.; Wei, D.; Wang, F.; Bai, C.; Du, Y. Bioassay: A useful tool for evaluating reclaimed water safety. J. Environ. Sci. 2020, 88, 165–176. [Google Scholar] [CrossRef]
- Wang, H. Research on China’s Water Resources Issues and Sustainable Development Strategy; China Electric Power Press: Beijing, China, 2010. [Google Scholar]
- Zhang, M.; Ma, Y.; Gong, W.; Liu, B.; Shi, Y.; Chen, Z. Aerosol optical properties and radiative effects: Assessment of urban aerosols in central China using 10-year observations. Atmos. Environ. 2018, 182, 275–285. [Google Scholar] [CrossRef]
- Wang, Q.; Wang, S. A comparison of decomposition the decoupling carbon emissions from economic growth in transport sector of selected provinces in eastern, central and western China. J. Clean. Prod. 2019, 229, 570–581. [Google Scholar] [CrossRef]
- Wang, W. A Study on Microplastics Pollution in Lakes of Central China and the Sorptive Behavior of Phenanthrene and Pyrene onto Microplastics; University of Chinese Academy of Sciences: Beijing, China, 2018. [Google Scholar]
- The State Council of the People’s Republic of China. Several Opinions of the State Council on Implementing the Strategy of Promoting the Rise of the Central Region. Available online: http://www.gov.cn/zwgk/2012-08/31/content_2214579.htm (accessed on 3 October 2019).
- Yang, W.; Yuan, G.; Han, J. Is China’s air pollution control policy effective? Evidence from Yangtze River Delta cities. J. Clean. Prod. 2019, 220, 110–133. [Google Scholar] [CrossRef]
- Yuan, G.; Yang, W. Evaluating China’s air pollution control policy with extended AQI indicator system: Example of the Beijing-Tianjin-Hebei region. Sustainability 2019, 11, 939. [Google Scholar] [CrossRef]
- Yuan, G.; Yang, W. Study on optimization of economic dispatching of electric power system based on Hybrid Intelligent Algorithms (PSO and AFSA). Energy 2019, 183, 926–935. [Google Scholar] [CrossRef]
- Lu, H.; Du, P.; Chen, Y.; He, L. A credibility-based chance-constrained optimization model for integrated agricultural and water resources management: A case study in South Central China. J. Hydrol. 2016, 537, 408–418. [Google Scholar] [CrossRef]
- Cai, J.; Varis, O.; Yin, H. China’s water resources vulnerability: A spatio-temporal analysis during 2003–2013. J. Clean. Prod. 2017, 142, 2901–2910. [Google Scholar] [CrossRef]
- Yao, L.; Wang, Y.; Tong, L.; Deng, Y.; Li, Y.; Gan, Y.; Guo, W.; Dong, C.; Duan, Y.; Zhao, K. Occurrence and risk assessment of antibiotics in surface water and groundwater from different depths of aquifers: A case study at Jianghan Plain, central China. Ecotoxicol. Environ. Saf. 2017, 135, 236–242. [Google Scholar] [CrossRef]
- Hu, Y.; Yan, X.; Shen, Y.; Di, M.; Wang, J. Antibiotics in surface water and sediments from Hanjiang River, Central China: Occurrence, behavior and risk assessment. Ecotoxicol. Environ. Saf. 2018, 157, 150–158. [Google Scholar] [CrossRef]
- Jia, Z.; Cai, Y.; Chen, Y.; Zeng, W. Regionalization of water environmental carrying capacity for supporting the sustainable water resources management and development in China. Resour. Conserv. Recycl. 2018, 134, 282–293. [Google Scholar] [CrossRef]
- Zhou, Z.; Wu, H.; Song, P. Measuring the resource and environmental efficiency of industrial water consumption in China: A non-radial directional distance function. J. Clean. Prod. 2019, 240, 118169. [Google Scholar] [CrossRef]
- Jolliffe, I.T. Principal Component Analysis; Springer: New York, NY, USA, 2002. [Google Scholar]
- Ptak, M.; Sojka, M.; Choiński, A.; Nowak, B. Effect of environmental conditions and morphometric parameters on surface water temperature in Polish lakes. Water 2018, 10, 580. [Google Scholar] [CrossRef] [Green Version]
- Liang, B.; Han, G.; Liu, M.; Li, X.; Song, C.; Zhang, Q.; Yang, K. Spatial and temporal variation of dissolved heavy metals in the Mun River, Northeast Thailand. Water 2019, 11, 380. [Google Scholar] [CrossRef] [Green Version]
- Duleba, S.; Farkas, B. Principal component analysis of the potential for increased rail competitiveness in East-Central Europe. Sustainability 2019, 11, 4181. [Google Scholar] [CrossRef] [Green Version]
- Peng, C.; Chen, Y.; Kang, Z.; Chen, C.; Cheng, Q. Robust principal component analysis: A factorization-based approach with linear complexity. Inf. Sci. 2019, in press. [Google Scholar] [CrossRef]
- Ma, J.; Wang, A.; Lin, F.; Wesarg, S.; Erdt, M. A novel robust kernel principal component analysis for nonlinear statistical shape modeling from erroneous data. Comput. Med. Imaging Graph. 2019, 77, 101638. [Google Scholar] [CrossRef]
- Rapport, D.J.; Friend, A.M. Towards a Comprehensive Framework for Environmental Statistics: A Stress-Response Approach; Office of the Senior Adviser on Integration, Statistics Canada: Ottawa, ON, Canada, 1979.
- Martin, D.M.; Piscopo, A.N.; Chintala, M.M.; Gleason, T.R.; Berry, W. Developing qualitative ecosystem service relationships with the Driver-Pressure-State-Impact-Response framework: A case study on Cape Cod, Massachusetts. Ecol. Indic. 2018, 84, 404–415. [Google Scholar] [CrossRef]
- Li, S.; Li, R. Evaluating energy sustainability using the pressure-state-response and improved matter-element extension models: Case study of China. Sustainability 2019, 11, 290. [Google Scholar] [CrossRef] [Green Version]
- Zhao, Y.W.; Zhou, L.Q.; Dong, B.Q.; Dai, C. Health assessment for urban rivers based on the pressure, state and response framework—A case study of the Shiwuli River. Ecol. Indic. 2019, 99, 324–331. [Google Scholar] [CrossRef]
- Neri, A.C.; Dupin, P.; Sánchez, L.E. A pressure–state–response approach to cumulative impact assessment. J. Clean. Prod. 2016, 126, 288–298. [Google Scholar] [CrossRef]
- Guo, M.; Bu, Y.; Cheng, J.; Jiang, Z. Natural gas security in China: A simulation of evolutionary trajectory and obstacle degree analysis. Sustainability 2019, 11, 96. [Google Scholar] [CrossRef] [Green Version]
- National Bureau of Statistics of China. China Statistical Yearbook, 2011–2017; China Statistic Press: Beijing, China, 2018.
- Ministry of Environment Protection of the People’s Republic of China. Annual Statistic Report on Environment in China (2011–2017); China Environmental Science Press: Beijing, China, 2018.
- Water Resources Department of Henan Province. The Water Resource Bulletin of Henan, 2011–2017; Henan People’s Publishing House: Zhengzhou, Henan, 2018.
- The Water Resources Department of Hunan Province. The Water Resource Bulletin of Hunan Province (2011–2017); Science and Technology Publishing House of Hunan Province: Changsha, Hunan, 2018.
- Hubei Provincial Department of Water Resources. The Water Resource Bulletin of Hubei Province, 2011–2017; Hubei Science & Technology Press: Wuhan, Hubei, 2018.
- Yang, W.; Li, L. Efficiency evaluation of industrial waste gas control in China: A study based on data envelopment analysis (DEA) model. J. Clean. Prod. 2018, 179, 1–11. [Google Scholar] [CrossRef]
- Tian, Y.; You, M.; Shang, S. Existence results for a fourth-order discrete boundary value problem with a parameter. Discrete Math. 2019, 342, 3114–3122. [Google Scholar] [CrossRef]
- Zhao, F.; Zhang, W.; Wang, Y. Quantifying the coordination of energy development and environmental protection: A case study of China. Energy Procedia 2016, 104, 520–525. [Google Scholar] [CrossRef]
- Zhang, B.; Cao, C.; Hughes, R.M.; Davis, W.S. China’s new environmental protection regulatory regime: Effects and gaps. J. Environ. Manag. 2017, 187, 464–469. [Google Scholar] [CrossRef]
- Yang, Y.; Yang, W. Does whistleblowing work for air pollution control in China? A study based on three-party evolutionary game model under incomplete information. Sustainability 2019, 11, 324. [Google Scholar] [CrossRef] [Green Version]
- General Office of the People’s Government of Henan Province. Notice on Printing and Distributing Nine Implementation Plans for Water Pollution Prevention and Control in Henan Province. Available online: https://www.henan.gov.cn/2017/05-03/658854.html (accessed on 3 October 2019).
- Henan Provincial Government. Henan Officially Started a Battle Against Water Pollution, and the Quality of the Water Environment Gradually Improved. Available online: https://www.henan.gov.cn/2017/09-01/379284.html (accessed on 3 October 2019).
- Chen, J.; Yang, H. Geographical mobility, income, life satisfaction and family size preferences: An empirical study on rural households in Shaanxi and Henan provinces in China. Soc. Indic. Res. 2016, 129, 277–290. [Google Scholar] [CrossRef] [Green Version]
- Wang, L.; Liang, K.; Peng, Y. The countywide differences of China’s total fertility rate and an empirical study of its influencing factors. Popul. J. 2015, 37, 16–25. [Google Scholar]
- Henan Provincial Bureau of Statistics. Statistical Communique of National Economic and Social Development of Henan Province, 2011–2017; Henan People’s Publishing House: Zhengzhou, Henan, 2018.
- Hubei Provincial Department of Water Resources. Hubei Province Water Resources Bulletin, 2003–2018. Available online: http://slt.hubei.gov.cn/szy/list.aspx?tid=271 (accessed on 3 October 2019).
- Guo, R.; Hao, H. Coordination in hubei province’s economic development and environment. In Proceedings of the International Conference on Education, Management, Computer and Society, Shenyang, China, 1–3 January 2016. [Google Scholar]
- Liu, J. Relationship between water pollution and regional economic development: Empirical evidence from Hubei, China. Nat. Environ. Pollut. Technol. 2019, 18, 599–603. [Google Scholar]
- Tortajada, C. Policy dimensions of development and financing of water infrastructure: The cases of China and India. Environ. Sci. Policy 2016, 64, 177–187. [Google Scholar] [CrossRef]
- Li, J.; Zhang, Z.; Liu, Y.; Yao, C.; Song, W.; Xu, X.; Zhang, M.; Zhou, X.; Gao, Y.; Wang, Z.; et al. Effects of micro-sprinkling with different irrigation amount on grain yield and water use efficiency of winter wheat in the North China Plain. Agric. Water Manag. 2019, 224, 105736. [Google Scholar] [CrossRef]
- Kang, Y.; Xie, B.; Wang, J.; Wang, Y. Environmental assessment and investment strategy for China’s manufacturing industry: A non-radial DEA based analysis. J. Clean. Prod. 2018, 175, 501–511. [Google Scholar] [CrossRef]
Figure 1.
Scores of principal component indices and sustainable development indices in central China from 2011 to 2017: (a) Henan Province; (b) Hubei Province; (c) Hunan Province.
Figure 1.
Scores of principal component indices and sustainable development indices in central China from 2011 to 2017: (a) Henan Province; (b) Hubei Province; (c) Hunan Province.


Figure 2.
The comprehensive evaluation scores of the sustainability index after discretization for provinces in central China from 2011 to 2017.
Figure 2.
The comprehensive evaluation scores of the sustainability index after discretization for provinces in central China from 2011 to 2017.

Figure 3.
Evaluation values of sustainable development in provinces of central China from 2011 to 2017: (a) Henan Province; (b) Hubei Province; (c) Hunan Province.
Figure 3.
Evaluation values of sustainable development in provinces of central China from 2011 to 2017: (a) Henan Province; (b) Hubei Province; (c) Hunan Province.


Table 1.
Indicator System for Performance Evaluation of Water Environment Management based on the Pressure-State-Response (PSR) Model.
Table 1.
Indicator System for Performance Evaluation of Water Environment Management based on the Pressure-State-Response (PSR) Model.
| Indicator Type | Indicator Number | Indicator Description | Unit of Measurement | Nature of Indicator |
|---|---|---|---|---|
| The Pressure Layer | ZP1 | Total Wastewater Discharge | 10 Thousand Tons | Negative Indicator (a lower value is preferred) |
| ZP2 | Chemical Oxygen Demand (COD) | 10 Thousand Tons | Negative Indicator (a lower value is preferred) | |
| ZP3 | NH3-N Emissions | 10 Thousand Tons | Negative Indicator (a lower value is preferred) | |
| ZP4 | Phosphorus Emissions | 10 Thousand Tons | Negative Indicator (a lower value is preferred) | |
| ZP5 | Lead Emissions | Kilogram | Negative Indicator (a lower value is preferred) | |
| ZP6 | Mercury Emissions | Kilogram | Negative Indicator (a lower value is preferred) | |
| ZP7 | Cadmium Emissions | Kilogram | Negative Indicator (a lower value is preferred) | |
| ZP8 | Chromium Emissions | Kilogram | Negative Indicator (a lower value is preferred) | |
| ZP9 | Arsenic Emissions | Kilogram | Negative Indicator (a lower value is preferred) | |
| ZP10 | General Industrial Solid Waste | 10 Thousand Tons | Negative Indicator (a lower value is preferred) | |
| The State Layer | ZS1 | Regional GDP | 100 Million RMB | Positive Indicator (a higher value is preferred) |
| ZS2 | Regional Secondary Industry Output | 100 Million RMB | Positive Indicator (a higher value is preferred) | |
| ZS3 | Birth Rate | ‰ | Positive Indicator (a higher value is preferred) | |
| ZS4 | Mortality Rate | ‰ | Positive Indicator (a higher value is preferred) | |
| ZS5 | Natural Population Growth Rate | ‰ | Positive Indicator (a higher value is preferred) | |
| The Response Layer | ZR1 | Afforestation Area | Hectare | Positive Indicator (a higher value is preferred) |
| ZR2 | Constructed Wetland Area | 1000 Hectares | Positive Indicator (a higher value is preferred) | |
| ZR3 | Comprehensive Utilization of General Industrial Solid Waste | 10 Thousand Tons | Positive Indicator (a higher value is preferred) | |
| ZR4 | Investment in Industrial Wastewater Treatment | 10 Thousand RMB | Positive Indicator (a higher value is preferred) | |
| ZR5 | Investment in Industrial Waste Treatment | 10 Thousand RMB | Positive Indicator (a higher value is preferred) | |
| ZR6 | Investment in Ecosystem Construction and Protection | 10 Thousand RMB | Positive Indicator (a higher value is preferred) |
Table 2.
Calculation Results of Eigenvalues and Eigenvectors from the PSR Model.
| Eigenvalue | Principal Component Variable | Z1 | Z2 | Z3 | Z4 | Z5 |
| Eigenvalue | 9.977 | 2.409 | 2.319 | 1.352 | 1.255 | |
| Principal Component Contribution Rate | 47.511 | 11.473 | 11.044 | 6.438 | 5.974 | |
| Cumulative Contribution Rate | 47.511 | 58.983 | 70.028 | 76.465 | 82.44 | |
| Eigenvector | Independent Variables | Vector1 | Vector2 | Vector3 | Vector4 | Vector5 |
| P3 | −0.3359 | −0.0455 | −0.2503 | 0.27644 | −0.18581 | |
| S5 | −0.1400 | 0.02874 | −0.1249 | 0.41216 | −0.0617 | |
| P6 | 0.23879 | 0.31971 | −0.0977 | 0.36257 | −0.0647 | |
| S2 | −0.1322 | −0.0566 | 0.13636 | 0.17075 | 0.303756 | |
| R6 | 0.08740 | −0.0894 | 0.39251 | 0.09988 | 0.227806 | |
| Correlation Coefficient between Variables | Different Variables | P3 | S5 | P6 | S2 | R6 |
| P3 | 1 | — | — | — | — | |
| S5 | 0.464 | 1 | — | — | — | |
| P6 | 0.814 | −0.067 | 1 | — | — | |
| S2 | 0.406 | −0.005 | 0.667 | 1 | — | |
| R6 | 0.723 | 0.106 | −0.421 | −0.276 | 1 |
Table 3.
Factor Variance Contribution Rate.
| Total Variance Contribution | |||||||||
|---|---|---|---|---|---|---|---|---|---|
| Indicator | Initial Eigenvalue | Sum of Squares of Extracted Loads | Sum of Squares of Rotated Loads | ||||||
| Total | Variance | Cumulative | Total | Variance | Cumulative | Total | Variance | Cumulative | |
| 1 | 9.977 | 47.511 | 47.511 | 9.977 | 47.511 | 47.511 | 9.272 | 44.154 | 44.154 |
| 2 | 2.409 | 11.473 | 58.983 | 2.409 | 11.473 | 58.983 | 2.489 | 11.852 | 56.006 |
| 3 | 2.319 | 11.044 | 70.028 | 2.319 | 11.044 | 70.028 | 2.113 | 10.060 | 66.066 |
| 4 | 1.352 | 6.438 | 76.465 | 1.352 | 6.438 | 76.465 | 2.042 | 9.723 | 75.790 |
| 5 | 1.255 | 5.974 | 82.440 | 1.255 | 5.974 | 82.440 | 1.397 | 6.650 | 82.440 |
| 6 | 0.838 | 3.990 | 86.430 | — | — | — | — | — | — |
| 7 | 0.769 | 3.663 | 90.094 | — | — | — | — | — | — |
| 8 | 0.582 | 2.769 | 92.863 | — | — | — | — | — | — |
| 9 | 0.543 | 2.584 | 95.447 | — | — | — | — | — | — |
| 10 | 0.312 | 1.488 | 96.935 | — | — | — | — | — | — |
| 11 | 0.234 | 1.113 | 98.048 | — | — | — | — | — | — |
| 12 | 0.193 | 0.917 | 98.965 | — | — | — | — | — | — |
| 13 | 0.085 | 0.405 | 99.370 | — | — | — | — | — | — |
| 14 | 0.059 | 0.279 | 99.648 | — | — | — | — | — | — |
| 15 | 0.032 | 0.151 | 99.799 | — | — | — | — | — | — |
| 16 | 0.023 | 0.111 | 99.910 | — | — | — | — | — | — |
| 17 | 0.012 | 0.059 | 99.970 | — | — | — | — | — | — |
| 18 | 0.006 | 0.027 | 99.997 | — | — | — | — | — | — |
| 19 | 0.001 | 0.003 | 100.000 | — | — | — | — | — | — |
| 20 | 0.000 | 0.000 | 100.000 | — | — | — | — | — | — |
| 21 | 0.000 | 0.000 | 100.000 | — | — | — | — | — | — |
Table 4.
Rotated Factor Load Matrix.
| Indicator | Principal Component | ||||
|---|---|---|---|---|---|
| Z1 | Z2 | Z3 | Z4 | Z5 | |
| ZP1 | 0.170 | −0.253 | −0.506 | 0.709 | −0.045 |
| ZP2 | 0.949 | 0.008 | 0.088 | 0.245 | 0.030 |
| ZP3 | 0.954 | 0.017 | 0.106 | 0.211 | 0.029 |
| ZP4 | 0.924 | −0.002 | 0.055 | 0.315 | −0.035 |
| ZP5 | 0.780 | 0.090 | 0.272 | 0.020 | 0.274 |
| ZP6 | 0.697 | 0.212 | 0.446 | −0.028 | 0.216 |
| ZP7 | 0.736 | 0.211 | 0.222 | 0.005 | 0.409 |
| ZP8 | 0.714 | 0.224 | 0.260 | −0.246 | −0.220 |
| ZP9 | 0.888 | 0.154 | 0.183 | 0.191 | 0.233 |
| ZP10 | 0.202 | −0.811 | 0.198 | −0.299 | −0.173 |
| ZS1 | 0.878 | 0.200 | 0.307 | −0.090 | 0.187 |
| ZS2 | 0.358 | 0.115 | 0.101 | 0.814 | −0.100 |
| ZS3 | 0.461 | 0.757 | −0.067 | −0.213 | −0.138 |
| ZS4 | 0.679 | 0.313 | 0.142 | 0.722 | −0.007 |
| ZS5 | 0.375 | 0.774 | −0.087 | −0.234 | −0.099 |
| ZR1 | −0.229 | 0.077 | −0.850 | −0.070 | −0.016 |
| ZR2 | 0.716 | 0.145 | −0.074 | 0.079 | −0.270 |
| ZR3 | −0.859 | 0.337 | 0.142 | 0.145 | −0.026 |
| ZR4 | 0.133 | −0.042 | −0.039 | −0.085 | 0.431 |
| ZR5 | −0.147 | 0.327 | −0.697 | 0.149 | 0.065 |
| ZR6 | 0.741 | 0.150 | 0.036 | −0.545 | −0.012 |
Extraction Method: Principal Component Analysis Method. Rotation Method: Caesar Normalization Maximum Variance Method. Note: Rotation has converged after 11 iterations.
© 2019 by the authors. Licensee MDPI, Basel, Switzerland. This article is an open access article distributed under the terms and conditions of the Creative Commons Attribution (CC BY) license (http://creativecommons.org/licenses/by/4.0/).
Share and Cite
MDPI and ACS Style
Li, Y.; Yang, W.; Shen, X.; Yuan, G.; Wang, J. Water Environment Management and Performance Evaluation in Central China: A Research Based on Comprehensive Evaluation System. Water 2019, 11, 2472. https://doi.org/10.3390/w11122472
AMA Style
Li Y, Yang W, Shen X, Yuan G, Wang J. Water Environment Management and Performance Evaluation in Central China: A Research Based on Comprehensive Evaluation System. Water. 2019; 11(12):2472. https://doi.org/10.3390/w11122472
Chicago/Turabian StyleLi, Yuangang, Weixin Yang, Xiaojuan Shen, Guanghui Yuan, and Jiawei Wang. 2019. "Water Environment Management and Performance Evaluation in Central China: A Research Based on Comprehensive Evaluation System" Water 11, no. 12: 2472. https://doi.org/10.3390/w11122472
Note that from the first issue of 2016, this journal uses article numbers instead of page numbers. See further details here.