Gendered Water Insecurity: A Structural Equation Approach for Female Headed Households in South Africa


1
Risk and Vulnerability Science Centre, University of Fort Hare, Alice 0870, South Africa
2
Dean’s Office, Faculty of Science and Agriculture, University of Fort Hare, Alice 0870, South Africa
*
Author to whom correspondence should be addressed.
Water 2019, 11(12), 2491; https://doi.org/10.3390/w11122491
Submission received: 19 September 2019
/
Revised: 11 November 2019
/
Accepted: 17 November 2019
/
Published: 26 November 2019
(This article belongs to the Special Issue Water Security)
Abstract
:Intricacies between women and water are central to achieving the 2030 Sustainable Development Goals (SDGs). Gender equality and women empowerment is a key driver in ending hunger and poverty as well as improve water security the study sought to identify and provide pathways through which female-headed households were water insecure in South Africa. Secondary data collected during the 2016 General Household Survey (GHS) was utilised, with a sample of 5928 female-headed households. Principal Component Analysis and Structural Equation Modelling were used to analyse the data. The results show dynamic relationships between water characteristics and water treatment. There were also associations between water access and wealth status of the female-headed households. Association was also found between water access and water treatment as well as between wealth status and water treatment. The study concludes that there are dynamic relationships in water insecurity (exposure, sensitivity and adaptive capacity) for female-headed households in South Africa. The study recommends that a multi-prong approach is required in tackling exposures, sensitivities and adaptive capacities to water insecurity. This should include capacity–building and empowering women for wealth generation, improve access to water treatment equipment as well as prioritising improvement of infrastructure that brings piped and safe water to female-headed households.
1. Introduction
The Global Risk Report identifies water crises having the fourth most significant societal impact after weapons of mass destruction, climate change and extreme weather events, ahead of natural disasters [1]. Water, a basic human need and right, permits human functioning and activity, allowing for improved standard of living, as well as improve the agricultural, industrial and service sector productive capacities [2]. Sustainable Development Goal (SDG) 6 addresses drinking water resources, with an endeavour to achieve “universal and equitable access to safe and affordable drinking water for all” by 2030. However, there is also recognition that water affects the entire global development agenda [3,4]. In that light, SDG 5 avers to end barriers preventing women and girls from realising their full potential [5]. In achieving both SDGs 5 and 6, it is peculiar that women and girls are responsible in providing water security. A report by UN Women [6] actually identifies that women are not only central in water security, but across all the 17 SDGs.
The majority of the 1.2 billion poor people worldwide, with two thirds being women, and mostly located in Sub Sahara Africa (SSA) and South Asia, do not have access to safe and reliable sources of water [7,8]. Six hundred and sixty-three million people worldwide (with some estimates running up to 785 million) are officially recognised as having no access to an improved drinking water source [9,10,11]. This has been exacerbated by rapid population growth (expected to triple by 2050), urbanization, increased pollution and changing lifestyles, which enhance the gap between supply and demand of water. By the end of the 21st century, water demand in many SSA countries is projected to double [12].
South Africa is the 30th driest country, described as being water scarce with uneven distribution across the country [13,14]. The country is divided into 19 water management areas (WMAs) for management purposes [15]. In 60% of these WMAs, the country is already using 98% of its existing water supplies [16]. South Africa had 7.1 million people without basic water supply in 2000, which decreased to 5.4 million in 2004 further decreasing to 4.2 million in 2017 [17]. This has been attributed to heavy investment in water infrastructure since 1994, with over 4395 registered dams [18,19]. The average person uses 25 L of water a day, with projections that water use in the country will rise to 30 billion cubic metres per year by 2030 [16]. Maintaining the current water usage in the country will result in a 17% water deficit by 2030 [20]. Due to the country’s political history and cognisance of the country’s racial and gender discrimination, resulting in conflict of water use, inadequate water supply and slow progress towards promotion of equitable distribution, equity is a strong driver on water policy in South Africa [14,21]. However, water related policy such as the 1994 White Paper on Water Supply and Sanitation, the White Paper on National Water Policy and the 1997 Water Services Act 108, have paid lip-service to the gender perspectives in terms of water security [22,23].
There exists differentiated relationships to water access, use, knowledge, governance and experiences between men and women, mainly based on gendered division of labour associating women with water [24]. The relationship between water and gender plays out in four ways [25]: (a) mirroring gender inequalities in forms such as control and ownership of assets, employment, exposures to risk and decision making, (b) unique and gendered nonmonetary and noneconomic values, (c) solidification of the status quo through noneconomic and nonmonetary values, having differential effect on men and women, and (d) equalizing gender relations in water influencing overall gender equality. Globally, women and girls are responsible for water collection in 80% of the households which have no water on their premises [5,26]. However, women are disproportionately affected by resource scarcity, with global indicators on water access not reflecting the gender-disaggregated benefits and burdens. For instance, a report by UN [27] identifies that in SSA, women spend 16 million hours a day collecting water, whilst men and children spend 6 million and 4 million per day, respectively. At a more individualistic level, women and girls spend between 3 min and 3 h per day collecting water [8]. This is time foregone in pursuit of agricultural and livelihood activities. Furthermore, the girl child’s school attendance can be improved by 12% if the time taken to fetch water is reduced by 50%. This puts into question the celebrated achievement of the Millennium Development Goal (MDG) 7, of halving the proportion of the population with access to safe drinking water by 2015 [28].
Due to their proximity and activities concerning water, women are vulnerable to water insecurity through exposures to water-borne diseases, fatigue from physically carrying water and exposure to sexual and physical harassment, amongst others [28]. Proximity to treated water and their wellbeing also has an effect on their sensitivity and adaptive capacity to water insecurity. The great distances, difficult terrain and heavy lifting expose women to vulnerabilities of water insecurity. However, few studies have quantified the vulnerabilities and burdens on women, with a few taking a phenomenological qualitative approach [26,29]. Vulnerability studies have also been scanty in the water security realm, with most studies taking linear forms of either quantifying exposures, sensitivities or adaptive capacities in climate change studies. Most water security studies have quantified vulnerabilities through use of indices, such as the Falkenmark water stress index, the Water Resources Vulnerability Index, the Water Poverty Index, the Household Water Insecurity Access Scale (HWIAS) whilst others have used measures such as the Consumption Water Footprint (CW) and the Production Water Footprint (PW), amongst others [21,30,31]. There are limited studies on the pathways between water insecurity and supply, as well as the complexities surrounding patterns of water availability, access and use [32]. A few studies have tried to operationalize the relationship between the water security attributes [21,32,33]. Fewer still have tried to incorporate gender inequality in these studies [31,34]. Observing that women spend more time on water related issues underscores that in order to attain sustainable benefits and unlock the potential of half the global society, emphasis should be placed on female related activities [27]. The current study argues for the need of a water insecurity vulnerability assessment especially for women into research agendas as well as policy interventions, monitoring and evaluation. The study aims to identify and provide pathways through which female-headed households are water insecure. Value and choice of water is differentiated according to its attributes (quality, affordability, reliability and availability), dependent on the intended use [10]. The country’s National Water and Sanitation Master Plan as well as the National Water Resource Strategy recognise that it is the prerogative of the water sector to provide universal and equitable access to reliable water supply as enshrined in the country’s National Water Act and the Water Services Act [35]. However, narrowly focussing on the supply side of water does not guarantee equitable access to satisfy demand especially for disadvantaged classes such as women. The current study is not antagonistic and does not dispel institutional capacitation in providing equitable access to water. The study, however, reinforces the need for better identification of need for female-headed households, with tier benefits of achieving water security, and equitably.
1.1. Conceptual Frameworks
1.1.1. Drinking Water Decision Framework
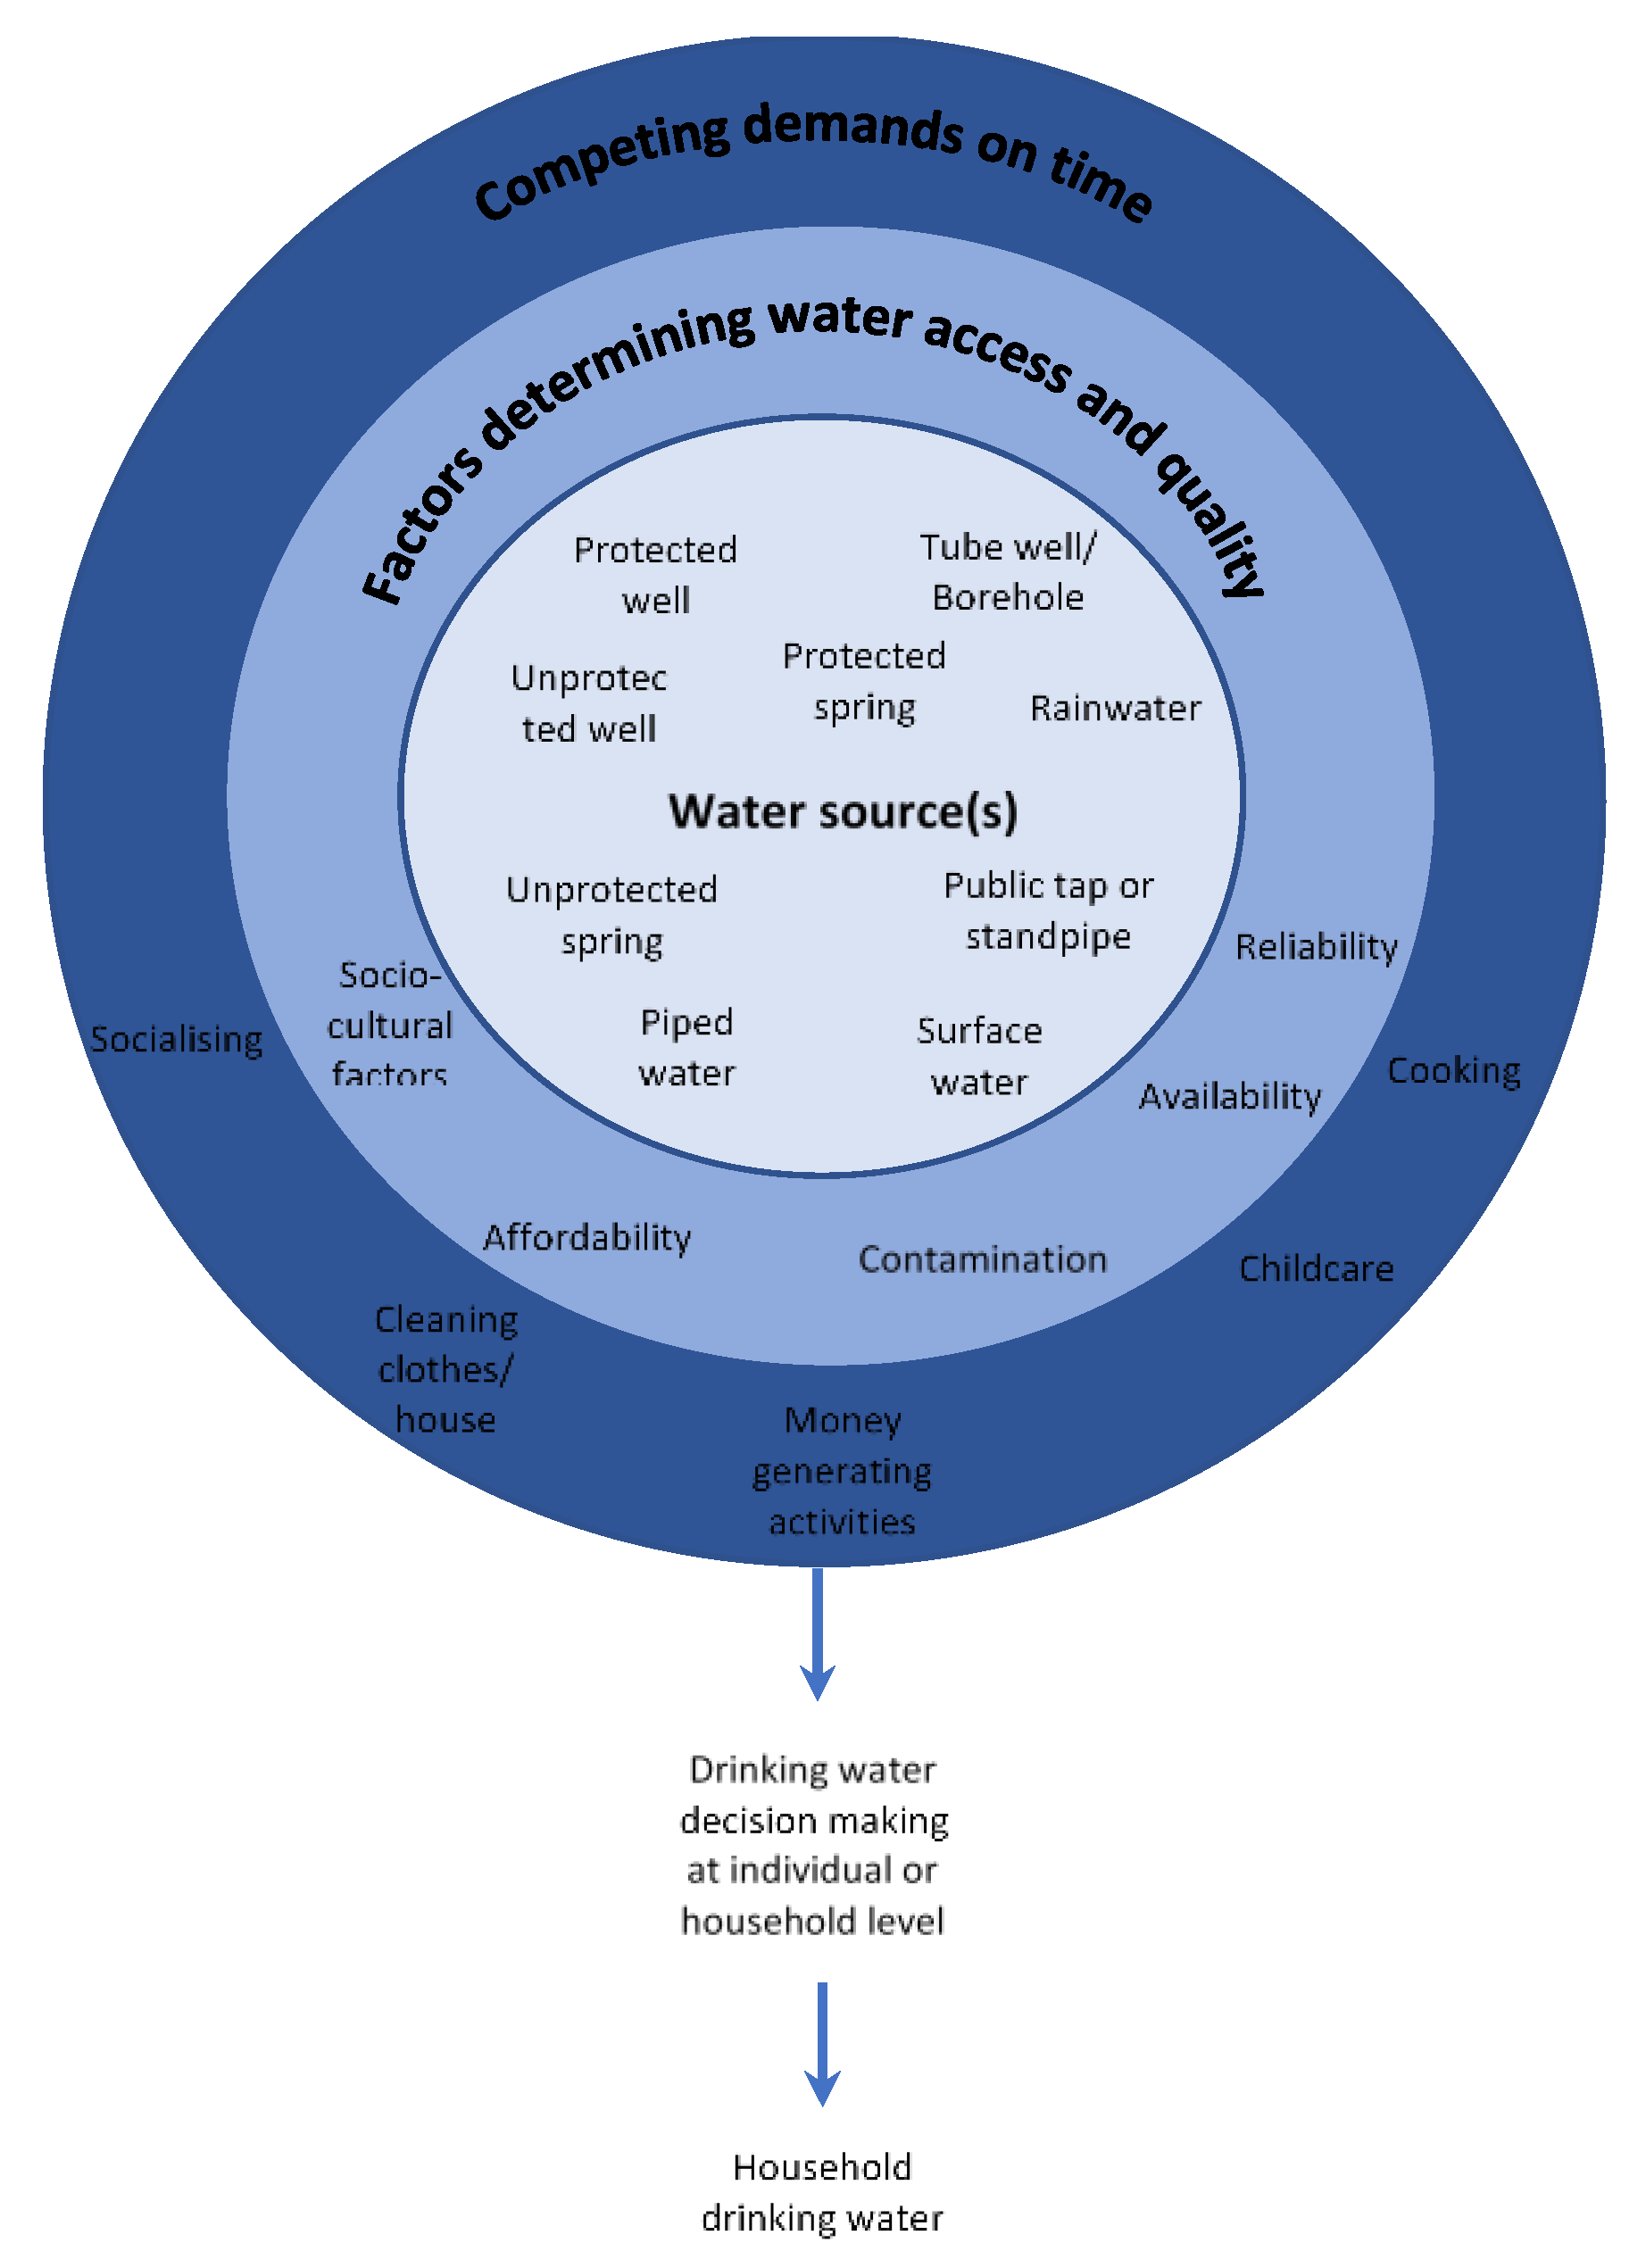
There are various drinking water sources available to households in South Africa. However, various factors mediate people’s ability to access these different sources of water (Figure 1). Women are responsible for collecting water, even though place and time decision may be influenced by the spouse or adult male in the household. The initial decision will depend on the source of water available to the household as depicted by Figure 1.
A series of factors related to the source (e.g., cost and reliability of the water source) as well as socio-economic (e.g., ability of the household to afford water and perceptions towards its safety) that will shape decision making concerning which source of water to access [10]. The peripheral ring from Figure 1 shows the competing livelihood decision making relative to drinking water. Thus decisions pertaining to drinking water collection are complex and multi-dimensional. The socio-cultural factors in the context of the study refer to the role women play in water decision making. Distance to water sources act as determinants to the quantity of water. This is also influenced by the risk associated with these distances. Competing demands may influence the ability to queue for water, and thus encourage use of expedient sources even if they are of a lower quality. Intermittent water supplies can influence water collectors to seek more reliable water sources, even if it is of a lower quality [10,36]. Unreliable water supply prompts people to adapt through coping strategies such as storing water and drilling wells and boreholes [37]. Unreliability of water results in more prioritisation towards drinking with less towards other important tasks, like washing hands. Households without piped connections often pay more for their water than those with a connection. The high cost of water means that households will not consume as much safe water as they need [10]. According to Price et al. [10], the actual or perceived quality of water is key in decision making about drinking water.
1.1.2. Vulnerability Framework
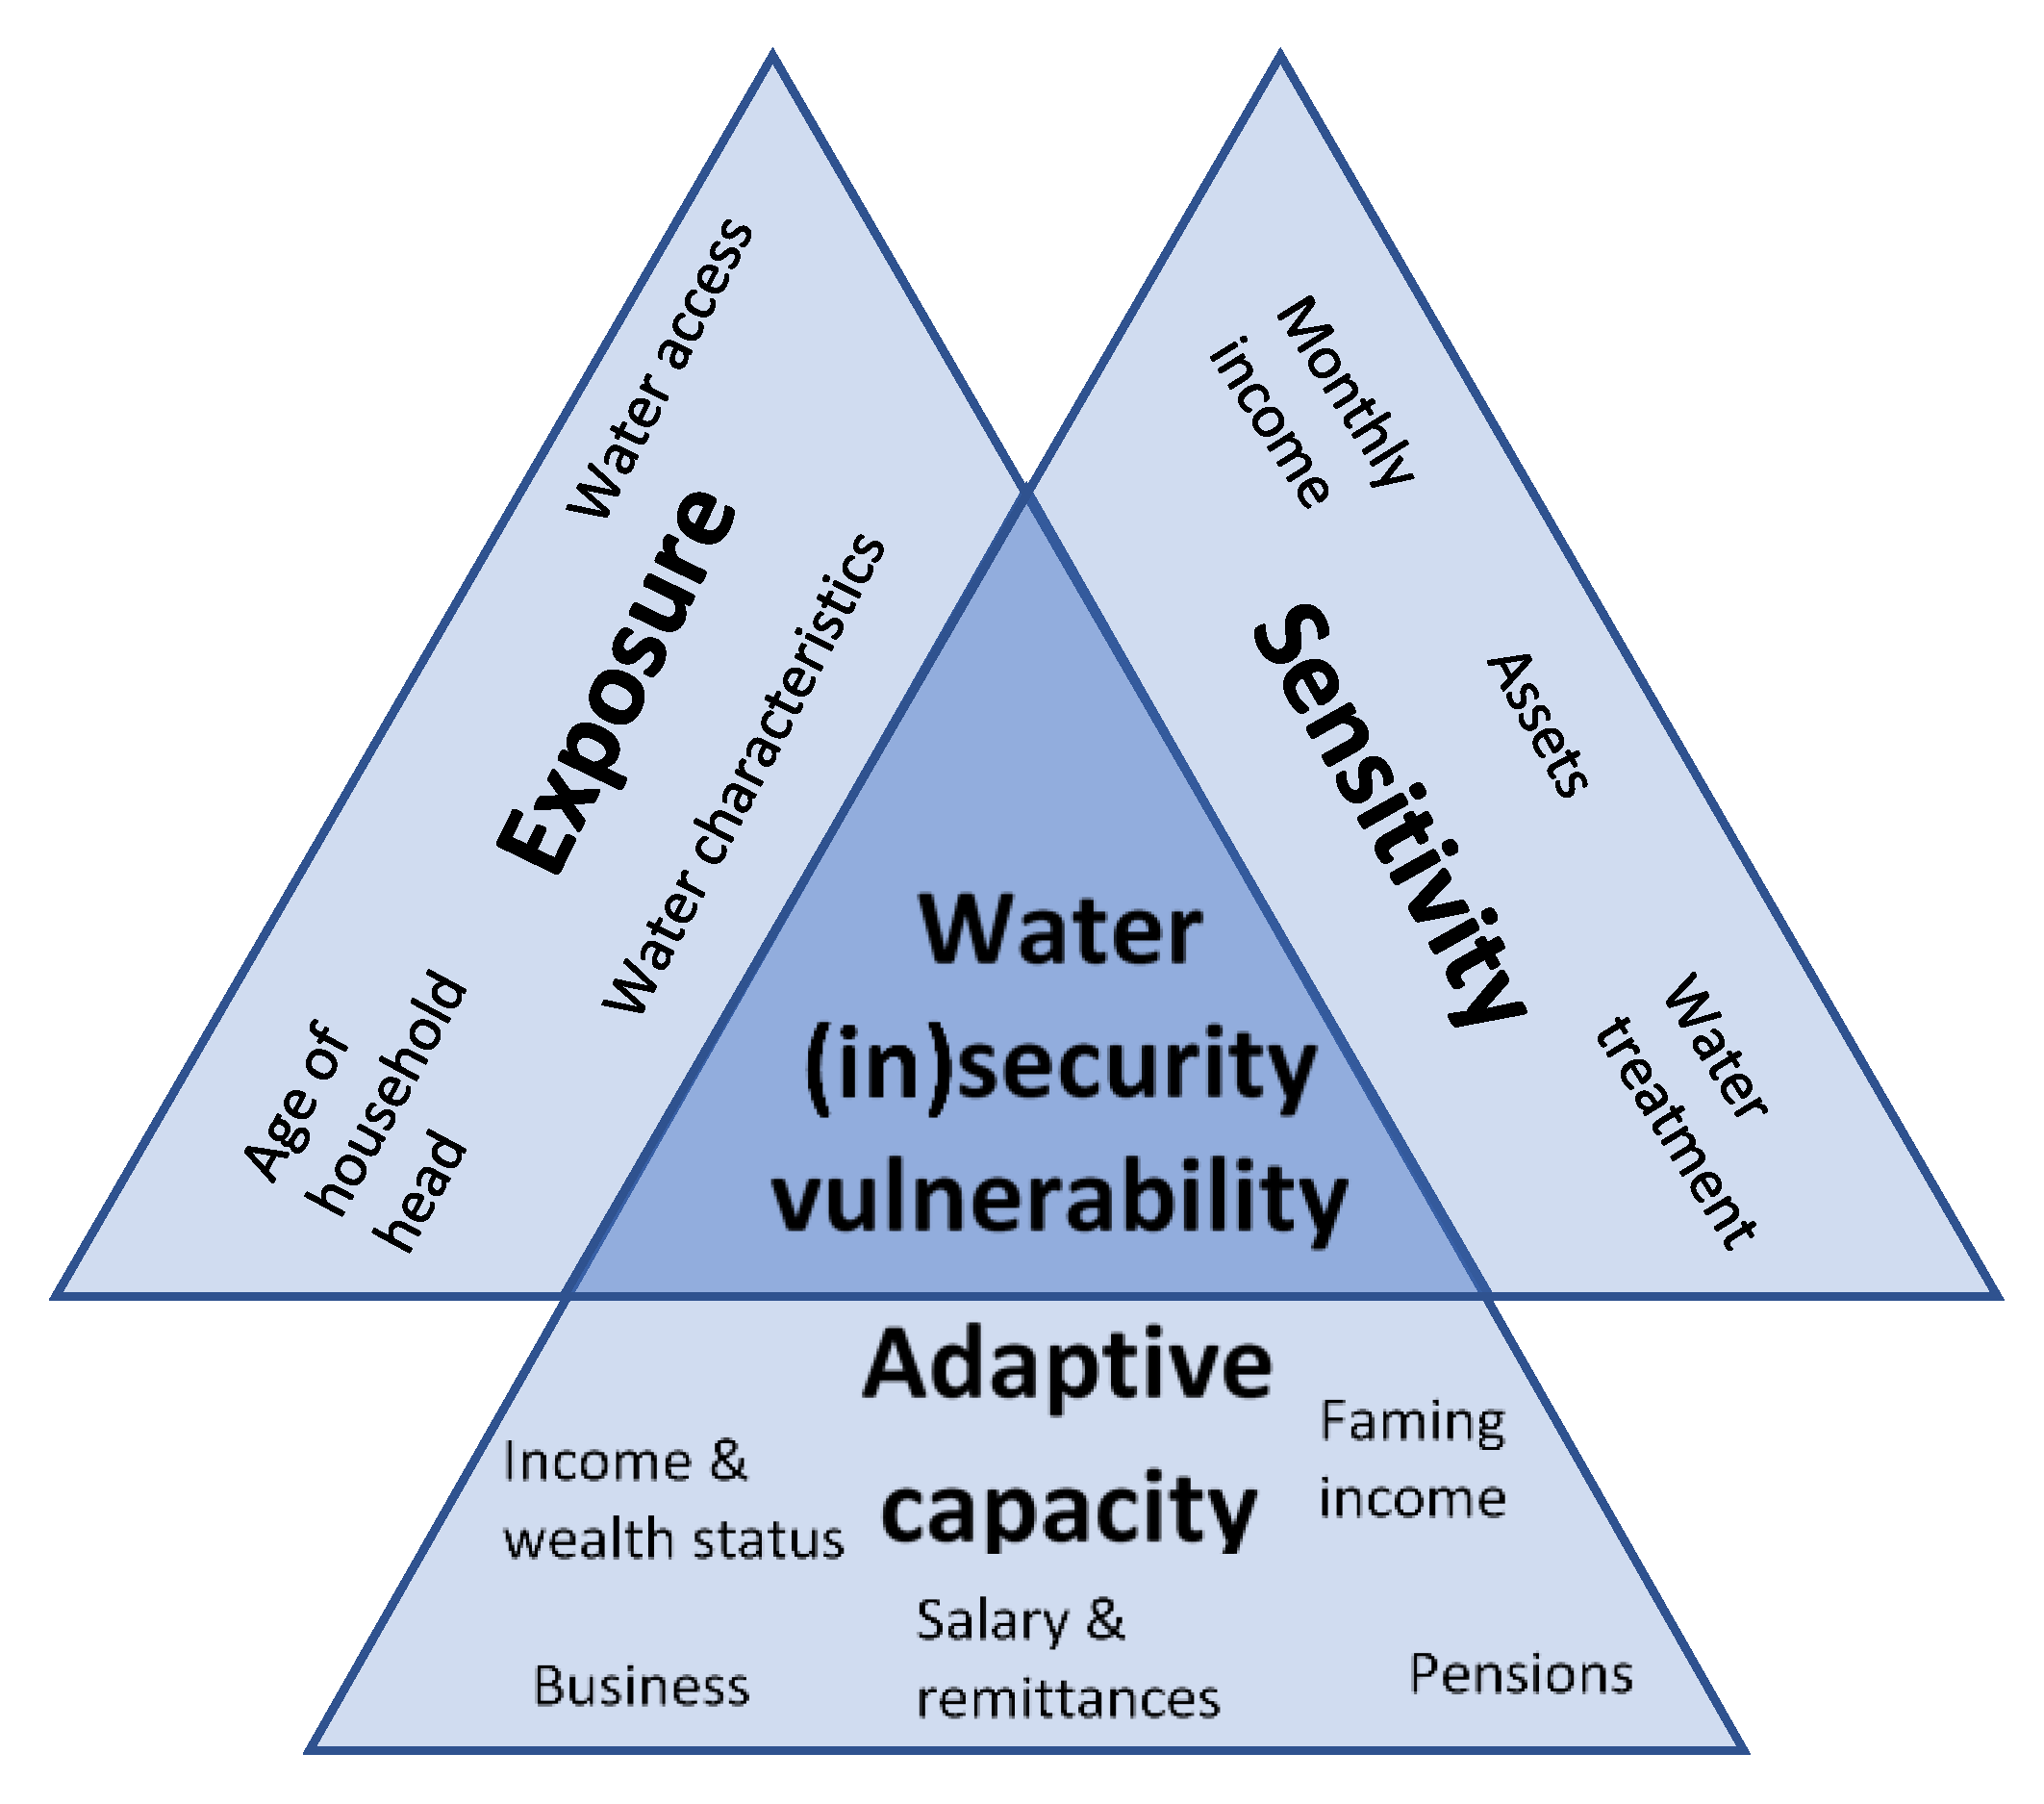
Vulnerability can be utilised in a wide range of contexts, systems and hazards [38]. In the context of the current study, it takes a social science point of view, depicting the set of socio-economic elements determining people’s ability to cope with stress or change [39]. In the current study, hazards will refer to physical manifestation of water insecurity, through compromised access, availability and use. Vulnerability is a function of exposure to a stressor, impact (sensitivity or effect) and adaptive capacity (resilience or recovery potential) [40]. Vulnerability focusses on the exposure to water insecurity, the likelihood or frequency of occurrence of the water insecurity and the sensitivity to the impact of water insecurity. In particular, social vulnerability arises purely from the inherent properties of its internal characteristics. Social vulnerability is determined by factors representing economic well-being, preparedness and coping with respect to water insecurity. The typical vulnerability assessment measure, mostly used in climate change studies, follows the linear form as exhibited by Figure 2a. However, the current study argues that this linear approach does not highlight the relationships between the constructs of the vulnerability measures, which might be multi-directional/dimensional. Hence, the study will employ a dynamic vulnerability framework as shown in Figure 2b.
Figure 2b shows that there are multi-directional associations between exposures, sensitivities and adaptive capacities to water insecurity, which are at play in the vulnerability realm. An equilibrium will need to be reached to ascertain the vulnerability to water insecurity.
2. Materials and Methods
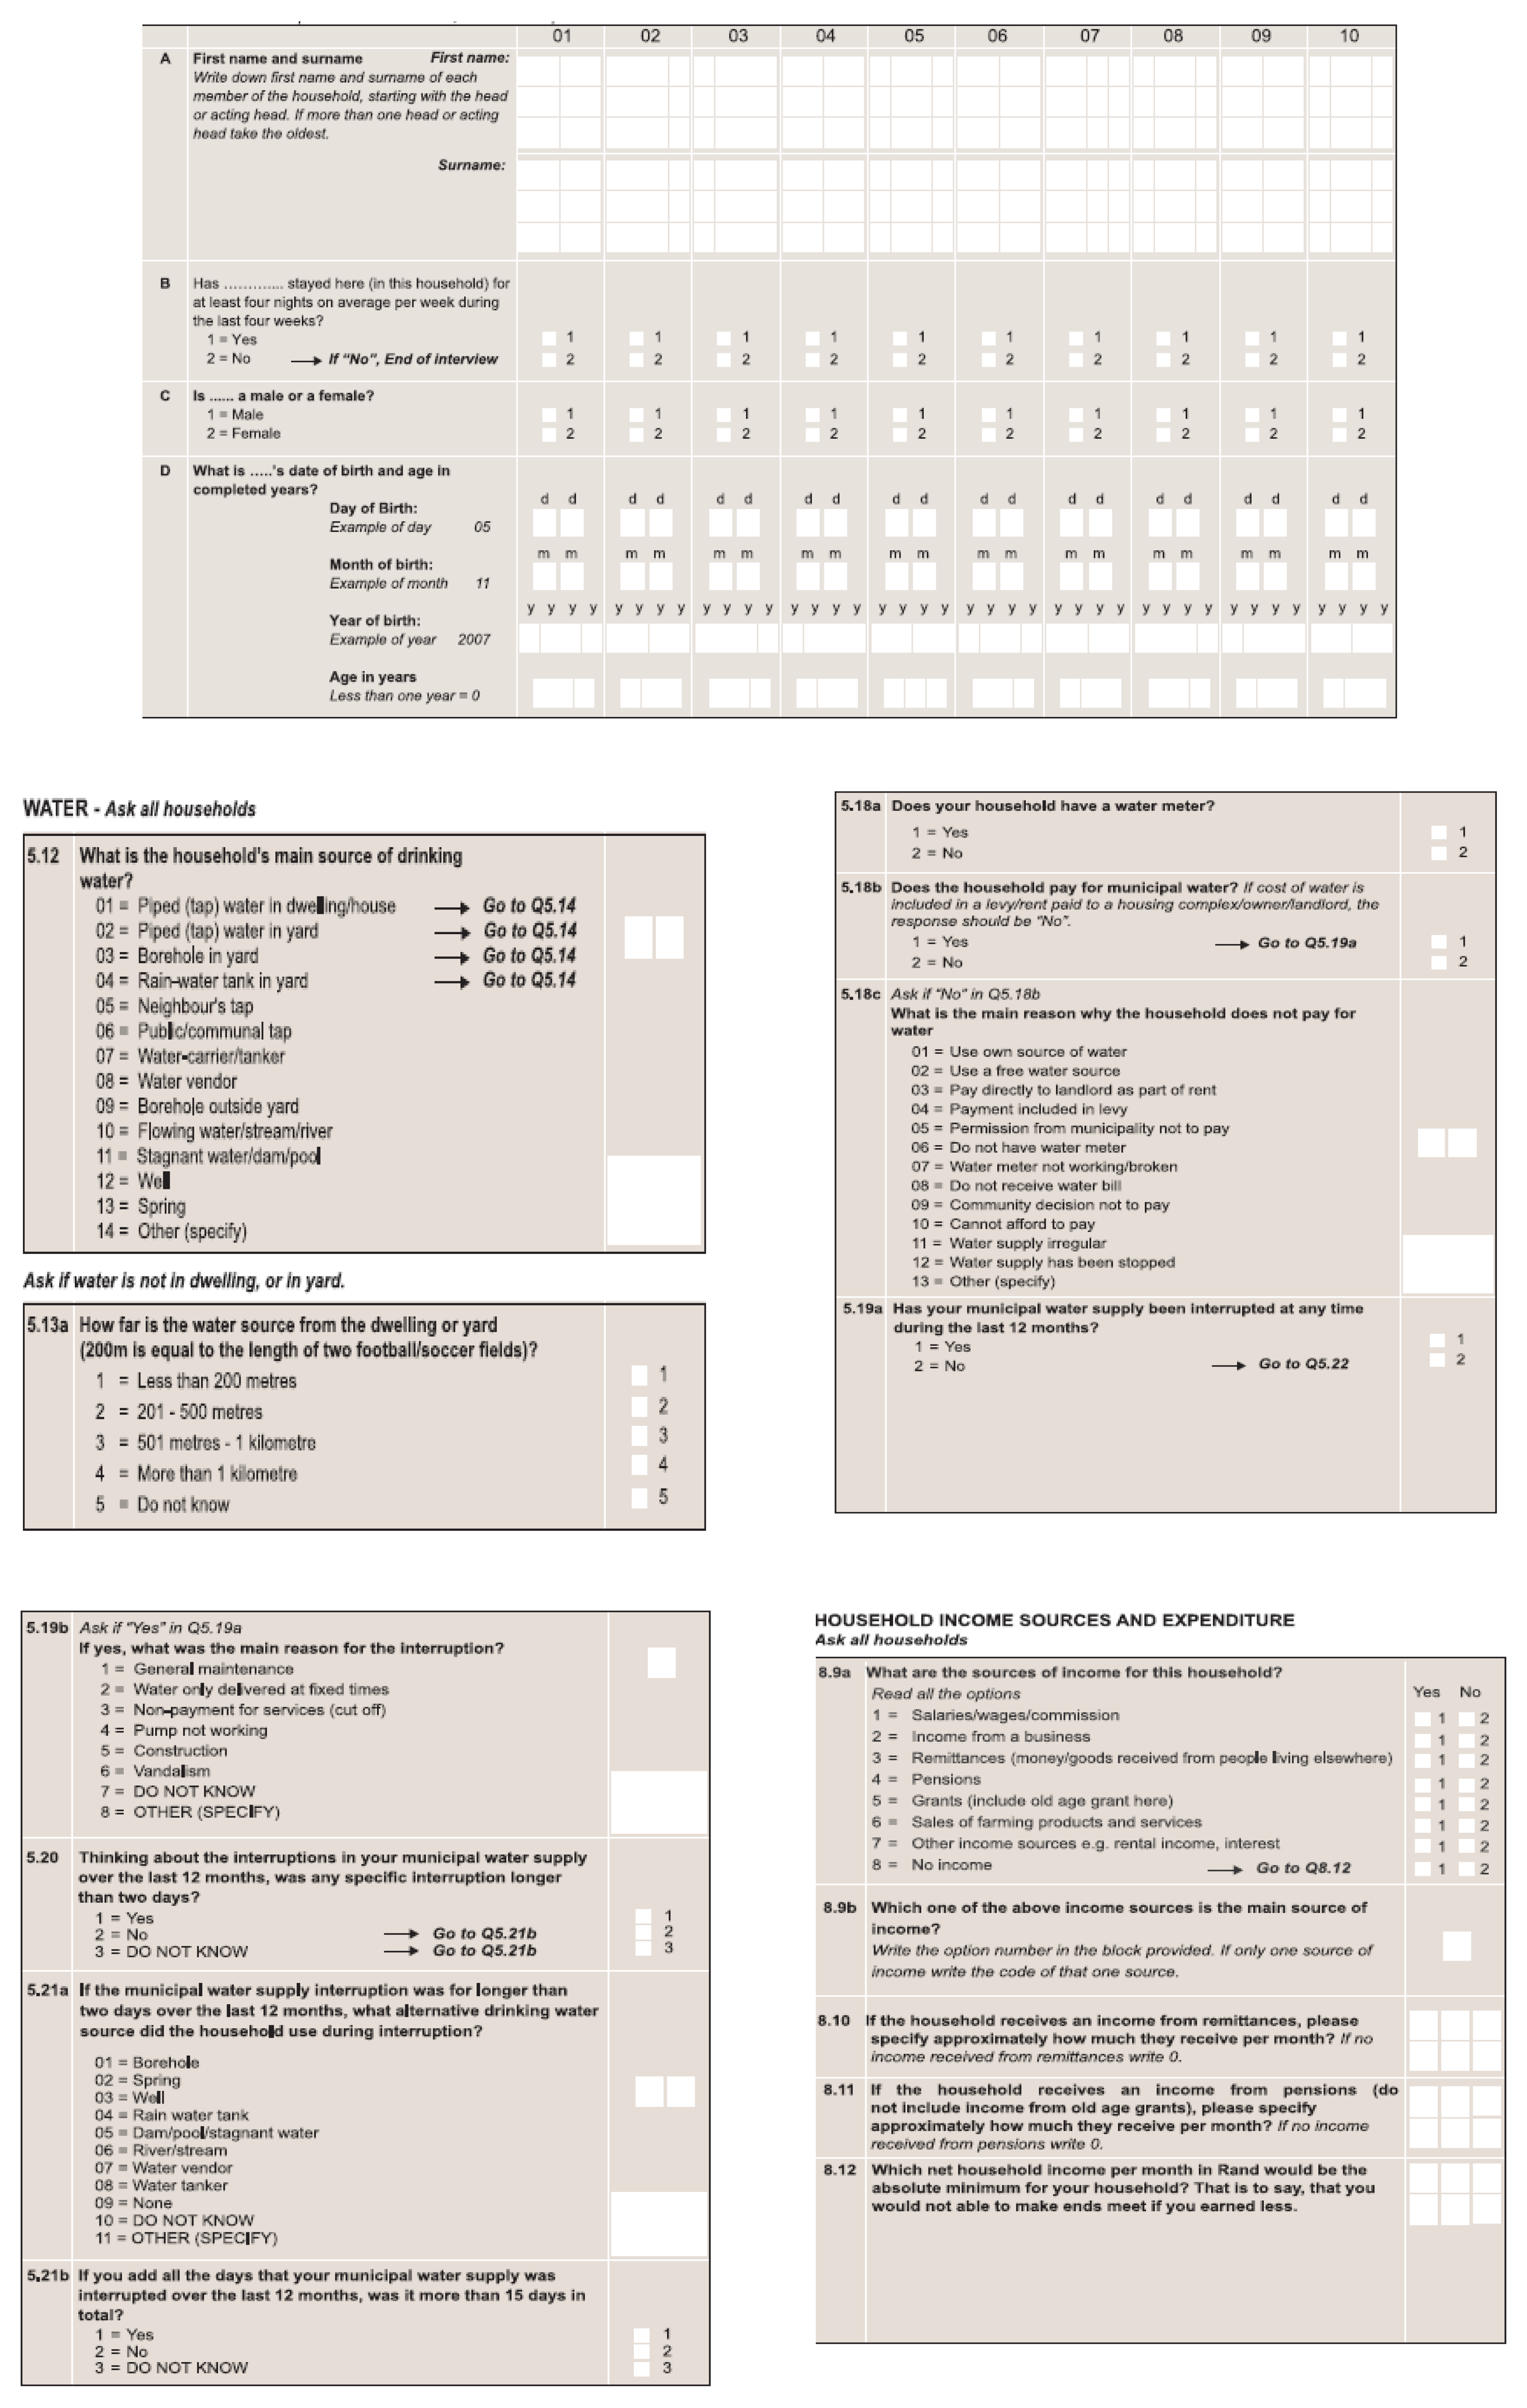
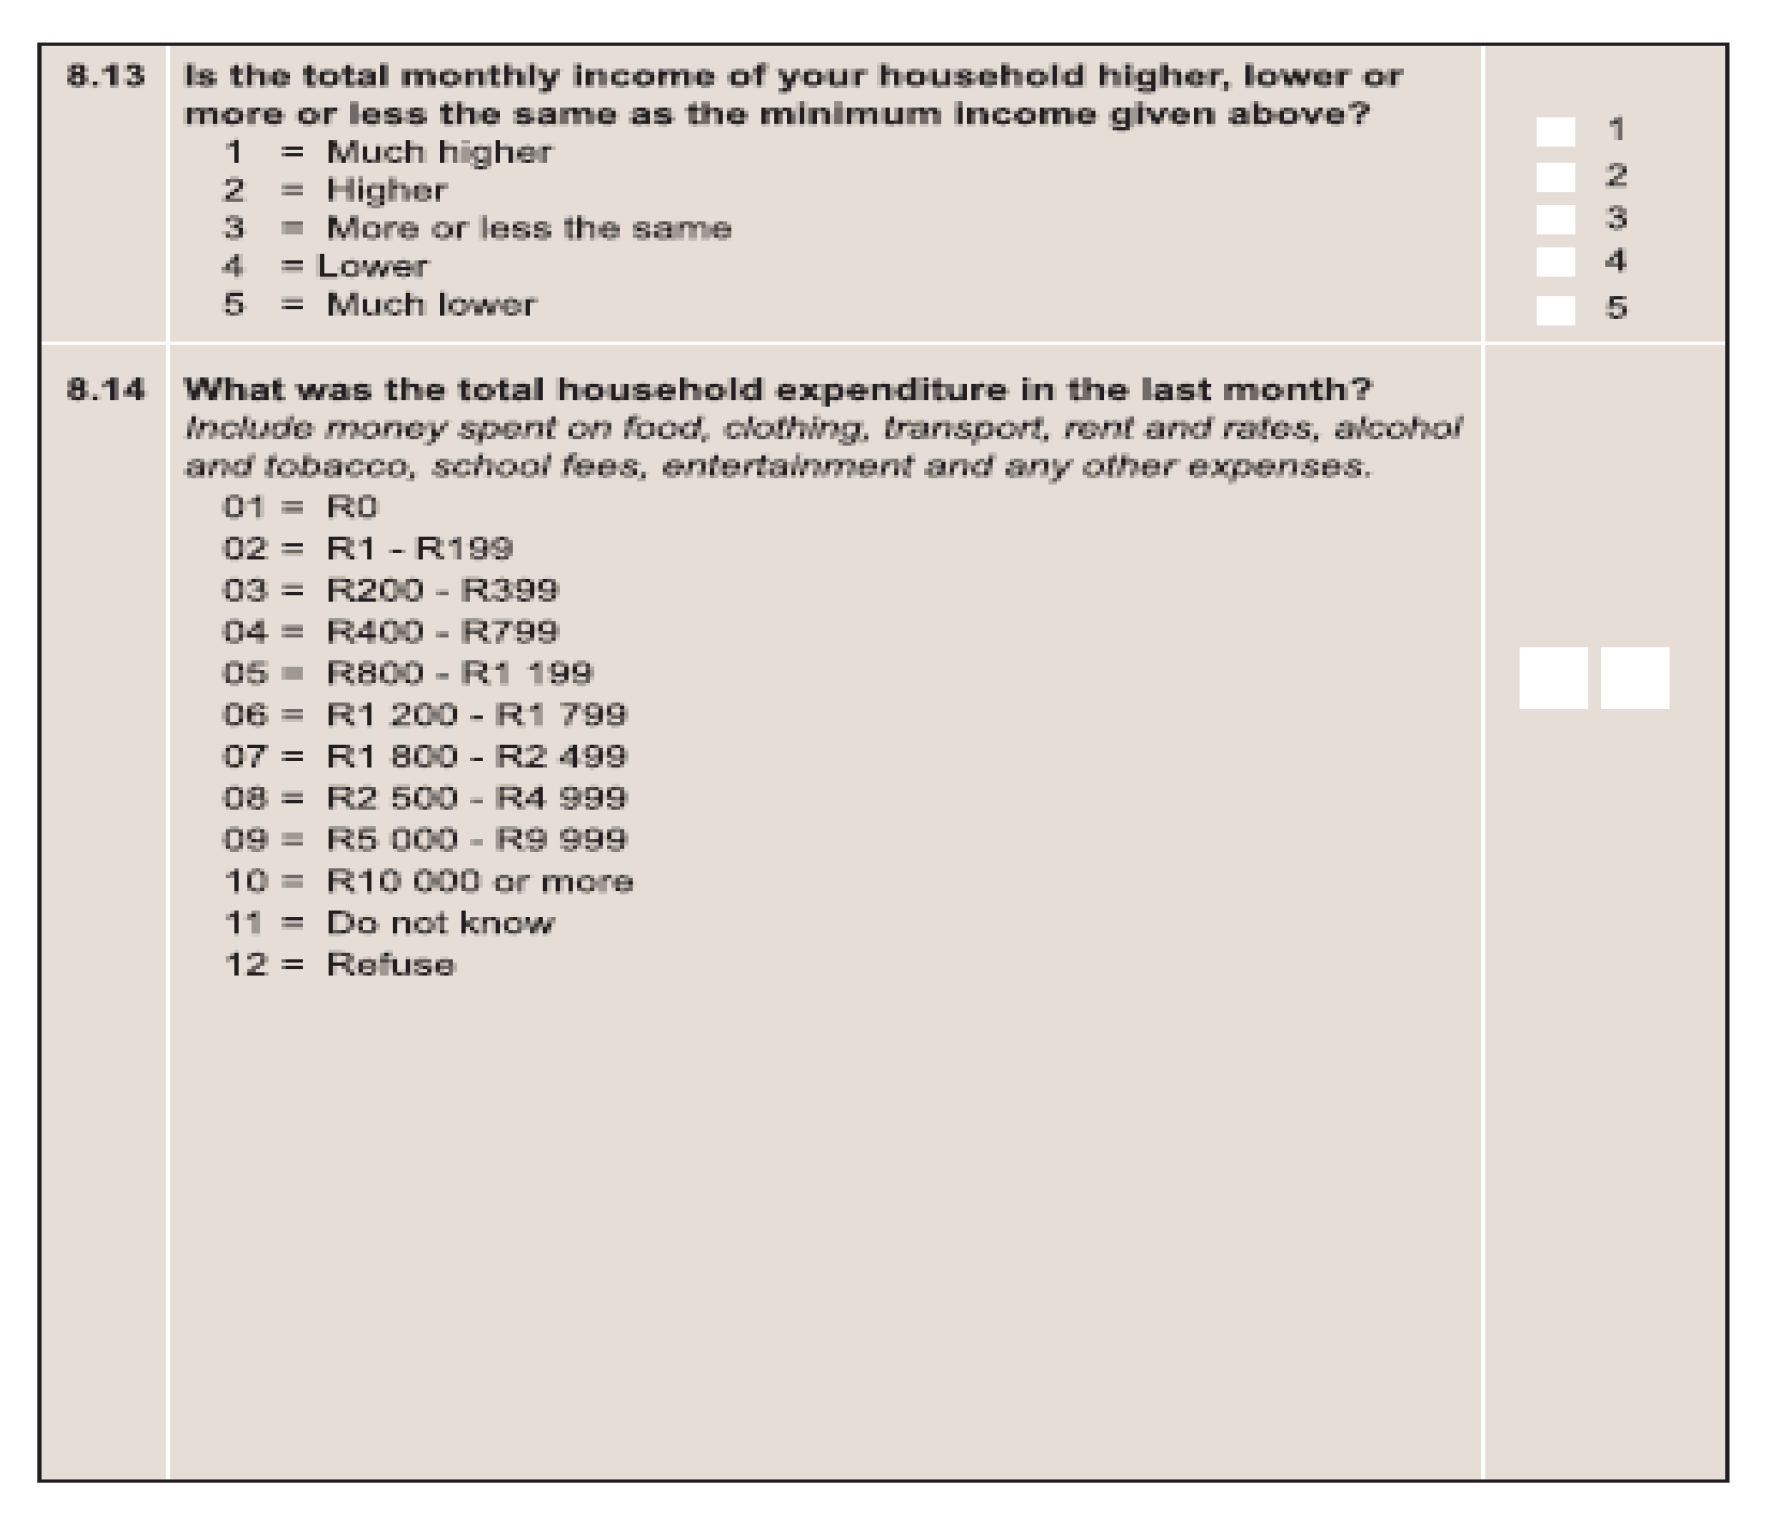
The study utilised secondary data that was collected by Statistics South Africa (StatsSA) in the 2016 General Household Survey (GHS) [41]. The GHS survey was cross sectional and the design was proportionally stratified, with first stage consisting of selection of primary sampling units (provincial and population attributes), whilst the second stage involved systematic sampling of dwelling units. Data from a total of 21,228 households was collected through questionnaires by 233 trained StatsSA survey officers from all 9 Provinces of South Africa. The data that was collected and used in the current study pertained to socio-economic characteristics and water related issues such as main source of water, water characteristics, water treatment and water supply interruptions [41] (Appendix A).
2.1. Sample Size and Location
From the GHS total sample size of 21,228, male respondents amounting to 12,207 were removed from the sample. After data cleaning, the remaining sample size was 5928 as indicated below (Table 1).
2.2. Analytical Framework
Structural Equation Modelling (SEM) was used to estimate the relationship between exposure, sensitivity and adaptive capacity to water insecurity for female headed households in South Africa. Prior to estimation of the structural model, the data was initially purified through Principal Component Analysis (PCA). Factors with low loadings (<0.3) and high cross loading (>0.3 with other factors) were excluded from subsequent analysis to guarantee convergence and discriminant validity. PCA transforms a set of complex set of relations to a simple canonical form, with the purpose of economising on the number of variables [42]. Cronbach’s alpha was used to test for factor reliability. After the PCA, a SEM was conducted with the factors identified in the PCA acting as latent variables. SEM analyses interrelationships among latent as well as manifest variables [43]. The model is defined by the following system of three equations in matrix terms:
where η is an m × 1 random vector of endogenous latent variables; ξ is an n × 1 random vector of exogenous latent variables; B is an m × n matrix of coefficients of the η variables in the structural model; Γ is an m × n matrix of coefficients of the ξ variables in the structural model; ς is an m × 1 vector of equation errors (random disturbances) in the structural model; x is a q × 1 vector of predictors or exogenous variables; is a q × n matrix of coefficients of the regression of x on ξ δ is a q × 1 vector of measurement errors in x; y is a p × 1 vector of endogenous variables; is a p × m matrix of coefficients of the regression of y on η; ε is a p × 1 vector of measurement errors in y.
In evaluating fit of the model, the Goodness-of-fit Index (GFI), Root Mean Square Error of Approximation (RMSEA), the Standardised Root Mean Square Residual (SRMR), the Comparative Fit Index (CFI) and the Coefficient of Determination (CD) were used. The CFI should be above 0.90, whilst the RMSEA and SRMR must be below 0.08 for an acceptable fit of the measurement model [43].
3. Results and Discussions
3.1. Descriptive Results
Table 2 shows that the average age of the household head in female headed households in South Africa is 51, with average household sizes of 4. Household size is peculiar in that there is an inverse relationship between obtaining safe water and the household size. These were findings by Dungumaro [21] in the 2003 GHS in South Africa. This was explained through the linkages between household size and poverty. The larger the household, the more income is spread, and thus the higher the poverty levels. This increases propensity to obtain and depend on unsafe water sources [21]. Net household income for female headed households is R7058, whilst for those that obtain a salary, the average monthly salary is R4067. Income strongly predicts availability of water. Dungumaro [21] found that households with no income are five times less likely to have safe water.
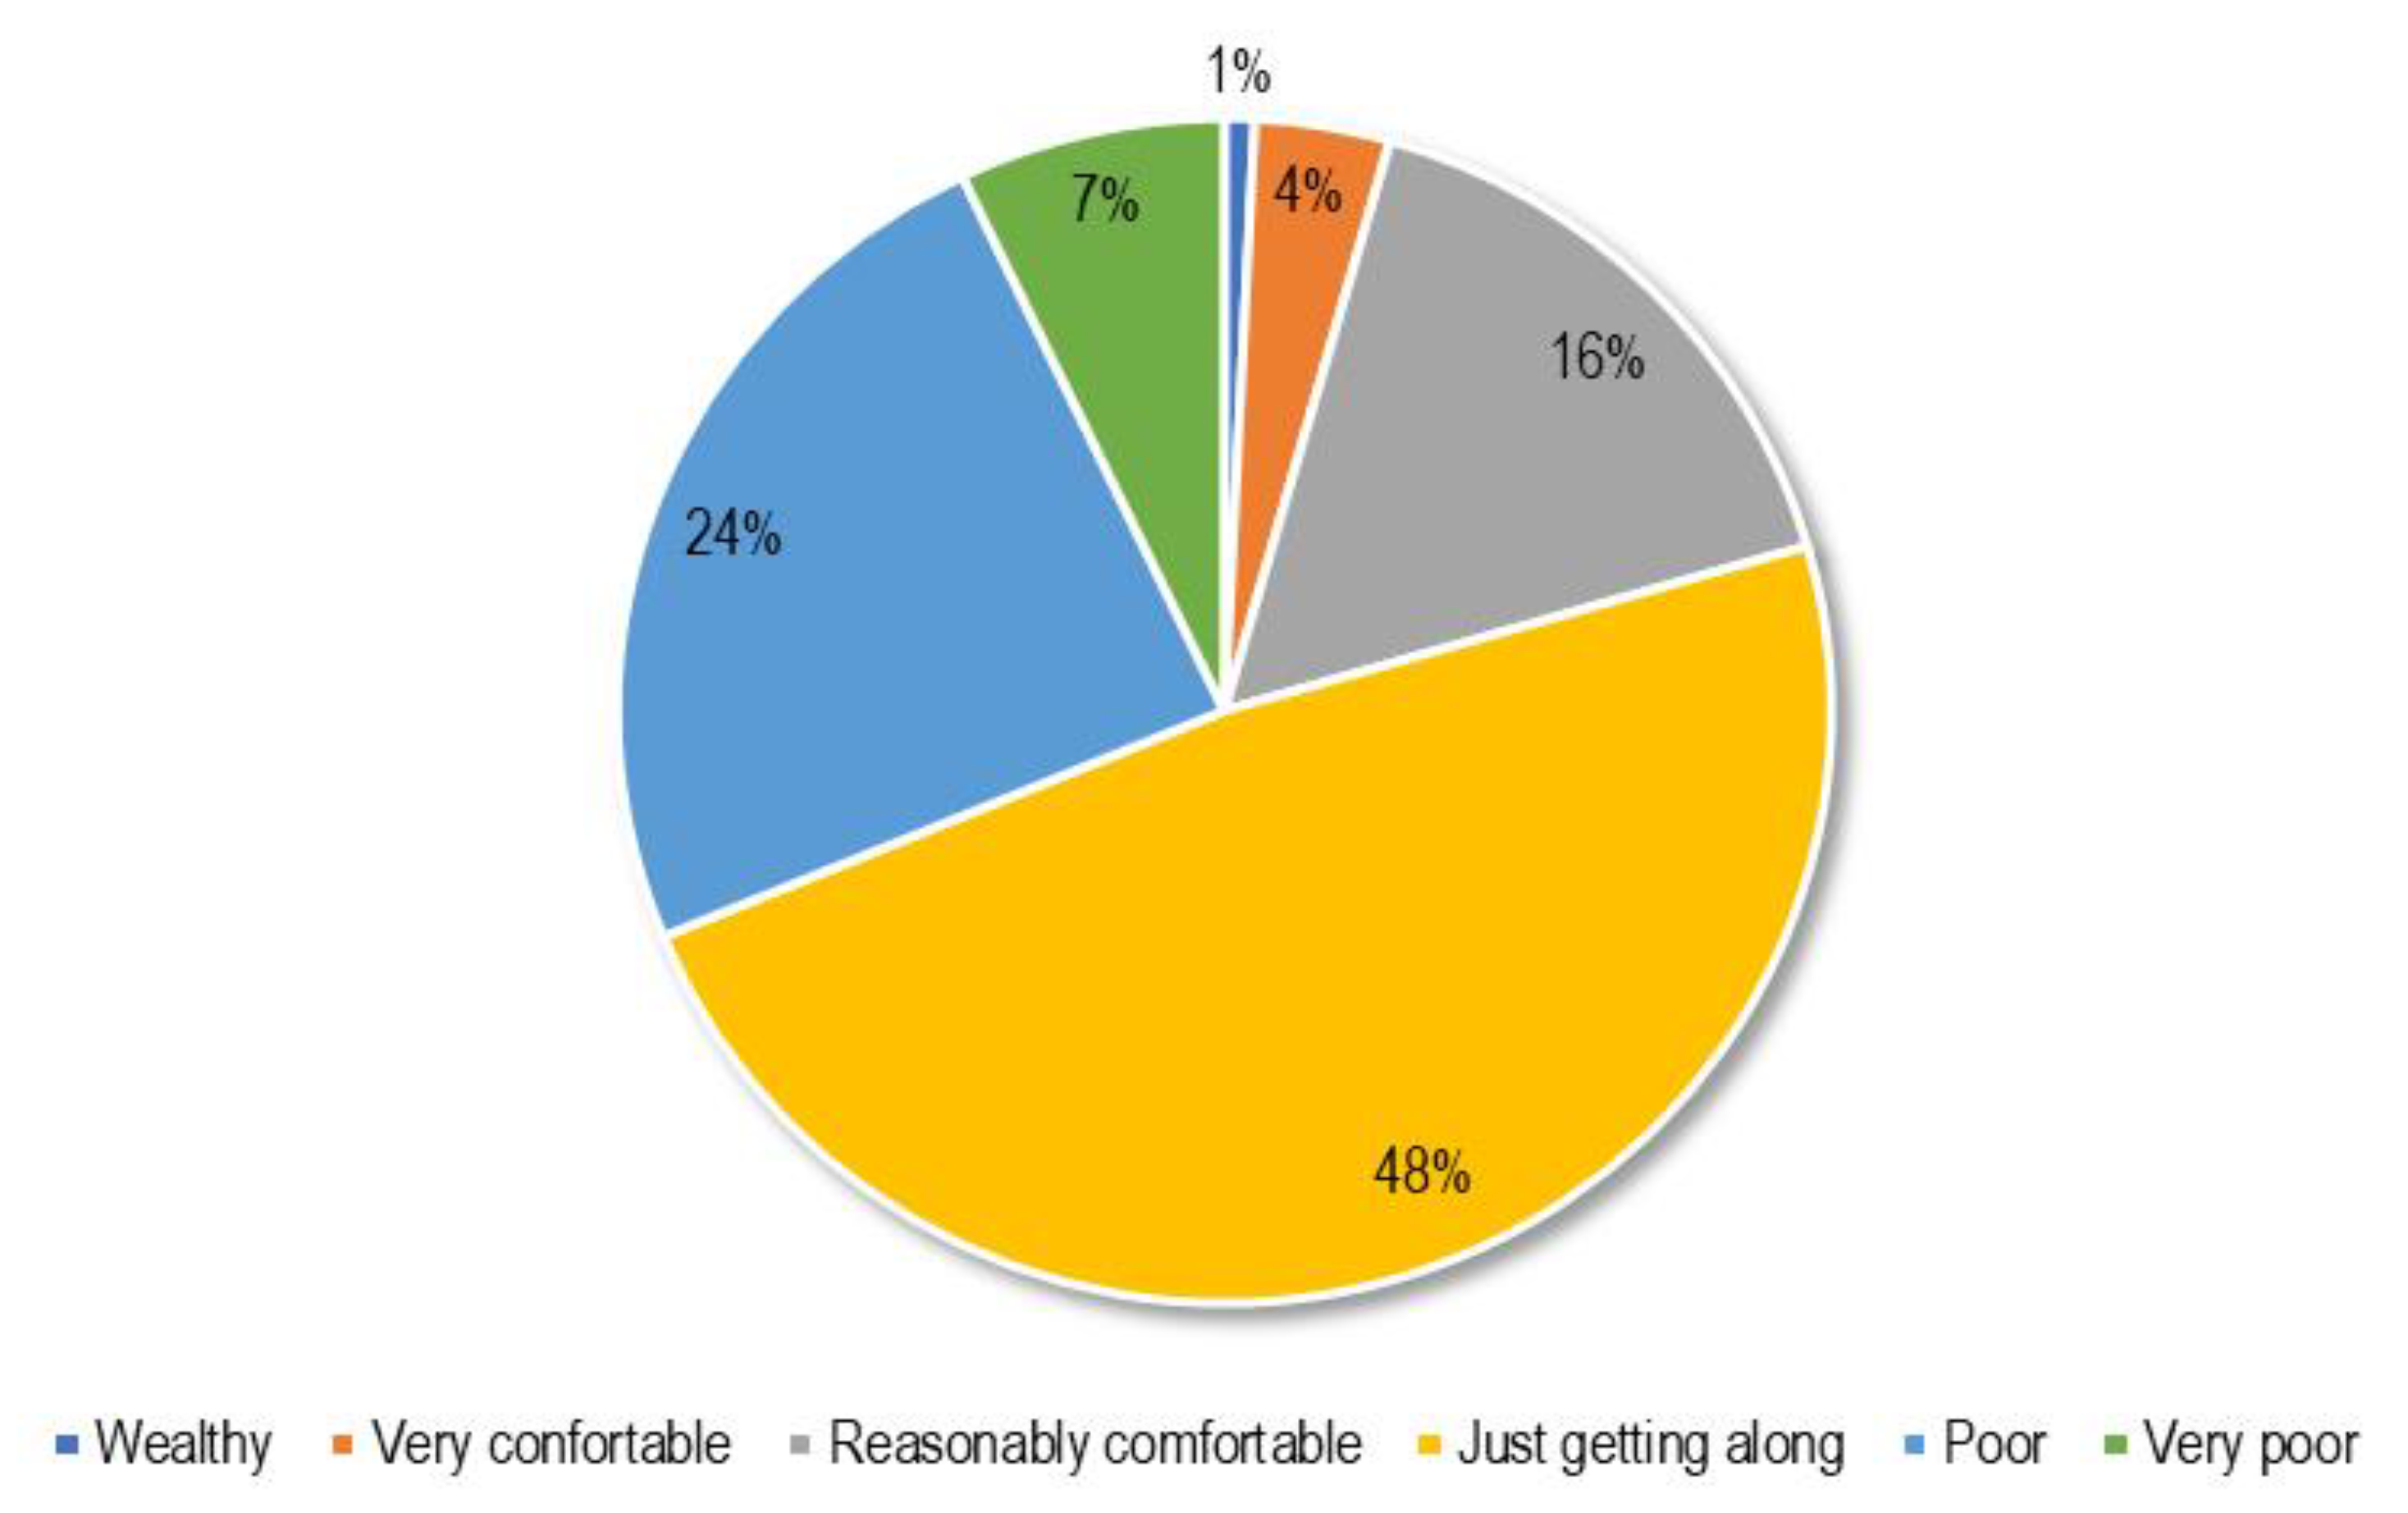
Figure 3 shows the wealth status of female-headed households in South Africa. It is shown that 79% (i.e., 7% + 24% + 48%) of the households are very poor to just getting along, whilst 21% are reasonably comfortable to wealthy. Dungumaro [21] found that 21% of households in the 2003 GHS were classified as rich and they tended to use safe drinking water sources, relative to those who were poor.
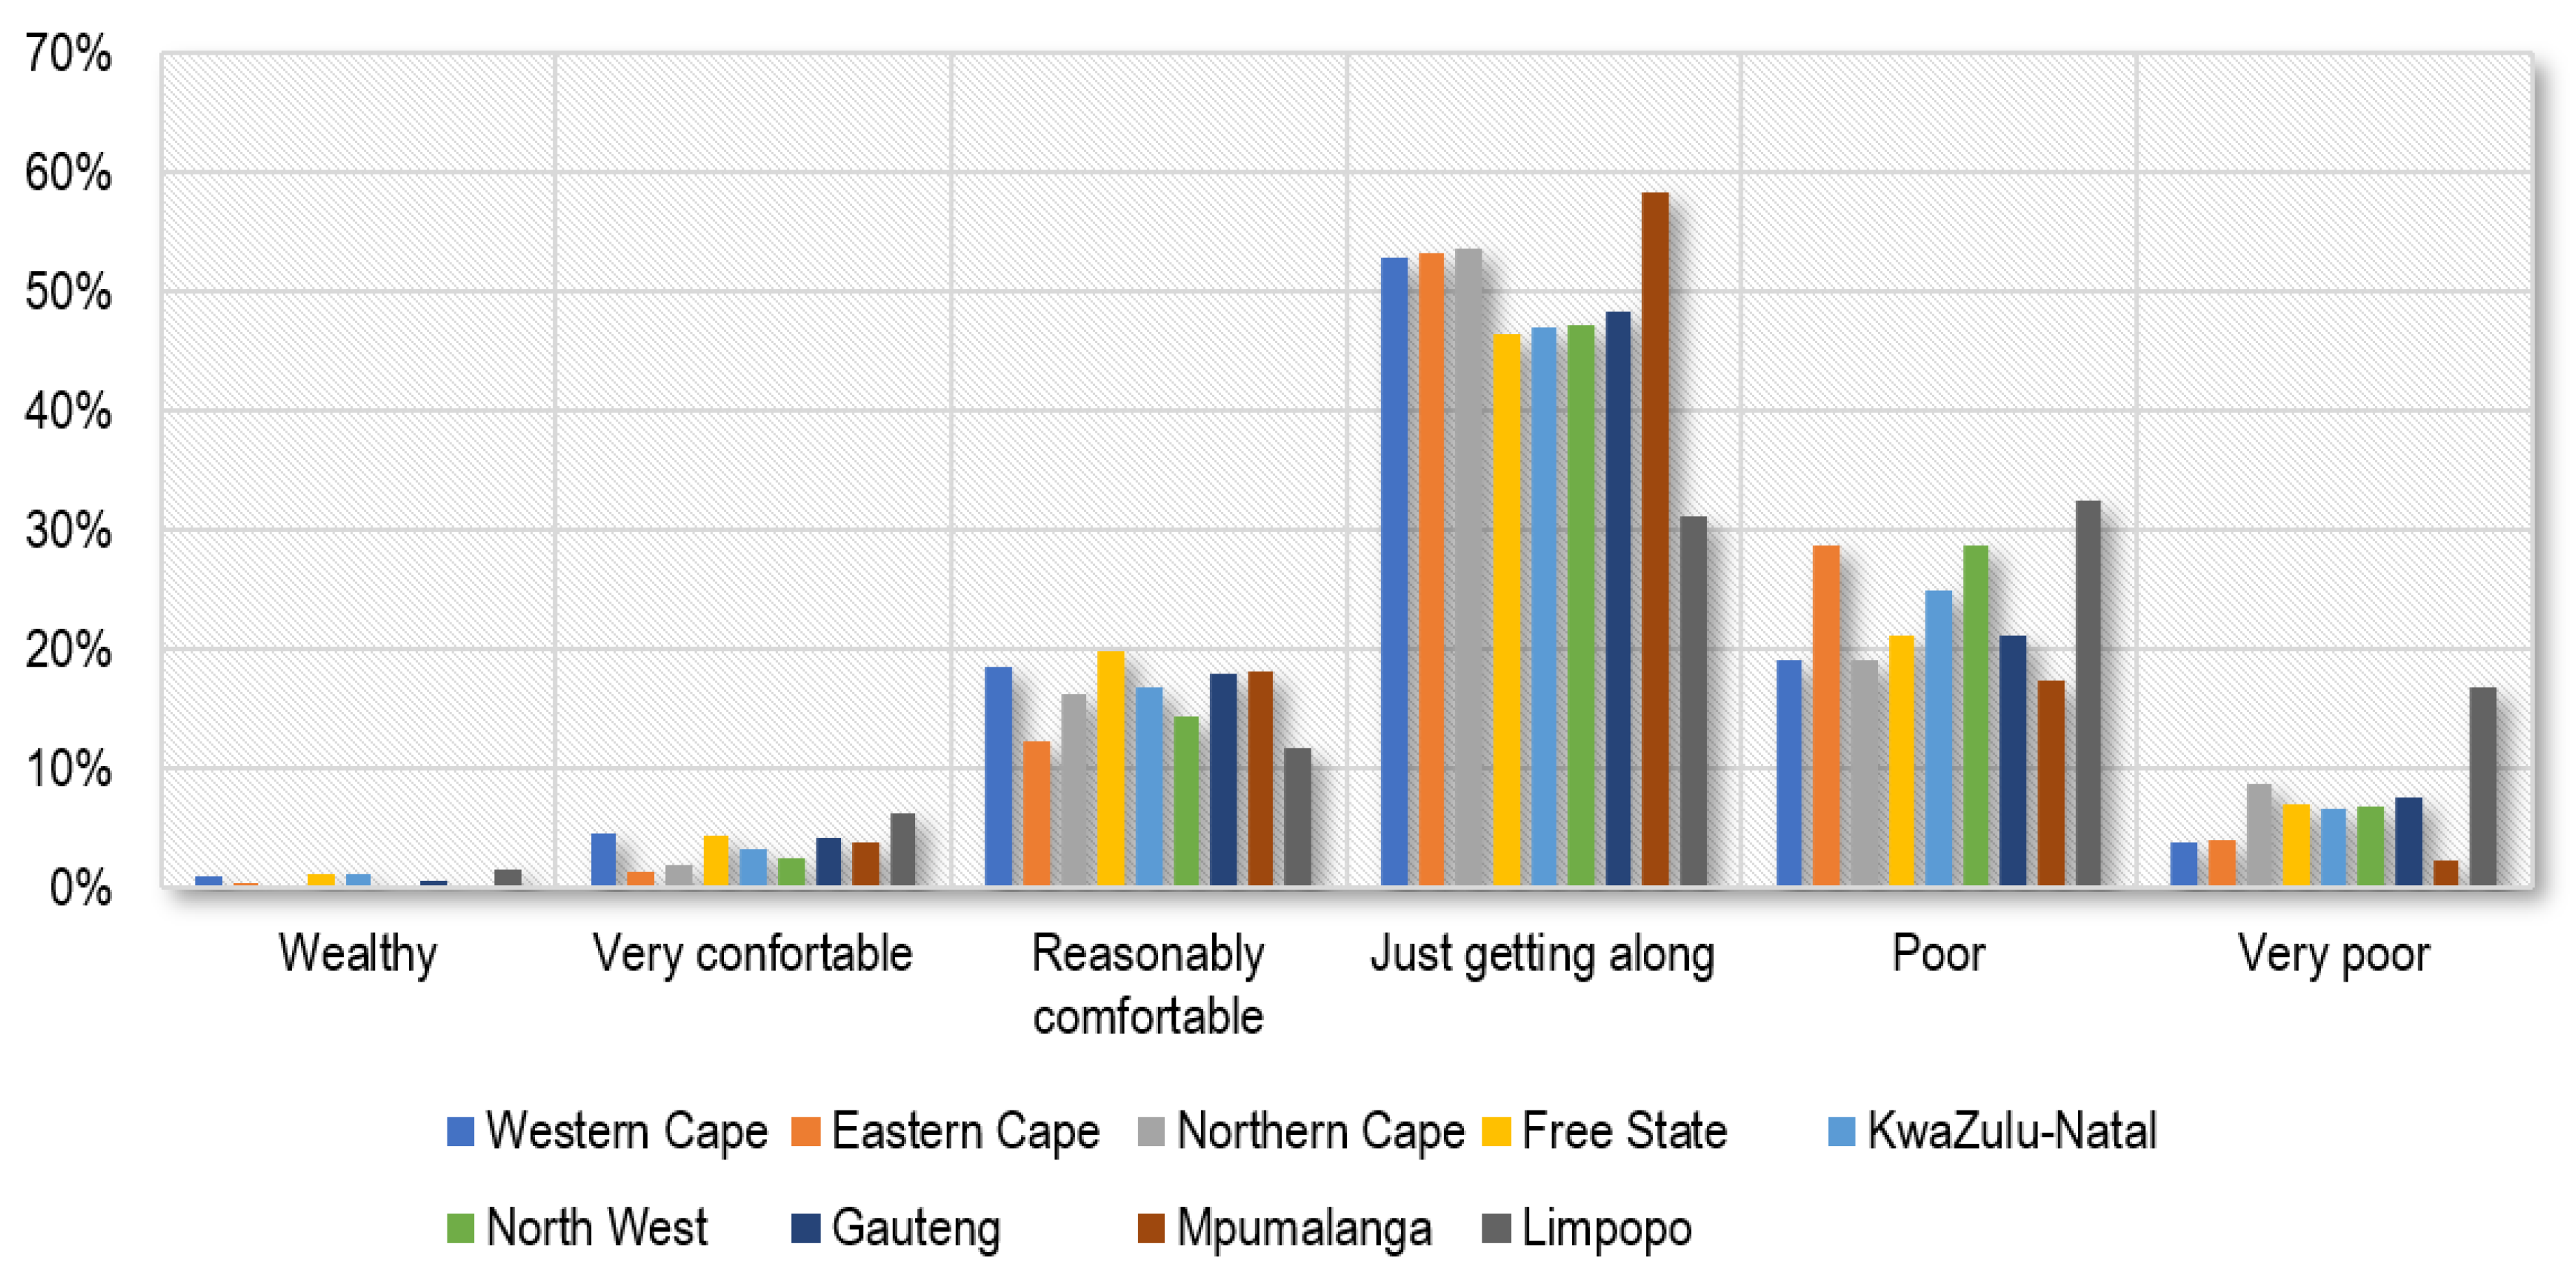
The wealth status per province as shown in Figure 4 indicates that Eastern Cape Province has the largest number of female headed households (86.0%) who are very poor to just getting by, followed by North West (82.8%). The Free State and Western Cape Provinces had the highest number of female headed households who were reasonably comfortable and wealthy at 25.3% and 24.2%, respectively. The Eastern Cape as well as North West have been characterised with the highest unemployment rate in South Africa, which has been steadily declining in Gauteng [44]. Women have been discriminated against in the labour market, and are more likely to be poorly remunerated, if not totally unemployed [45]. Furthermore, women dominate in the informal sector, where labour is more casual without benefits [45].
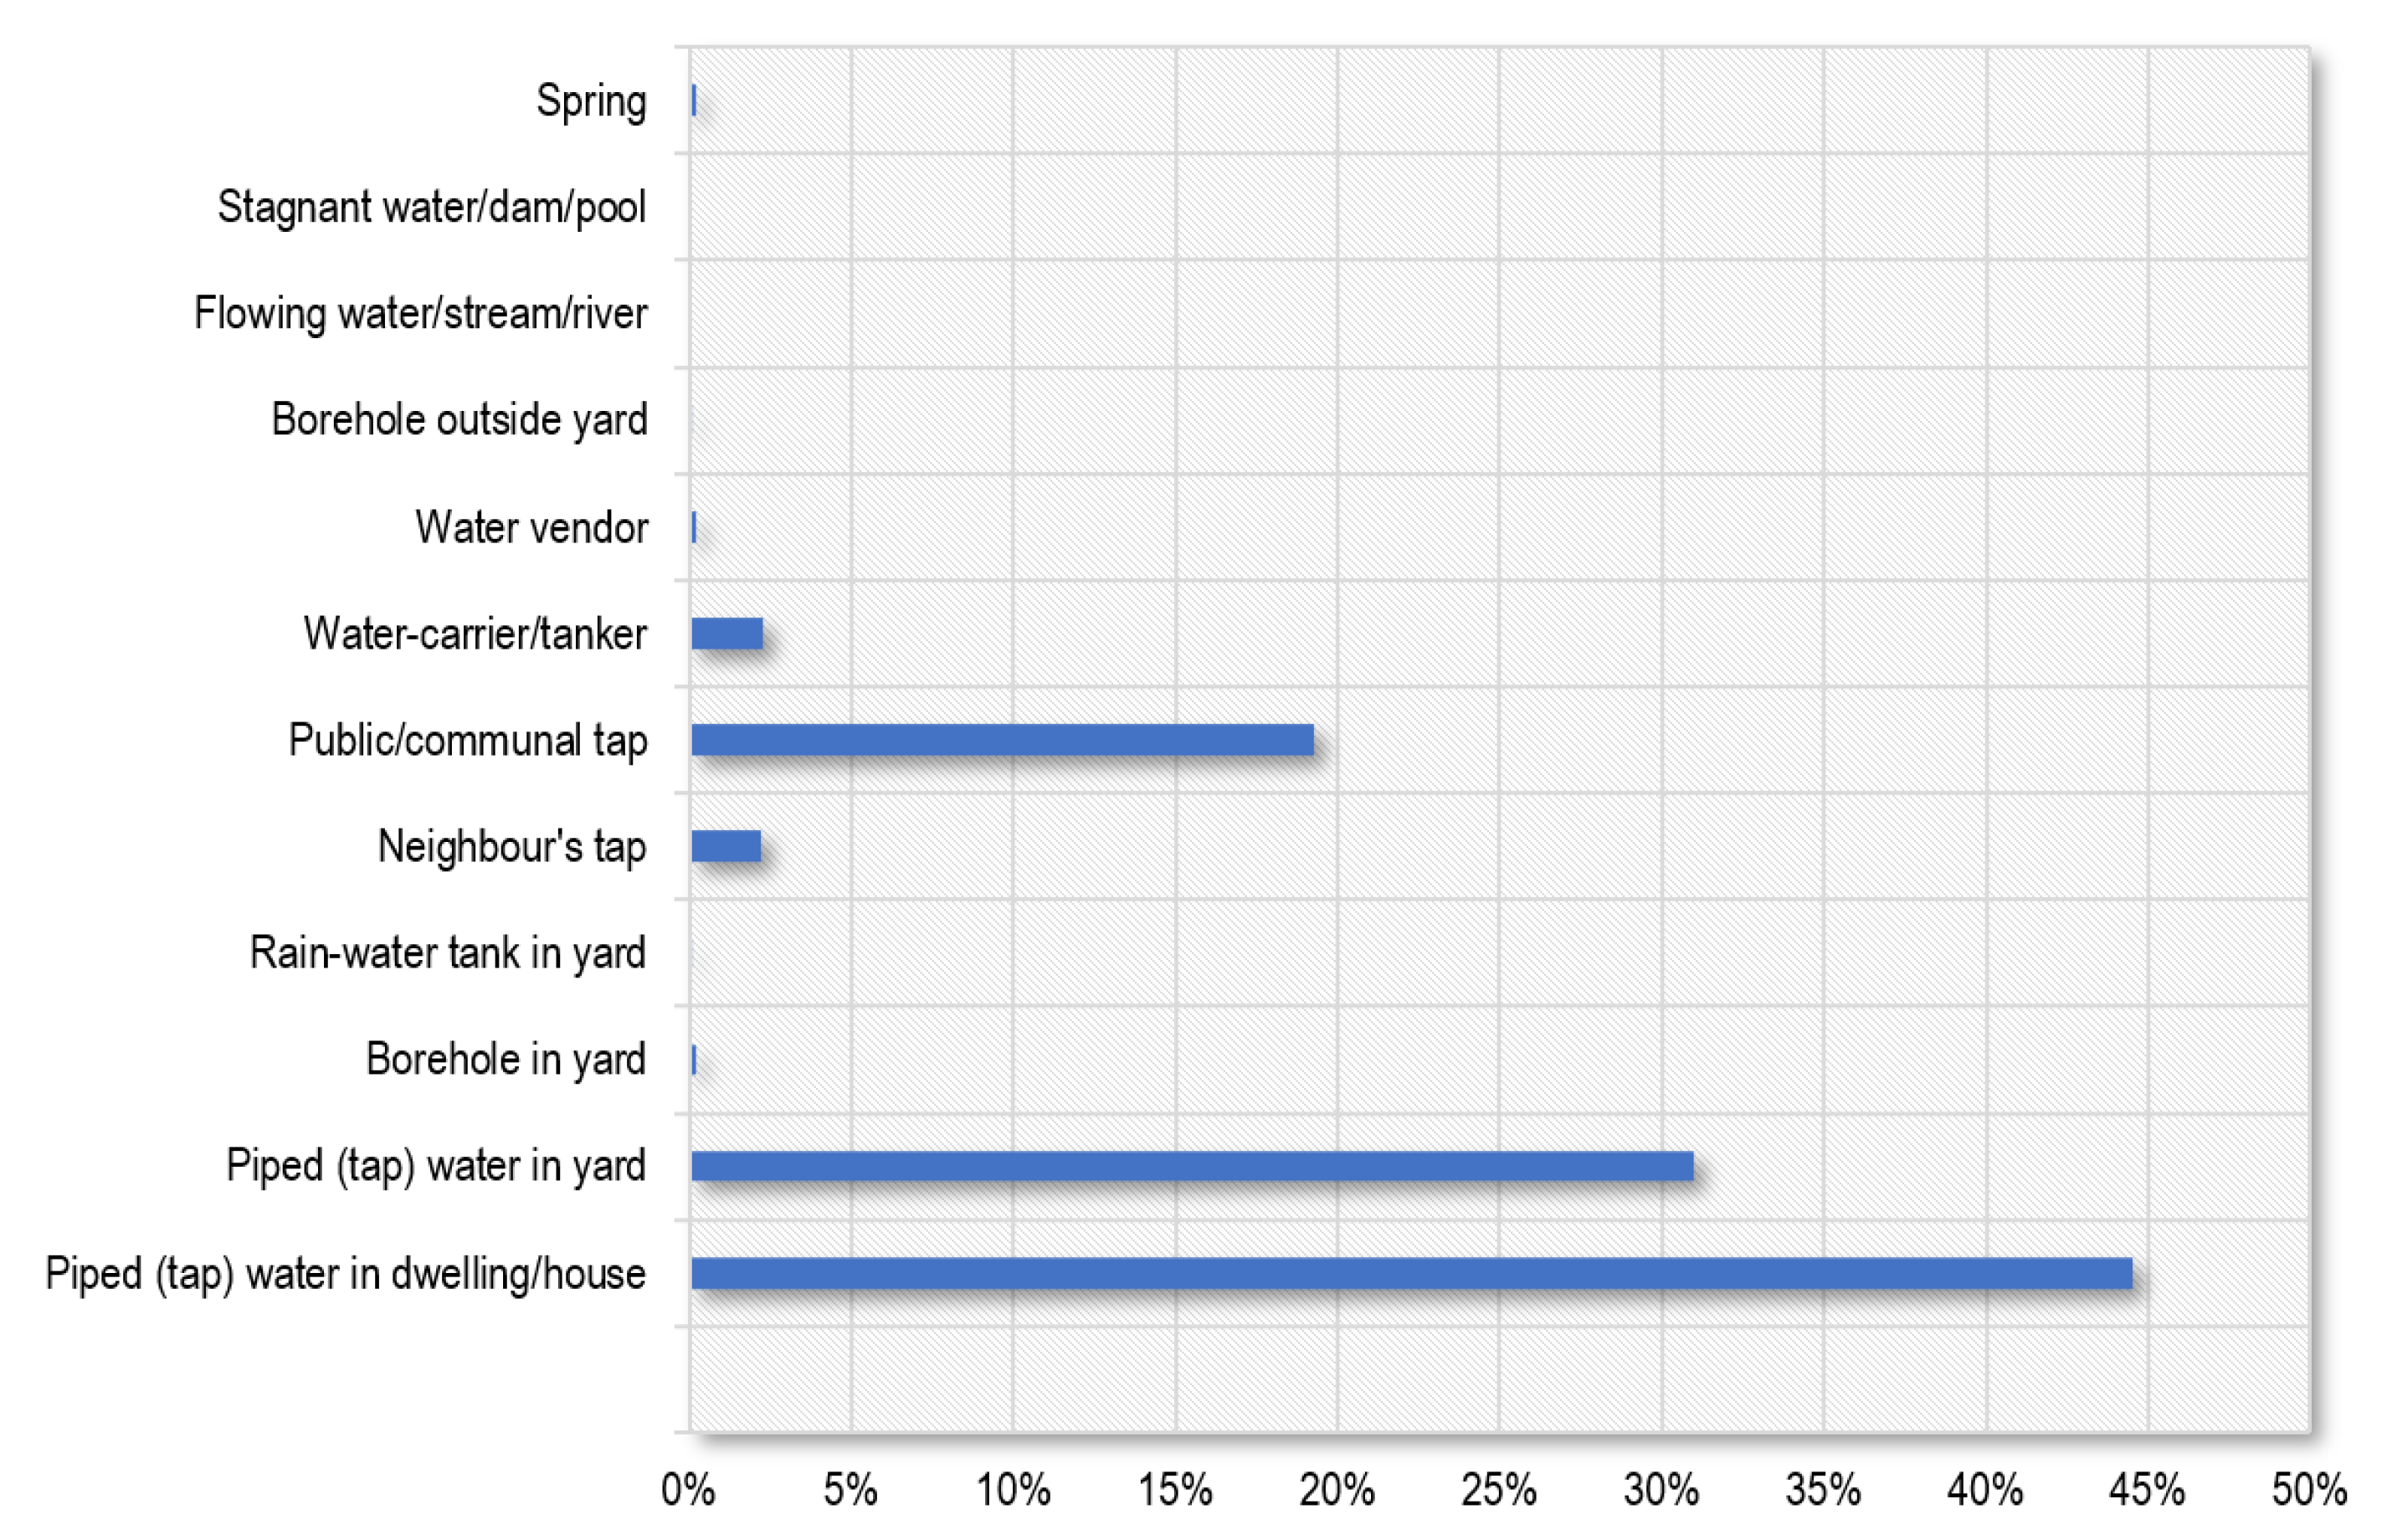
Figure 5 shows that the main water supply for female headed households in the country is piped (tap) water inside the house (44.5%), followed by piped water in the yard (31.0%). Public/communal tap, water carrier/tanker and neighbours’ water were the main sources of water for 19.3%, 2.3% and 2.2% of the female headed households, respectively. There were no female-headed households that had stagnant water or river water as a main source of water. These findings are contrary to Dungumaro [21] who identified that in the 2003 GHS there were households that were utilising stagnant or river water, especially those that were less wealthy as identified by their dwelling units. There are three possibilities to the differences in the results: (i) the wealth status has improved from the earlier GHS allowing for better access to improved water sources, (iii) there has been extensive infrastructural improvement allowing for access to improved water source, or (iii) the gender differences between the household heads has induced differences in accessing improved water sources.
3.2. Empirical Results
Table 3 shows the PCA results for exposure to water insecurity for female headed households in South Africa. Three factors were obtained from the PCA (with a cumulative variance of 68.3%), namely water characteristics, water access and household age, based on the loading of each factor. The KMO test, which was more than 0.7 highlighted that the data was suited for a PCA, whereas the significant Bartlett’s test of sphericity shows that the correlation is not an identity matrix, and there is possibility of dimension reduction.
The water characteristics such as taste of water and its colour had the highest loadings, whereas the main source of water and household age had the highest loadings for water access and household age respectively. In a study in Ghana, Kulinkina et al. [46] found that water demand was driven by “perceived aesthetic quality” concerning the taste and smell of water. The study identified that unfavourable taste and smell acted as deterrents to drinking water. These were similar findings in Zimbabwe [47]. Hence, water characteristics tend to expose households to water insecurity. According to Barde [48] an improved source of water can reflect improved access to water. Furthermore, compromised water sources due to malfunctions, population growth, pollution or droughts can expose households to water insecurity. According to Truelove [49] age shapes the means of acquiring water as well as its distribution. It indicates wisdom and experience in handling water conflicts and challenges, having influence on exposures to water security. Furthermore, age of household head exposes female headed households due to less functionality as women get older. Women are mainly responsible for water security for households in SSA [5]. However, this is dependent on the household composition of the female-headed households. On another note, Madrigal-Ballestero et al. [50] indicated that due to historical pathways, older people have witnessed improved water security in their lifetimes.
Table 4 shows the PCA results for sensitivity to water insecurity for female headed households in South Africa. Three factors were obtained from the PCA, namely assets, monthly income and water treatment, based on the loading of each factor. According to Naraya et al. [51], it is actually managing assets that matters to poor people relative to income. This is in recognition that assets can cushion households against crises, provide protection, and livelihood adaptation. This is compounded by the “gender-asset gap” especially for women in patriarchal and legal institutions characterising developing countries [52,53]. Assets tend to reduce sensitivity to water insecurity, relative to their liquidity to meet quick cash needs to improve water access. In a study in Lesotho, Workman and Ureksoy [29] found high and significant correlation between ownership of assets and the amount of water usage. The study also found that the water insecurity distress increased with the fewer the number of assets. It was identified that financial capital was not important in determining water insecurity, but rather the physical assets.
Low treatment of water results in vulnerabilities to water insecurity [54]. This is through increasing the household sensitivity to water insecurity. Water treatment tends to reduce water related health risks. It cannot however be consistently applied every day, especially at household or community level, hence having an effect on sensitivity of households to water insecurity [10,55].
Table 5 shows the PCA results for adaptive capacity to water insecurity for female headed households in South Africa. Five factors were obtained from the PCA, namely income and wealth status; salary and remittances; pensions; business; and farming income, based on the loading of each factor. According to Sun et al. [56], there is bi-directional linkages between water insecurity and poverty levels. Poverty can be envisaged through household income. The access to improved levels of income and wealth status will tend to inform the adaptive capacities of households to water insecurity. As shown in Table 5, total and net household income had the highest loadings on the income and wealth status factor. Source of income is also equally important in determining the household income. This is significant for female-headed household, who due to their social exclusion can have compromised sources of income. As shown from Table 5, female-headed households with salaries had a higher loading on the salary and remittance factor, with other identified income source factors being pensions, business and farming income. Water insecurity manifests in households spending more income, time and other resources in achieving their basic water demand [56]. Access to improved sources and quantity of income will tend to circumvent water in-access and thus act as adaptive strategies to water insecurity.
Figure 6 shows the SEM for vulnerability to water insecurity in South Africa. The overall fit of the SEM was within the suggested thresholds with GFI = 0.995, RMSEA = 0.079, SRMR = 0.053, CFI = 0.885, TLI = 0.854 and CD = 0.995. The parameters estimated were used in further analysis. There is significant association between water characteristics and water treatment for female-headed households in South Africa. Water characteristics such as good in taste, clean and safe to drink had the highest loadings in the exposure to water insecurity as shown in Table 3, whilst water treatment had the highest loadings for water treatment in sensitivity to water insecurity (Table 4). Water treatment tends to improve the safety, taste and colour of water. Association between loadings of water insecurity exposure and sensitivity is thus established.
Figure 6 also shows that there is significant association between water access as a construct in exposure to water insecurity and wealth status which improves the adaptive capacity to water insecurity (Appendix B). Appendix C shows the correlations between the observed variables. The wealthier the households, the less water insecure they would be [21,56]. Main source of drinking water and household expenditure had the highest loading on access to water for exposure to water insecurity (Table 3), whilst the total household income had the highest loading on the wealth status for adaptation to water insecurity. The more total income the household has the more the household will access piped, clean and safe water into their houses [21]. Therefore, association between water insecurity exposure and adaptive capacity is also established.
There is also significant association between water treatment and water access, as well as water treatment and wealth status. One of the loading on water access was water interruptions. Water treatment becomes significant in the event of water interruptions when households vie for alternative, unclean and unsafe water sources to satisfy household needs. This can be enhanced by the wealth status of the household, allowing for purchase of water treatment equipment at the household level. Various associations between exposure, sensitivity and adaptive capacity to water security are thus established.
4. Conclusions and Recommendations
Gender equality and women empowerment is a key driver in ending hunger and poverty as well as improving water security. Women and girls are the primary providers, users and managers of water in the households [6]. Women are vulnerable through exposure, sensitivity and adaptive capacities to water insecurity. However, few studies have quantified the vulnerabilities and burdens of water insecurity on women. Most studies have utilised vulnerability assessments in climate change studies, through quantification of exposures, sensitivities and adaptive capacities. However, these have taken a linear form, neglecting the dynamism and pathways between these constructs of vulnerability. The objective of the study was to identify and provide pathways through which female-headed households were water insecure in South Africa. The study was innovative at two fronts: (i) adopting a vulnerability construct utilised in climate change studies and assessing water insecurity, and (ii) adopting a dynamic model showing pathways relative to a linear model which is typical of vulnerability assessments. This was established through non-convectional vulnerability measures looking at dynamic relationships between the constructs. Principal Component Analysis (PCA) as well as Structural Equation Modelling (SEM) was utilised to provide the pathways through which 5928 female-headed households were water insecure. The PCA results indicated that:
- (a)
- water characteristics, water access and household head age were the extracted factors for exposures to water insecurity;
- (b)
- assets, monthly income and water treatment were the extracted factors for water insecurity sensitivities; and
- (c)
- income and wealth status, salary and emittances, pensions, business as well as farm income were the extracted factors in the water insecurity adaptive capacity.
The PSM identified significant interrelationships in water insecurity from four attributes, namely the water characteristics, water access, water treatment and the wealth status of the female headed households. These describe various degrees of exposure, sensitivity and adaptive capacity to water insecurity. The study concludes that there are various dynamic intricacies between exposures, sensitivity and adaptive capacity to water insecurity for female headed households in South Africa (Figure 7).
The study fits into the country’s water policy such as the National Water and Sanitation Master Plan (NWSMP) as well as the National Water Resource Strategy (NWRS2), especially in a decade of equity and redistribution [19,57,58]. This is in recognition that there has been little substantive progress in the National Water Act on equity towards redressing gender water allocation [19]. The NWRS2 has objectives of sustainable and equitable water use, development, conservation, management and control. Equity and redistribution will be achieved through water allocation reform as well as support for local economic development initiatives. This will focus on equity in access to water services, resources and benefits to make sure water is available to previously disadvantaged groups [19]. The NWSMP recognises that water will become expensive, with everyone having to utilise less water as well as pay for the water [24]. This will call into question the capabilities of discriminated groups such as women. The current study provides a reference point for the inclusion of women in the equity and redistribution agenda. In terms of practical option for solutions, policy makers are encouraged to be gender sensitive especially in the NWSMP and NWRS2, which tend to provoke equity discourse by rarely offers practical solutions or strategies.
The study identifies that in tackling water insecurity for female headed households in South Africa, a multi-prong approach is required looking at the exposures, sensitivities and adaptive capacities. Empowerment and poverty reduction amongst women will improve their adaptive capacity to water insecurity. This would require policy that increase women participation in the mainstream economy such that they improve their livelihoods through increasing their income generating abilities. Access to water treatment equipment will reduce the sensitivity of female headed households to water insecurity. In reducing the exposures to water insecurity, policy makers should prioritise improving infrastructure that delivers piped water into each household. This study follows a quantitative research approach, and it provided a limitation. However, water insecurity/scarcity/conservation is highly personal as well as context specific. Qualitative data could potentially add richness to the findings.
Author Contributions
Conceptualization, S.N.; methodology, S.N.; validation, S.N., L.Z. and N.M.; formal analysis, S.N.; writing—original draft preparation, S.N.; writing—review and editing, L.Z.; supervision, N.M.; project administration, S.N.
Funding
This research received no external funding.
Acknowledgments
The authors acknowledge the valuable comments from the anonymous reviewers.
Conflicts of Interest
The authors declare no conflict of interest.
Appendix A
Figure A1.
Questionnaire.


Appendix B

Table A1.
Correlations between the Latent and Observed Variables Used in the SEM.
| Measurement | Coefficient | Standard Error | P > |z| | |
|---|---|---|---|---|
| Water characteristics | Good in taste | 0.828 *** | 0.005 | 0.000 |
| Clean (has no colour, free from mud) | 0.820 *** | 0.006 | 0.000 | |
| Safe to drink | 0.823 *** | 0.005 | 0.000 | |
| Free from bad smells | 0.757 *** | 0.007 | 0.000 | |
| Water access | Main source of drinking water | 0.368 *** | 0.013 | 0.000 |
| Water supply interruption | −0.212 *** | 0.014 | 0.000 | |
| Household expenditure | 0.801 *** | 0.013 | 0.000 | |
| Wealth status | Total household income | 0.790 *** | 0.009 | 0.000 |
| Wealth status of household | 0.463 *** | 0.012 | 0.000 | |
| Net household income | 0.456 *** | 0.012 | 0.000 | |
| Grants | −0.368 *** | 0.123 | 0.000 | |
| Salaries, wages and commission | 0.463 *** | 0.012 | 0.000 | |
| Water treatment | Treatment of drinking water | 0.879 *** | 0.310 | 0.005 |
| Household size | −0.048 ** | 0.021 | 0.025 | |
| Covariance | ||||
| Water characteristics | Water access | −0.012 | 0.013 | 0.356 |
| Water treatment | −0.412 *** | 0.146 | 0.005 | |
| Water access | Wealth status | 0.913 *** | 0.016 | 0.000 |
| Water treatment | 0.108 *** | 0.039 | 0.005 | |
| Wealth status | Water treatment | 0.094 ** | 0.039 | 0.017 |
| Chi square (72) | 2705.08 *** | |||
Sig. at *** 1%, ** 5%.
Appendix C
Table A2.
Correlations between Observed Variables.
| Safe to Drink | Clean | Good in Taste | Free from Bad Smell | Main Source of Income | Water Supply Interruption | Household Expenditure | Treatment of Drinking Water | Household Size | Total Household Income | Net Household Income | Grants | Salaries Wages Commission | Wealth Status | |
|---|---|---|---|---|---|---|---|---|---|---|---|---|---|---|
| Safe to drink | 1.00 | |||||||||||||
| Clean | 0.66 | 1.00 | ||||||||||||
| (0.00) | ||||||||||||||
| Good in taste | 0.69 | 0.68 | 1.00 | |||||||||||
| (0.00) | (0.00) | |||||||||||||
| Free from bad smell | 0.63 | 0.64 | 0.61 | 1.00 | ||||||||||
| (0.00) | (0.00) | (0.00) | ||||||||||||
| Main source of income | −0.02 | −0.03 | 0.006 | −0.006 | 1.00 | |||||||||
| (0.22) | (0.03) | (0.65) | (0.62) | |||||||||||
| Water supply interruption | −0.07 | −0.07 | −0.1 | −0.05 | −0.28 | 1.00 | ||||||||
| (0.00) | (0.00) | (0.00) | (0.00) | (0.00) | ||||||||||
| Household expenditure | −0.02 | −0.02 | −0.0003 | −0.02 | 0.37 | −0.17 | 1.00 | |||||||
| (0.1) | (0.13) | (0.96) | (0.24) | (0.00) | (0.00) | |||||||||
| Treatment of drinking water | −0.32 | −0.3 | −0.3 | −0.25 | 0.06 | 0.02 | 0.07 | 1.00 | ||||||
| (0.00) | (0.00) | (0.00) | (0.00) | (0.00) | (0.12) | (0.00) | ||||||||
| Household size | 0.02 | 0.02 | 0.02 | 0.03 | −0.06 | 0.11 | 0.08 | −0.04 | 1.00 | |||||
| (0.07) | (0.22) | (0.08) | (0.02) | (0.00) | (0.00) | (0.00) | (0.00) | |||||||
| Total household income | −0.01 | −0.002 | 0.01 | −0.003 | 0.28 | −0.07 | 0.7 | 0.05 | 0.13 | 1.00 | ||||
| (0.45) | (0.87) | (0.26) | (0.81) | (0.00) | (0.00) | (0.00) | (0.00) | (0.00) | ||||||
| Net household income | −0.03 | −0.02 | 0.01 | −0.04 | 0.26 | −0.12 | 0.52 | 0.05 | 0.05 | 0.45 | 1.00 | |||
| (0.04) | (0.22) | (0.5) | (0.01) | (0.00) | (0.00) | (0.00) | (0.00) | (0.00) | (0.00) | |||||
| Grants | 0.03 | 0.01 | 0.01 | 0.02 | −0.17 | 0.15 | −0.21 | −0.02 | 0.52 | −0.22 | −0.18 | 1.00 | ||
| (0.05) | (0.45) | (0.37) | (0.22) | (0.00) | (0.00) | (0.00) | (0.11) | (0.00) | (0.00) | (0.00) | ||||
| Salaries wages commission | −0.02 | 0.001 | 0.01 | −0.006 | 0.19 | −0.14 | 0.4 | 0.01 | 0.05 | 0.45 | 0.26 | −0.23 | 1.00 | |
| (0.15) | (0.92) | (0.45) | (0.64) | (0.00) | (0.00) | (0.00) | (0.45) | (0.00) | (0.00) | (0.00) | (0.00) | |||
| Wealth status | 0.01 | −0.01 | 0.03 | 0.03 | 0.24 | −0.07 | 0.38 | 0.04 | −0.07 | 0.39 | 0.18 | −0.16 | 0.17 | 1.00 |
| (0.36) | (0.51) | (0.03) | (0.04) | (0.00) | (0.00) | (0.00) | (0.00) | (0.00) | (0.00) | (0.00) | (0.00) | (0.00) |
References
- World Economic Forum. Global Risks Report, 14th ed.; World Economic Forum: Geneva, Switzerland, 2019; ISBN 9781944835156. [Google Scholar]
- United Nations (UN). Human Rights to Water and Sanitation; UN: Geneva, Switzerland, 2010. [Google Scholar]
- Ait-Kadi, M. Water for development and development for water: Realizing the Sustainable Development Goals (SDGs) vision. Aquat. Procedia 2016, 6, 106–110. [Google Scholar] [CrossRef]
- Nhamo, G.; Nhemachena, C.; Nhamo, S. Is 2030 too soon for Africa to achieve the water and sanitation sustainable development goal? Sci. Total Environ. 2019, 669, 129–139. [Google Scholar] [CrossRef] [PubMed]
- UN Women. Turning Promises into Action: Gender Equality in the 2030 Agenda for Sustainable Development: Fact Sheet—Sub-Saharan Africa; UN Women: Geneva, Switzerland, 2018. [Google Scholar]
- UN Women. Why gender equality matters across all SGDs. In Turning Promises into Action: Gender Equality in the 2030 Agenda for Sustainable Development; United Nations: Geneva, Switzerland, 2018; p. 72. ISBN 9781632141088. [Google Scholar]
- Crow, B.; Swallow, B.; Asamba, I. Community organized household water increases not only rural incomes, but also men’s work. World Dev. 2012, 40, 528–541. [Google Scholar] [CrossRef]
- Mehta, L. Water and human development. World Dev. 2014, 59, 59–69. [Google Scholar] [CrossRef]
- WHO/UNICEF. Progress on Sanitation and Water: 2015 Update and MDG Assessement; WHO: Geneva, Switzerland, 2015. [Google Scholar]
- Price, H.; Adams, E.; Quilliam, R.S. The difference a day can make: The temporal dynamics of drinking water access and quality in urban slums. Sci. Total Environ. 2019, 671, 818–826. [Google Scholar] [CrossRef]
- United Nations (UN). The Sustainable Development Goals Report; UN: Geneva, Switzerland, 2019. [Google Scholar]
- Dos Santos, S.; Adams, E.A.; Neville, G.; Wada, Y.; de Sherbinin, A.; Mullin Bernhardt, E.; Adamo, S.B. Urban growth and water access in sub-Saharan Africa: Progress, challenges, and emerging research directions. Sci. Total Environ. 2017, 607–608, 497–508. [Google Scholar] [CrossRef]
- DWA. Strategic Overview of the Water Sector in South Africa; Department of Water Affairs: Pretoria, South Africa, 2013.
- Muller, M.; Schreiner, B.; Smith, L.; van Koppen, B.; Sally, H.; Aliber, M.; Cousins, B.; Tapela, B.; Van der Merwe-Botha, M.; Karar, E.; et al. Water Security in South Africa; Working Paper Series No 22; Development Planning Division DBSA: Midrand, South Africa, 2009. [Google Scholar]
- Department of Water Affairs. National Water Act (Act No. 36 of 1998); Government Printers: Pretoria, South Africa, 1998.
- Onyenankeya, K.; Caldwell, M.; Okoh, A.I. Sustainable water use and the nexus of behavioural intentions: The case of four South African communities. Water Environ. J. 2018, 32, 285–291. [Google Scholar] [CrossRef]
- WASHWatch. Total Number of People Lacking Access to “at least Basic Water” in South Africa. 2019. Available online: https://washwatch.org/en/countries/south-africa/summary/statistics/ (accessed on 6 August 2019).
- Zhuwakinyu, M. Water 2012—A Review of the Sout Africa’s Water Sector; Research Institute of Creamer: Johannesburg, South Africa, 2012. [Google Scholar]
- Department of Water Affairs (DWA). National Water Resource Strategy: Water for an Equitable and SUSTAINABLE Future; DWA: Pretoria, South Africa, 2013.
- Akinyemi, B.E.; Mushunje, A.; Fashogbon, A.E. Factors explaining household payment for potable water in South Africa Factors explaining household payment for potable water in South Africa. Cogent Soc. Sci. 2018, 4, 1464379. [Google Scholar]
- Dungumaro, E.W. Socioeconomic differentials and availability of domestic water in South Africa. Phys. Chem. Earth 2007, 32, 1141–1147. [Google Scholar] [CrossRef]
- Monyai, P.B. The Gender Dimension of the Water Policy and Its Impact on Water and Sanitation Provision in the Eastern Cape: The Case of the Peddie District; Water Research Commission: Pretoria, South Africa, 2003. [Google Scholar]
- Department of Water Affairs (DWA). National Water Policy Review; DWA: Pretoria, South Africa, 2013.
- DWS. National Water and Sanitation Master Plan: Call to Action; DWS: Pretoria, South Africa, 2018; Volume 1. Available online: http://www.dwa.gov.za/National%20Water%20and%20Sanitation%20Master%20Plan/Documents/NWSMP%20Call%20to%20Action%20Final%20Draft%20PDF.pdf (accessed on 14 August 2019).
- Cole, S. Water worries: An intersectional feminist political ecology of tourism and water in Labuan Bajo, Indonesia. Ann. Tour. Res. 2017, 67, 14–24. [Google Scholar] [CrossRef]
- Das, M.B. The Rising Tide: A New Look at Water and Gender; World Bank: Washington, DC, USA, 2017. [Google Scholar]
- Sorenson, S.B.; Morssink, C.; Abril, P. Safe access to safe water in low income countries: Water fetching in current times. Soc. Sci. Med. 2011, 72, 1522–1526. [Google Scholar] [CrossRef] [PubMed]
- UN. Water and gender. United Nations Water. 2019. Available online: https://www.unwater.org/water-facts/gender/ (accessed on 26 August 2019).
- Caruso, B.A.; Sevilimedu, V.; Fung, I.C.H.; Patkar, A.; Baker, K.K. Gender disparities in water, sanitation, and global health. Lancet 2015, 386, 650–651. [Google Scholar] [CrossRef]
- Workman, C.L.; Ureksoy, H. Water insecurity in a syndemic context: Understanding the psycho- emotional stress of water insecurity in Lesotho, Africa. Soc. Sci. Med. 2017, 179, 52–60. [Google Scholar] [CrossRef] [PubMed]
- Srinivasan, V.; Konar, M.; Sivapalan, M. A dynamic framework for water security. Water Secur. 2017, 1, 12–20. [Google Scholar] [CrossRef]
- Tsai, A.C.; Kakuhikire, B.; Mushavi, R.; Vořechovská, D.; Perkins, J.M.; McDonough, A.Q.; Bangsberg, D.R. Population-based study of intra-household gender differences in water insecurity: Reliability and validity of a survey instrument for use in rural Uganda. J. Water Health 2016, 14, 280–292. [Google Scholar] [CrossRef] [PubMed]
- Bisung, E.; Elliott, S.J. Improvement in access to safe water, household water insecurity, and time savings: A cross-sectional retrospective study in Kenya. Soc. Sci. Med. 2018, 200, 1–8. [Google Scholar] [CrossRef] [PubMed]
- Calow, R.C.; MacDonald, A.M.; Nicol, A.L.; Robins, N.S. Ground water security and drought in Africa: Linking availability, access, and demand. Ground Water 2010, 48, 246–256. [Google Scholar] [CrossRef]
- Crow, B.; Sultana, F. Gender, class, and access to water: Three cases in a poor and crowded delta. Soc. Nat. Resour. 2002, 15, 709–724. [Google Scholar] [CrossRef]
- Smiley, S.L. Defining and measuring water access: Lessons from Tanzania for moving forward in the post-millennium development goal era. Afr. Geogr. Rev. 2017, 36, 168–182. [Google Scholar] [CrossRef]
- Majuru, B.; Suhrcke, M.; Hunter, P.R. How do households respond to unreliable water supplies? Int. J. Environ. Res. Public Health 2016, 13, 1222. [Google Scholar] [CrossRef]
- Brooks, N. Vulnerability, Risk and Adaptation: A Conceptual Framework; Tyndall Center for Climate Change Research: Norwich, UK, 2003. [Google Scholar]
- Allen, K. Vulnerability reduction and the community-based approach. In Natural Disasters and Development in a Globalising World; Pelling, M., Ed.; Routledge: London, UK, 2003; pp. 170–184. [Google Scholar]
- De Lange, H.J.; Sala, S.; Vighi, M.; Faber, J.H. Ecological vulnerability in risk assessment—A review and perspectives. Sci. Total Environ. 2010, 408, 3871–3879. [Google Scholar] [CrossRef] [PubMed]
- Statistics South Africa. General Household Survey; Statistics South Africa: Pretoria, South Africa, 2016.
- Jolliffe, I.T. Principal Component Analysis; Springer: New York, NY, USA, 1986. [Google Scholar]
- Bollen, K.A. Structural Equations with Latent Variables; Wiley: New York, NY, USA, 1989. [Google Scholar]
- Obi, A.; van Schalkwyk, H.D.; van Tilburg, A. Market Access, Poverty Alleviation and Socio-Economic Sustainability in South Africa; Wageningen Academic Publishers: Wageningen, The Netherlands, 2012; ISBN 978-90-8686-134-7. [Google Scholar]
- Triegaart, J.D. Poverty and inequality in South Africa: Policy considerations in an emerging democracy. Indic. S. Afr. 2003, 15, 53–58. [Google Scholar]
- Kulinkina, A.V.; Kosinski, K.C.; Liss, A.; Adjei, M.N.; Ayamgah, G.A.; Webb, P.; Gute, D.M.; Plummer, J.D.; Naumova, E.N. Piped water consumption in Ghana: A case study of temporal and spatial patterns of clean water demand relative to alternative water sources in rural small towns. Sci. Total Environ. 2016, 559, 291–301. [Google Scholar] [CrossRef] [PubMed]
- Kativhu, T.; Mazvimavi, D.; Tevera, D.; Nhapi, I. Factors influencing sustainability of communally-managed water facilities in rural areas of Zimbabwe. Phys. Chem. Earth 2017, 100, 247–257. [Google Scholar] [CrossRef]
- Barde, J.A. What determines access to piped water in rural areas? Evidence from small-scale supply systems in rural Brazil. World Dev. 2017, 95, 88–110. [Google Scholar] [CrossRef]
- Truelove, Y. (Re-) Conceptualizing water inequality in Delhi, India through a feminist political ecology framework. Geoforum 2011, 42, 143–152. [Google Scholar] [CrossRef]
- Madrigal-ballestero, R.; Alpízar, F.; Schlüter, A. Public perceptions of the performance of community-based drinking water organizations in Costa Rica. Water Resour. Rural Dev. 2013, 1, 43–56. [Google Scholar] [CrossRef]
- Naraya, D.; Patel, R.; Schafft, E.; Rademacher, A.; Koch-Schulte, S. Voices of the Poor: Can Anyone Hear Us? Oxford University Press: New York, NY, USA, 2000. [Google Scholar]
- Deere, C.D.; Doss, C. The gender asset gap: What do we know and why does it matter? Fem. Econ. 2006, 12, 1–50. [Google Scholar] [CrossRef]
- Eastin, J. Climate change and gender equality in developing states. World Dev. 2018, 107, 289–305. [Google Scholar] [CrossRef]
- Sultana, F. Suffering for water, suffering fromwater: Emotional geographies of resource access, control, and conflict. Geoforum 2011, 42, 163–172. [Google Scholar] [CrossRef]
- Gunda, T.; Hess, D.; Hornberger, G.M.; Worland, S. Water security in practice: The quantity-quality-society nexus. Water Secur. 2019, 6, 100022. [Google Scholar] [CrossRef]
- Sun, C.; Liu, W.; Zou, W. Water poverty in urban and rural China considered through the Harmonious and Developmental Ability Model. Water Resour. Manag. 2016, 30, 2547–2567. [Google Scholar] [CrossRef]
- Official Guide to South Africa. Energy and Water. Pretoria, South Africa. 2018. Available online: https://www.gcis.gov.za/sites/default/files/docs/resourcecentre/pocketguide/09-EnergyandWater-1718.pdf (accessed on 25 August 2019).
- DWS Group & GmbH Co KgaA (DWS). National Water and Sanitation Master Plan: Ready for the Future and Ahead of the Curve; DWS: Pretoria, South Africa, 2018; Volume 3. [Google Scholar]
Figure 1.
Drinking water decision framework. Source: Adapted from Price et al. [10].
Figure 1.
Drinking water decision framework. Source: Adapted from Price et al. [10].

Figure 2.
Vulnerability measures in (a) linear relationship (b) dynamic relationship.

Figure 3.
Wealth status of female-headed households in South Africa.

Figure 4.
Wealth status of female-headed households per province.

Figure 5.
Main source of water for female-headed households in South Africa.

Figure 6.
Interaction between exposure, sensitivity and adaptative capacity for female-headed households in South Africa. Sig. at *** 1%, ** 5%.
Figure 6.
Interaction between exposure, sensitivity and adaptative capacity for female-headed households in South Africa. Sig. at *** 1%, ** 5%.

Figure 7.
Intricacies between exposure, sensitivity and adaptive capacity for vulnerability to water insecurity.
Figure 7.
Intricacies between exposure, sensitivity and adaptive capacity for vulnerability to water insecurity.

Table 1.
Sample size and location.
| Race | Western Cape | Eastern Cape | Northern Cape | Free State | KwaZulu-Natal | North West | Gauteng | Mpumalanga | Limpopo | Total |
|---|---|---|---|---|---|---|---|---|---|---|
| African/Black | 250 | 796 | 180 | 418 | 919 | 335 | 1015 | 463 | 671 | 5047 |
| Coloured | 289 | 68 | 117 | 16 | 6 | 7 | 36 | 0 | 4 | 543 |
| Indian/Asian | 0 | 1 | 0 | 1 | 54 | 0 | 15 | 0 | 1 | 72 |
| White | 91 | 15 | 11 | 19 | 18 | 20 | 84 | 7 | 1 | 266 |
| Total | 630 | 880 | 308 | 454 | 997 | 362 | 1150 | 470 | 677 | 5928 |
Table 2.
Descriptive statistics.
| Variables | N | Minimum | Maximum | Mean | Std. Deviation |
|---|---|---|---|---|---|
| Household head age | 5928 | 15 | 106 | 50.7 | 16.5 |
| Household size | 5928 | 1 | 24 | 3.7 | 2.4 |
| Net household income | 5928 | 0 | 500,000 | 7057.8 | 12,107.3 |
| Household monthly salary | 5928 | 0 | 200,000 | 4067.1 | 9036.4 |
Table 3.
Water-insecurity-exposure principal components.
| Exposure Variables | Component | ||
|---|---|---|---|
| Water Characteristics | Water Access | Household Head Age | |
| Good in taste | 0.87 | ||
| Clean—has no colour/free of mud | 0.87 | ||
| Safe to drink | 0.87 | ||
| Free from bad smells | 0.83 | ||
| Main source of drinking water | 0.77 | ||
| Household expenditure | 0.70 | ||
| Water supply interruption | −0.62 | −0.36 | |
| Household head age | 0.93 | ||
| Kaiser-Meyer-Olkin (KMO) Measure of Sampling Adequacy | 0.81 | ||
| Bartlett’s Test of Sphericity | 13,544.39 *** | ||
| N of items | 4 | 3 | 2 |
| Eigen values † (cumulative % of variance) | 37.07 | 55.35 | 68.34 |
| Cronbach’s Alpha | 0.88 | 0.31 | 0.15 |
| Tukey’s Test for Non-additivity | 27.02 *** | 1205.03 *** | 1114.65 *** |
| Hotelling’s T-Squared Test | 26.63 *** | 3050.19 *** | 1114.66 *** |
Extraction method: Principal Component analysis Rotation; method: Varimax rotation with Kaiser normalisation.; Factor loadings > 0.25; † Eigen values > 1; *** Sig. at 1%.
Table 4.
Water–insecurity–sensitivity principal components.
| Sensitivity Variables | Component | ||
|---|---|---|---|
| Assets | Monthly Income | Water Treatment | |
| Own a TV set | 0.80 | ||
| Own a refrigerator | 0.77 | ||
| Own an electric stove | 0.72 | ||
| Own a DVD | 0.58 | ||
| Monthly income per month | 0.77 | ||
| Household monthly salary | 0.72 | ||
| Treatment of drinking water | 0.83 | ||
| Household size | −0.59 | ||
| Kaiser-Meyer-Olkin (KMO) Measure of Sampling Adequacy | 0.73 | ||
| Bartlett’s Test of Sphericity | 5096.53 *** | ||
| N of items | 4 | 2 | 2 |
| Eigen values † (cumulative % of variance) | 28.2 | 42.83 | 55.5 |
| Cronbach’s Alpha | 0.68 | 0.06 | 0.07 |
| Tukey’s Test for Non-additivity | 1700.24 *** | 11,948.2 *** | 313.2 *** |
| Hotelling’s T-Squared Test | 1200.78 *** | 11,948.23 *** | 313.2 *** |
Extraction method: Principal Component analysis; Rotation method: Varimax rotation with Kaiser normalization; Factor loadings > 0.25; † Eigen values > 1; *** Sig. at 1%.
Table 5.
Water-insecurity-adaptive capacity principal components.
| Adaptive Capacity Variables | Component | ||||
|---|---|---|---|---|---|
| Income and Wealth Status | Salary and Remittances | Pensions | Business | Farming Income | |
| Total household income | 0.81 | ||||
| Net household income | 0.60 | ||||
| Grants | −0.58 | ||||
| Wealth status of household | 0.58 | ||||
| Salaries/wages/commission | 0.55 | −0.40 | −0.36 | ||
| Remittances | 0.89 | ||||
| Income from remittances | 0.87 | ||||
| Pensions | 0.89 | ||||
| Income from pensions | 0.88 | ||||
| Income from business | 0.81 | ||||
| Farming income | 0.78 | ||||
| Other income sources e.g., rental income, interest | 0.52 | −0.58 | |||
| Kaiser-Meyer-Olkin (KMO) Measure of Sampling Adequacy. | 0.70 | ||||
| Bartlett’s Test of Sphericity | 10,944.50 *** | ||||
| N of items | 5 | 3 | 2 | 3 | 2 |
| Eigen values † (cumulative % of variance) | 18.00 | 32.57 | 45.76 | 55.00 | 63.34 |
| Cronbach’s Alpha | 0.17 | 0.44 | 0.34 | 0.19 | 0.02 |
| Tukey’s Test for Non-additivity | 4359.2 *** | 2654.0 *** | 289.2 *** | 4063.5 *** | 17.7 *** |
| Hotelling’s T-Squared Test | 12,388.4 *** | 6269.9 *** | 289.2 *** | 3212.3 *** | 17.7 *** |
Extraction method: Principal Component analysis; Rotation method: Varimax rotation with Kaiser; normalization; Factor loadings > 0.25; † Eigen values > 1; *** Sig. at 1%.
© 2019 by the authors. Licensee MDPI, Basel, Switzerland. This article is an open access article distributed under the terms and conditions of the Creative Commons Attribution (CC BY) license (http://creativecommons.org/licenses/by/4.0/).
Share and Cite
MDPI and ACS Style
Ngarava, S.; Zhou, L.; Monde, N. Gendered Water Insecurity: A Structural Equation Approach for Female Headed Households in South Africa. Water 2019, 11, 2491. https://doi.org/10.3390/w11122491
AMA Style
Ngarava S, Zhou L, Monde N. Gendered Water Insecurity: A Structural Equation Approach for Female Headed Households in South Africa. Water. 2019; 11(12):2491. https://doi.org/10.3390/w11122491
Chicago/Turabian StyleNgarava, Saul, Leocadia Zhou, and Nomakhaya Monde. 2019. "Gendered Water Insecurity: A Structural Equation Approach for Female Headed Households in South Africa" Water 11, no. 12: 2491. https://doi.org/10.3390/w11122491
Note that from the first issue of 2016, this journal uses article numbers instead of page numbers. See further details here.