Electrocoagulation as a Pretreatment for Electroxidation of E. coli


Department of Civil, Construction and Environmental Engineering, Marquette University, Milwaukee, WI 53233, USA
*
Author to whom correspondence should be addressed.
Water 2019, 11(12), 2509; https://doi.org/10.3390/w11122509
Submission received: 31 October 2019
/
Revised: 22 November 2019
/
Accepted: 25 November 2019
/
Published: 28 November 2019
(This article belongs to the Special Issue Removal and Inactivation of Waterborne Pathogens during Water Treatment Processes)
Abstract
:Insufficient funding and operator training, logistics of chemical transport, and variable source water quality can pose challenges for small drinking water treatment systems. Portable, robust electrochemical processes may offer a strategy to address these challenges. In this study, electrocoagulation (EC) and electrooxidation (EO) were investigated using two model surface waters and two model groundwaters to determine the efficacy of sequential EC-EO for mitigating Escherichia coli. EO alone (1.67 mA/cm2, 1 min) provided 0.03 to 3.9 logs mitigation in the four model waters. EC alone (10 mA/cm2, 5 min) achieved ≥1 log E. coli mitigation in all model waters. Sequential EC-EO did not achieve greater mitigation than EC alone. To enhance removal of natural organic matter, the initial pH was decreased. Lower initial pH (pH 5–6) improved E. coli mitigation during both stages of EC-EO. EC-EO also had slightly greater E. coli mitigation than EC alone at lower pH. However, EO alone provided more energy efficient E. coli mitigation than either EC or EC-EO.
1. Introduction
Approximately 97% of all public water systems in the United States (U.S.) are small drinking water systems (serving <10,000 people), which together serve 20% of the population [1]. Approximately 7% to 8% of these small drinking water systems have at least one health-based violation per year [2,3]. Non-compliance with the U.S. Environmental Protection Agency’s (EPA’s) Total Coliform Rule (TCR) [4] or the Disinfectants and Disinfection Byproduct Rule (DBPR) [5] is most common, with a reported 30,000 and 20,000 health-based violations, respectively, between 1982 and 2015 [3]. Challenges with variable source water quality and lack of sufficient funding for adequate operation have contributed to difficulties in meeting standards [1,2]. Innovative technologies, such as in-situ treatment using electrochemical processes, are of great interest based on their potential to overcome the challenges faced by small drinking water systems in maintaining regulatory compliance with the TCR and DBPR.
Electrochemical treatment processes, such as electrocoagulation (EC) and electrooxidation (EO), may be particularly amenable to small drinking water systems. Advantages include circumventing the need for storage and addition of corrosive chemicals, having a small footprint, limiting alkalinity depletion, applying straightforward operation and automation, and providing portability for water treatment during emergencies and in remote settings [6]. Both EC and EO offer possible mitigation (including physical removal and/or inactivation mechanisms) of an array of contaminants including natural organic matter (NOM, the primary disinfection byproduct [DBP] precursor) and microorganisms, such as Escherichia coli.
EC applies electrical current to produce in-situ coagulants using consumable metal electrodes, typically iron or aluminum. The release of metal ions from the anode forms metal hydroxide flocs, which can subsequently be physically separated from solution using flotation, sedimentation, or filtration [7]. Delaire et al. (2015) [8] reported 2 to 4 logs reduction of E. coli using EC with iron electrodes, with higher mitigation as the coagulant dose increased or pH decreased. Ghernaout et al. (2008) [9] demonstrated that EC using aluminum electrodes could mitigate E. coli in two natural surface waters, while Ndjomgoue-Yossa et al. (2015) [10] established that steel electrodes and sodium chloride were the most effective electrode type and electrolyte addition for E. coli mitigation by EC in an artificial wastewater. EC can also remove NOM from water, thereby mitigating the formation of harmful DBPs [6,11,12]. Enhanced coagulation, using increased coagulant dose and/or decreased initial pH, can further improve NOM removal [13]. Vepsäläinen et al. (2009) [14] found that enhanced EC with pH adjustment provided about 75% NOM removal. Together, these studies demonstrate the dual potential of EC to remove both E. coli and NOM, with potential improvements following pH adjustment.
EO uses non-consumable electrodes, such as mixed metal oxides (MMOs) or boron-doped diamond (BDD), to mitigate pollutants, directly or indirectly, through the generation of oxidants in solution. Direct oxidation occurs when water adsorbs to the anode surface and is oxidized to form hydroxyl radicals [15,16], which directly oxidize contaminants at the electrode surface [16,17,18,19]. Indirect oxidation occurs when oxidants generated at the electrode surface migrate into the bulk solution [16,20,21]. A well-documented side electrolysis process during EO is the oxidation of chloride to form free chlorine, a common water disinfectant [16,20,21,22,23]. Hydroxyl radical production provides an indirect contaminant mitigation mechanism in EO, especially in waters without chloride electrolytes [14,19,21,22]. Another possible indirect oxidation process is Fenton reactions, where the oxidation of ferrous iron with hydrogen peroxide at a low pH (<4) results in the production of hydroxyl radicals [24,25,26]. Through these oxidation pathways, EO can inactivate E. coli [18,27,28] but can also form DBPs when the oxidants react with NOM [25]. While EO is a promising treatment process, the presence of DBP precursors demonstrates the need for a pretreatment process to remove NOM ahead of EO treatment.
Leveraging the benefits of sequential EC-EO, similar to those of a traditional multi-barrier water treatment train, could achieve sufficient E. coli mitigation and NOM removal to meet microbial and DBP water quality standards [29]. Linares-Hernández et al. (2010) [29] implemented EC-EO in industrial wastewater, and observed improved degradation of chemical oxygen demand, color, turbidity, and coliform bacteria, reducing the time to achieve 99% removal of all contaminants from 21 to 2 h. Anfruns-Estrada et al. (2017) [27] reported that the combination of iron EC and electro-Fenton with BDD electrodes plus air diffusion in a neutral pH urban wastewater could achieve complete removal of numerous microbes, including E. coli. Their study demonstrated that sequential application of EC and electro-Fenton (current densities of 20 and 33 mA/cm2, respectively) for 30 min resulted in greater removal than either process alone. An integrated electrochemical cell (EC and EO in the same reactor) was also able to significantly reduce E. coli concentrations in an urban wastewater, even at current densities below 2 mA/cm2 [30,31].
Although integrated electrochemical treatment processes have demonstrated effective E. coli removal in industrial and urban wastewaters, use of sequential EC-EO for the mitigation of E. coli in drinking water sources has yet to be reported. To address this research gap, we investigated the efficacy of sequential EC-EO for mitigating E. coli in variable drinking water matrices. The specific objectives were (1) to establish E. coli mitigation using sequential EC-EO to treat synthetic surface and groundwater matrices, and (2) to evaluate the use of enhanced EC (using pH adjustment) as a pretreatment to EO for mitigation of E. coli. We hypothesized that E. coli mitigation in the surface water would improve using EC-EO since EC was anticipated to remove a high degree of NOM (thereby reducing oxidant demand), consequently enhancing E. coli inactivation by EO. Moreover, lower initial pH was hypothesized to increase NOM removal by EC and further improve disinfection by yielding a higher fraction of free chlorine in the more effective hypochlorous acid form during EO. The iron added during EC was expected to consume oxidants, such as free chlorine, during EO but also enhance E. coli mitigation via Fenton-like reactions.
2. Materials and Methods
2.1. E. coli
E. coli (ATCC 15597) was cultured to log phase in tryptic soy broth (TSB) (BD, Sparks, MD). To decrease organic interference by TSB, E. coli cells were centrifuged for 10 min at 2000 rpm [32], the supernatant was discarded, and cells were resuspended in an equivalent volume of buffered demand-free (BDF) water (3.8 mM disodium phosphate and 6.5 mM monopotassium phosphate, pH 7). This centrifugation/re-suspension process was repeated a total of three times. Purified cells were spiked at 1 × 10⁶ CFU/mL for all tests to enable quantification of up to 6-logs reduction, which is the bacterial target recommended by the U.S. EPA’s Guide Standard and Protocol for Testing Microbiological Water Purifiers [33]. Infectious E. coli was quantified using the standard membrane filtration method 9222 [34] with Difco™ m Endo Broth MF™ (BD, Franklin Lakes, NJ, USA).
2.2. Water Matrices
Four synthetic water matrices were used, modeled after actual surface and groundwaters in Wisconsin and Minnesota, including Lake Michigan, the Mississippi River, a sandstone aquifer, and a dolomite aquifer, as described by Heffron et al. (2019) [35]. Model water matrices were prepared by adjusting alkalinity, chloride, turbidity, dissolved organic carbon (DOC), and pH in Milli-Q water, as shown in Table 1. As noted above, all waters were spiked with E. coli at an initial concentration of 1 × 10⁶ CFU/mL to facilitate quantification of high levels of bacterial reduction.
2.3. Testing Apparatus and Operation
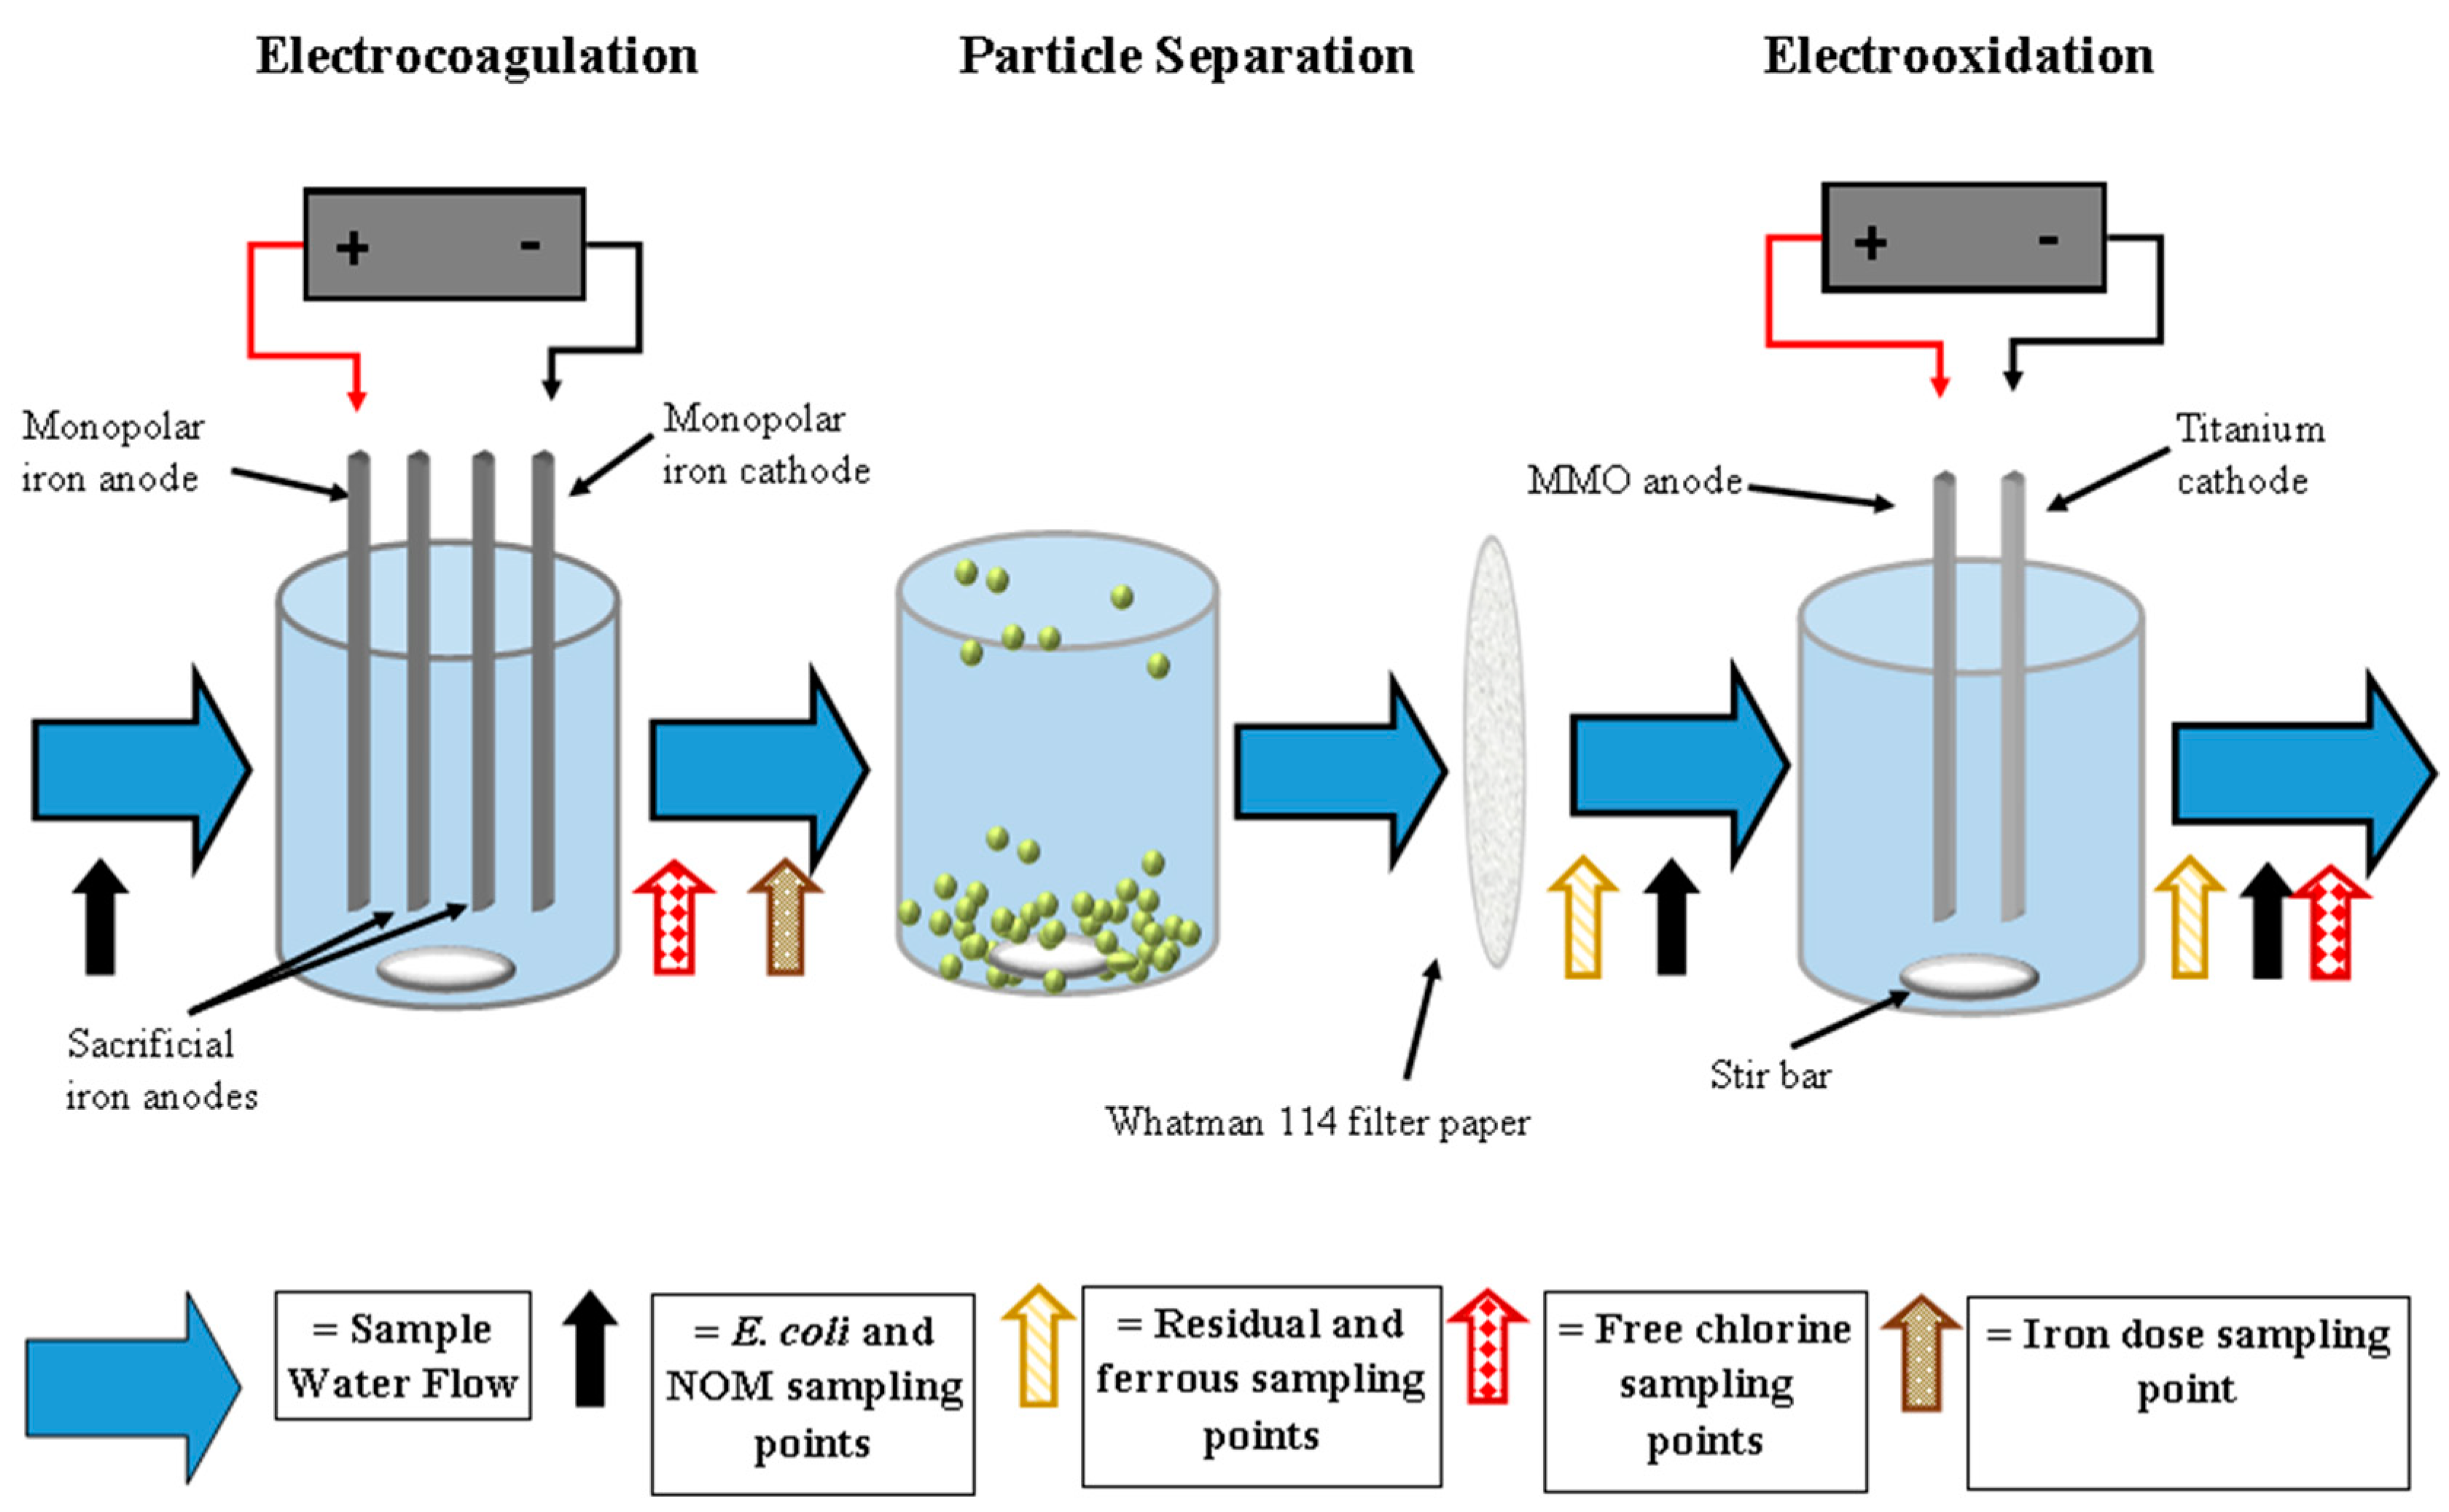
A schematic of the bench-scale treatment train is shown in Figure 1. E. coli, NOM, total iron dose, residual iron, ferrous iron, and free chlorine concentrations were sampled throughout the treatment train. Additionally, EO alone was conducted without EC pretreatment to provide a comparison against E. coli and NOM removal for the full EC-EO sequence. For E. coli tests, 0.063 mM sodium thiosulfate was added to samples immediately after completion of EC-EO and EO tests to quench oxidation reactions and halt bacterial inactivation.
2.3.1. Electrocoagulation
Steel (1020) electrodes (VMetals, Milwaukee, WI) were sanded with a finely graded sandpaper to remove corrosive iron from the electrode’s surface. The electrodes were rinsed with Milli-Q water and exposed to UV light for approximately 30 min per side. During tests, electrode polarity was reversed every 30 s to limit the formation of a passivation layer on the cathode, as described by Maher et al. (2019) [36].
The EC tests were conducted in 250-mL polypropylene reactors filled with 200 mL of water with 200-rpm mixing. The four electrodes were arranged as a bipolar cell in a parallel connection, as shown in Figure 1. The submerged electrode surface area was 15 cm2 with 1-cm inter-electrode spacing. Prior to each EC experiment, a current density of 6.7 mA/cm2 was applied for 10 min in a bacteria-free matrix to overcome the passivation layer, activate iron generation, and to polarize the electrodes [37]. The electrodes were then rinsed with Milli-Q to remove iron flocs.
The EC operating parameters were determined in preliminary tests, wherein a range of total iron doses was applied to the model river water (highest NOM concentration) to evaluate the total iron dose that produced the highest NOM removal and the lowest residual iron after filtration. The total iron dose (mass/volume) was estimated in accordance with Faraday’s law (Equation (1)):
where m is the mass of metal dissociated (g), I is the current (A), t is the treatment time (s), Mw is the molecular weight of the metal (g/mol), z is the number of electrons (in this case, Fe2+ = 2), and F is Faraday’s constant (96,485 C/mol).
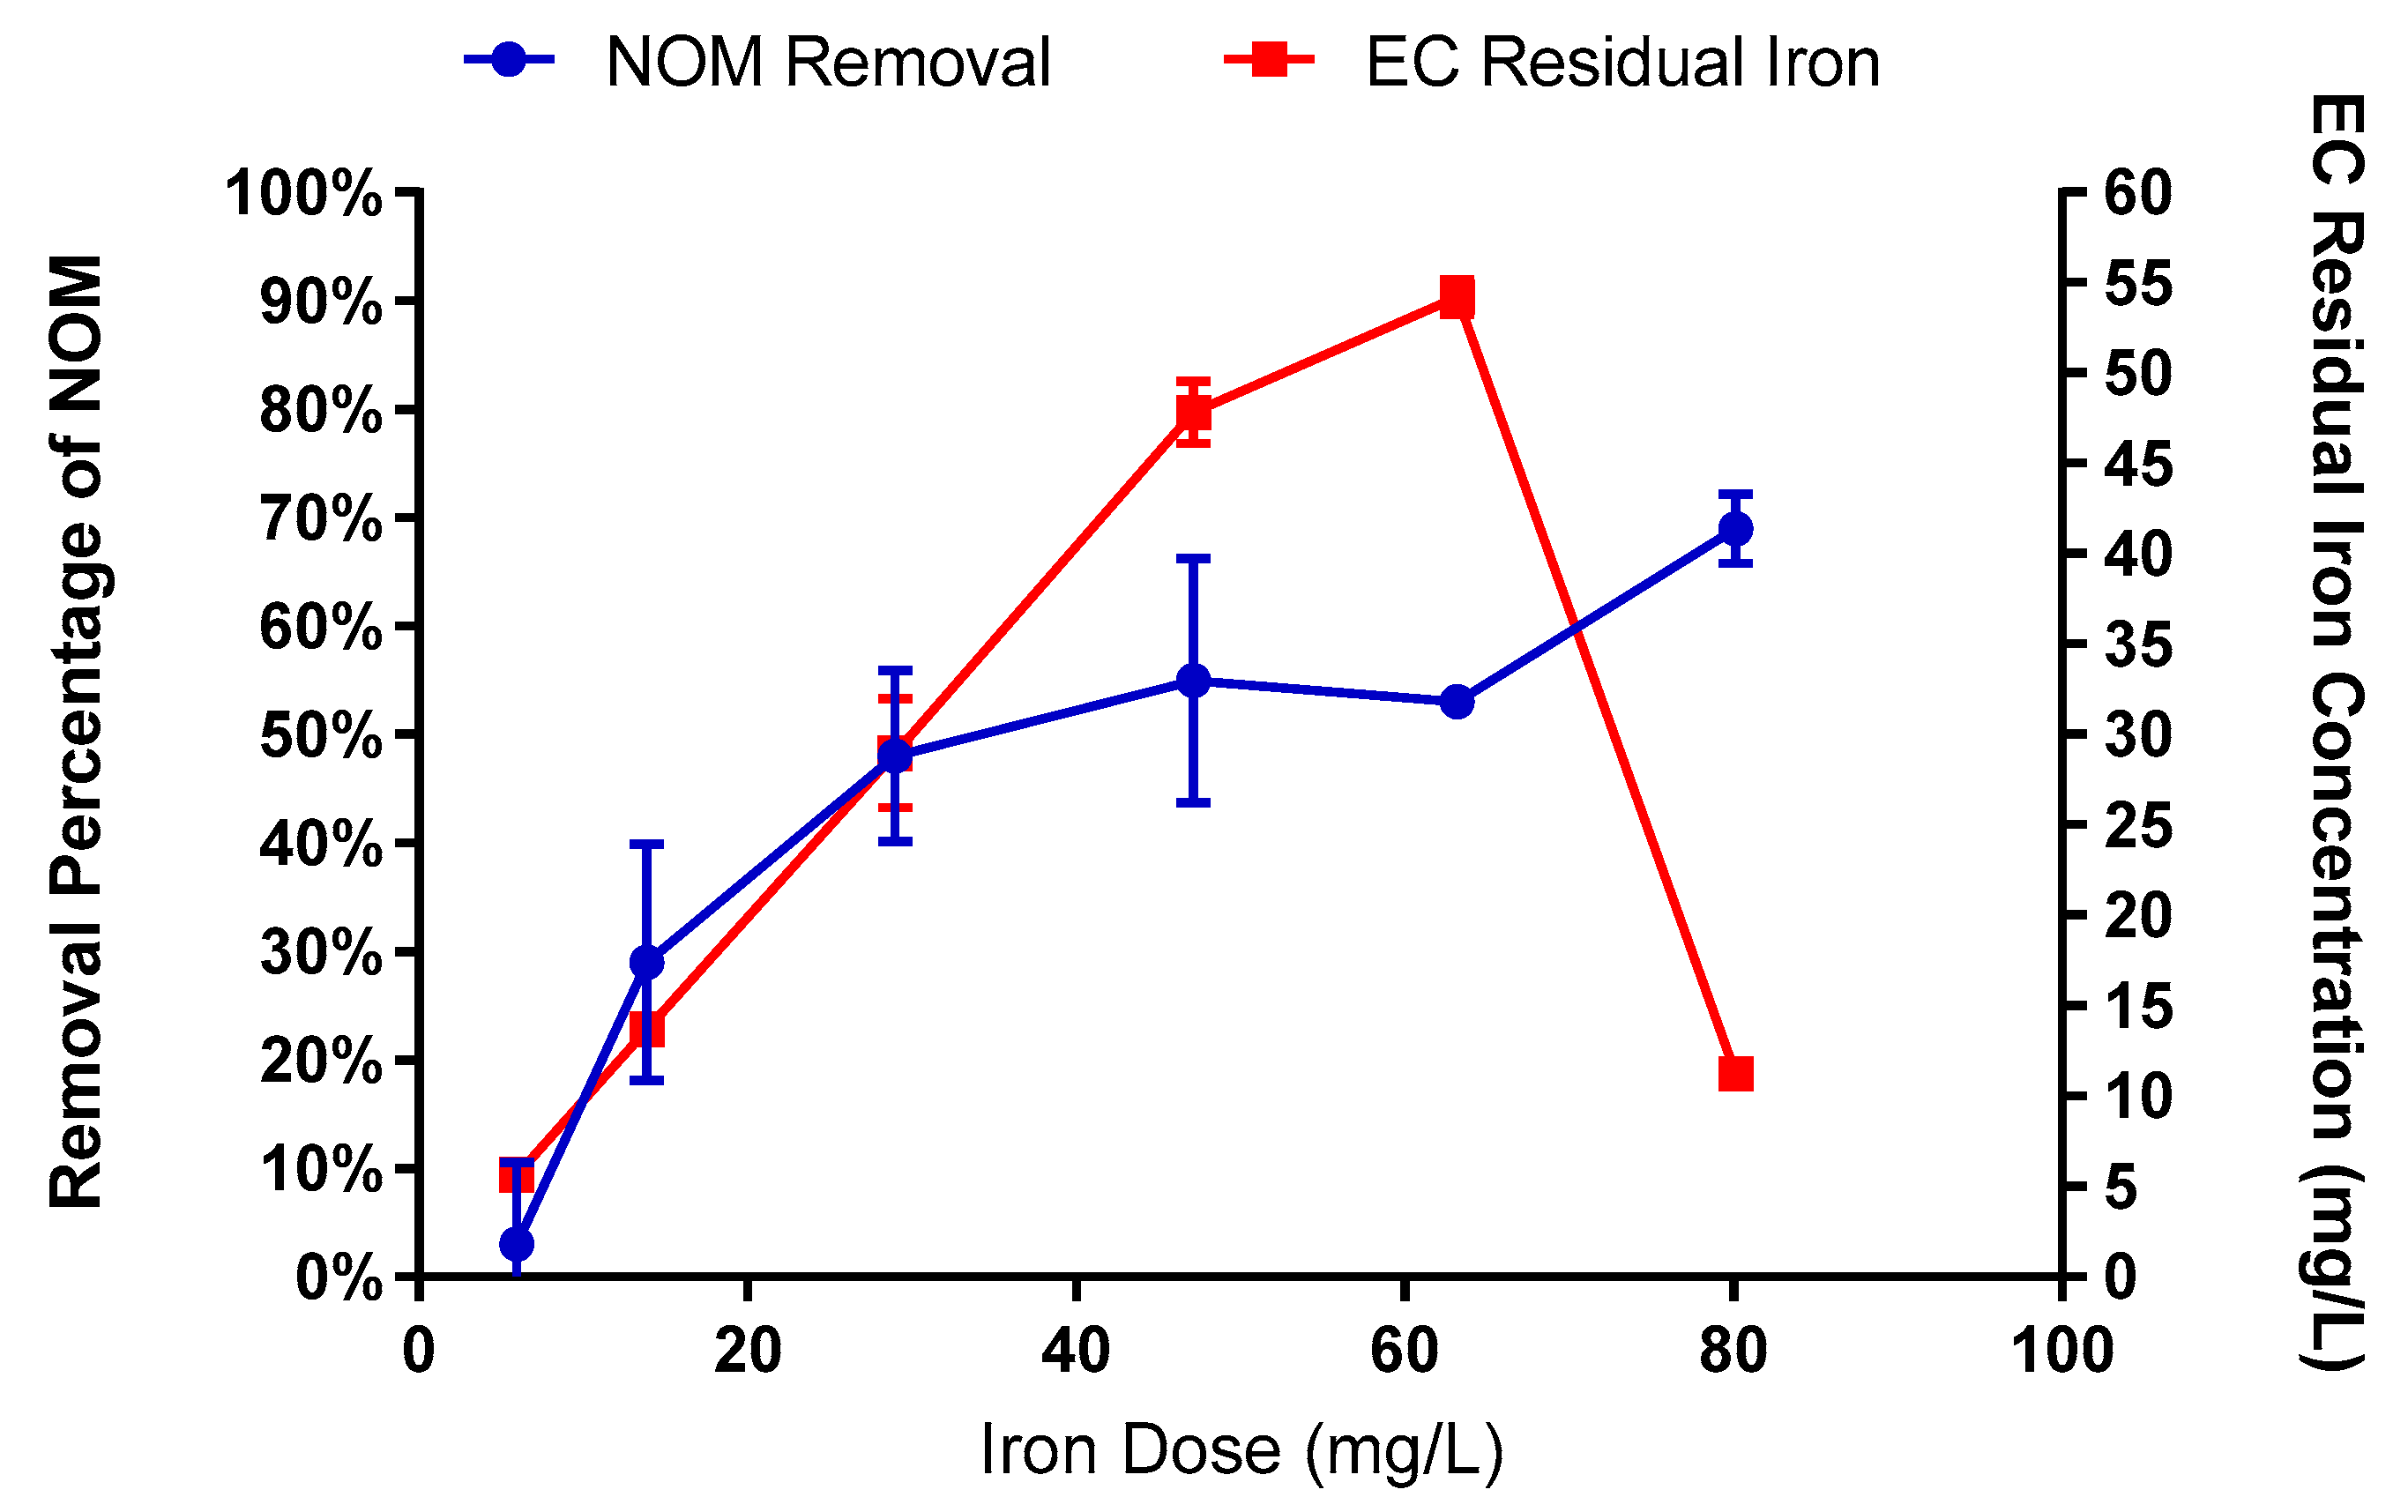
Initial tests of current densities ranging from 0.67 to 10 mA/cm2 applied for 5 min showed 10 mA/cm2 (82.1 mg/L Fe) provided the highest NOM removal (69 ± 3.2%) and lowest total residual iron (11.2 ± 0.7 mg/L Fe) (Appendix A, Figure A1). Accordingly, subsequent EC tests were conducted at 10 mA/cm2 for 5 min.
Measured total iron concentrations were higher than the estimated values from Faraday’s law (≈5–65 mg/L Fe for current densities of 0.67 to 10 mA/cm2). On average, the actual total iron doses were 1.3 times greater than that of the estimated values, similar to findings by Gu et al. (2009) [38]. The difference was attributed to the dissolution of iron in water without an applied current [38,39].
2.3.2. Particle Separation
Following EC, the electrodes were removed and flocculation, settling, and filtration were implemented to separate the iron flocs. The particle separation process was modified from Vepsäläinen et al. (2009) [14] to include 10-min flocculation at 60 rpm followed by 15-min sedimentation with no mixing. A sample of approximately 150 mL was slowly pipetted from the center of the reactor to avoid collecting flocs and was subsequently passed through Whatman 114 filter paper (pore size = 25 μm) via vacuum filtration. The large 25-µm filter was applied during particle separation to allow E. coli cells to pass through the filter when EC was not applied (as shown in Section 2.5). This ensured that E. coli mitigation was only due to the addition of EC and was not a result of filtration alone. The filtrate was transferred to a sterile reactor for EO treatment, and the pH was measured.
2.3.3. Electrooxidation
For EO, a titanium cathode was used in combination with a non-reactive thin-film iridium-coated dimensionally stable anode (mixed metal oxide [MMO]; Ti/IrO2 + TaO2) (Ti Anode Fabricators Pvt. Ltd., Chennai., India). Prior to EO experiments, the anode was conditioned by polarization using electrolysis in strong acid (0.2 M HCl or 0.25 M HNO3) at 7.4 mA/cm2 for 10 min (modified from Devilliers and Mahé (2010) [40] and Jeong et al. (2006) [41]). Between trials, the electrode was re-submerged in acid for 5 min at 7.4 mA/cm2 and rinsed.
EO experiments were performed in 200-mL polypropylene reactors with 1-cm electrode spacing. Preliminary tests to determine EO operating parameters were conducted in the model shallow aquifer water, due to the high generation of free chlorine based on the high chloride concentration of 70.4 mg/L. Using 25 mA (1.67 mA/cm2) for 1 min achieved the highest quantifiable inactivation; testing higher currents resulted in removal beyond the quantifiable limit (>6 logs of E. coli mitigation, based on spiking levels). Therefore, this current was used in all subsequent EO experiments, unless otherwise noted.
2.4. Analytical
The pH and conductivity were determined using a VWR symphony Benchtop B40PCID meter. Total iron concentration was assessed in accordance with EPA method 3050B [42] using a 7700 series inductively coupled plasma mass spectrometer (ICP-MS) (Agilent Technologies, Santa Clara, CA, USA). Hach Method 8021 was used to quantify free chlorine concentrations using a Genesys 20 (Thermo Scientific, Waltham, MA, USA) spectrophotometer. Analysis of NOM was conducted in accordance with Standard Method 5310—Total Organic Carbon (TOC) [32] in bacteria-free water. Samples were filtered through PTFE 0.45-µm syringe filters to analyze DOC (Agela Technologies, Torrance, CA, USA), acidified to pH 3, and quantified with an ASI-V autosampler and TOC-VCSN analyzer (Shimadzu, Kyoto, Japan).
2.5. Data Analysis and Quality Control
The electrical energy efficiency for E. coli mitigation using each electrochemical treatment was analyzed using the electrical energy per order magnitude reduction (EEO) metric [43]. The average voltage during each test was used to compute the power input to each treatment.
Positive controls (no power applied) were conducted for E. coli, iron, DOC, and free chlorine generation. The maximum loss of E. coli was 0.04 ± 0.03 logs, illustrating that no substantial losses occurred in the system in the absence of applied current. The log reduction of E. coli in all experiments was quantified as shown in Equation (2):
where No is the initial concentration of E. coli (CFU/mL) and N is the final concentration (CFU/mL).
All experiments were performed in triplicate. Analysis of significant variables affecting EC and EO performance under varying pH and model water type was performed by multivariate ANOVA using the ‘stats’ package in R [44]. All other statistical analyses were conducted using GraphPad Prism version 7 at a significance level of α = 0.05 for t-test, two-way ANOVA, and Tukey’s post hoc tests.
3. Results
3.1. Impact of Water Quality on E. coli Mitigation
E. coli mitigation in the four water matrices was evaluated using EO alone compared to a sequential EC-EO process to assess the potential of the EC-EO process to improve bacteria removal beyond the levels achieved using EO alone.
3.1.1. E. coli Mitigation by EO
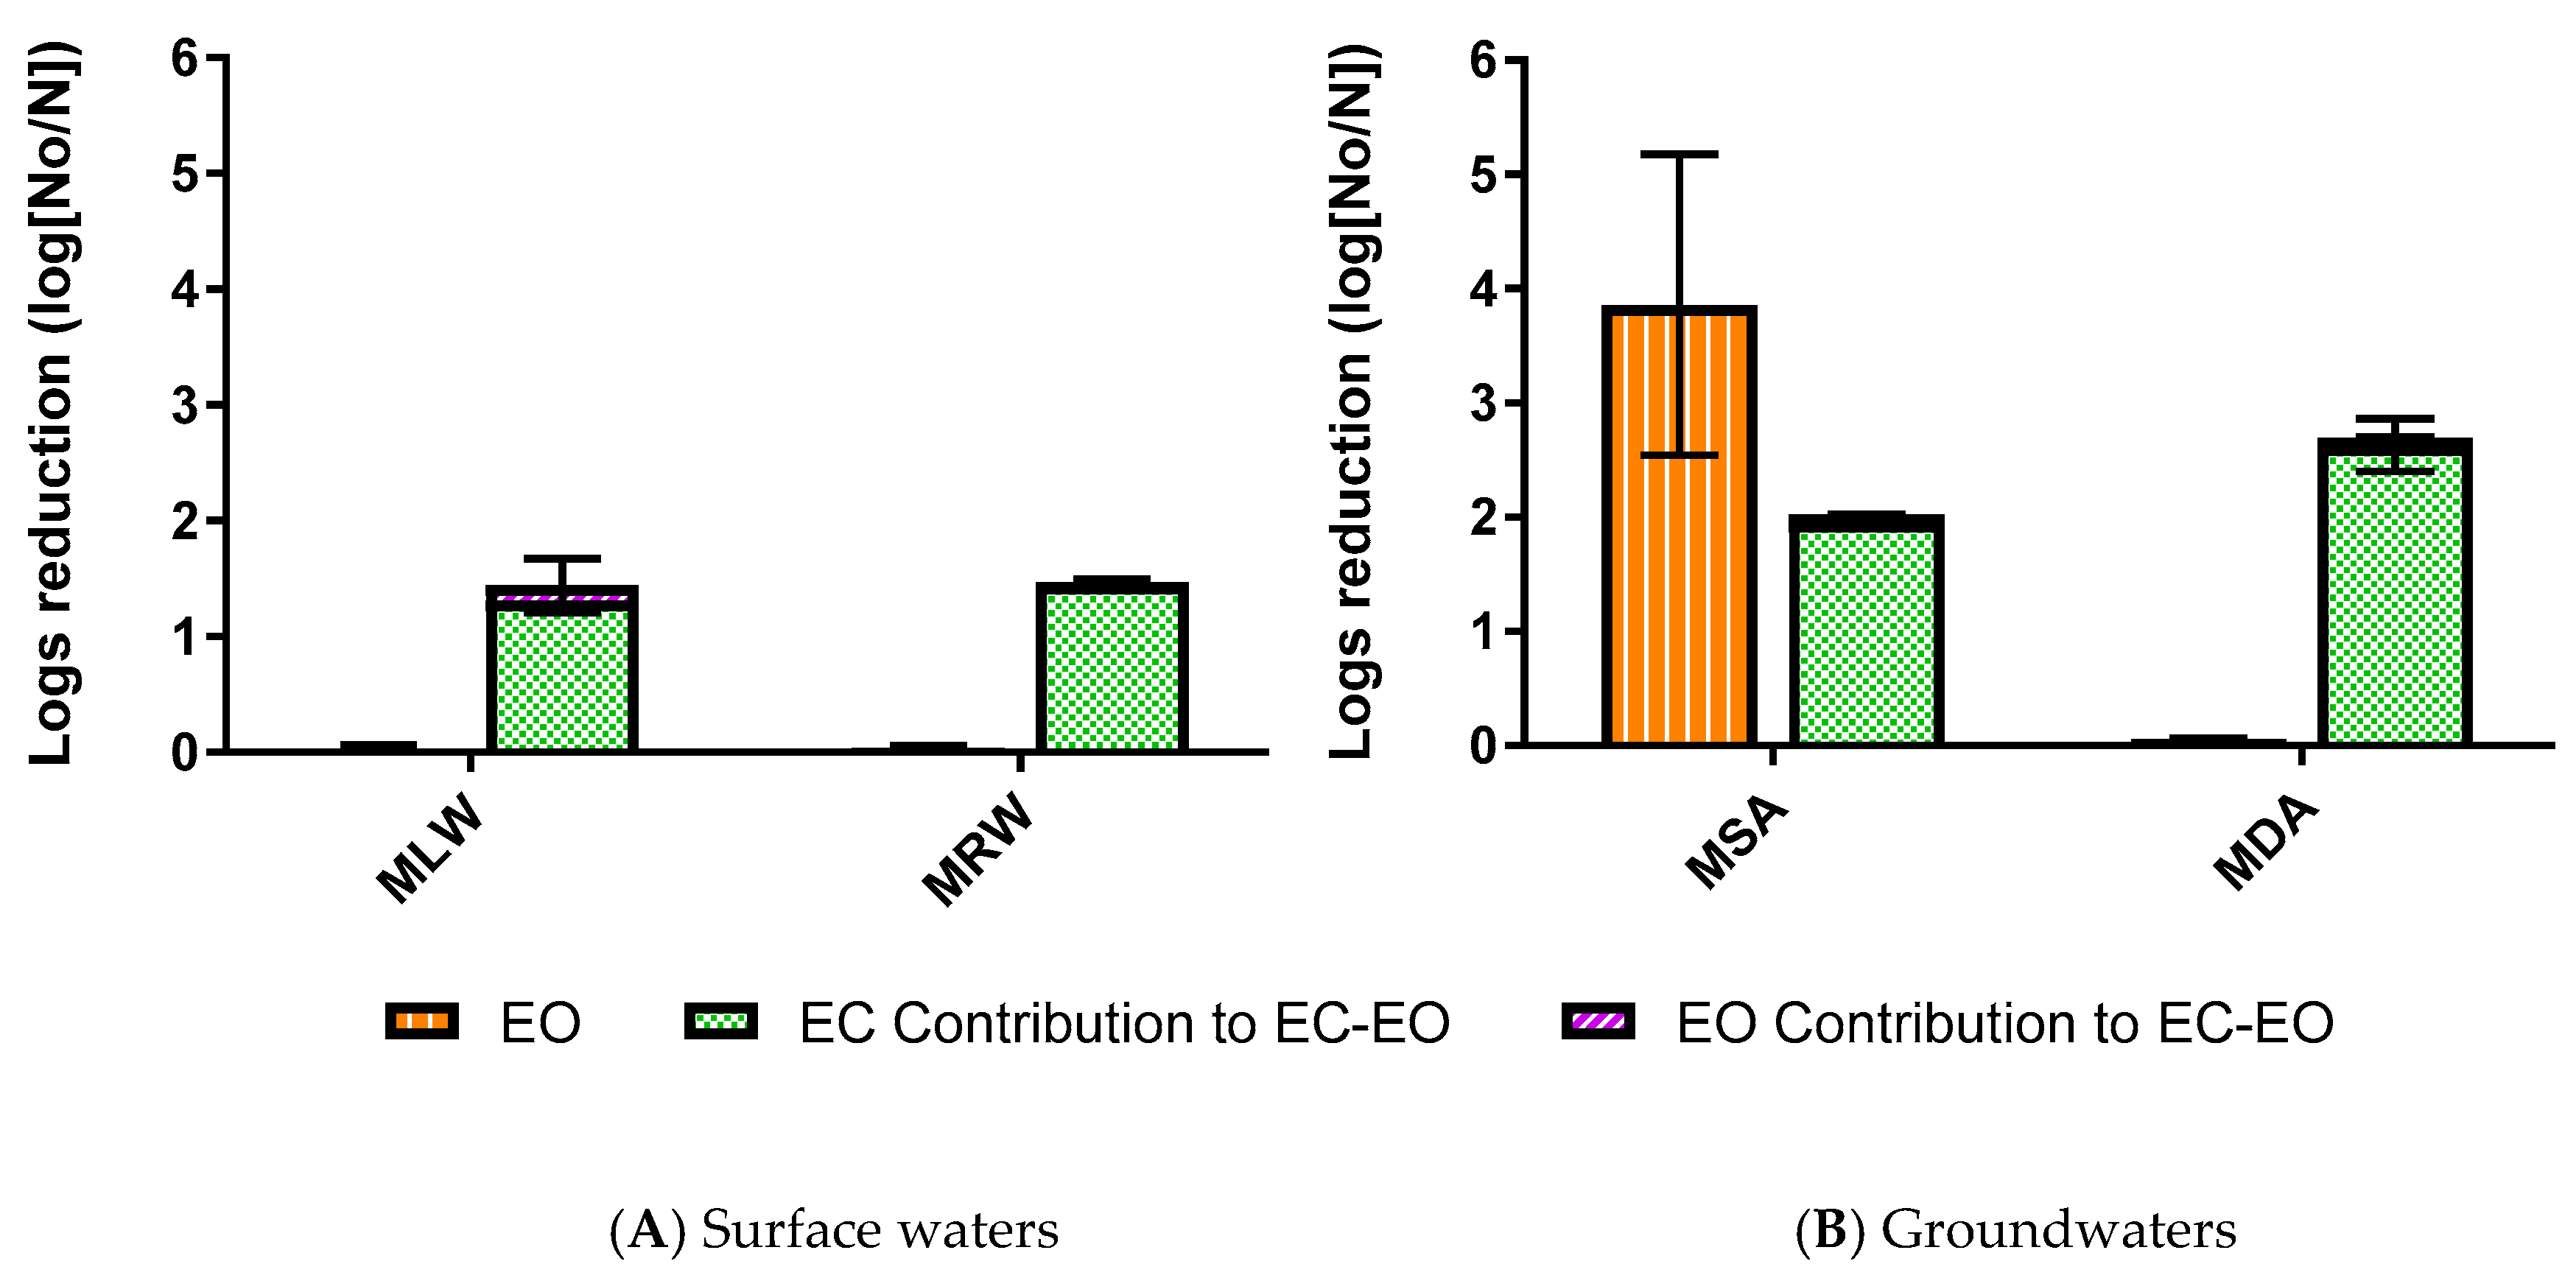
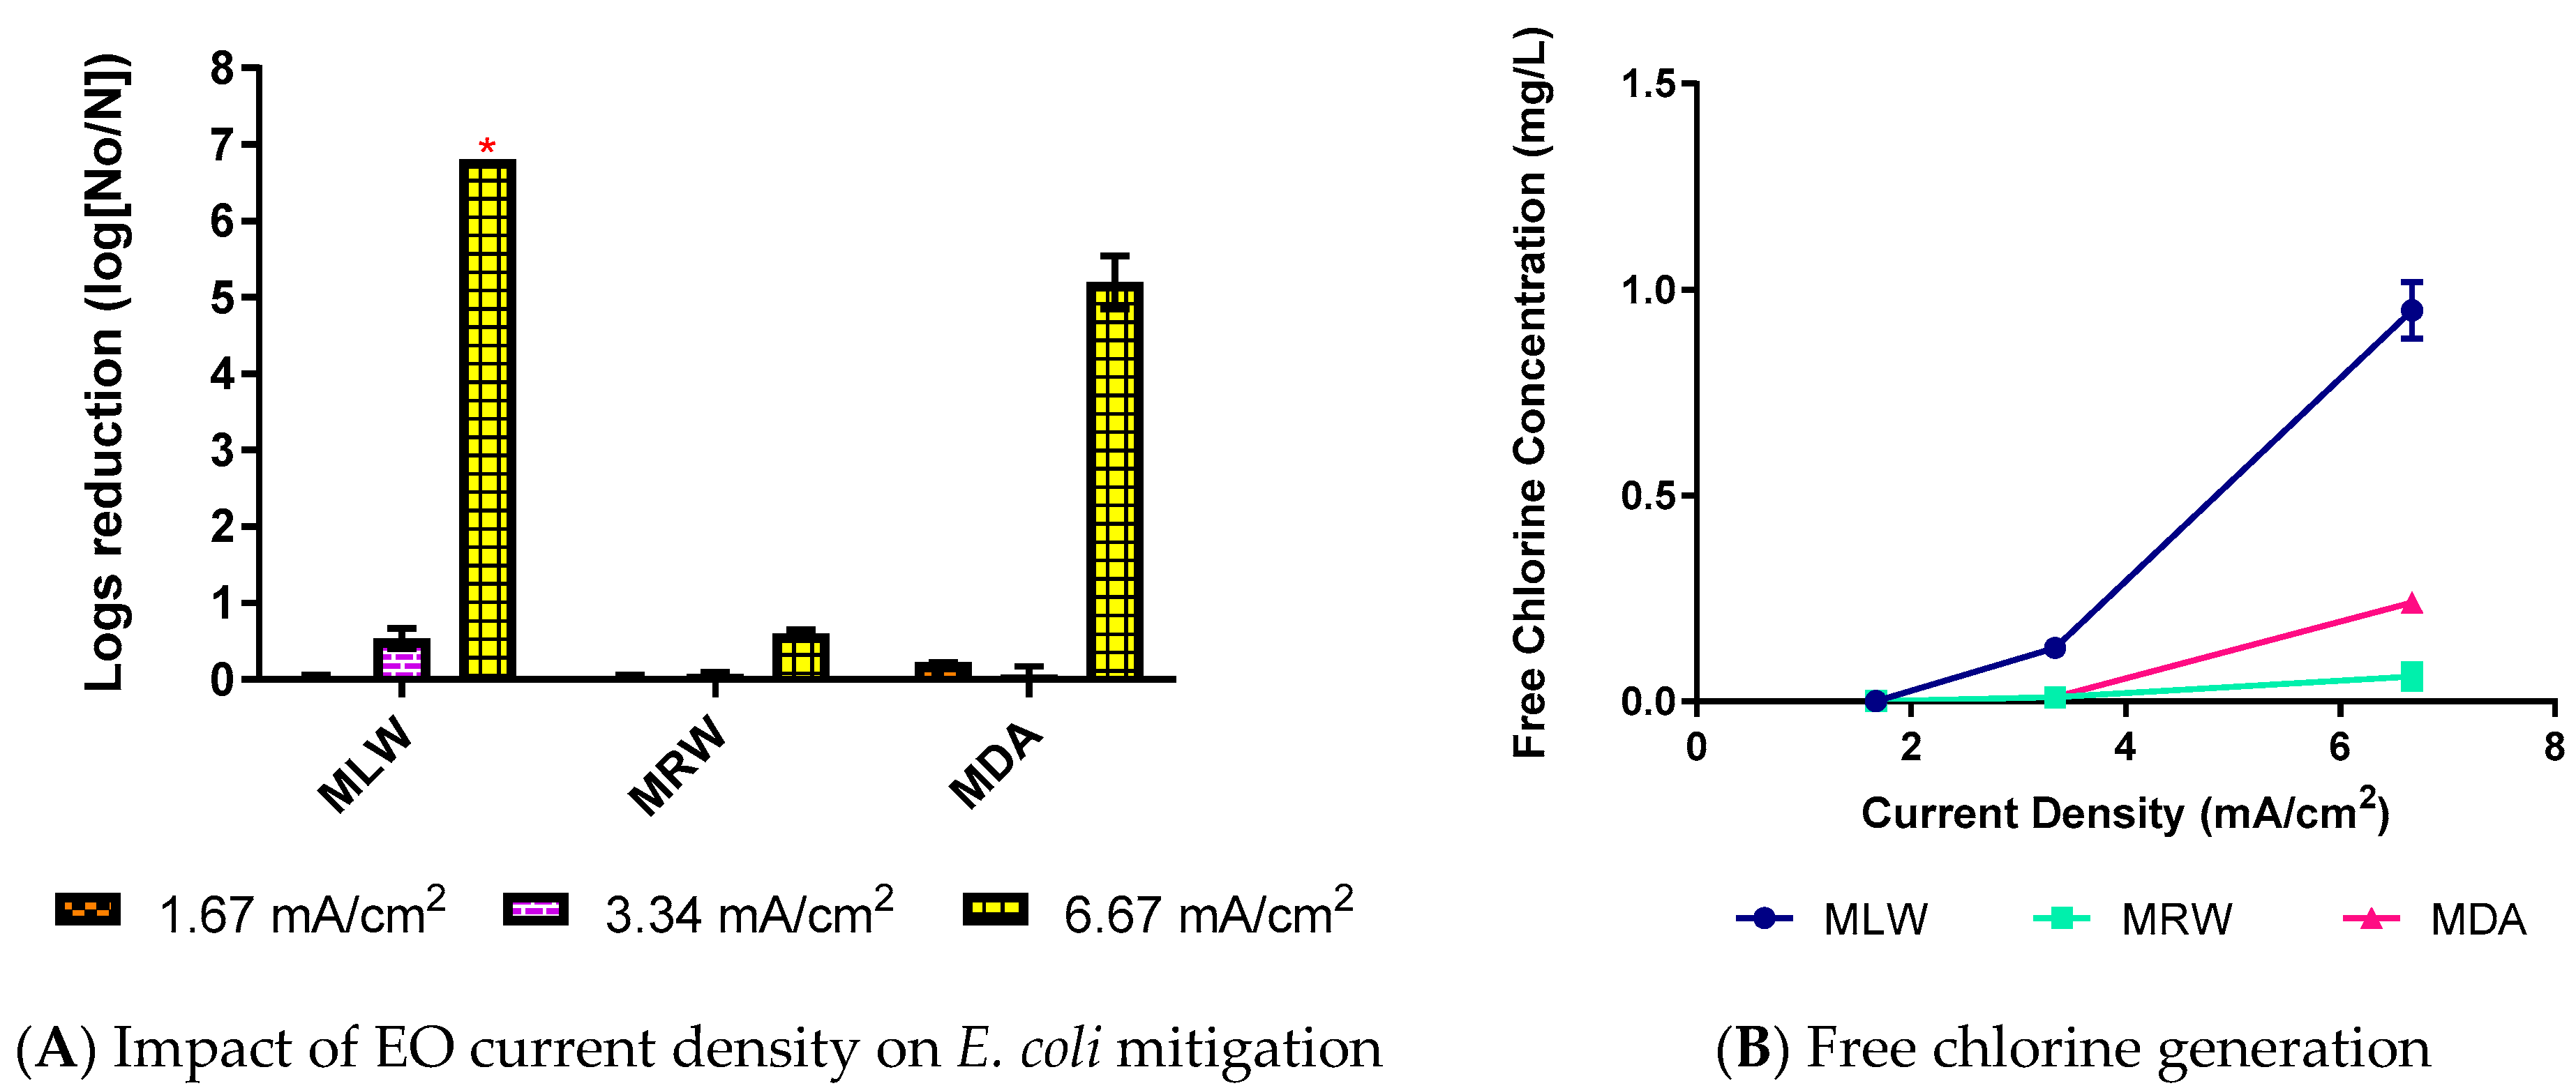
An EO current density of 1.67 mA/cm2 was insufficient to reduce E. coli concentrations in the model waters, apart from the model shallow aquifer (Figure 2). High E. coli mitigation in the model shallow aquifer was most likely due to the water’s high chloride concentration (70.4 mg/L Cl−), which was five times greater than the next highest chloride concentration. The higher chloride concentration resulted in greater free chlorine generation (0.074 ± 0.008 mg/L, data shown in Appendix A, Table A1). To assess the impact of increased free chlorine generation in the other waters, higher current densities were tested. The EO current was doubled and quadrupled in the model lake water, model river water, and model deep aquifer, as shown in Figure 3. The model shallow aquifer was not included in these tests as substantial E. coli mitigation was observed at lower current densities (Figure 2). Similar to other investigations [25,45], the increased current led to higher free chlorine production and greater E. coli mitigation.
The presence of NOM in the surface waters, and its associated consumption of oxidants, could be a limiting factor for E. coli inactivation. This is illustrated when comparing the free chlorine generation for the two surface waters at the increased current densities (Figure 3B). The model lake water and the model river water had similar initial chloride concentrations (13.3 and 11.4 mg/L Cl−, respectively), yet significantly different final concentrations of free chorine (p < 0.01). The high concentration of NOM in the model river water (8 mg/L) likely consumed the free chlorine, which limited E. coli inactivation. For comparison, the model lake water contained 2.7 mg/L DOC. Moreover, the presence of NOM would contribute to greater DBP formation. Therefore, a pretreatment ahead of EO, e.g., EC, may improve NOM removal and overall treatment of surface waters.
3.1.2. E. coli Mitigation by EC-EO
As shown in Figure 2, EC alone accounted for ≈1 to 2 logs reduction of E. coli in the various model waters. The model groundwaters experienced higher E. coli mitigation than either surface water. Statistically greater E. coli mitigation was achieved in the model deep aquifer compared to the model lake water and model river water (p = 0.0043 and 0.0167, respectively). The limited removal of E. coli in the two surface waters could be attributed to competition between NOM and E. coli. NOM removal occurred in both surface waters, with significantly more removal in the model river water (61.7 ± 7.8%) compared to the model lake water (8.2 ± 4.1%). This could be a result of the higher initial concentration of NOM in the model river water (data shown in Appendix A, Table A1). Notably, previous studies have reported mixed findings in the influence of NOM on microbial attenuation during EC. Tanneru and Chellam (2012) [46] observed inhibition of virus removal with increasing NOM while Delaire et al. (2015) [8] reported no significant interference in bacterial removal.
E. coli removals in the two groundwaters were slightly lower than the approximately 3-log removal reported by Delaire et al. (2015) [8] when applying a similar EC dose (1.5 mM Fe) to a synthetic groundwater. Variances in water quality parameters could explain this difference, especially the 320 mg/L of chloride added to the groundwater by Delaire et al. (2015) [8]. High chloride has the ability to limit the impact of ions like carbonate or sulfate, which can form an insulating layer on the electrode’s surface, thereby decreasing current efficiency [16]. Additionally, Delaire et al. (2015) [8] flocculated for 90 to 120 min and then settled overnight, which could allow more E. coli-seeded flocs to settle out of solution compared to the 10-min flocculation and 15-min settling periods used here. Ndjomgoue-Yossa et al. (2015) [10] also reported similar levels of E. coli reduction (approximately 1.5 logs using 10 mA/cm2 EC with steel electrodes); however, their study was performed using an artificial wastewater, which would have different characteristics than the water matrices used in this investigation.
In contrast to the hypothesis, the fraction of E. coli mitigation attributed to EO during the EC-EO process remained very low, accounting for insignificant levels of E. coli mitigation beyond EC alone in all of the water matrices (Figure 3). This may stem from the increase in pH inherent to EC treatment (1.3 to 1.6 pH units, as shown in Appendix A, Table A1), which would influence free chlorine speciation toward hypochlorite, which is a much less effective disinfectant than its conjugate acid, hypochlorous acid (pKa 7.54) [47].
Another possible reason for ineffective inactivation of E. coli during the EO stage of EC-EO was the presence of total residual iron that passed through particle separation following EC treatment. More than 10 mg/L total iron was present during EO after EC pretreatment. Dissolved iron species can consume free chlorine [21], and even at high pH, dissolved iron may be present, although most of the total iron will be insoluble [39]. However, low concentrations of dissolved iron could be sufficient to consume the small amount of free chlorine generated by EO under these operating conditions. Indeed, a lower concentration of free chlorine was measured in the EC-EO-treated water (0.010 ± 0.014) compared to the EO-only (0.074 ± 0.008) treatment for the model shallow aquifer (shown in Appendix A, Table A1). Heffron et al. [34] similarly found that low iron concentrations (0.5 mg/L Fe) inhibited virus inactivation during EO treatment. Enhanced NOM removal during EC, improved total iron removal following EC, or higher EO current densities may improve free chlorine generation and concordant E. coli mitigation.
3.2. Impact of Enhanced EC-EO for E. coli Mitigation
In the second phase of this study, the influence of decreased pH on E. coli mitigation using electrochemical processes (enhanced EC-EO) was investigated in the two model surface waters (since NOM is not present in the groundwaters and EO alone was capable of E. coli mitigation, enhanced EC-EO was not tested for the groundwaters). Electrochemical treatment studies have shown that lower initial pH benefits both EC and EO [8,14,19,48]. Additionally, the final pH in all cases was above the U.S. EPA’s Safe Drinking Water Act secondary drinking water standards of 8.5, demonstrating the need for pH adjustment before or after treatment. However, the degree of improvement in E. coli mitigation using lower initial pH values for sequential EC-EO has yet to be reported in drinking waters. We hypothesized that decreased pH would enhance E. coli mitigation by improving NOM removal and/or potentially shifting chemical species towards those promoting physical removal via adsorption (e.g., greater charge neutralization vs. sweep flocculation) or inactivation via stronger chemical oxidants (e.g., HOCl vs. OCl−). The NOM removal achieved in this study was not intended to satisfy DBPR standards in all water types but rather to demonstrate the impact of NOM removal on E. coli disinfection.
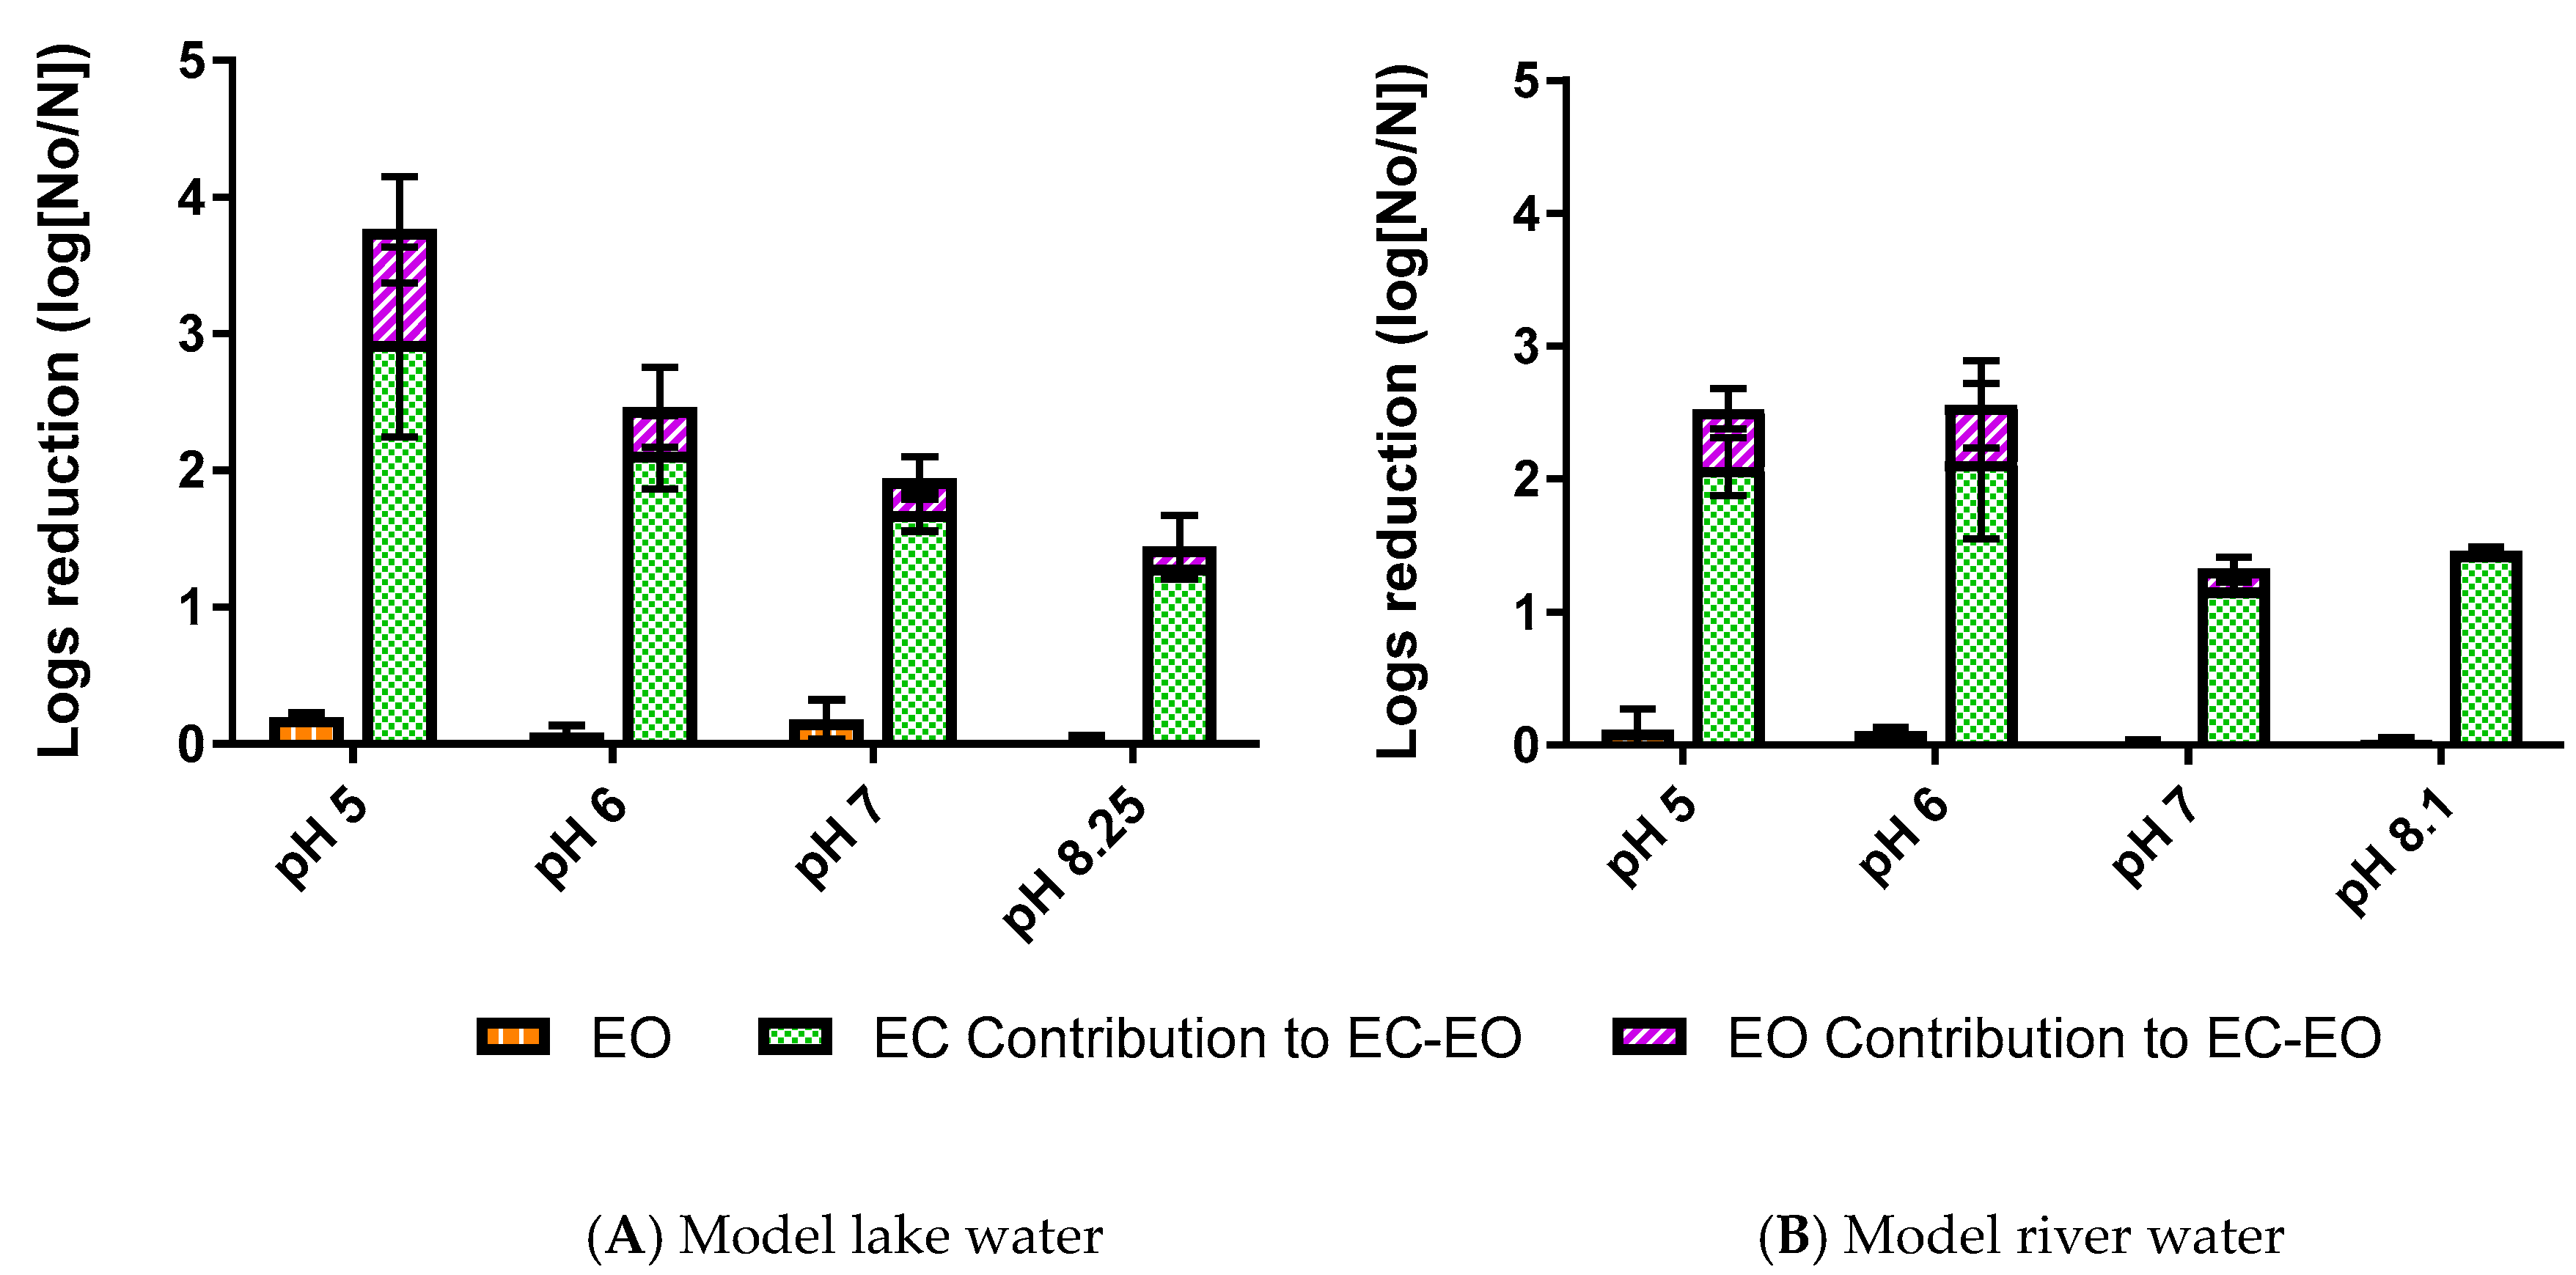
As shown in Figure 4, EO alone provided negligible E. coli reductions, regardless of pH adjustment (p > 0.9999), reaffirming the earlier observation that some form of pretreatment is needed prior to EO when treating surface waters.
During the EC stage of EC-EO treatment, improvements in E. coli mitigation were observed using EC alone for initial pH values of 6 or lower, similar to reports by Delaire et al. (2015) [8]. Overall, EC-EO performed statistically better (p = 0.021) than EC alone, though this trend was most apparent at low pH. Notably, only E. coli mitigation in the model lake water for pH 5 versus the baseline pH (8.25) was statistically different (p < 0.0001) in a post-hoc comparison of means. One possible reason for the improved E. coli mitigation at lower pH levels is that the distribution of metal hydroxide species shifts toward higher valence species, which shifts the mechanism of physical removal (e.g., charge neutralization dominates vs. sweep flocculation) [47]. However, zeta potential measurements of E. coli and EC precipitates indicate that charge neutralization is unlikely between these two negatively charged species [8]. Nonetheless, heterogeneity in cell surface charge, hydrophobic interactions, and hydrogen or covalent bonds could contribute to physical removal of E. coli during EC [8]. In particular, specific interactions between EC precipitates and the phosphate functional groups on cell surfaces appears to be a primary driver of physical removal of bacteria during EC [49].
Beyond physical removal, as the pH drops, E. coli inactivation may play an increasingly important role during EC. For example, the oxidation rate of ferrous to ferric iron is slower at lower pH (Equation (3) [50]), resulting in a greater prevalence of reactive iron species [12,51]. Thus, lower pH leads to higher ferrous iron concentrations, which are capable of inactivating E. coli and viruses due to ferrous iron oxidation [8,28,51,52].
where [i] represents the molar concentration and k is the rate constant.
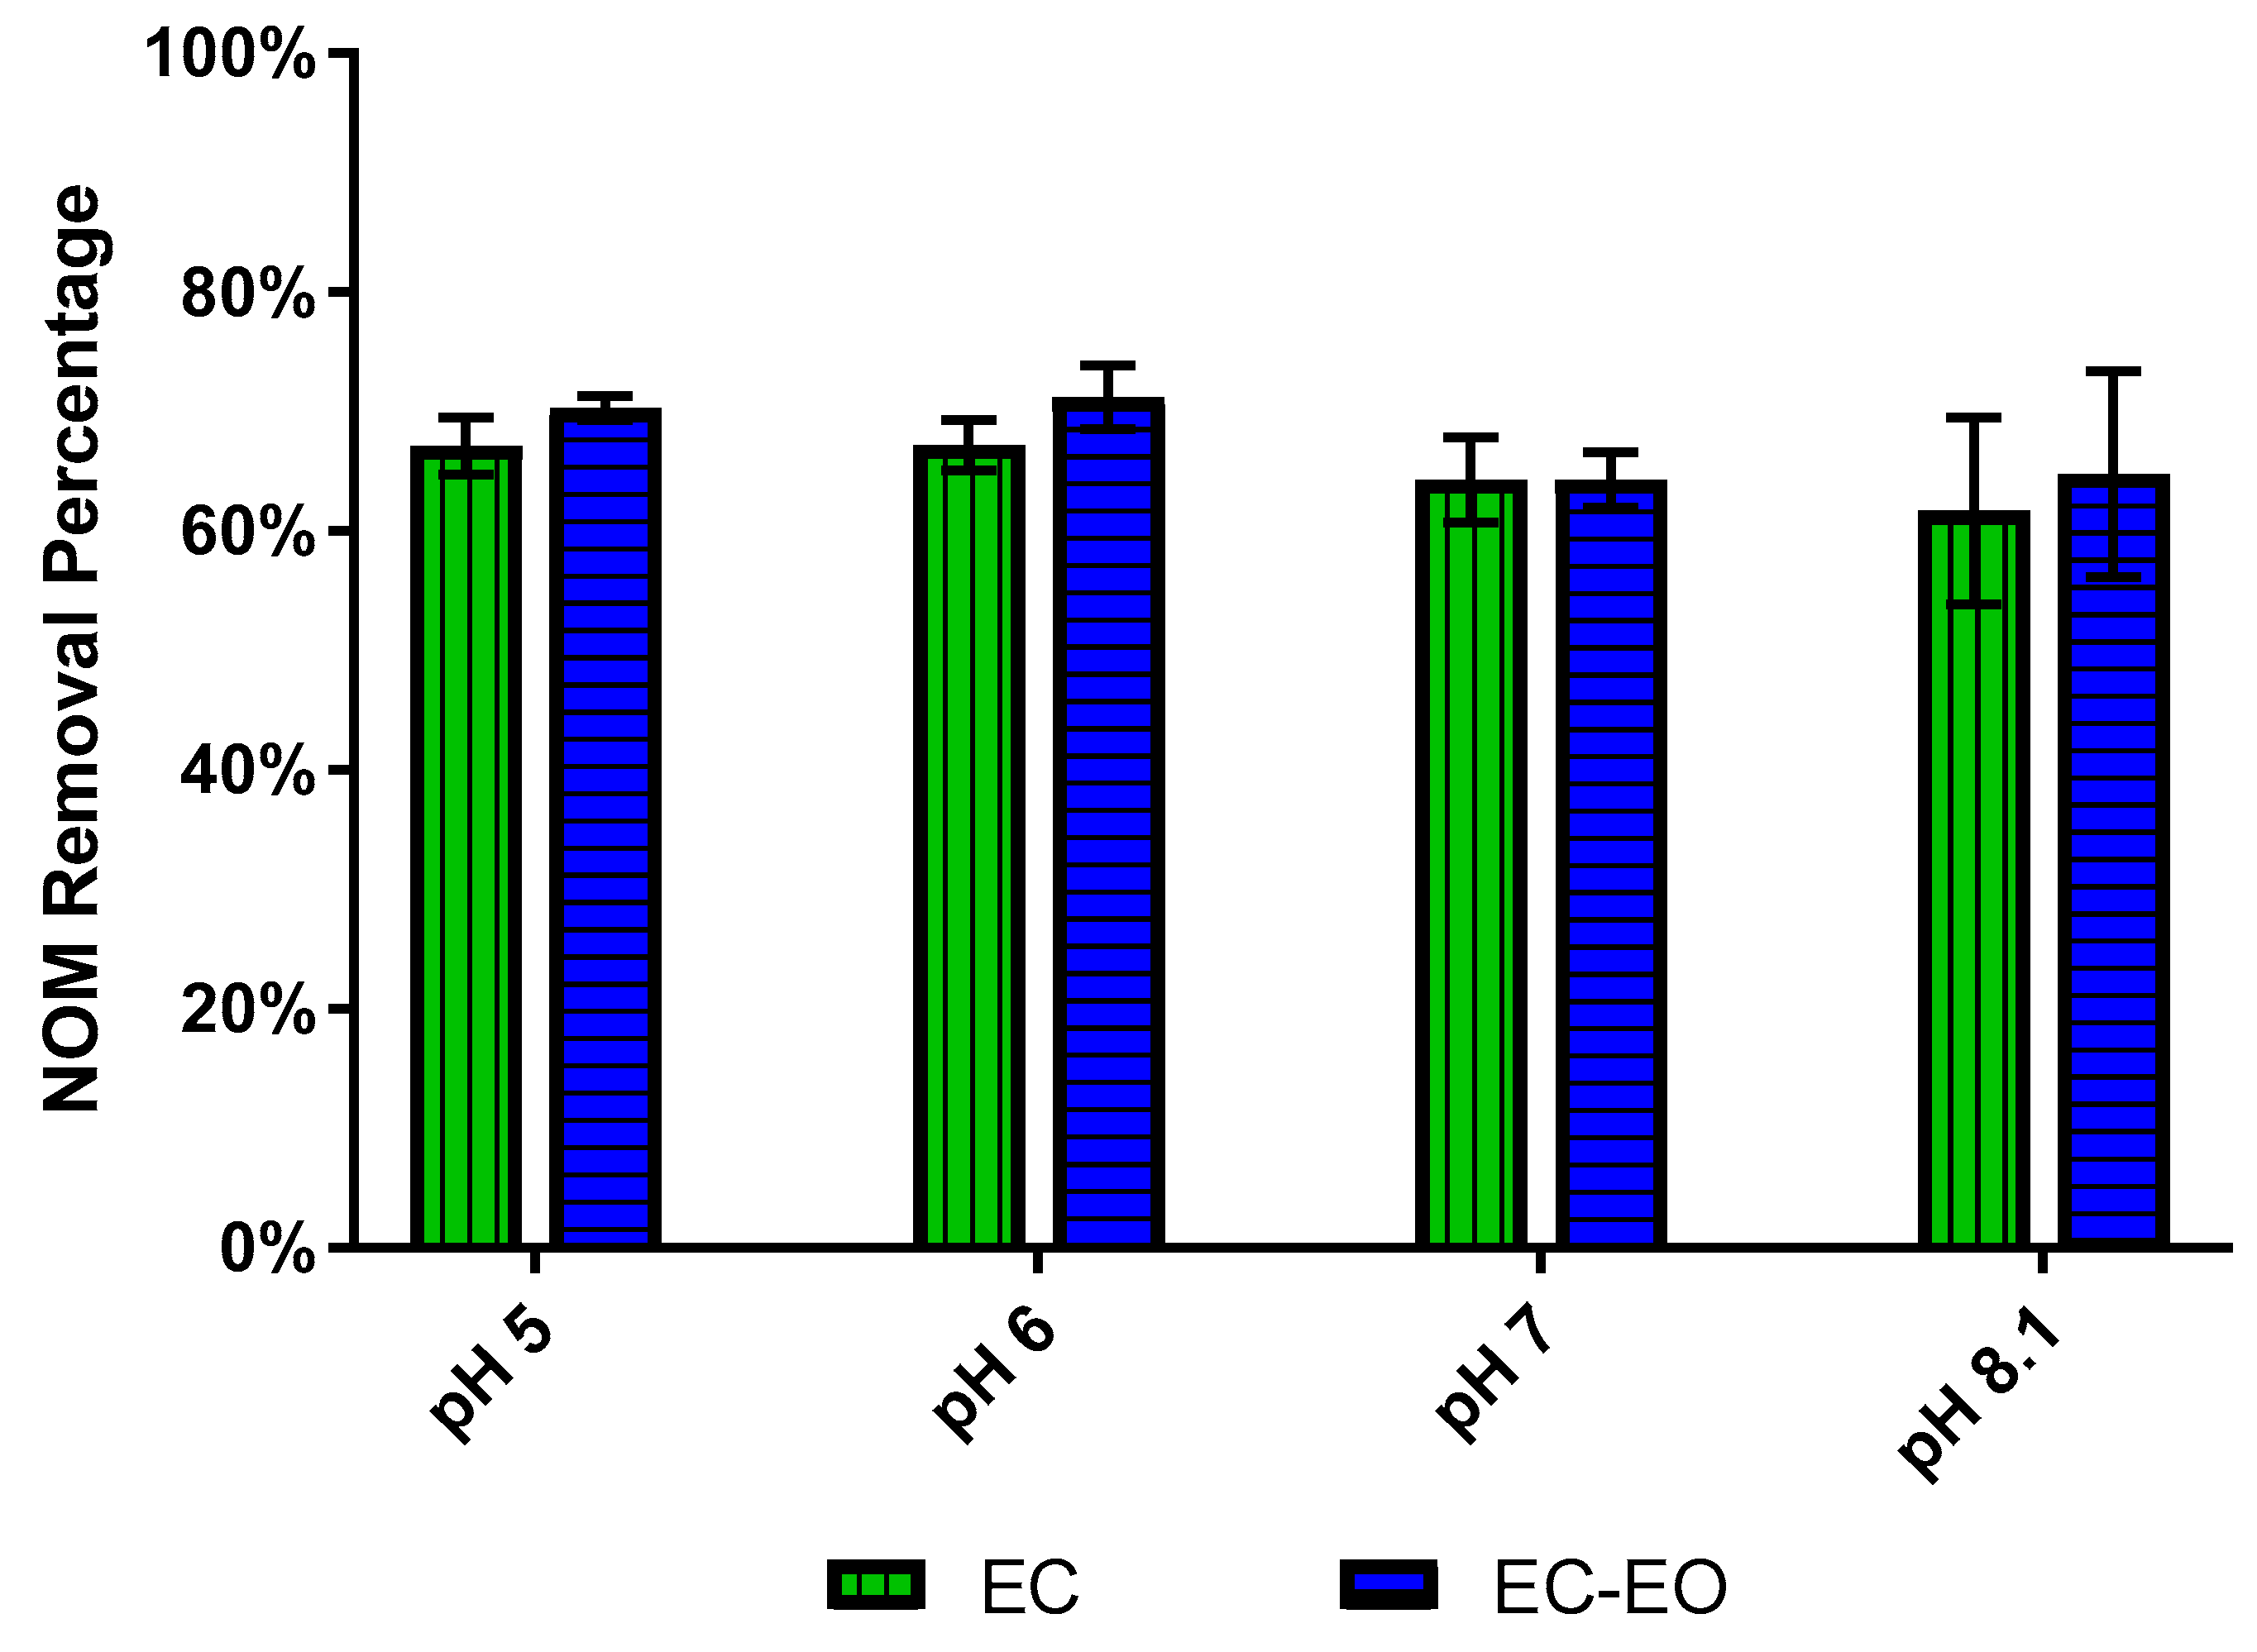
Decreased pH was hypothesized to increase E. coli removal using EC-EO as NOM removal was expected to increase [14]. However, approximately 64% NOM removal was consistently achieved regardless of the initial pH in this investigation (p > 0.84, data shown in Appendix A, Figure A2). The NOM concentration in the model river water did not drop below 1.9 mg/L after EC treatment, regardless of pH. This lack of improvement in NOM removal possibly explains the lack of improved E. coli mitigation by EC-EO, since the remaining NOM could consume the oxidants formed during EO. The applied total iron dose (82 mg/L Fe) may have reached the point of diminishing return (PODR), as described in the U.S. EPA’s Enhanced Coagulation and Enhanced Precipitative Softening Guidance Manual. If this was the case, lower total iron doses together with pH adjustment may better optimize NOM removal. Vepsäläinen et al. (2009) [14] showed similar changes in percent NOM removal by EC as a function of initial pH using the highest specific charge, which correlates to the highest coagulant dose.
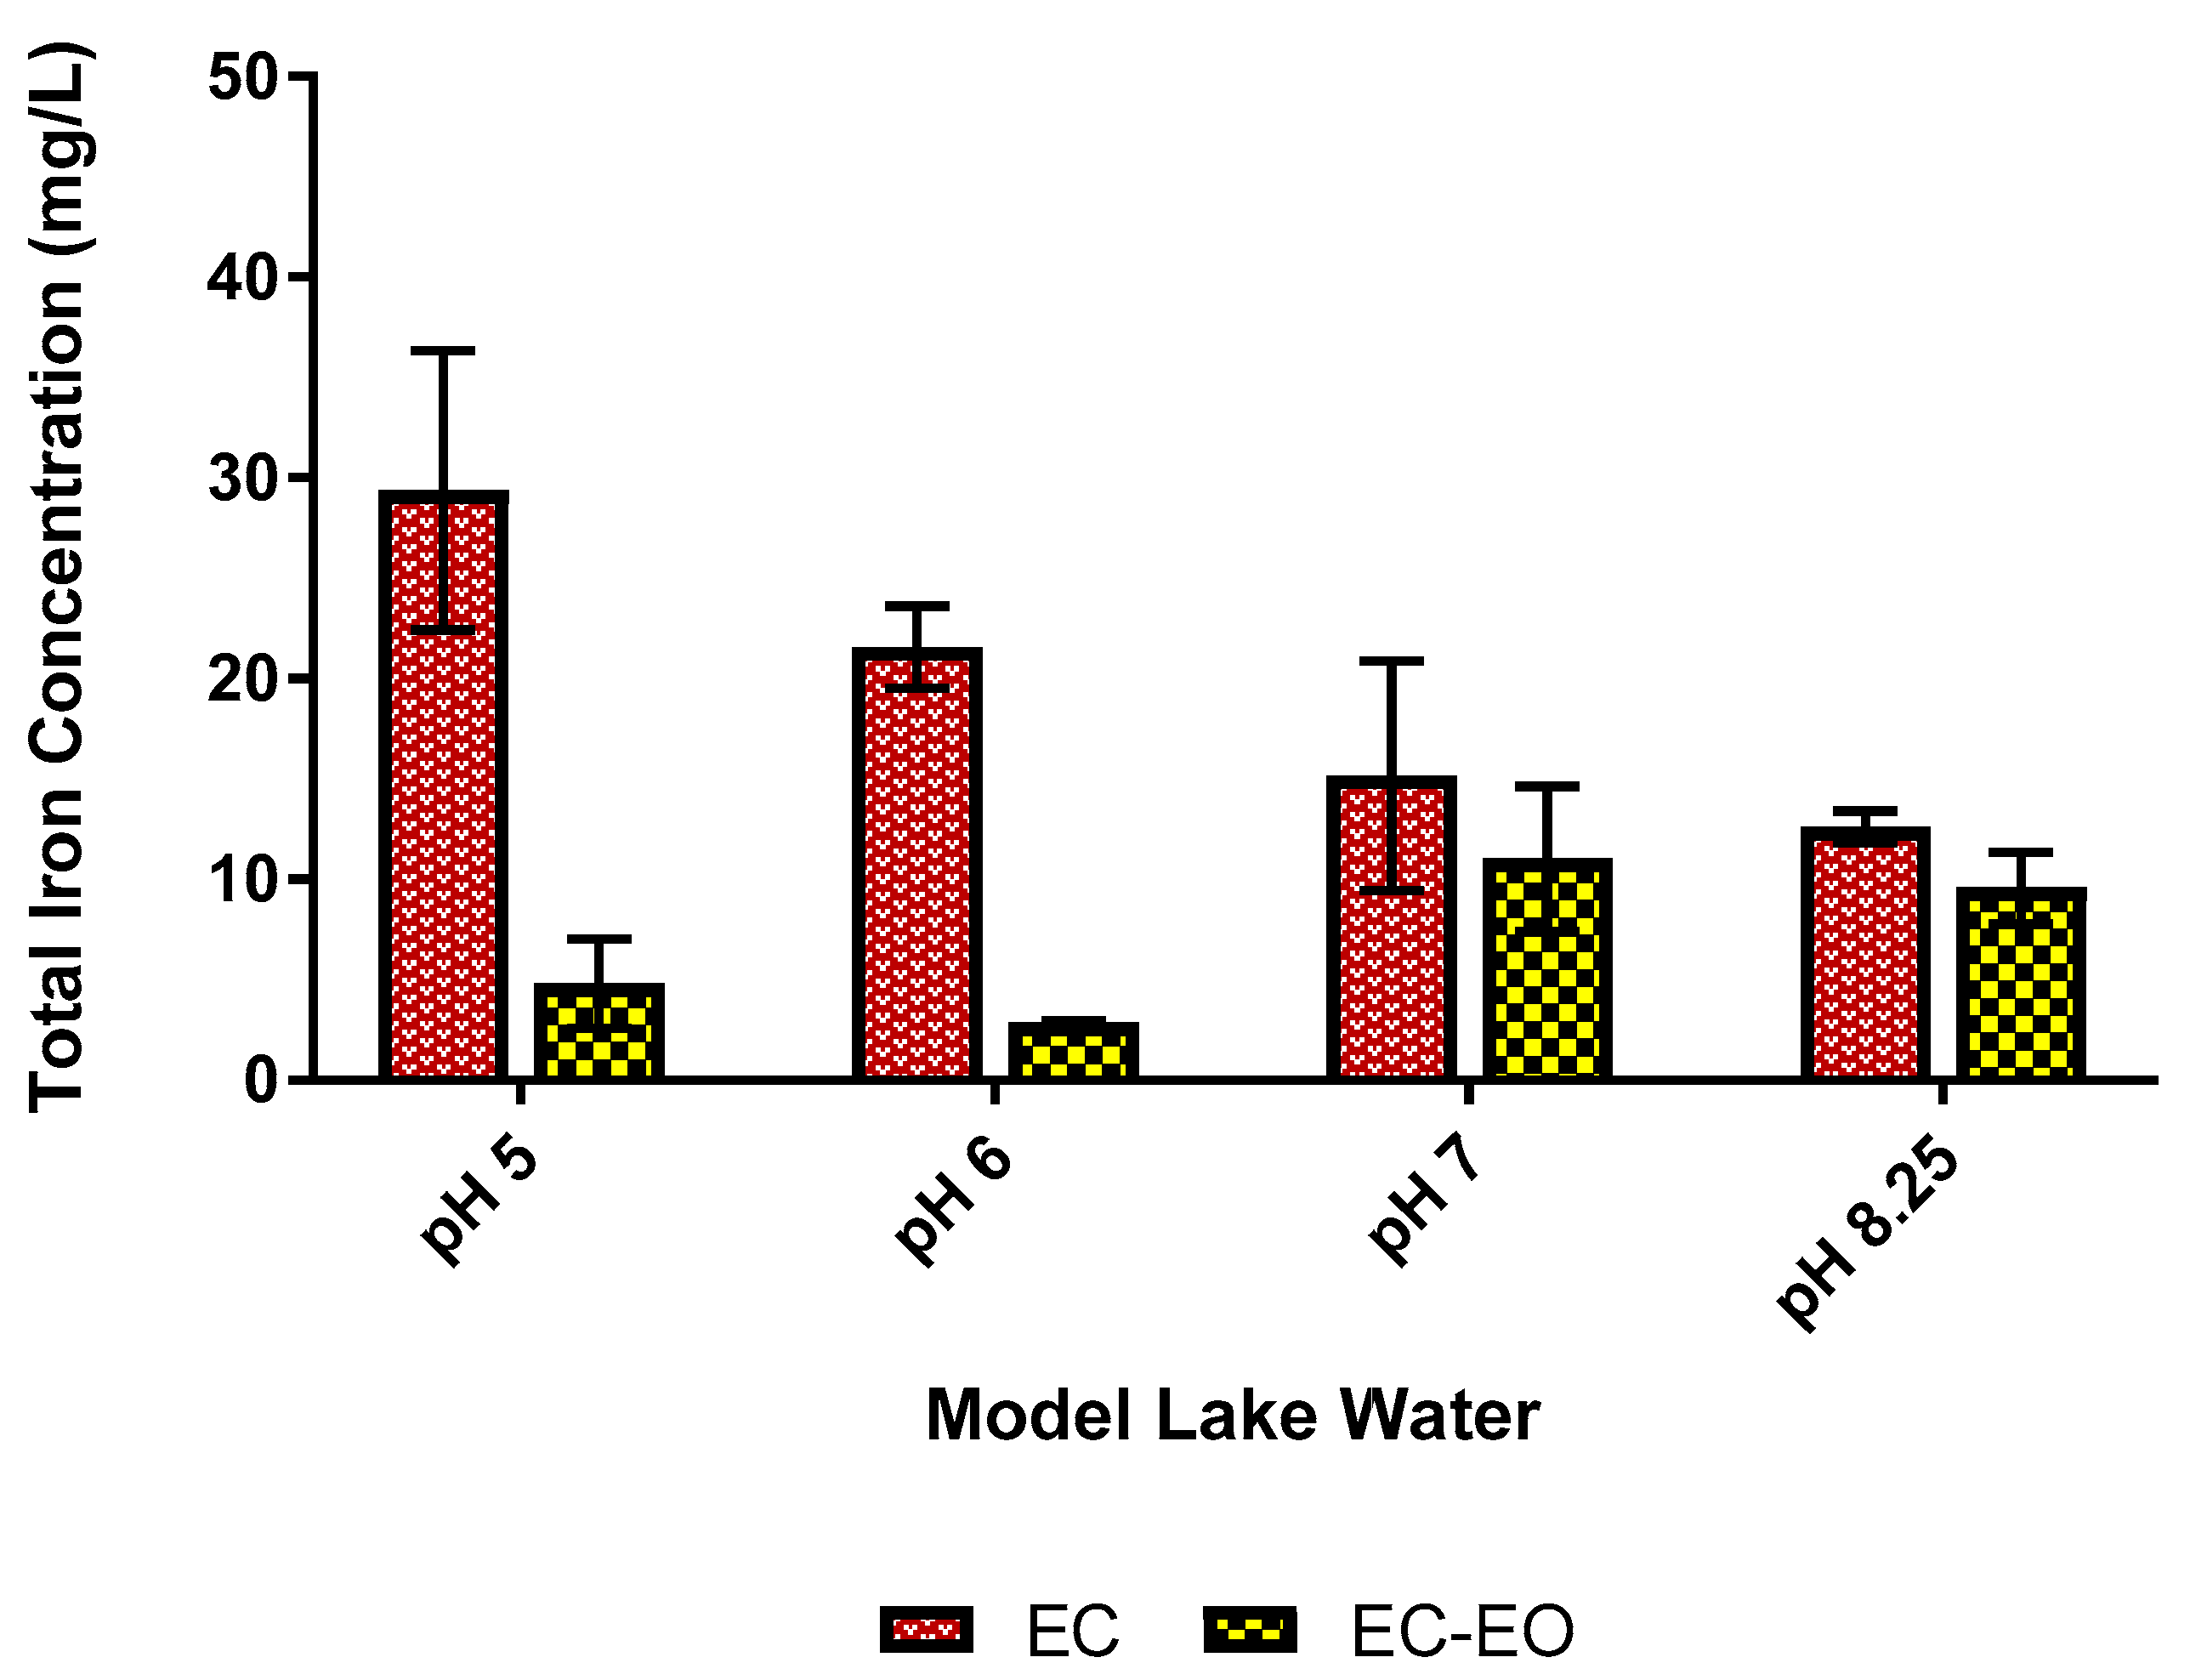
EC-EO with pH adjustment may have been impaired by high total residual iron concentrations. Ferrous iron is more soluble at a lower pH than at the baseline condition of pH 8.25; as such, it may pass through the filter during particle separation and increase EC total residual iron [37]. Indeed, Figure 5 shows that total residual iron concentrations increased with decreasing pH in the model lake water. At pH 6 and 8.25, the fraction of total iron in the ferrous iron form was 40 ± 5% and 7 ± 1%, respectively. The higher ferrous levels at lower pH may have contributed to increased consumption of free chlorine during EO, which would detract from E. coli mitigation. This may help to explain why EC-EO did not show more dramatic improvement over EC alone.
Despite the relatively minor role of EO in the EC-EO process, E. coli mitigation by EO increased at lower pH. At pH 5 and 6, there was a 4-fold increase during EO compared to pH 8.1 in the model river water (shown as EO’s contribution to EC-EO in Figure 5). Similarly, the model lake water demonstrated 8 and 3 times greater E. coli mitigation by EO following EC at pH 5 and 6, respectively, compared to pH 8.25. Following EC, the pH increased by about 1 to 1.5 pH units (shown in Appendix A, Table A2), which may have impacted E. coli mitigation during EO as pH strongly influences parameters such as speciation of free chlorine and iron. For initial pHs of 5 and 6, the final pH following EC-EO remained below the pKa of HOCl (7.54), thereby shifting the free chlorine toward the more effective HOCl form. However, the shift in speciation may not have improved E. coli mitigation as low levels of free chlorine were measured in all cases (data shown in Appendix A, Table A1).
As discussed previously, lower pH also slows the rate of oxidation of ferrous to ferric iron, thus generating a lower effective dose of ferric coagulant. The formation of orange flocs (indicating ferric iron) was observed in both surface waters after EO when pretreated by EC at pH 5 and 6. Oxidants generated during the EO process accelerate the oxidation of ferrous iron to the ferric form. Conversion of ferrous iron was observed using EO in the model lake water at pH 8.25 and pH 6. In both cases, 95 ± 0.6% of the residual ferrous iron was converted during EO. Although the percent conversion was similar for both pH values, the magnitude of the concentrations was noticeably different. At pH 6, the ferrous iron concentration was 10.2 ± 2.8 mg/L, whereas the ferrous concentration without pH adjustment was only 1.1 ± 0.2 mg/L. Since more soluble ferrous iron remained after particle separation at low pH (Figure 6), EO may have increased E. coli mitigation at low pH by completely oxidizing the iron to allow for continued coagulation.
In addition, oxidation of ferrous iron can lead to Fenton-like reactions [26,27,28]. Fenton’s reaction occurs when ferrous iron is oxidized by hydrogen peroxide to form hydroxyl radicals and ferric iron [28]. Hydrogen peroxide can either be directly added or can be generated during EO, e.g., through a two-electron transfer of oxygen and zero-valent iron, which is formed when iron is reduced at the cathode [26,28]. Fenton’s reaction typically occurs at low pH; however, Anfruns-Estrada et al. (2017) [27] demonstrated that electro-Fenton reactions, with in-situ formation of hydrogen peroxide, can inactivate E. coli in wastewater at a neutral pH. Electro-Fenton reactions could explain the marginal increase in E. coli mitigation by EO following EC pretreatment (EC’s contribution to EC-EO) at pH 5 and 6 compared to EO operated independently (Figure 4). Further investigation is required to determine if the E. coli mitigation observed during the EO stage of sequential EC-EO was due to physical removal or oxidation via Fenton’s reaction.
3.3. Electrical Efficiency of Electrochemical E. coli Mitigation
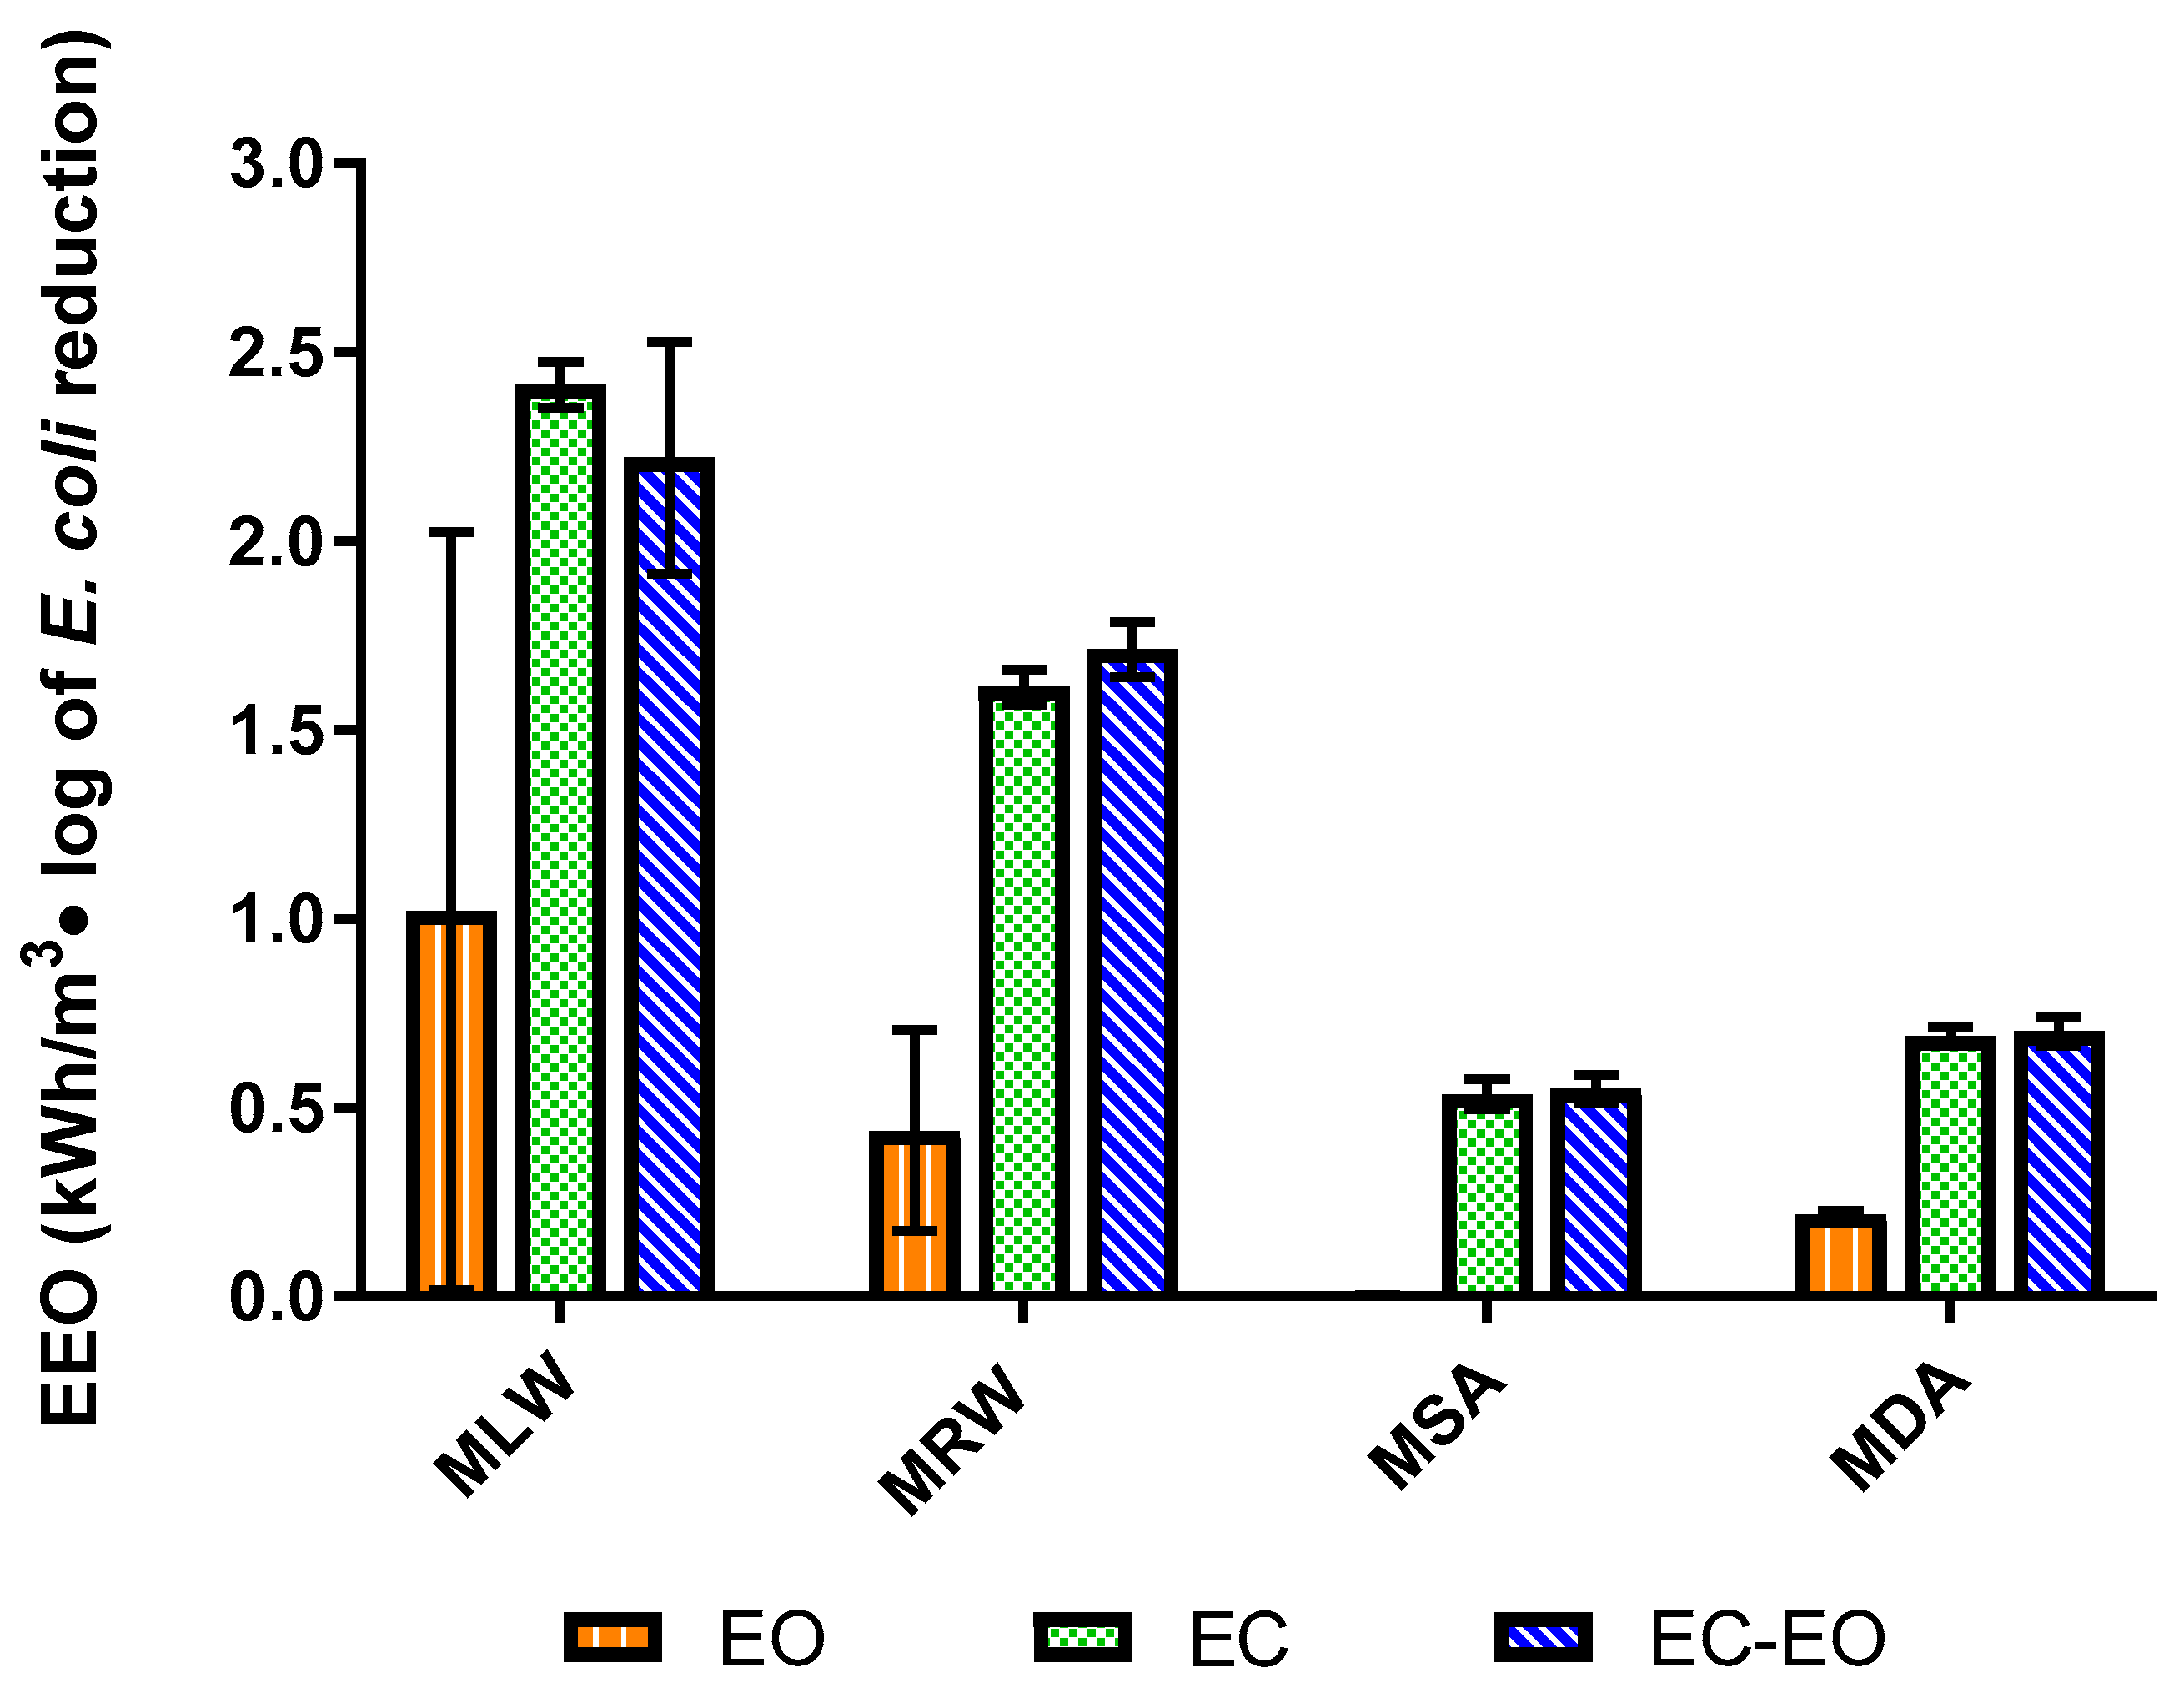
Figure 6 shows the electrical energy per order magnitude of E. coli mitigation (EEO) for each process tested in the different water matrices. A lower EEO value demonstrates that lower energy input was required for E. coli mitigation. In all four waters, the EEO for EO alone was lower than EC and the sequential EC-EO process. In this study, the applied EO current density was less than that applied during EC. However, using an increased EO current density of 6.67 mA/cm2 in the two model surface waters and the model deep aquifer decreased the EEO to less than 0.2 kWh/m3-log of E. coli reduction (data shown in Appendix A, Figure A4). This demonstrates that allocating more power to EO improved the effectiveness and efficiency in E. coli mitigation. Also, of note, EC and EC-EO were essentially equivalent in terms of energy efficiency for E. coli mitigation (Figure 6), further demonstrating that applying a higher current to EO for the sequential process may improve E. coli disinfection efficiency. Overall, EO was a more energy efficient treatment, especially for groundwaters and therefore should be considered for implementation. Further optimization may improve the energy efficiency of the sequential EC-EO treatment train, for example, pH adjustment or optimizing the allocation of energy between EC and EO.
The EEOs of the two surface waters were approximately 2 to 4 times greater than the EEOs of the two groundwaters for all three treatments (EC, EO, and EC-EO). Notably, the applied EC voltage in the groundwaters was approximately 50% lower than that of the surface waters (25% lower for EO) due to higher conductivity in the groundwaters. The combination of lower energy input and higher removal of E. coli accounts for the lower EEO values for groundwater treatment. This further demonstrated the complexity of treating surface water.
4. Conclusions
Sequential EC-EO was evaluated for mitigation of E. coli in four model drinking waters. The results indicated that EC was not an effective pretreatment process for EO for mitigation of E. coli in groundwaters. The addition of iron by EC likely inhibited EO in groundwater due to the consumption of oxidants and high residual iron concentrations after filtration. EO alone was sufficient for E. coli mitigation in groundwaters, providing 4-logs and 5-logs mitigation in the model shallow and model deep aquifer water, respectively, using current densities less than those required for EC. Energy efficiency per order (EEO) of E. coli mitigation for EO alone was less than the EEO of either EC or the sequential EC-EO process in all model waters.
While this study showed that EC-EO improved E. coli mitigation beyond EC alone only after pH adjustment, future process optimization may yield further improvements. For example, optimizing the iron dose for NOM removal would limit the impact of oxidant scavengers. Furthermore, a more effective filtration process, such as granular filtration, would reduce NOM and total iron concentrations in EO influent, which would decrease oxidant demand. Additionally, higher EO current densities should be applied to the sequential EC-EO treatment to enhance mitigation of E. coli. A deeper exploration of the mechanisms of E. coli mitigation in drinking waters during EO when high concentrations of iron are present would also inform future system design.
Author Contributions
Conceptualization, W.L. and B.K.M.; Methodology, W.L., J.H., and B.K.M.; Software, W.L., J.H.; Validation, W.L., J.H.; Formal Analysis, W.L., J.H.; Investigation, W.L.; Resources, B.K.M.; Data Curation, W.L., B.K.M.; Writing—Original Draft Preparation, W.L.; Writing—Review & Editing, W.L., J.H, B.K.M.; Visualization, W.L.; Supervision, B.K.M.; Project Administration, B.K.M.; Funding Acquisition, B.K.M.
Funding
This research was funded by the Emerging Technologies program under the EPA’s Water Innovation Network for Sustainable Small Systems (WINSSS) Center under US EPA Star Grant 83560201.
Acknowledgments
We gratefully acknowledge Kyana Young’s assistance with microbial lab training, Mike Dollhopf’s assistance in processing ICP-MS samples, and Kyra Ochsner’s experimental assistance.
Conflicts of Interest
The authors declare no conflict of interest.
Appendix A

Table A1.
Final water quality parameters for each treatment process (EC, EO, and EC-EO) in each of the model drinking water matrices. Values represent averages from triplicate tests with ±1 standard deviation.
Table A1.
Final water quality parameters for each treatment process (EC, EO, and EC-EO) in each of the model drinking water matrices. Values represent averages from triplicate tests with ±1 standard deviation.
| Treatment Process | Parameter | Water Matrix | |||
|---|---|---|---|---|---|
| Model Lake Water | Model River Water | Model Shallow Aquifer | Model Deep Aquifer | ||
| EC | Final pH | 9.59 ± 0.13 | 9.55 ± 0.07 | 8.93 ± 0.14 | 9.13 ± 0.07 |
| NOM Removal % | 8.2 ± 4.1 | 61.7 ± 7.8 | N/A | N/A | |
| Free Chlorine (mg/L) | BDL | BDL | BDL | BDL | |
| Total Residual Iron (mg/L) | 12.6 ± 0.8 | 11.2 ± 0.7 | 17.1 ± 0.8 | 15.2 ± 4.0 | |
| EO | Final pH | 8.01 ± 0.03 | 7.98 ± 0.07 | 7.78 ± 0.02 | 7.77 ± 0.01 |
| NOM Removal % | 14.1 ± 0.9 | 2.2 ± 1.7 | N/A | N/A | |
| Free Chlorine (mg/L) | BDL | BDL | 0.074 ± 0.008 | BDL | |
| EC-EO | Final pH | 9.53 ± 0.09 | 9.47 ± 0.03 | 8.90 ± 0.15 | 9.02 ± 0.07 |
| NOM Removal % | 9.1 ± 5.4 | 64.8 ± 8.6 | N/A | N/A | |
| Free Chlorine (mg/L) | BDL | BDL | 0.010 ± 0.014 | BDL | |
Note: BDL = Below detection limit of Hach Method 8021 (0.02 mg/L). N/A = Not applicable since NOM was not added to model groundwaters.
Figure A1.
Electrocoagulation (EC) performance as a function of total iron dose (mg/L Fe) applied using current densities of 0.67 to 10 mA/cm2 for 5 min (area = 15 cm2, volume = 200 mL). Primary y-axis: Natural organic matter (NOM) removal. Secondary y-axis: EC total residual iron concentration that passed through particle separation (flocculation and 25-μm filtration). Each point shows the average of triplicate tests ±1 standard error.

Figure A2.
Natural organic matter (NOM) removal in the model river water by electrocoagulation (EC) and electrocoagulation-electrooxidation (EC-EO) as a function of pH. Bars demonstrate average values for triplicate test with ±1 standard deviation shown by the error bars. The influence of pH on NOM removal was only assessed in the model river water as it had the highest initial NOM concentration.

Figure A3.
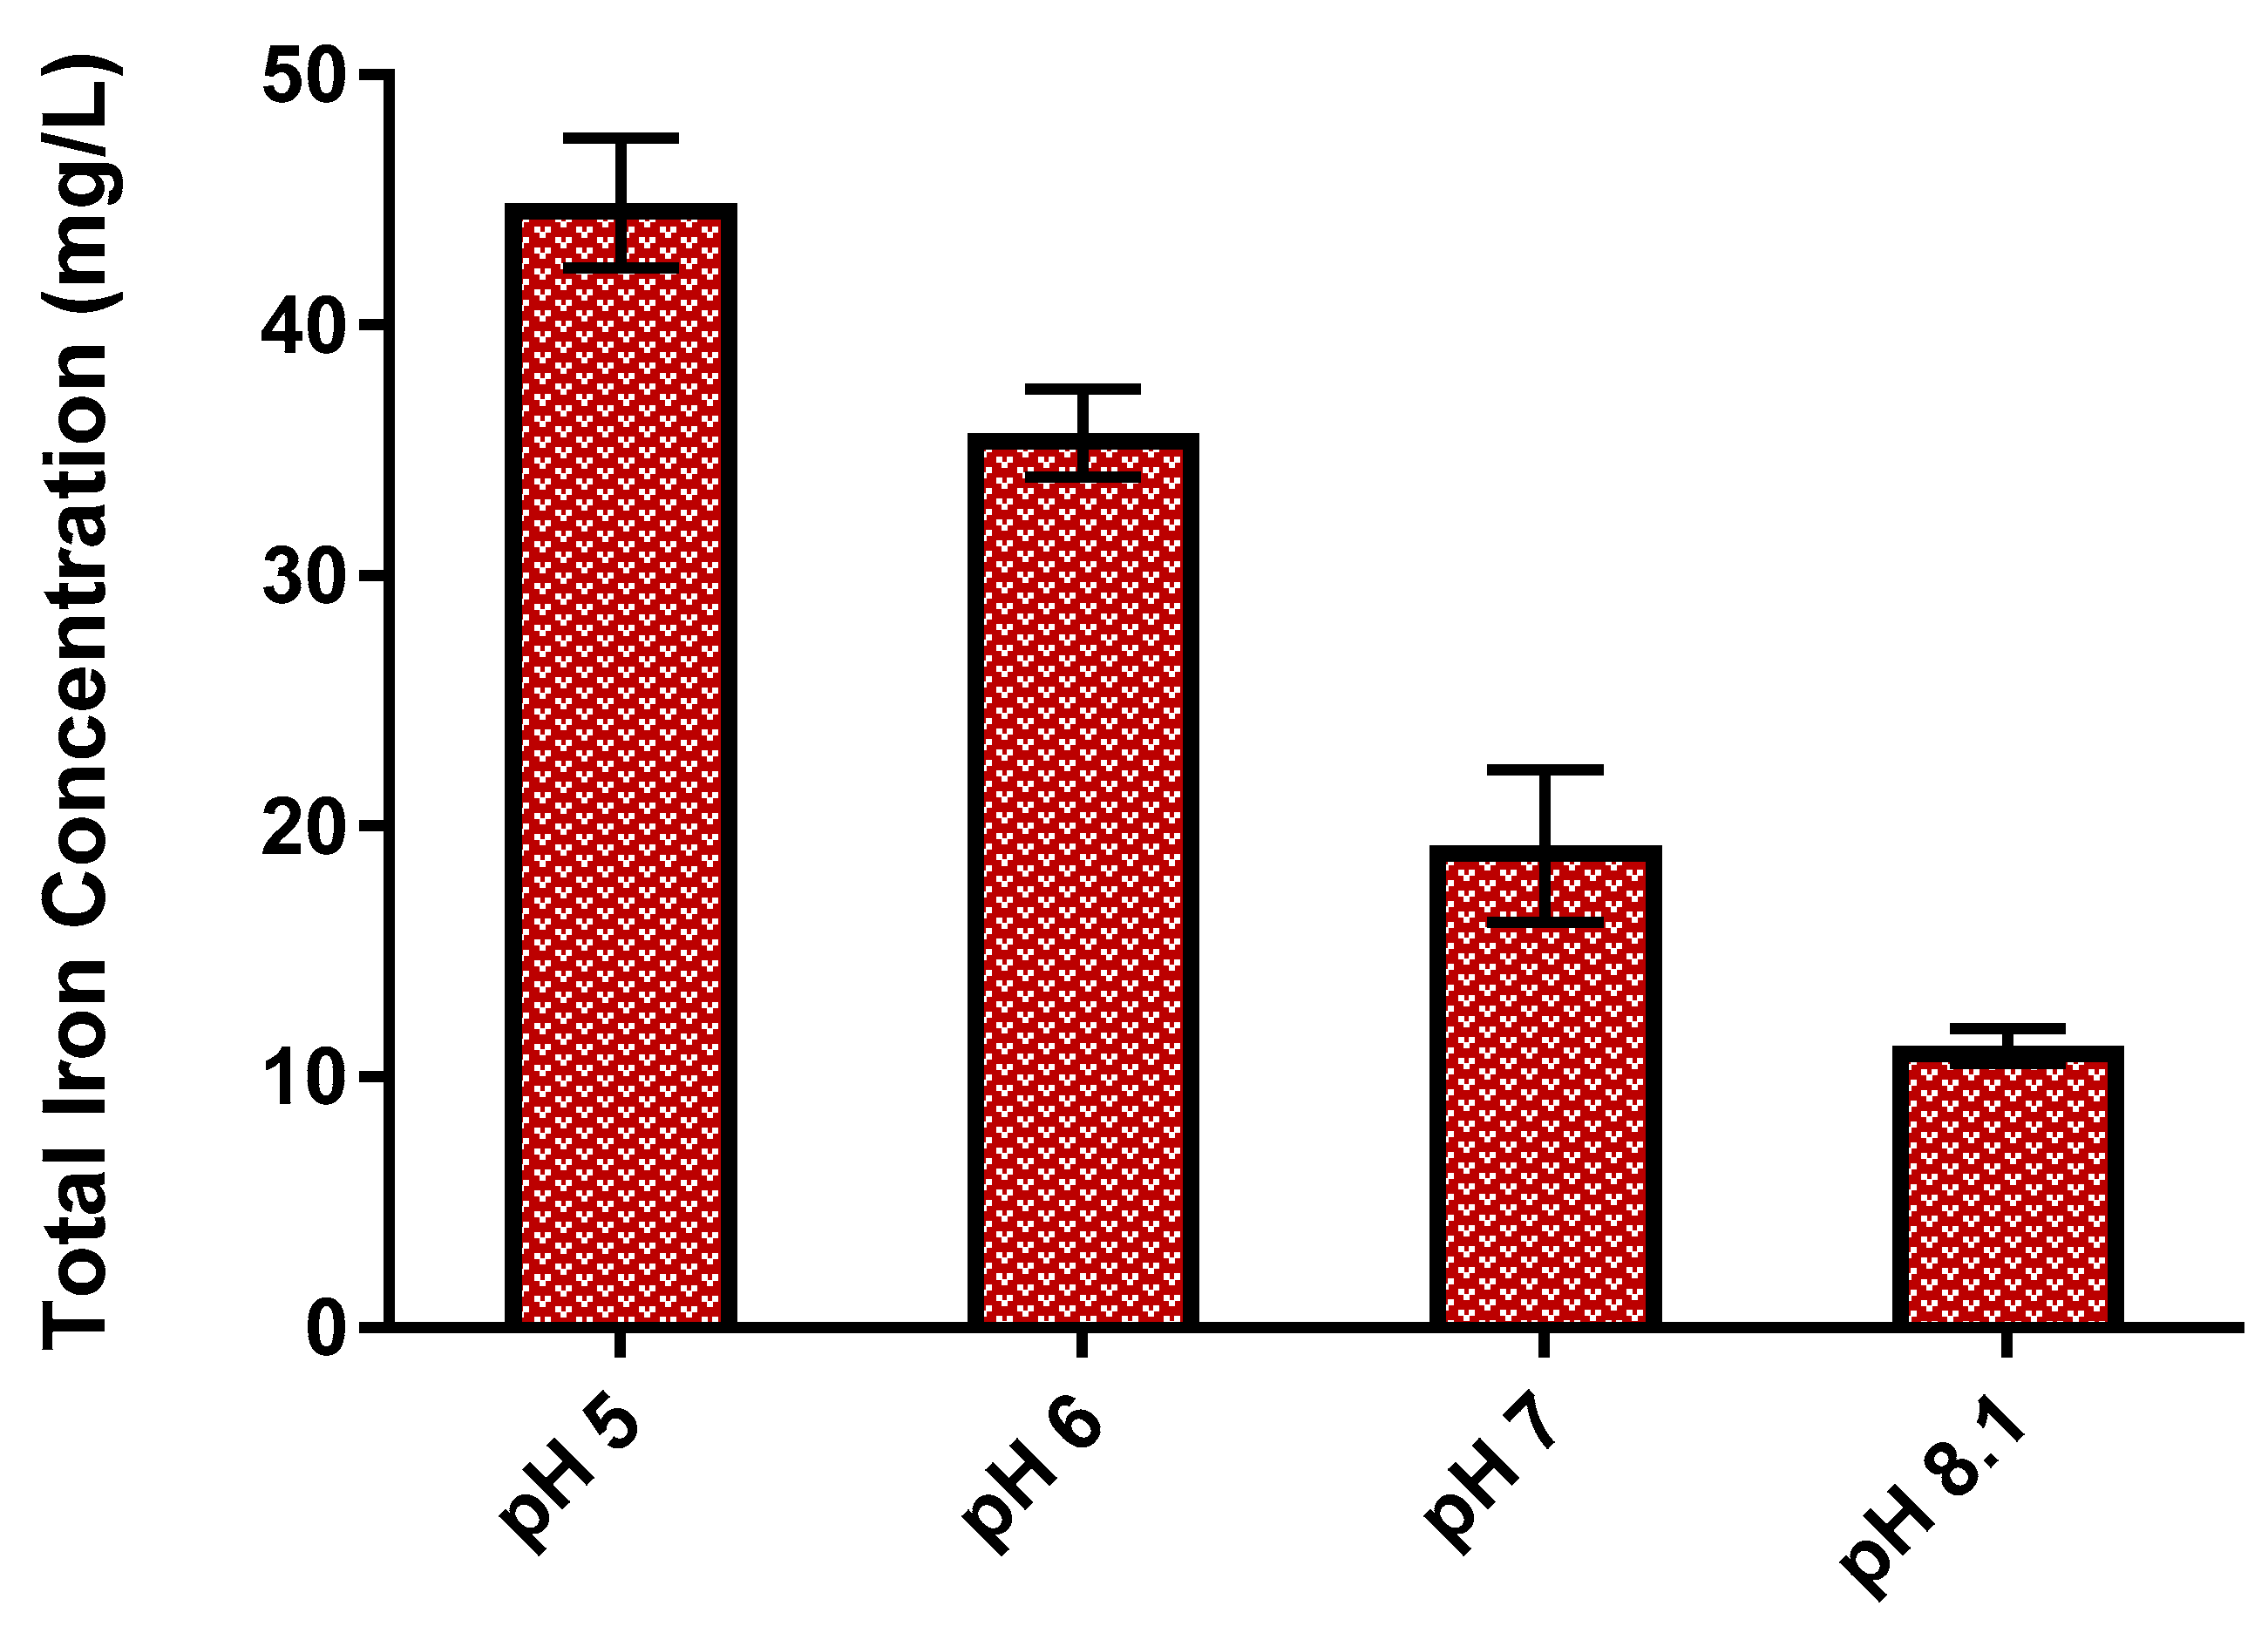
Total residual iron concentrations after electrocoagulation (EC) and particle separation as a function of pH in the model river water. Each bar represents the average of triplicate tests, with ±1 standard deviation shown by the error bars. Note the similar trends to the model lake water (shown in Figure 6) with the total iron concentration increasing as the initial pH decreased.
Figure A3.
Total residual iron concentrations after electrocoagulation (EC) and particle separation as a function of pH in the model river water. Each bar represents the average of triplicate tests, with ±1 standard deviation shown by the error bars. Note the similar trends to the model lake water (shown in Figure 6) with the total iron concentration increasing as the initial pH decreased.

Table A2.
Final pH after each treatment process in the surface waters. Values are averages of triplicate tests with ±1 standard deviation.
Table A2.
Final pH after each treatment process in the surface waters. Values are averages of triplicate tests with ±1 standard deviation.
| Initial pH | Model Lake Water | Model River Water | ||||
|---|---|---|---|---|---|---|
| EC | EO | EC-EO | EC | EO | EC-EO | |
| Baseline | 9.59 ± 0.13 | 8.01 ± 0.03 | 9.53 ± 0.09 | 9.55 ± 0.07 | 7.98 ± 0.07 | 9.47 ± 0.03 |
| 7 | 9.23 ± 0.09 | 7.23 ± 0.03 | 9.10 ± 0.17 | 8.75 ± 0.18 | 7.21 ± 0.02 | 8.69 ± 0.20 |
| 6 | 7.11 ± 0.01 | 6.29 ± 0.04 | 6.93 ± 0.01 | 7.06 ± 0.02 | 6.29 ± 0.03 | 6.80 ± 0.06 |
| 5 | 6.88 ± 0.03 | 5.49 ± 0.03 | 6.65 ± 0.08 | 6.82 ± 0.04 | 5.34 ± 0.04 | 6.40 ± 0.04 |
Figure A4.
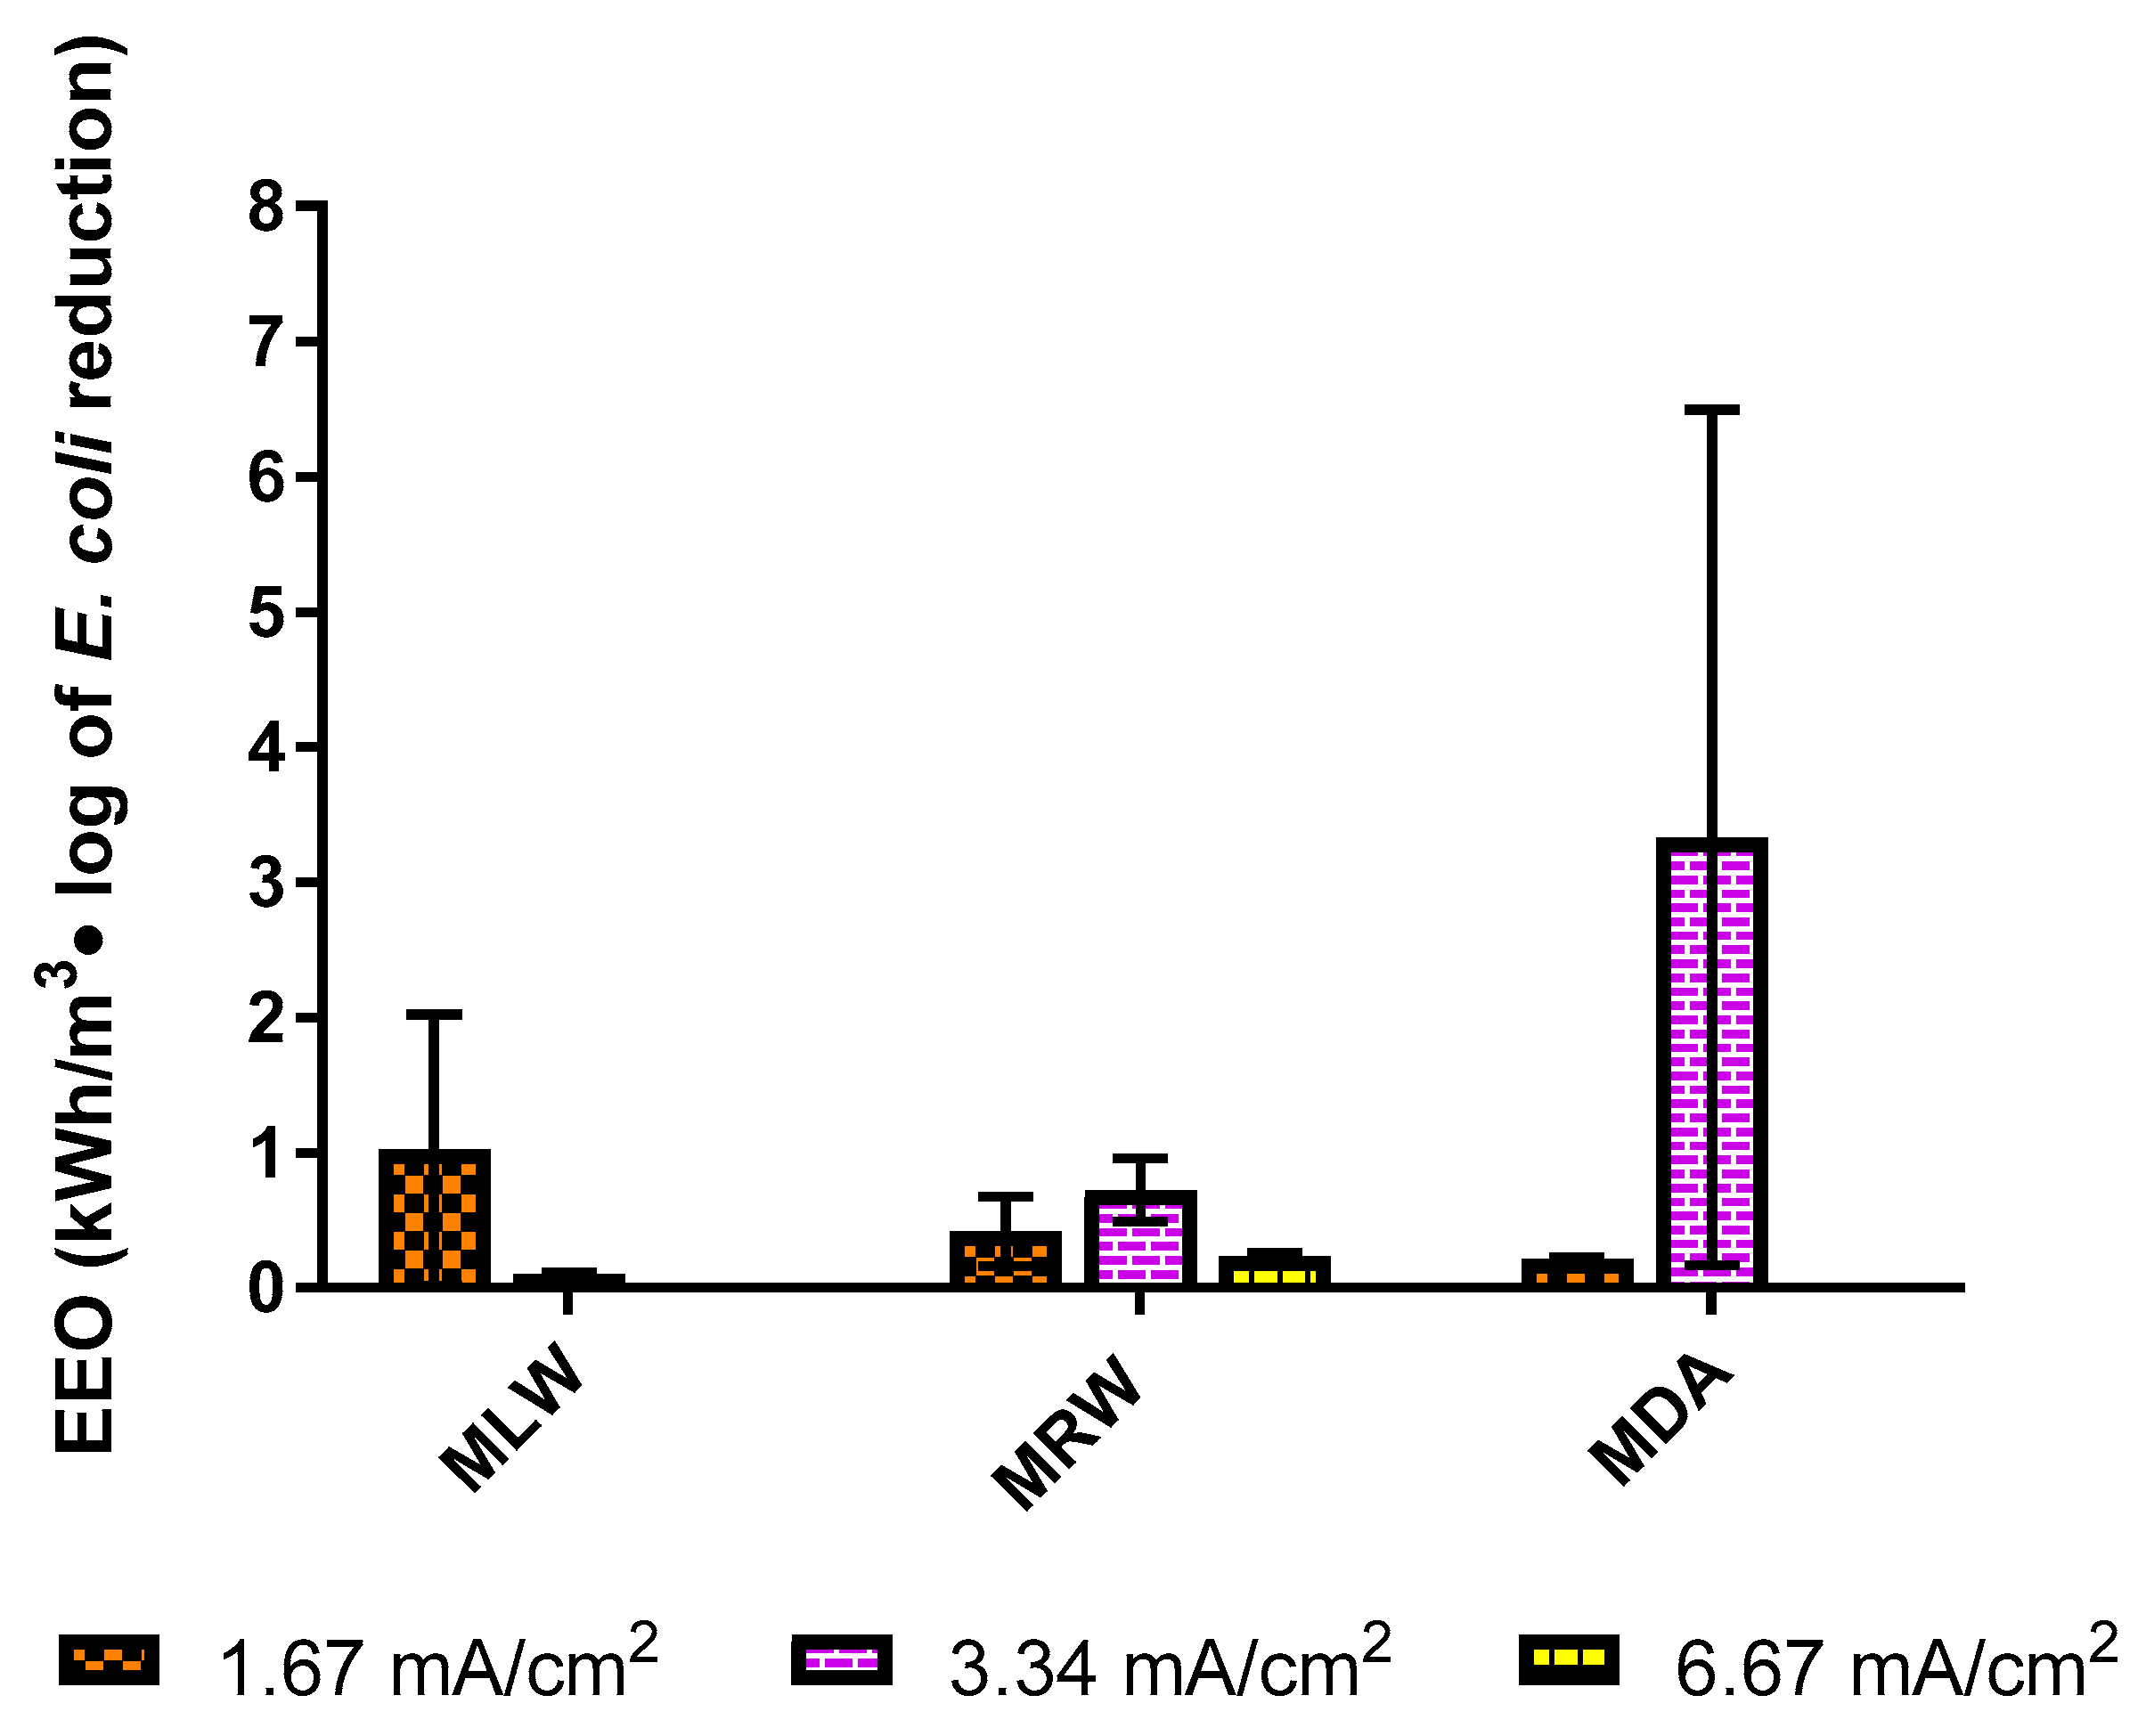
Electrical energy per order magnitude (EEO) associated with E. coli mitigation by electrooxidation (EO) as a function of current density. MLW = model lake water, MRW = model river water, and MDA = model deep aquifer. Each bar represents the average of triplicate tests, with ±1 standard deviation shown by the error bars. Note: In all three waters, the EEO for 6.67 mA/cm2 was less than 0.2 kWh/m3-log of E. coli reduction.
Figure A4.
Electrical energy per order magnitude (EEO) associated with E. coli mitigation by electrooxidation (EO) as a function of current density. MLW = model lake water, MRW = model river water, and MDA = model deep aquifer. Each bar represents the average of triplicate tests, with ±1 standard deviation shown by the error bars. Note: In all three waters, the EEO for 6.67 mA/cm2 was less than 0.2 kWh/m3-log of E. coli reduction.

References
- Latham, M.; Impellitteri, C. Small Drinking Water Systems Research and Development; United States Environmental Protection Agency: Washington, DC, USA, 2016.
- National Research Council. Safe Water From Every Tap; National Academies Press: Washington, DC, USA, 1997; ISBN 978-0-309-05527-7. [Google Scholar]
- Allaire, M.; Wu, H.; Lall, U. National trends in drinking water quality violations. Proc. Natl. Acad. Sci. 2018, 115, 2078–2083. [Google Scholar] [CrossRef] [PubMed]
- USEPA Revised Total Coliform Rule. Fed. Regist. 2013. Available online: https://www.govinfo.gov/content/pkg/FR-2013-02-13/pdf/2012-31205.pdf (accessed on 27 November 2019).
- USEPA National primary drinking water regulations: Long Term 1 Enhanced Surface Water Treatment Rule. Final rule. Fed. Regist. 2002, 67, 1811–1844.
- Bagga, A.; Chellam, S.; Clifford, D.A. Evaluation of iron chemical coagulation and electrocoagulation pretreatment for surface water microfiltration. J. Memb. Sci. 2008, 309, 82–93. [Google Scholar] [CrossRef]
- Comninellis, C.; Chen, G. Electroflotation. In Electrochemistry for the Environment; Chen, X., Ed.; Springer: Berlin, Germany, 2010; pp. 263–277. [Google Scholar]
- Delaire, C.; Van Genuchten, C.M.; Nelson, K.L.; Amrose, S.E.; Gadgil, A.J. Escherichia coli attenuation by Fe electrocoagulation in synthetic Bengal groundwater: Effect of pH and natural organic matter. Environ. Sci. Technol. 2015, 49, 9945–9953. [Google Scholar] [CrossRef] [PubMed]
- Ghernaout, D.; Badis, A.; Kellil, A.; Ghernaout, B. Application of electrocoagulation in Escherichia coli culture and two surface waters. Desalination 2008, 219, 118–125. [Google Scholar] [CrossRef]
- Ndjomgoue-Yossa, A.C.; Nanseu-Njiki, C.P.; Kengne, I.M.; Ngameni, E. Effect of electrode material and supporting electrolyte on the treatment of water containing Escherichia coli by electrocoagulation. Int. J. Environ. Sci. Technol. 2015, 12, 2103–2110. [Google Scholar] [CrossRef]
- Matilainen, A.; Vepsäläinen, M.; Sillanpää, M. Natural organic matter removal by coagulation during drinking water treatment: A review. Adv. Colloid Interface Sci. 2010, 159, 189–197. [Google Scholar] [CrossRef]
- Dubrawski, K.L.; Mohseni, M. In-situ identification of iron electrocoagulation speciation and application for natural organic matter (NOM) removal. Water Res. 2013, 47, 5371–5380. [Google Scholar] [CrossRef]
- United States Environmental Protection Agency. Enhanced Coagulation and Enhanced Precipitative Softening Guidance Manual; United States Environmental Protection Agency: Washington, DC, USA, 1999.
- Vepsäläinen, M.; Ghiasvand, M.; Selin, J.; Pienimaa, J.; Repo, E.; Pulliainen, M.; Sillanpää, M. Investigations of the effects of temperature and initial sample pH on natural organic matter (NOM) removal with electrocoagulation using response surface method (RSM). Sep. Purif. Technol. 2009, 69, 255–261. [Google Scholar] [CrossRef]
- Aguilar, Z.G.; Coreño, O.; Salazar, M.; Sirés, I.; Brillas, E.; Nava, J.L. Ti|Ir–Sn–Sb oxide anode: Service life and role of the acid sites content during water oxidation to hydroxyl radicals. J. Electroanal. Chem. 2018, 820, 82–88. [Google Scholar] [CrossRef]
- Chen, G. Electrochemical technologies in wastewater treatment. Sep. Purif. Technol. 2004, 38, 11–41. [Google Scholar] [CrossRef]
- Ghernaout, D.; Naceur, M.W.; Aouabed, A. On the dependence of chlorine by-products generated species formation of the electrode material and applied charge during electrochemical water treatment. Desalination 2011, 270, 9–22. [Google Scholar] [CrossRef]
- Jeong, J.; Kim, J.Y.; Cho, M.; Choi, W.; Yoon, J. Inactivation of Escherichia coli in the electrochemical disinfection process using a Pt anode. Chemosphere 2007, 67, 652–659. [Google Scholar] [CrossRef] [PubMed]
- Wu, W.; Huang, Z.-H.; Lim, T.-T. Recent development of mixed metal oxide anodes for electrochemical oxidation of organic pollutants in water. Appl. Catal. A Gen. 2014, 480, 58–78. [Google Scholar] [CrossRef]
- Kraft, A. Electrochemical water disinfection: A short review. Platin. Met. Rev. 2008, 52, 177–185. [Google Scholar] [CrossRef]
- Kraft, A.; Stadelmann, M.; Blaschke, M.; Kreysig, D.; Sandt, B.; Schro, F.; Der, È.; Rennau, J. Electrochemical water disinfection Part I: Hypochlorite production from very dilute chloride solutions. J. Appl. Electrochem. 1999, 29, 859–866. [Google Scholar] [CrossRef]
- Aquino Neto, S.; de Andrade, A.R. Electrooxidation of glyphosate herbicide at different DSA® compositions: pH, concentration and supporting electrolyte effect. Electrochim. Acta 2009, 54, 2039–2045. [Google Scholar] [CrossRef]
- Martínez-Huitle, C.A.; Brillas, E. Electrochemical alternatives for drinking water disinfection. Angew. Chemie Int. Ed. 2008, 47, 1998–2005. [Google Scholar] [CrossRef]
- Hu, S.; Hu, J.; Liu, B.; Wang, D.; Wu, L.; Xiao, K.; Liang, S.; Hou, H.; Yang, J. In situ generation of zero valent iron for enhanced hydroxyl radical oxidation in an electrooxidation system for sewage sludge dewatering. Water Res. 2018, 145, 162–171. [Google Scholar] [CrossRef]
- Anfruns-Estrada, E.; Bruguera-Casamada, C.; Salvadó, H.; Brillas, E.; Sirés, I.; Araujo, R.M. Inactivation of microbiota from urban wastewater by single and sequential electrocoagulation and electro-Fenton treatments. Water Res. 2017, 126, 450–459. [Google Scholar] [CrossRef]
- Yeon Kim, J.; Lee, C.; Love, D.C.; Sedlak, D.L.; Yoon, J.; Nelson, K.L. Inactivation of MS2 Coliphage by Ferrous Ion and Zero-Valent Iron Nanoparticles. Environ. Sci. Technol. 2011, 45, 6978–6984. [Google Scholar]
- Jeong, J.; Kim, C.; Yoon, J. The effect of electrode material on the generation of oxidants and microbial inactivation in the electrochemical disinfection processes. Water Res. 2009, 43, 895–901. [Google Scholar] [CrossRef] [PubMed]
- Schaefer, C.E.; Andaya, C.; Urtiaga, A. Assessment of disinfection and by-product formation during electrochemical treatment of surface water using a Ti/IrO2 anode. Chem. Eng. J. 2015, 264, 411–416. [Google Scholar] [CrossRef]
- Linares-Hernández, I.; Barrera-Díaz, C.; Bilyeu, B.; Juárez-GarcíaRojas, P.; Campos-Medina, E. A combined electrocoagulation–electrooxidation treatment for industrial wastewater. J. Hazard. Mater. 2010, 175, 688–694. [Google Scholar] [CrossRef]
- Cotillas, S.; Llanos, J.; Cañizares, P.; Mateo, S.; Rodrigo, M.A. Optimization of an integrated electrodisinfection/electrocoagulation process with Al bipolar electrodes for urban wastewater reclamation. Water Res. 2013, 47, 1741–1750. [Google Scholar] [CrossRef]
- Llanos, J.; Cotillas, S.; Cañizares, P.; Rodrigo, M.A. Effect of bipolar electrode material on the reclamation of urban wastewater by an integrated electrodisinfection/electrocoagulation process. Water Res. 2014, 53, 329–338. [Google Scholar] [CrossRef]
- Thurston-Enriquez, J.A.; Haas, C.N.; Gerba, C.P.; Jacangelo, J. Chlorine inactivation of adenovirus 40 and feline calicivirus. Appl. Environ. Microbiol. 2003, 69, 3979–3985. [Google Scholar] [CrossRef]
- United States Environmental Protection Agency. Guide Standard and Protocol for Testing Microbiological Water Purifiers; United States Environmental Protection Agency: Washington, DC, USA, 1987.
- APHA; AWWA; WEF. Standard Methods for the Examination of Water and Wastewater, 22nd ed.; Rice, E.W., Baird, R.B., Eaton, A.D., Clesceri, R.S., Eds.; APHA AWWA WEF: Washington, DC, USA, 2012; ISBN 9780875530130. [Google Scholar]
- Heffron, J.; Ryan, D.R.; Mayer, B.K. Sequential electrocoagulation-electrooxidation for virus mitigation in drinking water. Water Res. 2019, 160, 435–444. [Google Scholar] [CrossRef]
- Maher, E.K.; O’Malley, K.N.; Heffron, J.; Huo, J.; Mayer, B.K.; Wang, Y.; McNamara, P.J. Analysis of operational parameters, reactor kinetics, and floc characterization for the removal of estrogens via electrocoagulation. Chemosphere 2019, 220, 1141–1149. [Google Scholar] [CrossRef]
- Lakshmanan, D.; Clifford, D.A.; Samanta, G. Ferrous and ferric ion generation during iron electrocoagulation. Environ. Sci. Technol. 2009, 43, 3853–3859. [Google Scholar] [CrossRef]
- Gu, Z.; Liao, Z.; Schulz, M.; Davis, J.R.; Baygents, J.C.; Farrell, J. Estimating dosing rates and energy consumption for electrocoagulation using Iron and aluminum electrodes. Ind. Eng. Chem. Res. 2009, 48, 3112–3117. [Google Scholar] [CrossRef]
- Sasson, M.B.; Calmano, W.; Adin, A. Iron-oxidation processes in an electroflocculation (electrocoagulation) cell. J. Hazard. Mater. 2009, 171, 704–709. [Google Scholar] [CrossRef] [PubMed]
- Devilliers, D.; Mahé, E. Modified titanium electrodes: Application to Ti/TiO2/PbO2 dimensionally stable anodes. Electrochim. Acta 2010, 55, 8207–8214. [Google Scholar] [CrossRef]
- Jeong, J.; Kim, J.Y.; Yoon, J. The role of reactive oxygen species in the electrochemical inactivation of microorganisms. Environ. Sci. Technol. 2006, 40, 6117–6122. [Google Scholar] [CrossRef]
- United States Environmental Protection Agency. Method 3050B Acid Digestion of Sediments, Sludges, and Soils 1.0 Scope and Application; United States Environmental Protection Agency: Washington, DC, USA, 1996.
- Bolton, J.R.; Bircher, K.G.; Tumas, W.; Tolman, C.A. Figures-of-merit for the technical development and application of advanced oxidation processes. J. Adv. Oxid. Technol. 1996, 1, 13–17. [Google Scholar] [CrossRef]
- R Core Team R: A Language and Environment for Statistical Computing. R Foundation for Statistical Computing 2018. Available online: https://www.R-project.org/ (accessed on 17 October 2019).
- Kraft, A.; Blaschke, M.; Kreysig, D.; Sandt, B.; Schro, F.; Der, È.; Rennau, J. Electrochemical water disinfection. Part II: Hypochlorite production from potable water, chlorine consumption and the problem of calcareous deposits. Appl. Electochemistry 1999, 29, 895–902. [Google Scholar] [CrossRef]
- Tanneru, C.T.; Chellam, S. Mechanisms of virus control during iron electrocoagulation--microfiltration of surface water. Water Res. 2012, 46, 2111–2120. [Google Scholar] [CrossRef]
- Crittenden, J.C.; Trussell, R.R.; Hand, D.W.; Howe, K.J.; Tchobanoglous, G. MWH’s Water Treatment: Principles and Design: Third Edition; John Wiley & Sons, Inc.: Hoboken, NJ, USA, 2012; ISBN 9780470405390. [Google Scholar]
- Koparal, A.S.; Yildiz, Y.Ş.; Keskinler, B.; Demircioǧlu, N. Effect of initial pH on the removal of humic substances from wastewater by electrocoagulation. Sep. Purif. Technol. 2008, 59, 175–182. [Google Scholar] [CrossRef]
- Delaire, C.; van Genuchten, C.M.; Amrose, S.E.; Gadgil, A.J. Bacteria attenuation by iron electrocoagulation governed by interactions between bacterial phosphate groups and Fe(III) precipitates. Water Res. 2016, 103, 74–82. [Google Scholar] [CrossRef] [Green Version]
- Stumm, W.; Lee, G.F. Oxygenation of Ferrous Iron. Ind. Eng. Chem. Res. 1961, 53, 143–146. [Google Scholar] [CrossRef]
- Heffron, J.; McDermid, B.; Mayer, B.K. Bacteriophage inactivation as a function of ferrous iron oxidation. Environ. Sci. Water Res. Technol. 2019, 5, 1309–1317. [Google Scholar] [CrossRef]
- Heffron, J.; McDermid, B.; Maher, E.; McNamara, P.J.; Mayer, B.K. Mechanisms of virus mitigation and suitability of bacteriophages as surrogates in drinking water treatment by iron electrocoagulation. Water Res. 2019, 163, 114877. [Google Scholar] [CrossRef] [PubMed]
Figure 1.
Schematic of the bench-scale electrocoagulation-electrooxidation (EC-EO) treatment process and associated sampling points. Each process was operated as a batch system.
Figure 1.
Schematic of the bench-scale electrocoagulation-electrooxidation (EC-EO) treatment process and associated sampling points. Each process was operated as a batch system.

Figure 2.
E. coli mitigation by electrooxidation (EO) alone and sequential electrocoagulation (EC)-EO (shown by stacked EC and EO bars) in (A) model surface waters and (B) model groundwaters. In all cases, EO’s contribution to EC-EO was negligible (i.e., the top “EO contribution” bar of the stacked EC-EO data is not readily visible) in comparison to EC’s contribution. MLW = model lake water, MRW = model river water, MSA = model shallow aquifer, and MDA = model deep aquifer (the associated water quality parameters are shown in Table 1). The operating parameters for experiments were EC at 10 mA/cm2 for 5 min and EO at 1.67 mA/cm2 for 1 min. Each bar represents the average of triplicate tests, with ±1 standard deviation shown by the error bars.

Figure 3.
(A) E. coli mitigation by electrooxidation (EO) as a function of current density. * Indicates that colony counts were below the quantifiable detection limit, so the bar is shown at the limit. (B) Free chlorine generated as a function of EO current density. MLW = model lake water, MRW = model river water, and MDA = model deep aquifer. The model shallow aquifer was not tested as the limit of E. coli detection (maximum assessable removal) was reached at 2.0 mA/cm2. Each bar/point represents the average of triplicate tests, with ±1 standard deviation shown by the error bars.

Figure 4.
E. coli mitigation by electrooxidation (EO) alone and sequential electrocoagulation (EC)-EO (shown as a stacked bar to illustrate the EO and EC contributions to the sequential process) as a function of initial pH conditions in surface waters: (A) model lake water and (B) model river water. The operating parameters were EC at 10 mA/cm2 for 5 min and EO at 1.67 mA/cm2 for 1 min. Each bar represents the average of triplicate tests, with ±1 standard deviation shown by the error bars.

Figure 5.
Total residual iron concentrations after electrocoagulation (EC) and particle separation as a function of pH in the model lake water. Total residual iron concentrations were also quantified after electrocoagulation-electrooxidation (EC-EO) with an additional 15-min settling period to assess the potential for further decreasing total residual iron levels. Each bar represents the average of triplicate tests, with ±1 standard deviation shown by the error bars. The model river water demonstrated similar trends (shown in Appendix A, Figure A3).

Figure 6.
Electrical energy per order magnitude (EEO) for E. coli mitigation in each water using electrooxidation (EO), electrocoagulation (EC), and sequential EC-EO in MLW = model lake water, MRW = model river water, MSA = model shallow aquifer, and MDA = model deep aquifer. Each bar represents the average of triplicate tests, with ±1 standard deviation shown by the error bars. Note: electrooxidation in the MSA had an average EEO of 0.003 ± 0.001 kWh/m3-log of E. coli reduction.

Table 1.
Water quality parameters for model surface and groundwaters.
| Water Type | Alkalinity (mg/L) a | Chloride (mg/L) b | Turbidity (NTU) c | DOC (mg/L) d | pH e | Approximate Conductivity (µS/cm) f | |
|---|---|---|---|---|---|---|---|
| Surface Waters | Model Lake Water (Lake Michigan) | 95.0 | 13.3 | 3.40 | ≈2.7 | 8.25 | 260 |
| Model River Water (Mississippi River) | 119 | 11.4 | 11.8 | ≈8.0 | 8.1 | 300 | |
| Ground Waters | Model Deep Aquifer (sandstone aquifer) | 178 | 3.80 | 0 | 0 | 7.5 | 415 |
| Model Shallow Aquifer (dolomite aquifer) | 226 | 70.4 | 2.00 | 0 | 7.5 | 775 | |
a Added as NaHCO3. b Added as KCl. c Added as A2 dust. Additions of humic acid in the surface waters also contributed to turbidity. Final values are shown here. d Added as humic acid sodium salt. e 10% HCl or HNO3 and 1 M NaOH were used for pH adjustment; 1% acid was used for minor adjustments. f Approximate conductivity was calculated based on the added salts; pH adjustment would further affect conductivity.
© 2019 by the authors. Licensee MDPI, Basel, Switzerland. This article is an open access article distributed under the terms and conditions of the Creative Commons Attribution (CC BY) license (http://creativecommons.org/licenses/by/4.0/).
Share and Cite
MDPI and ACS Style
Lynn, W.; Heffron, J.; Mayer, B.K. Electrocoagulation as a Pretreatment for Electroxidation of E. coli. Water 2019, 11, 2509. https://doi.org/10.3390/w11122509
AMA Style
Lynn W, Heffron J, Mayer BK. Electrocoagulation as a Pretreatment for Electroxidation of E. coli. Water. 2019; 11(12):2509. https://doi.org/10.3390/w11122509
Chicago/Turabian StyleLynn, William, Joe Heffron, and Brooke K. Mayer. 2019. "Electrocoagulation as a Pretreatment for Electroxidation of E. coli" Water 11, no. 12: 2509. https://doi.org/10.3390/w11122509
Note that from the first issue of 2016, this journal uses article numbers instead of page numbers. See further details here.