Building a System Dynamics Model to Support Water Management: A Case Study of the Semiarid Region in the Brazilian Northeast


Abstract
:1. Introduction
2. Materials and Methods
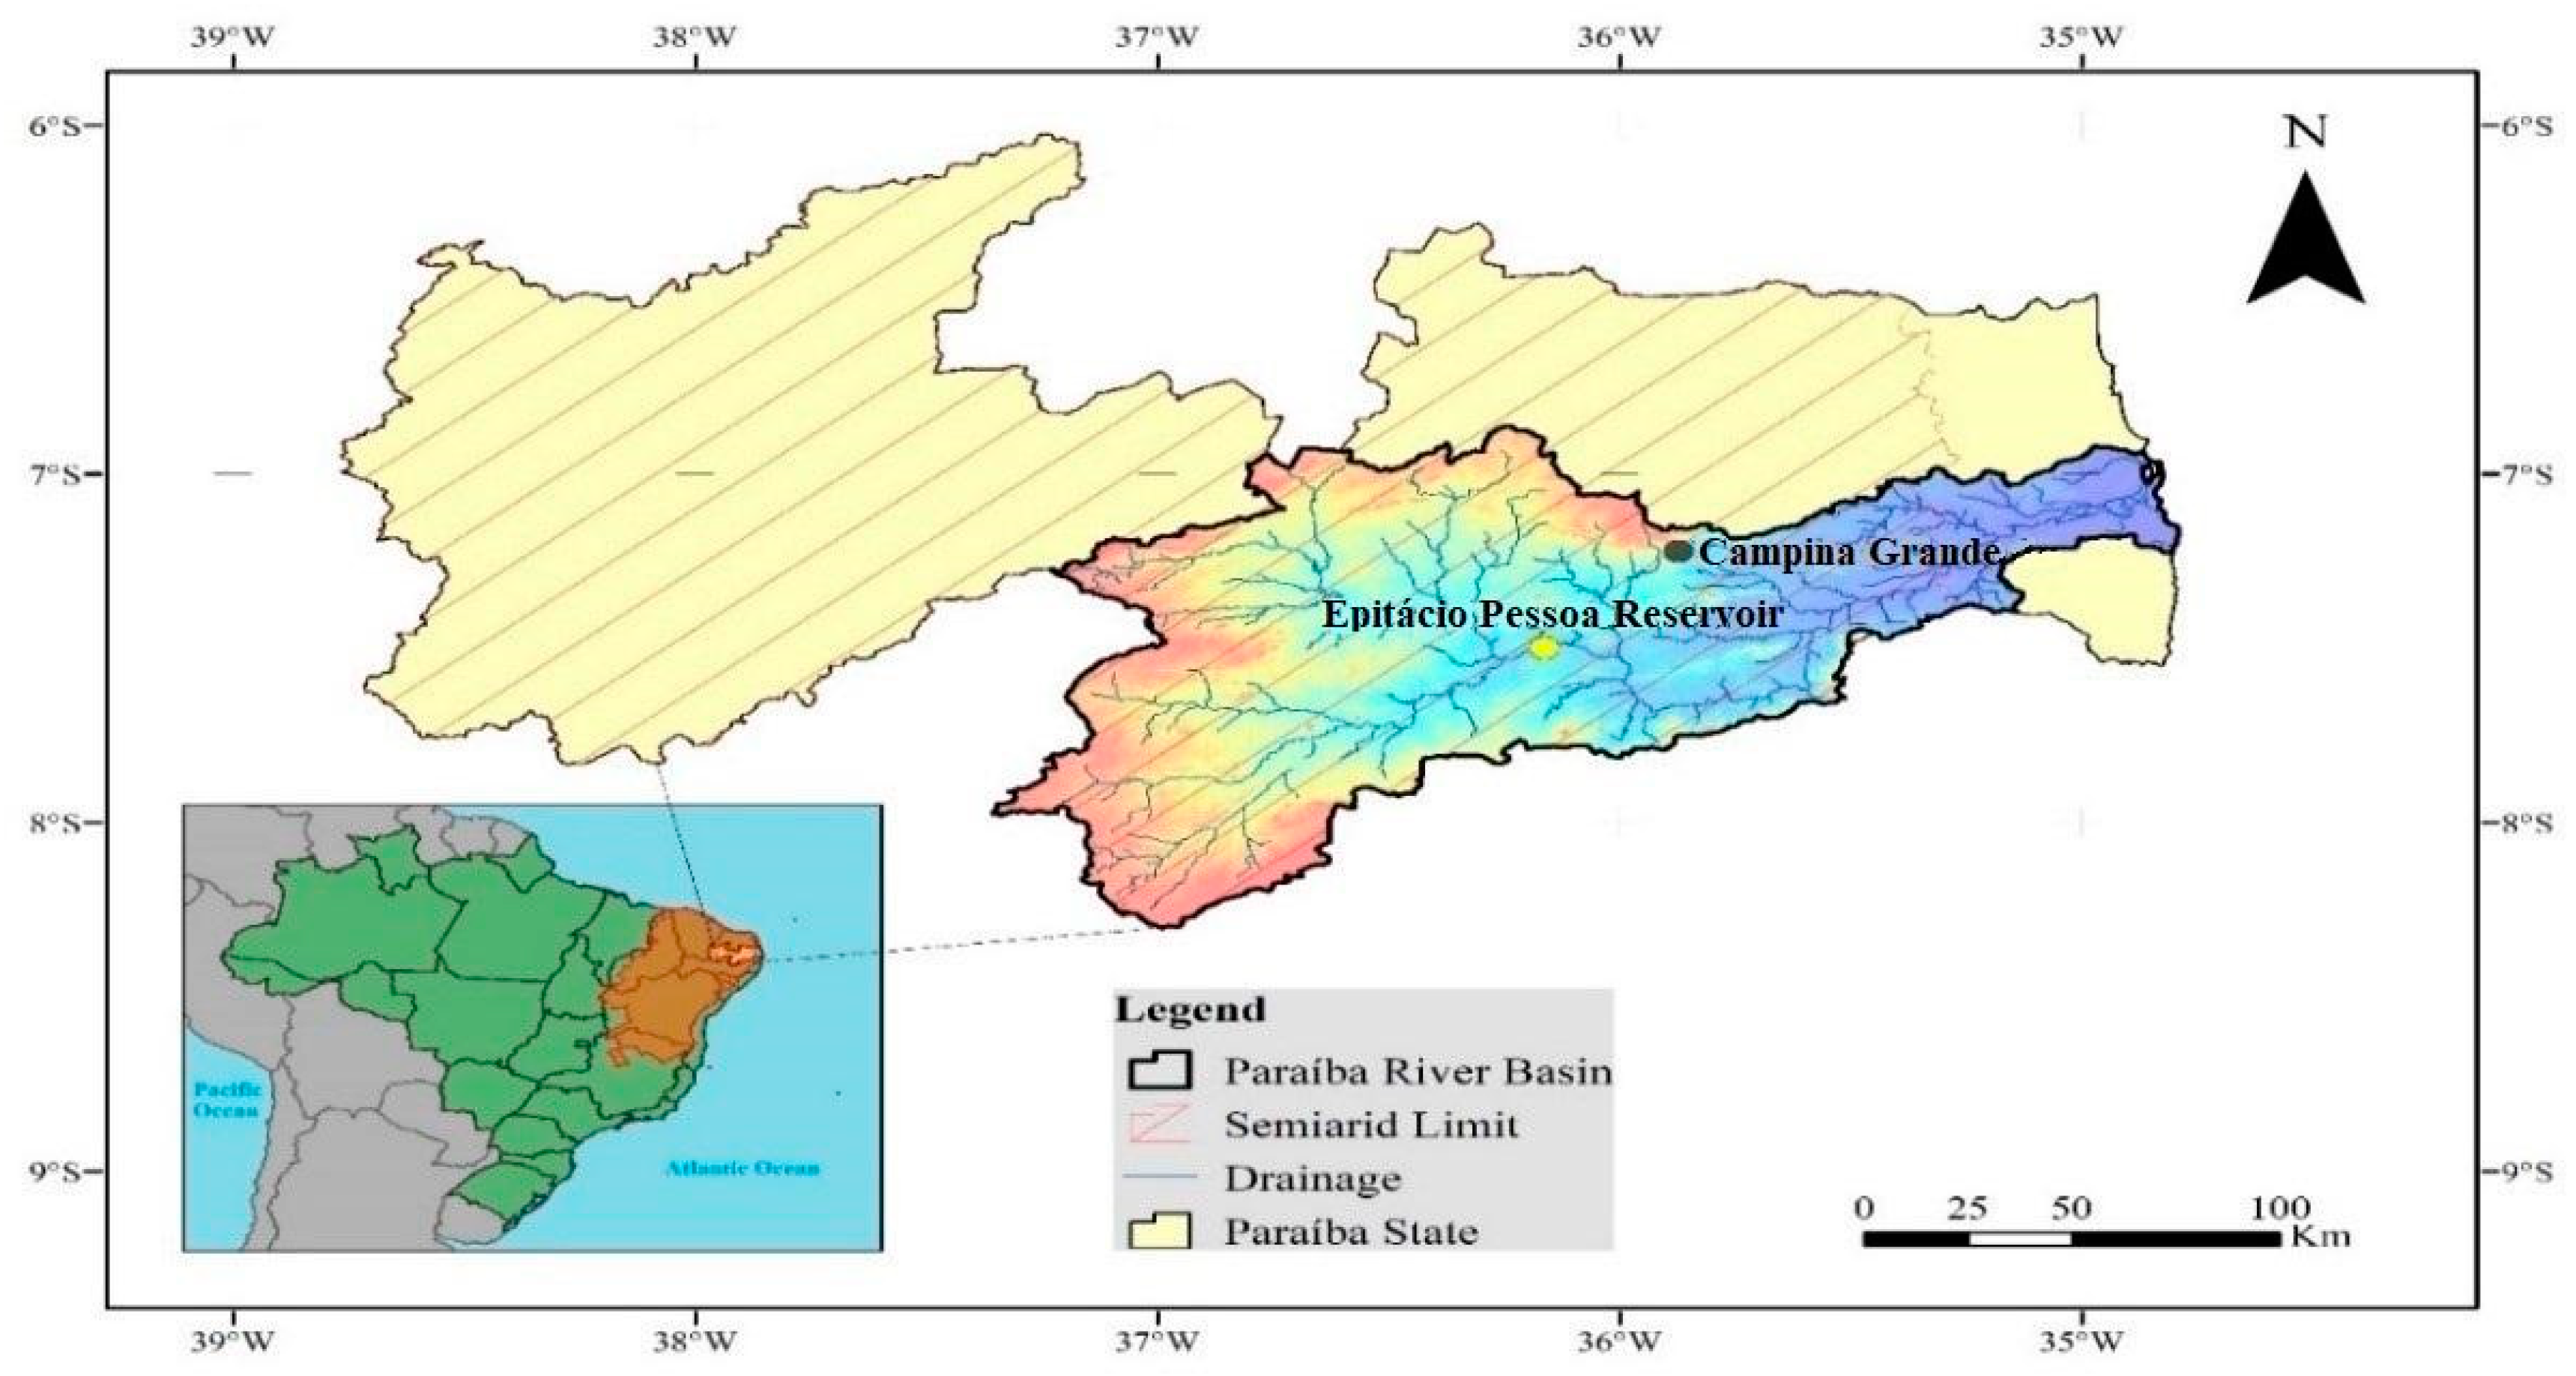
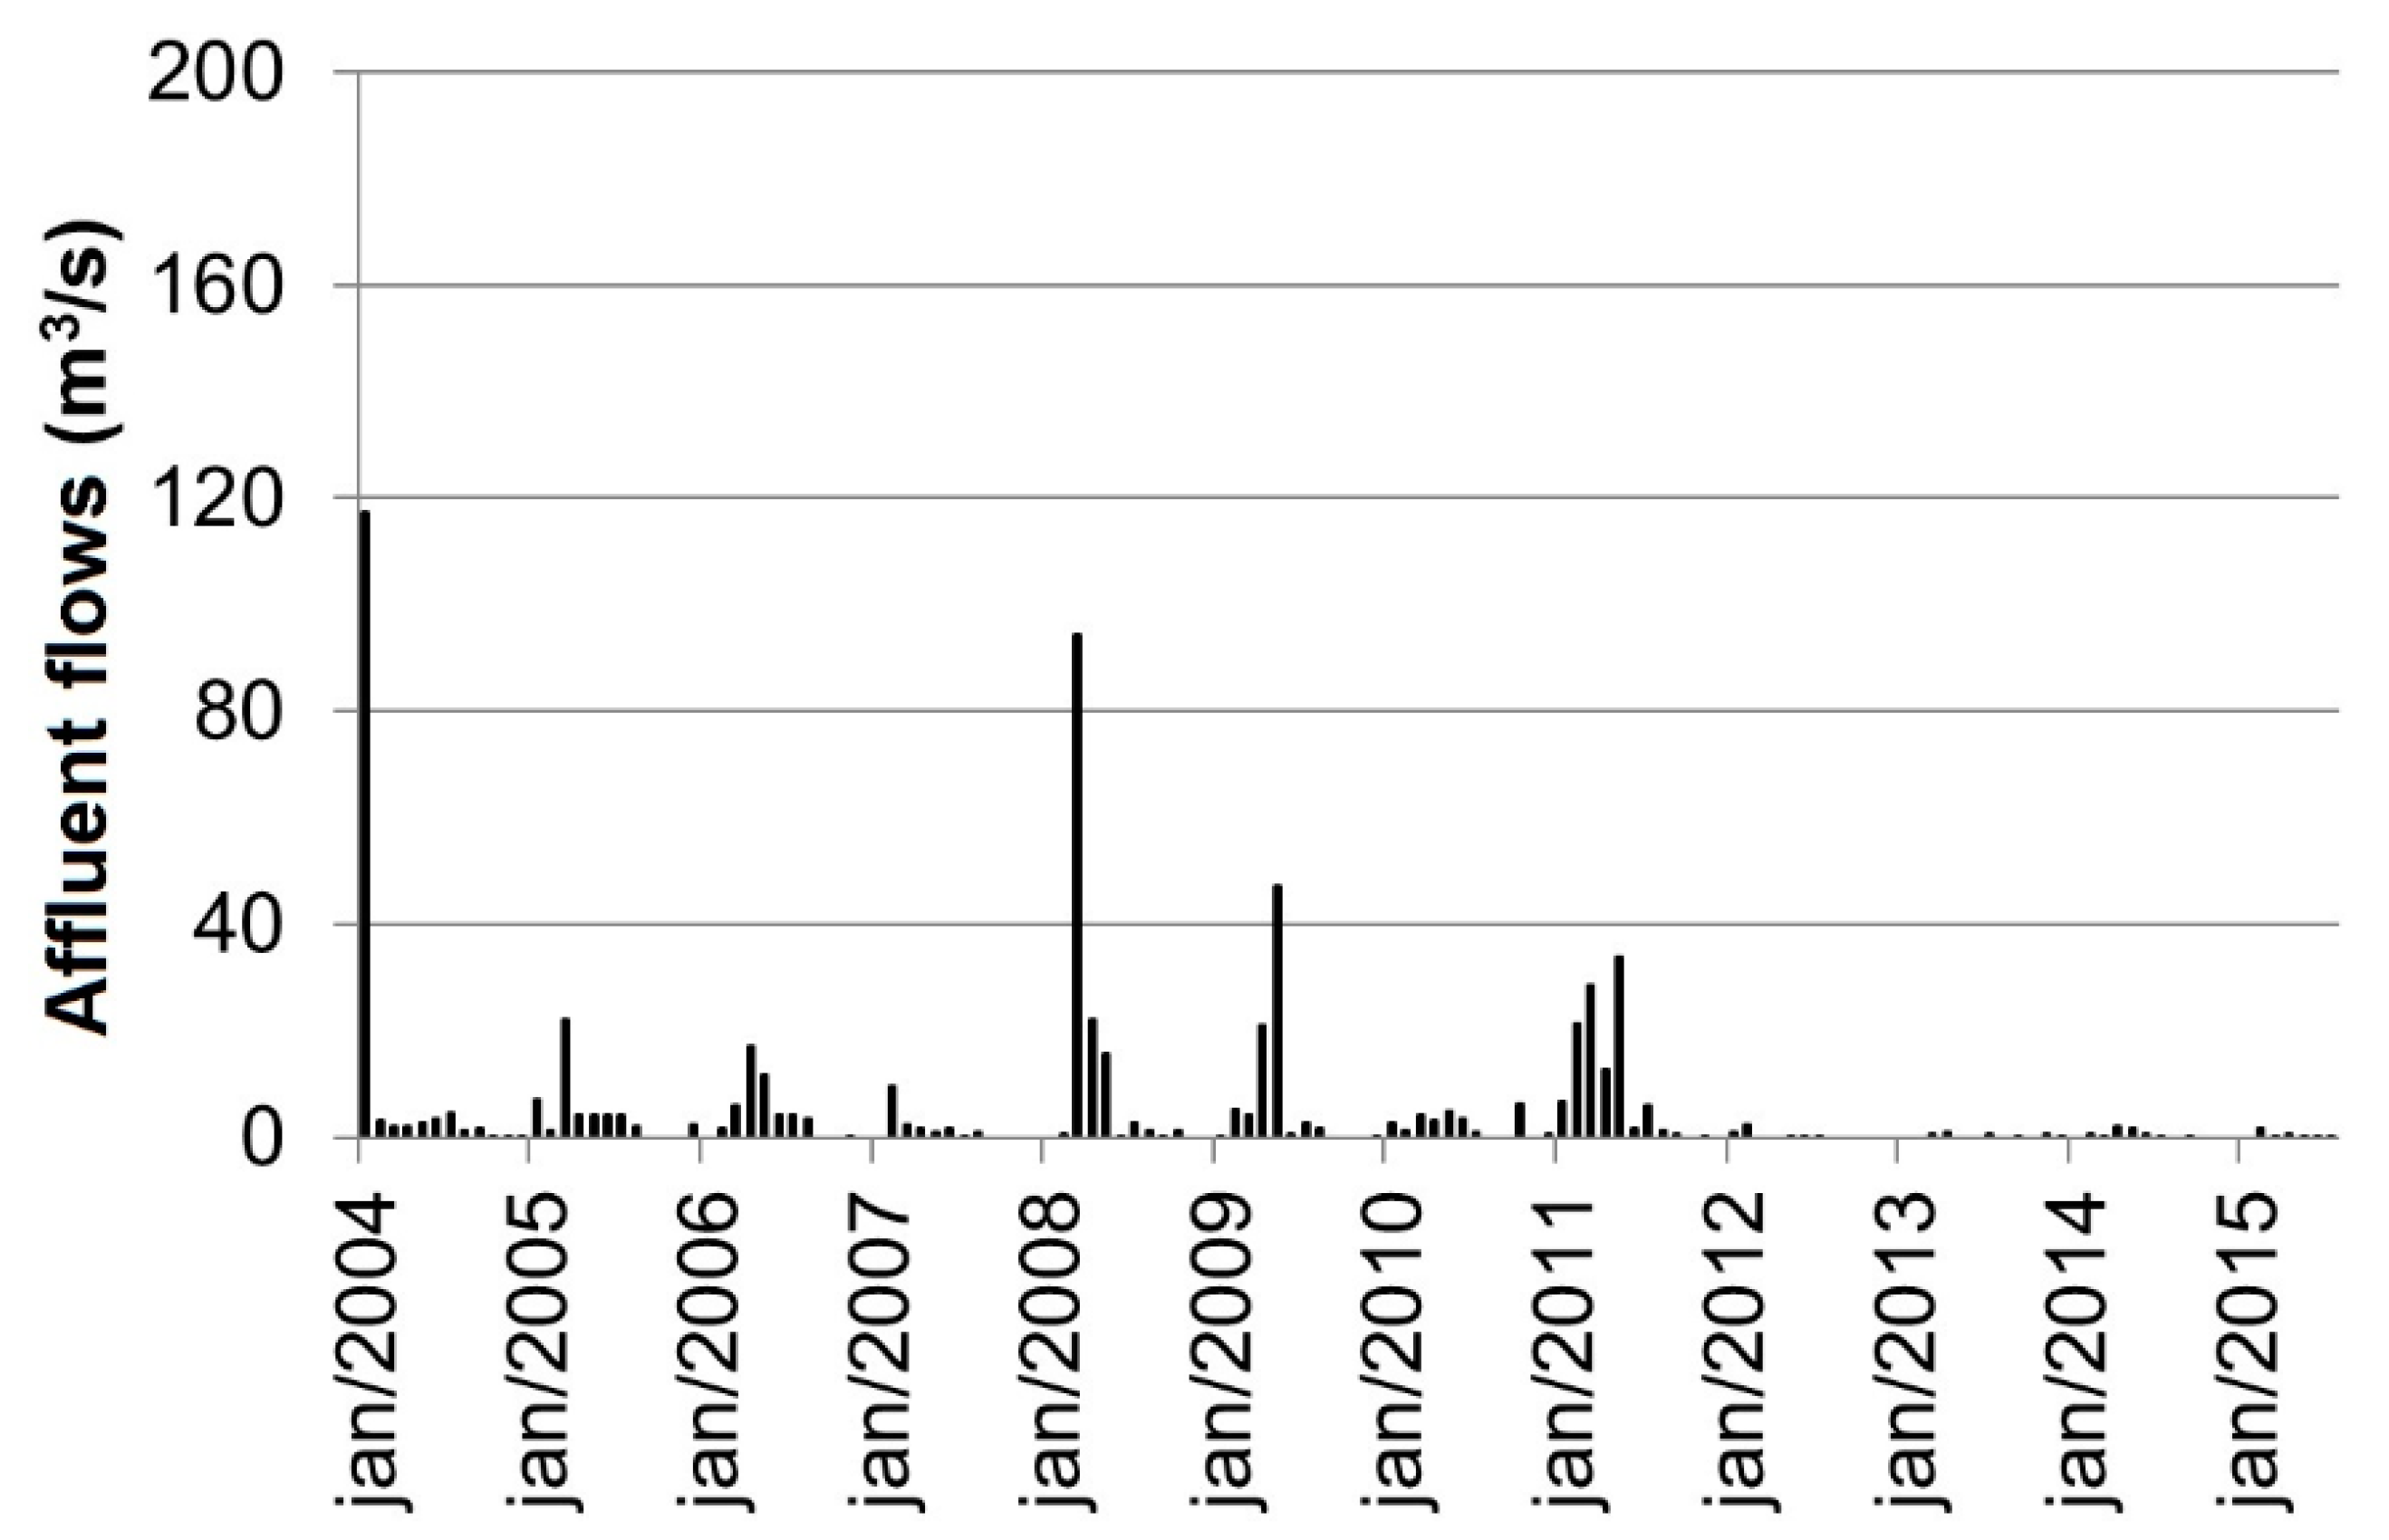
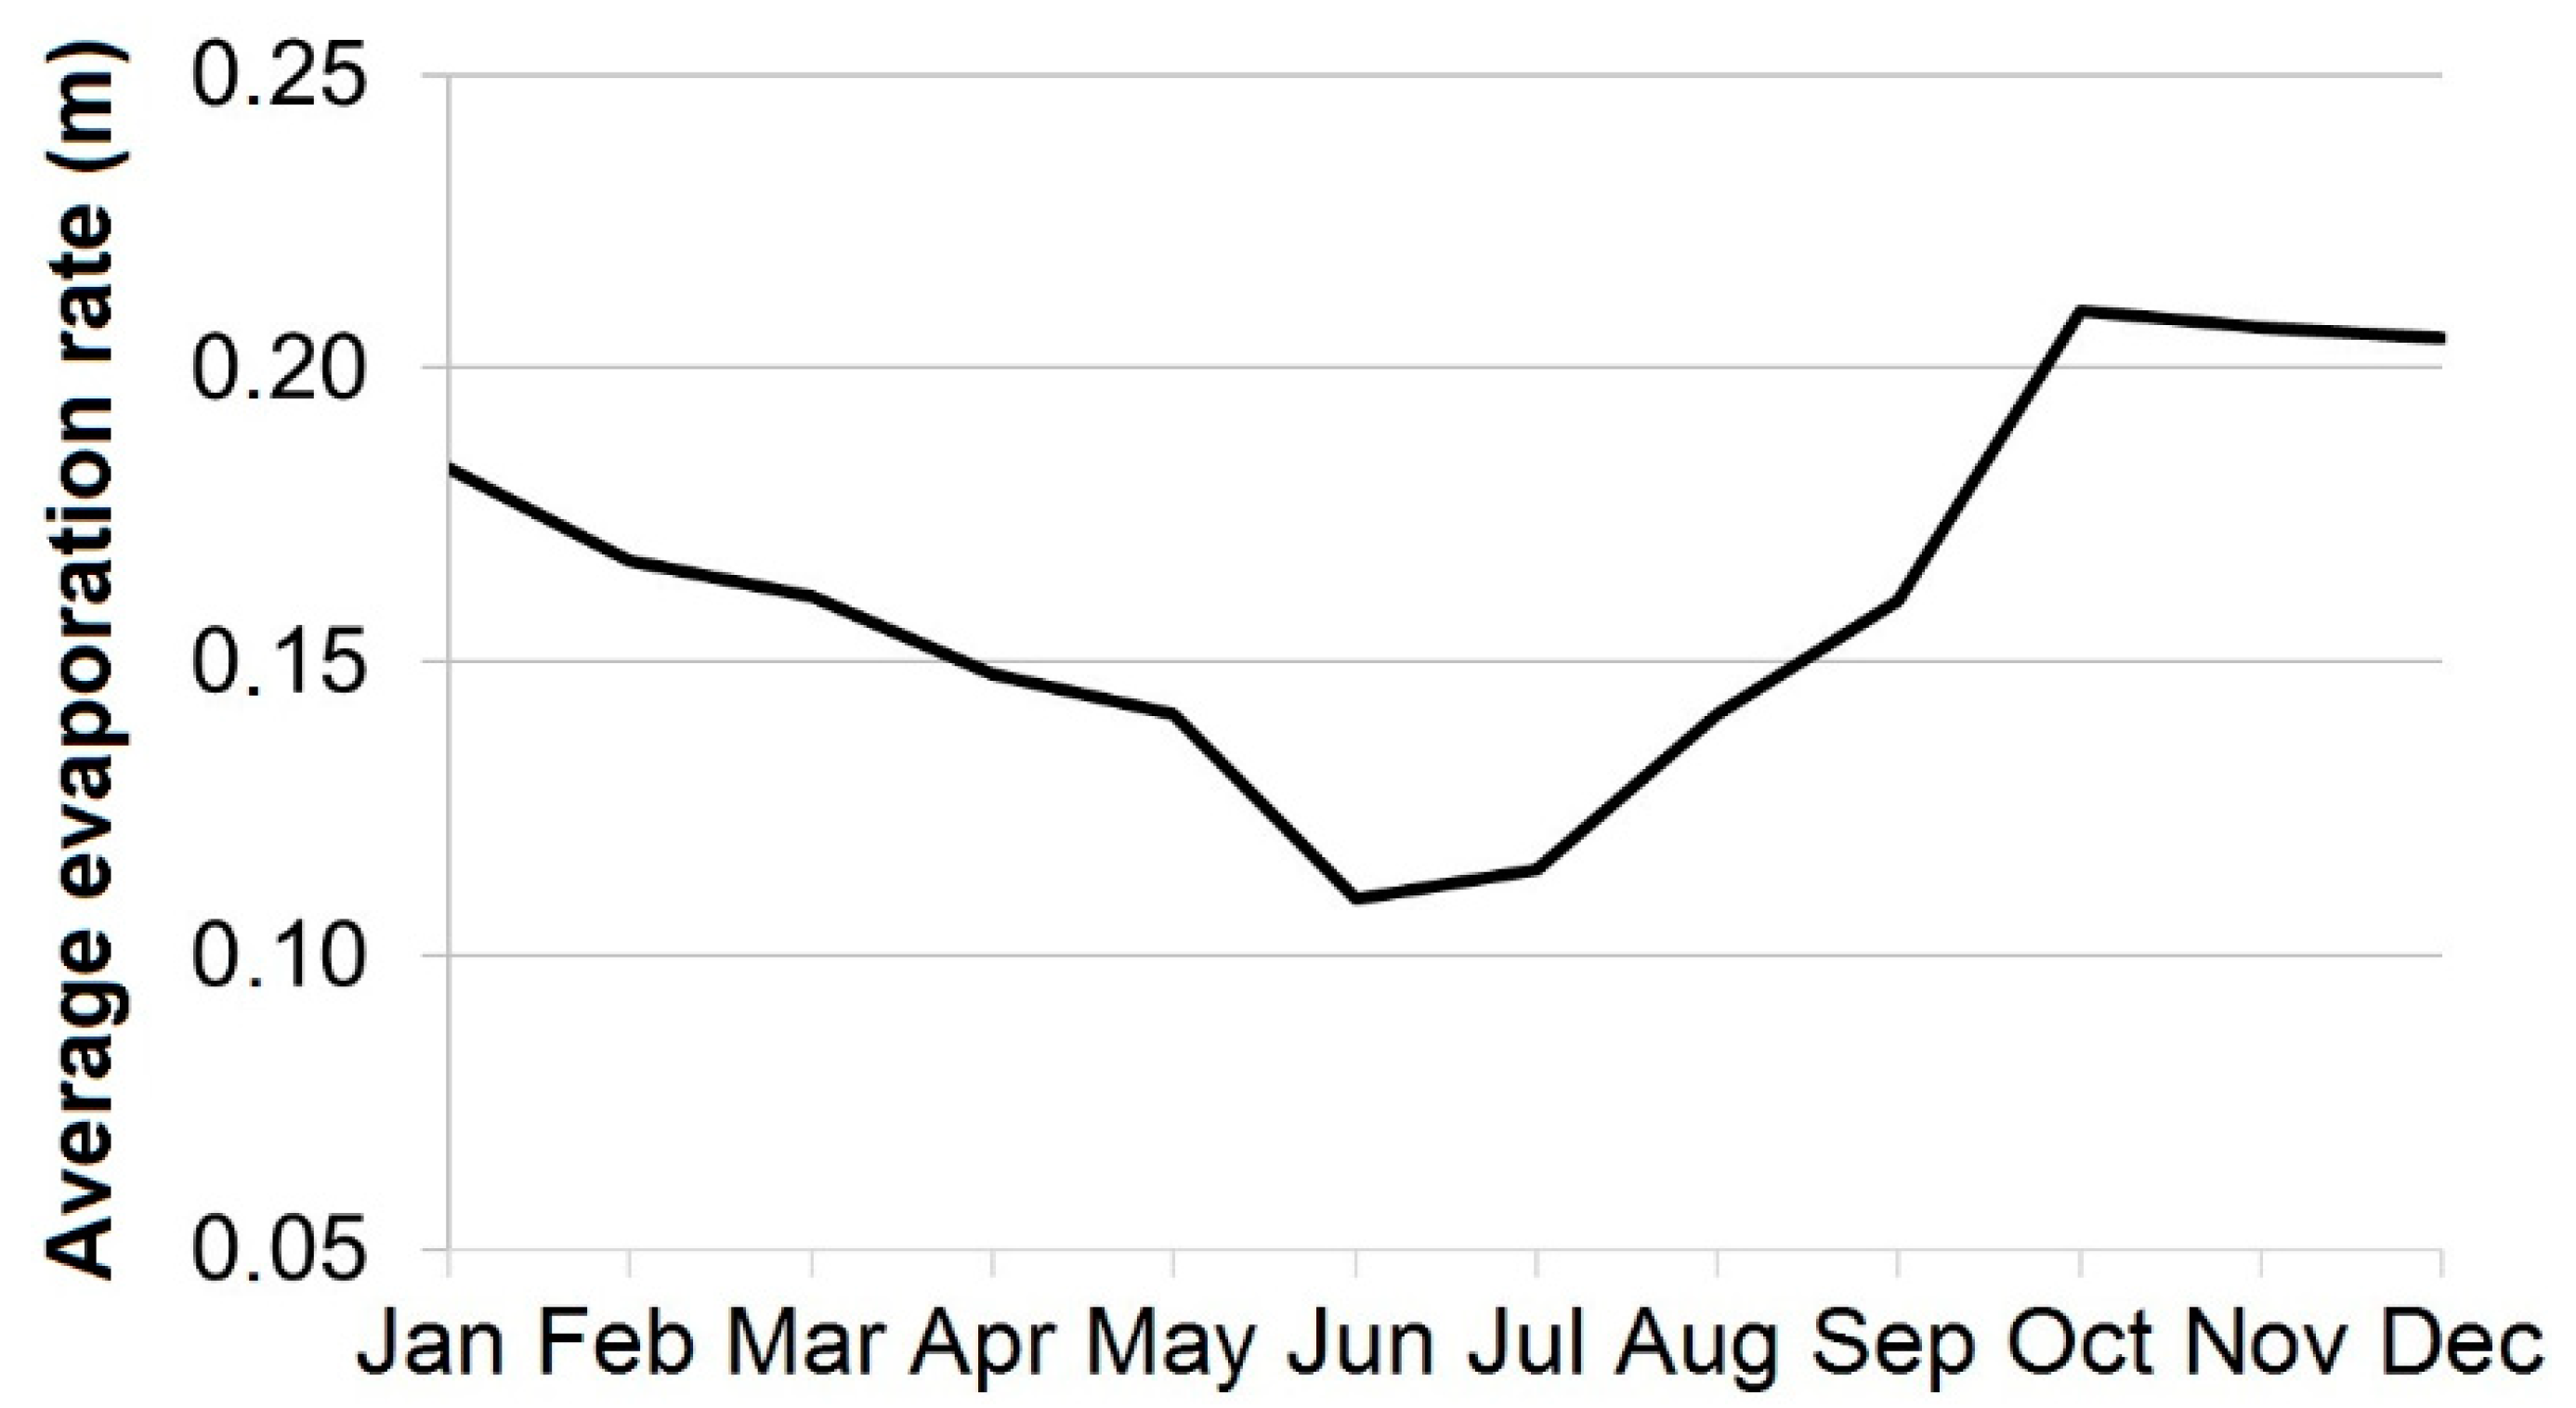
2.1. Case Study
2.2. Scarcity-Based Tariff
2.3. System Dynamics
3. Development of a System Dynamics Model
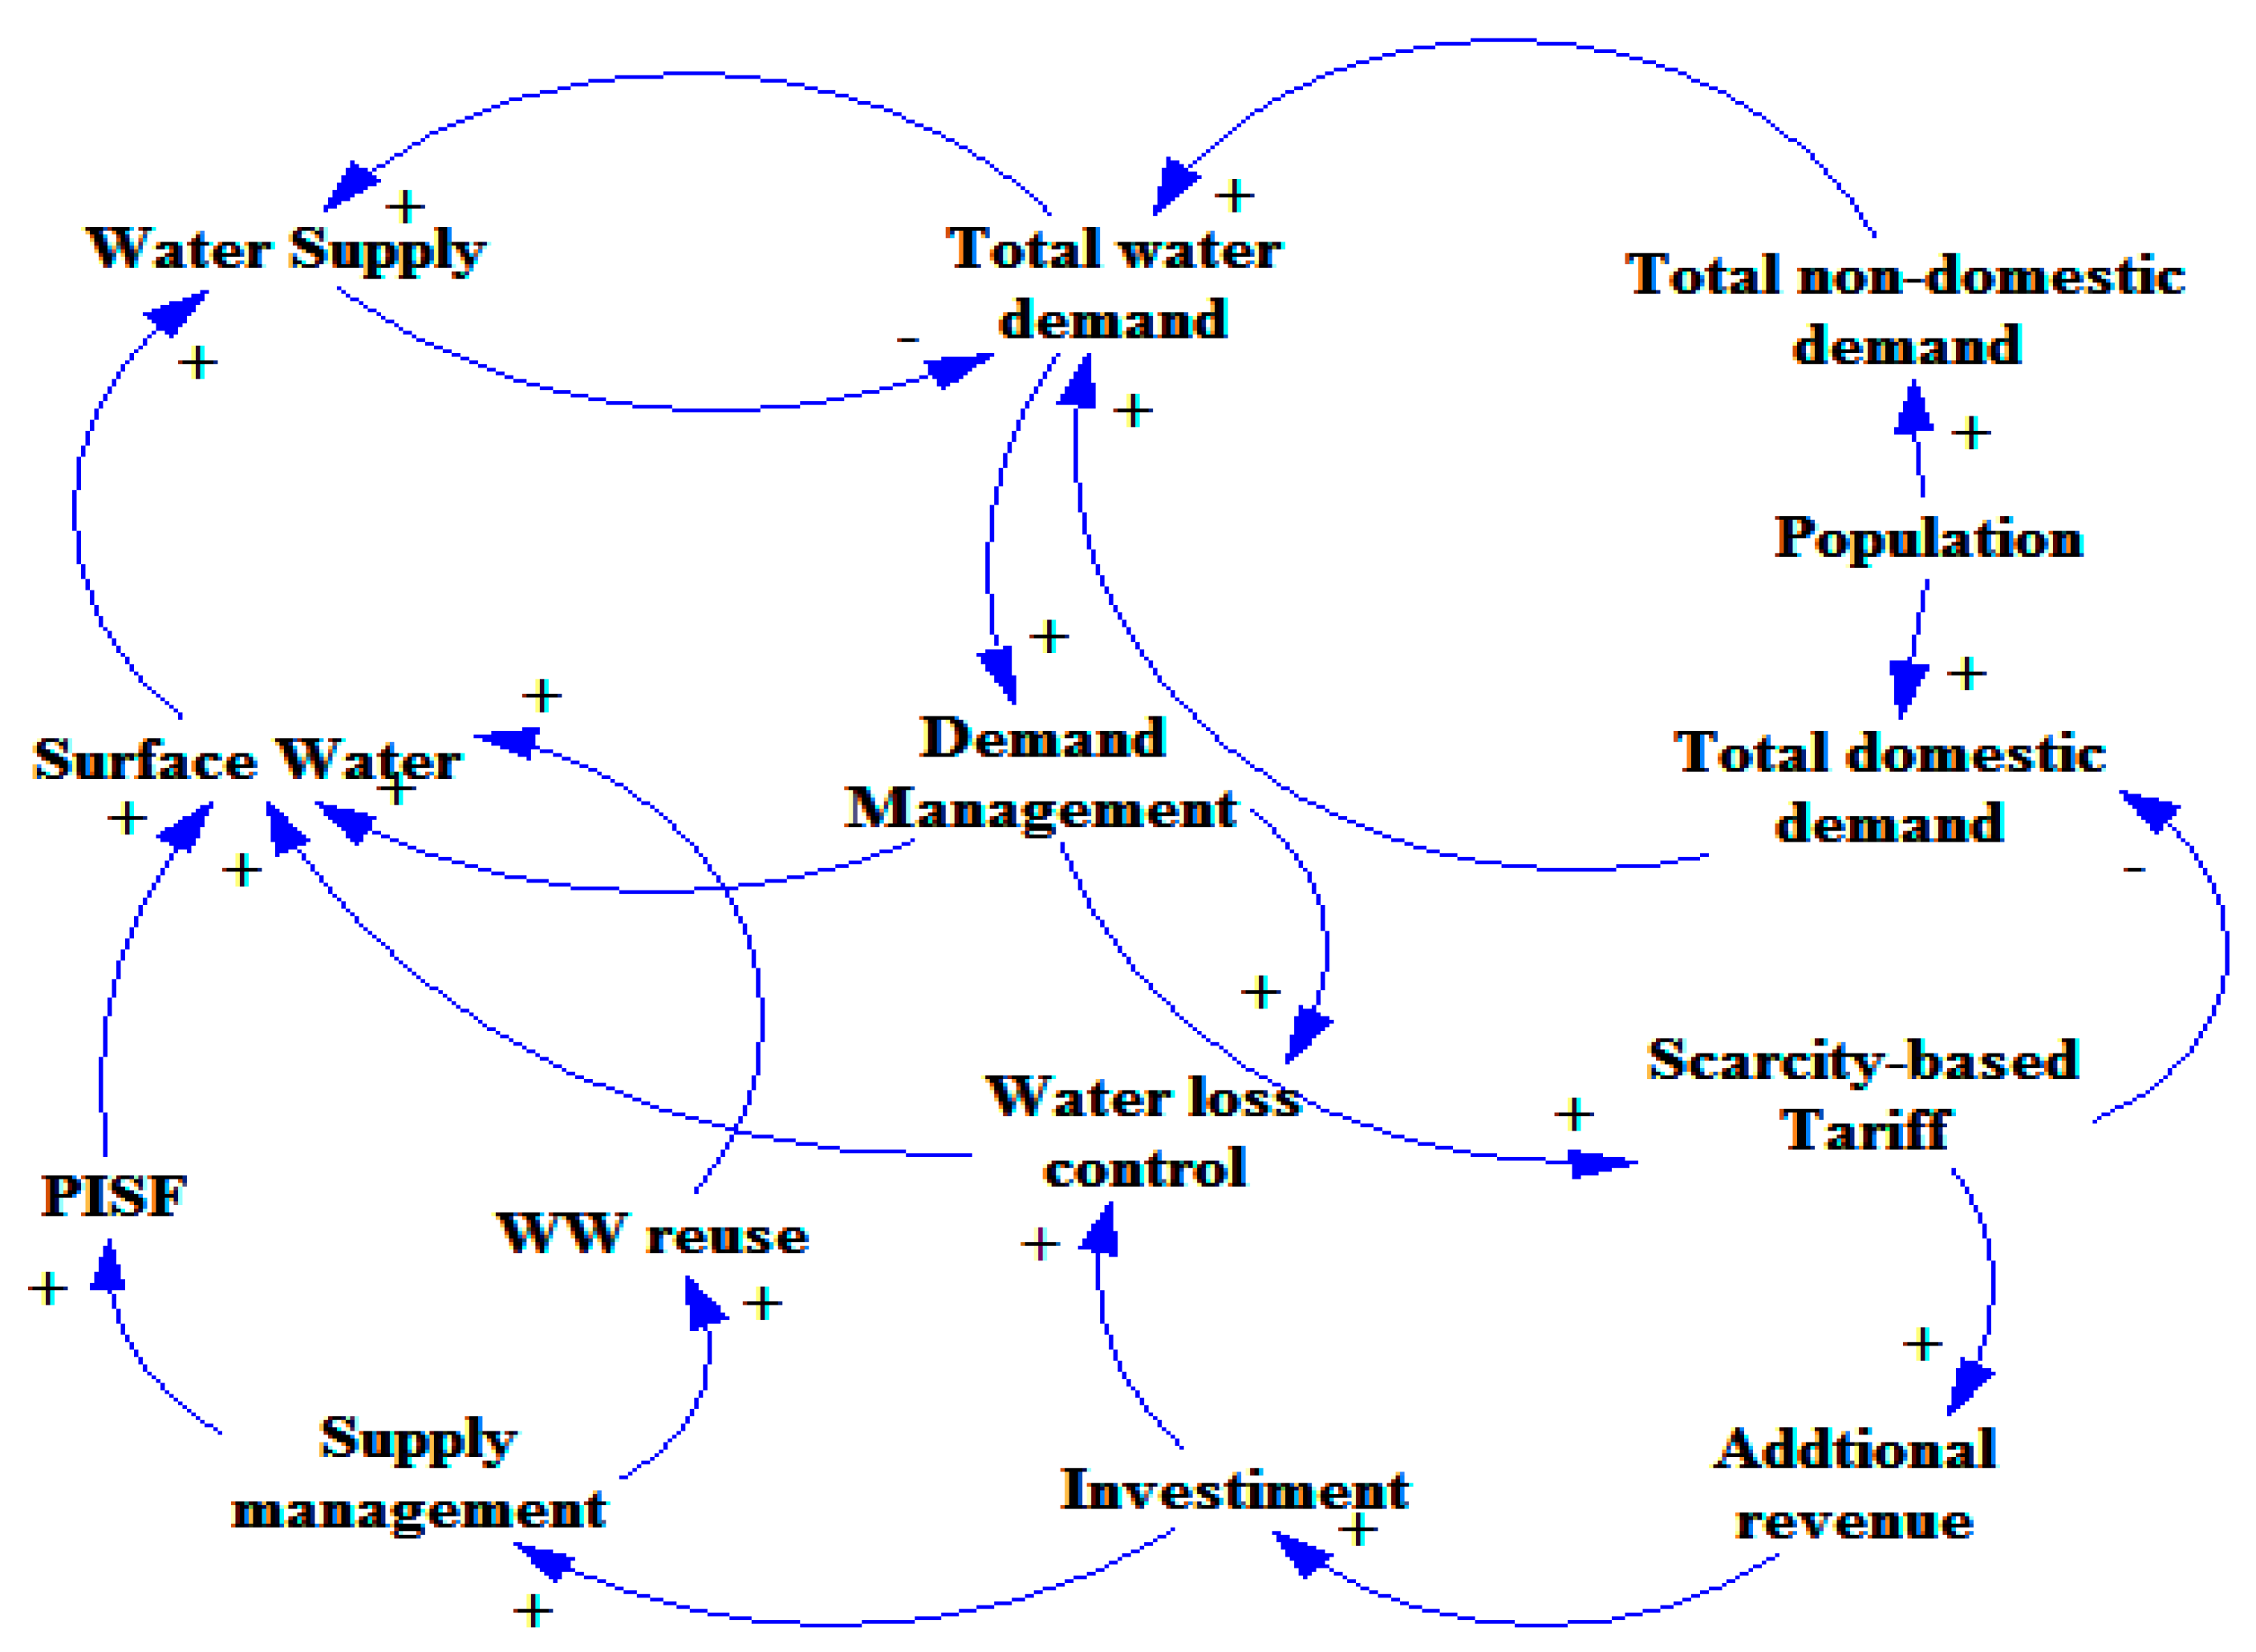
3.1. Causal Loop Diagram for the Water in the Semiarid Region of Paraíba (WSPB)-SD Model
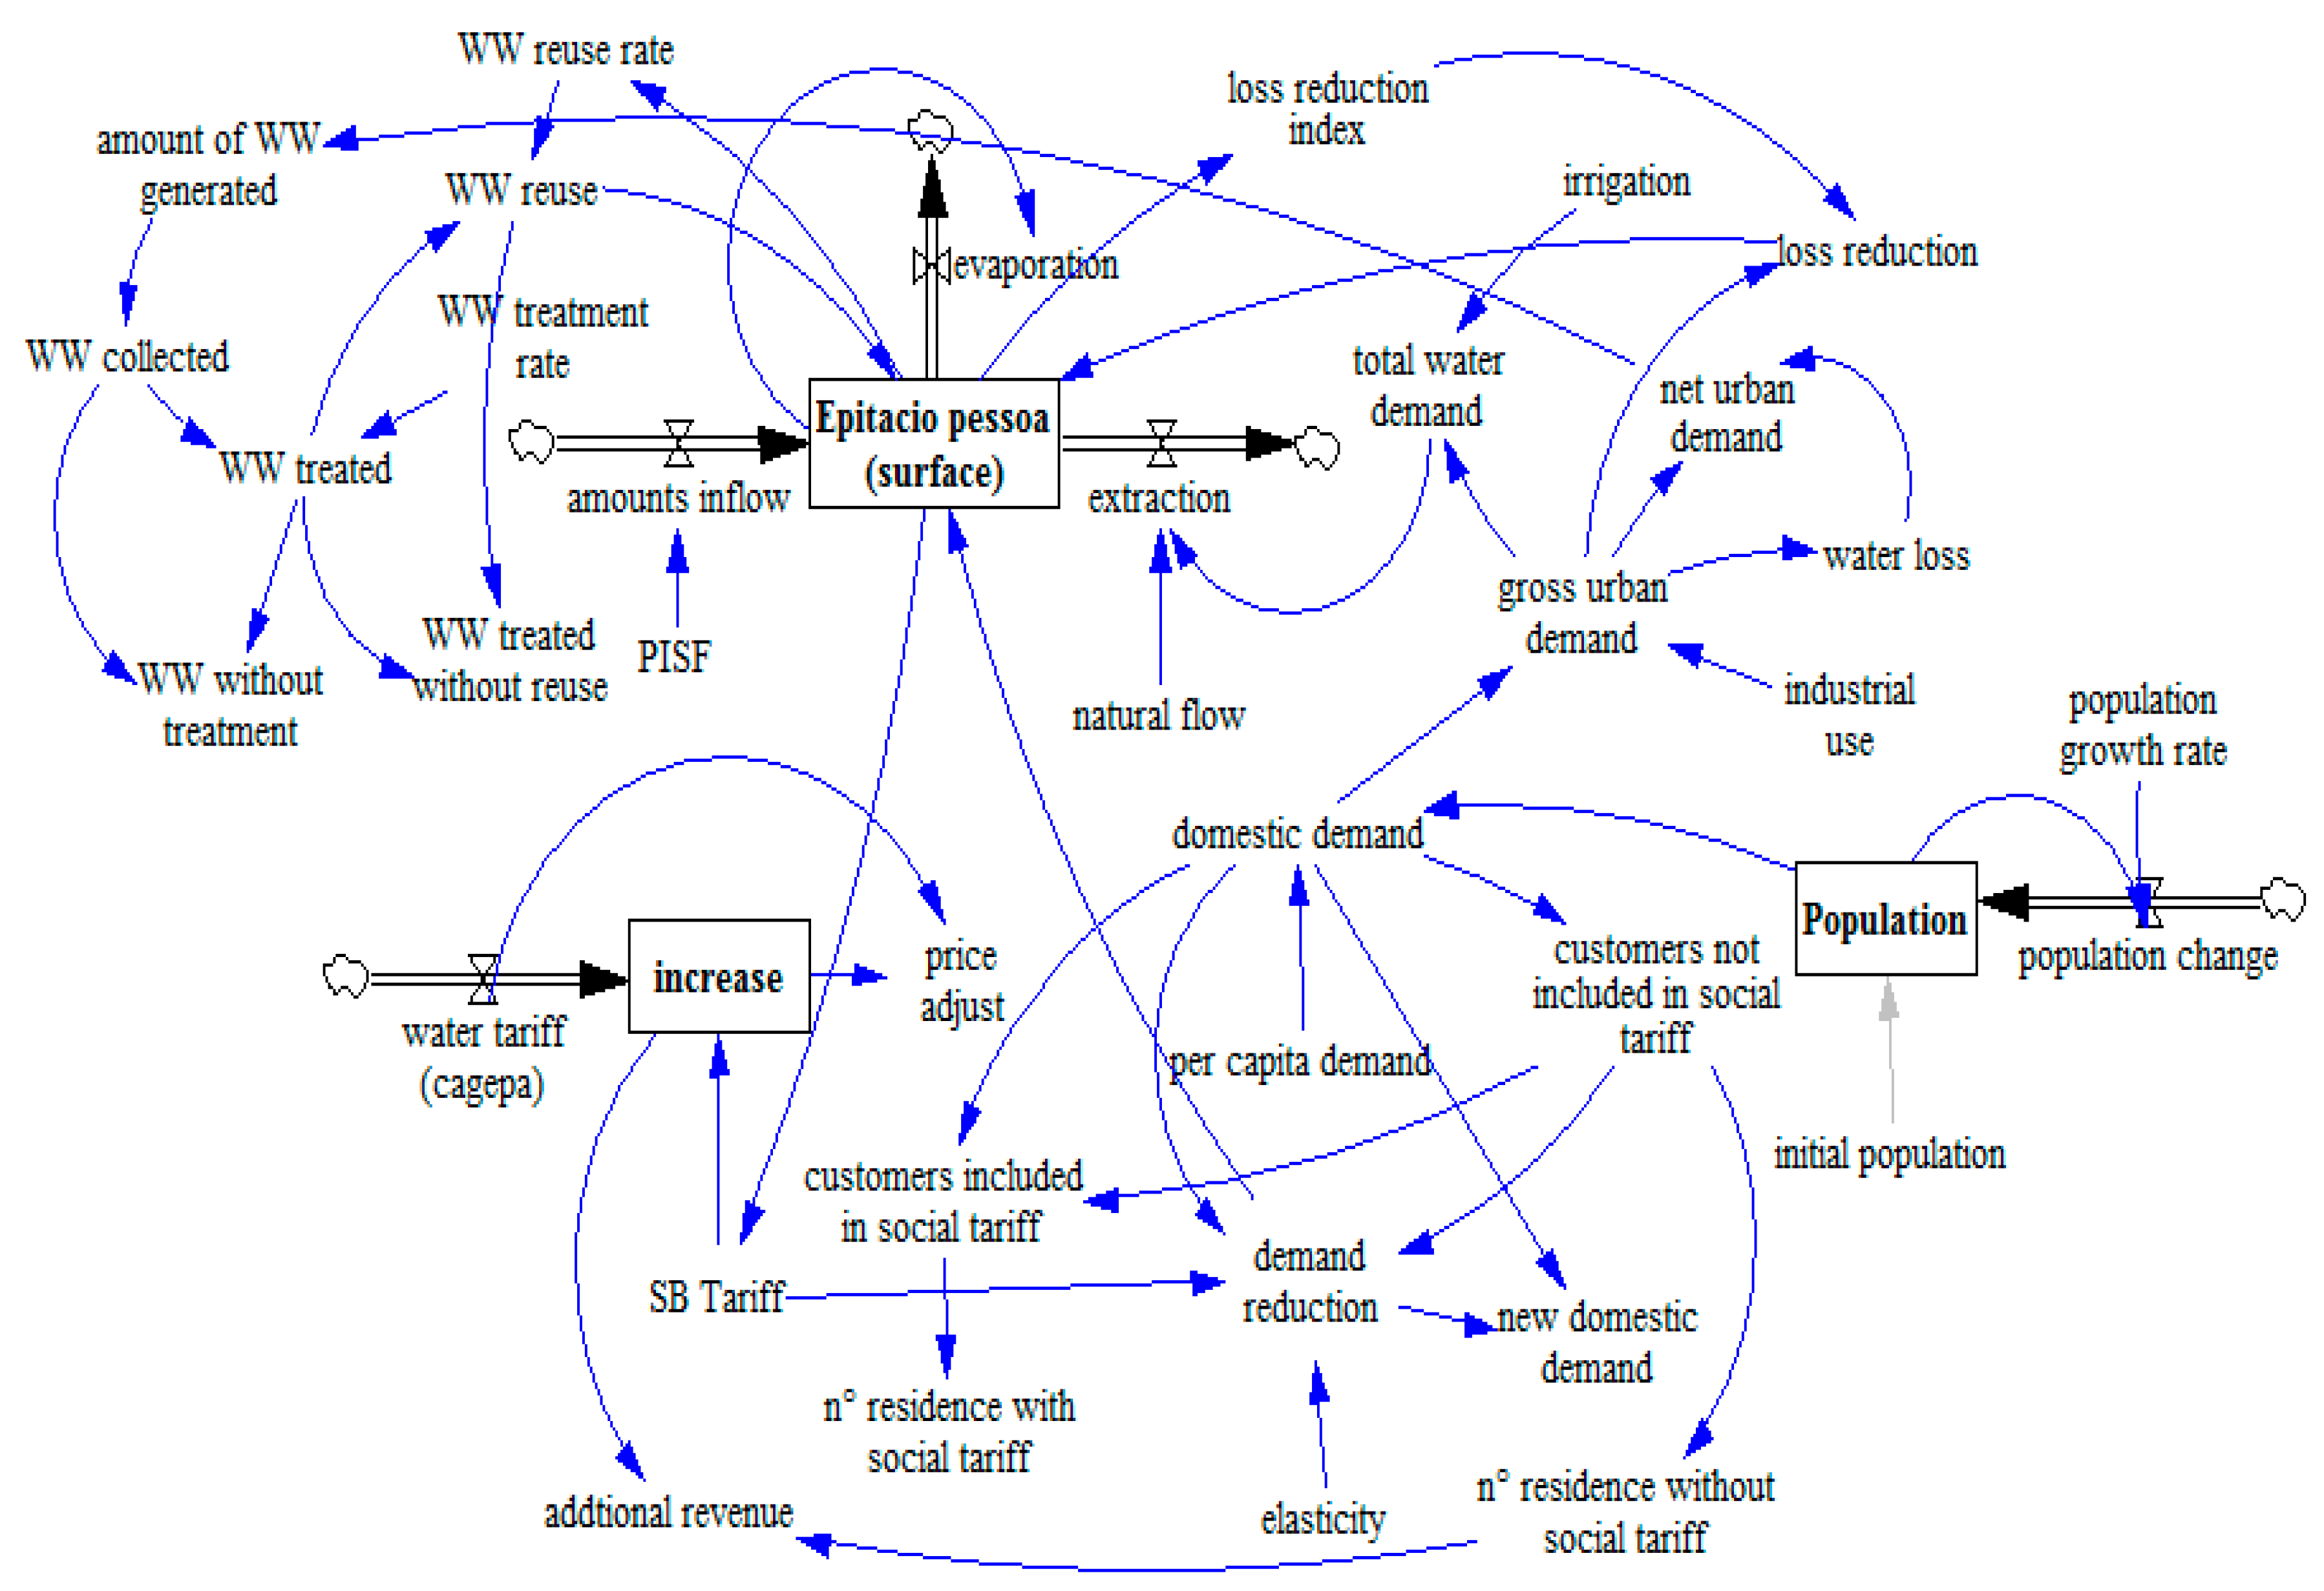
3.2. Stock and Flow Diagram of WSPB-SD Model
3.2.1. Population Sub-Model
3.2.2. Water Supply Sub-Model
3.2.3. Water Demand Sub-Model
3.2.4. Water Tariff Sub-Model
3.2.5. Returned Water Sub-Model
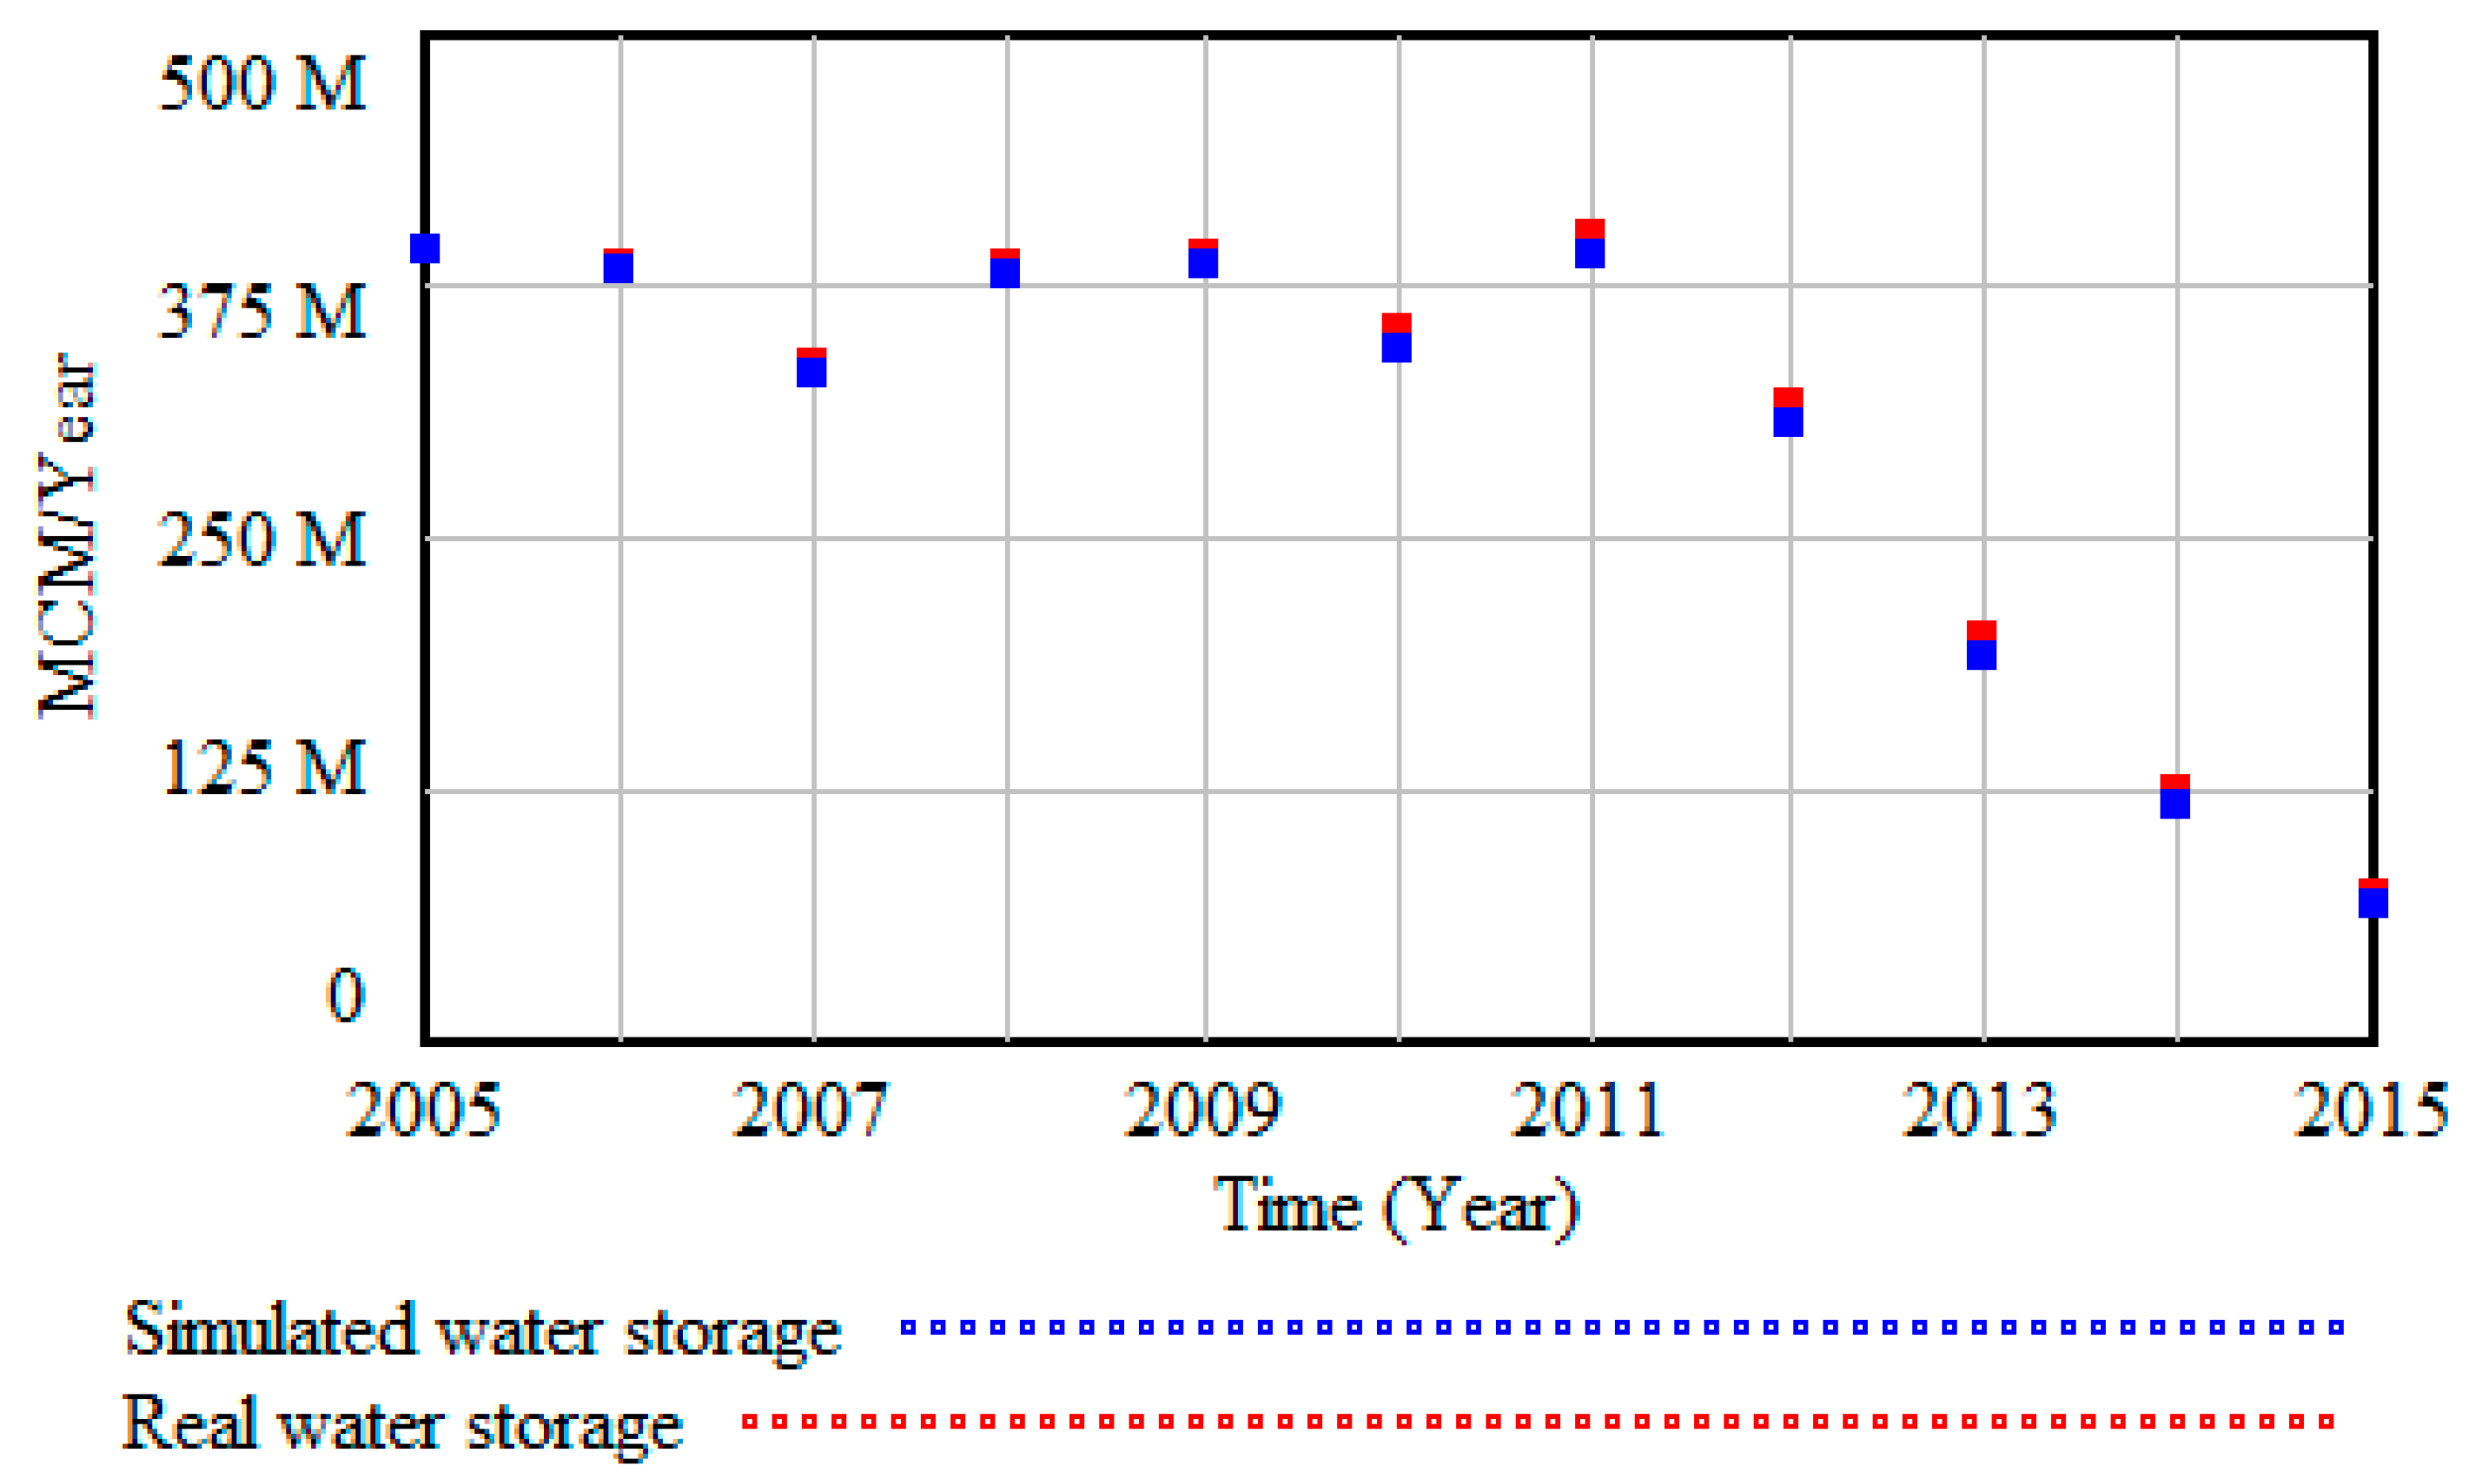
3.3. Model Validation
3.4. Scenarios
4. Simulation Results
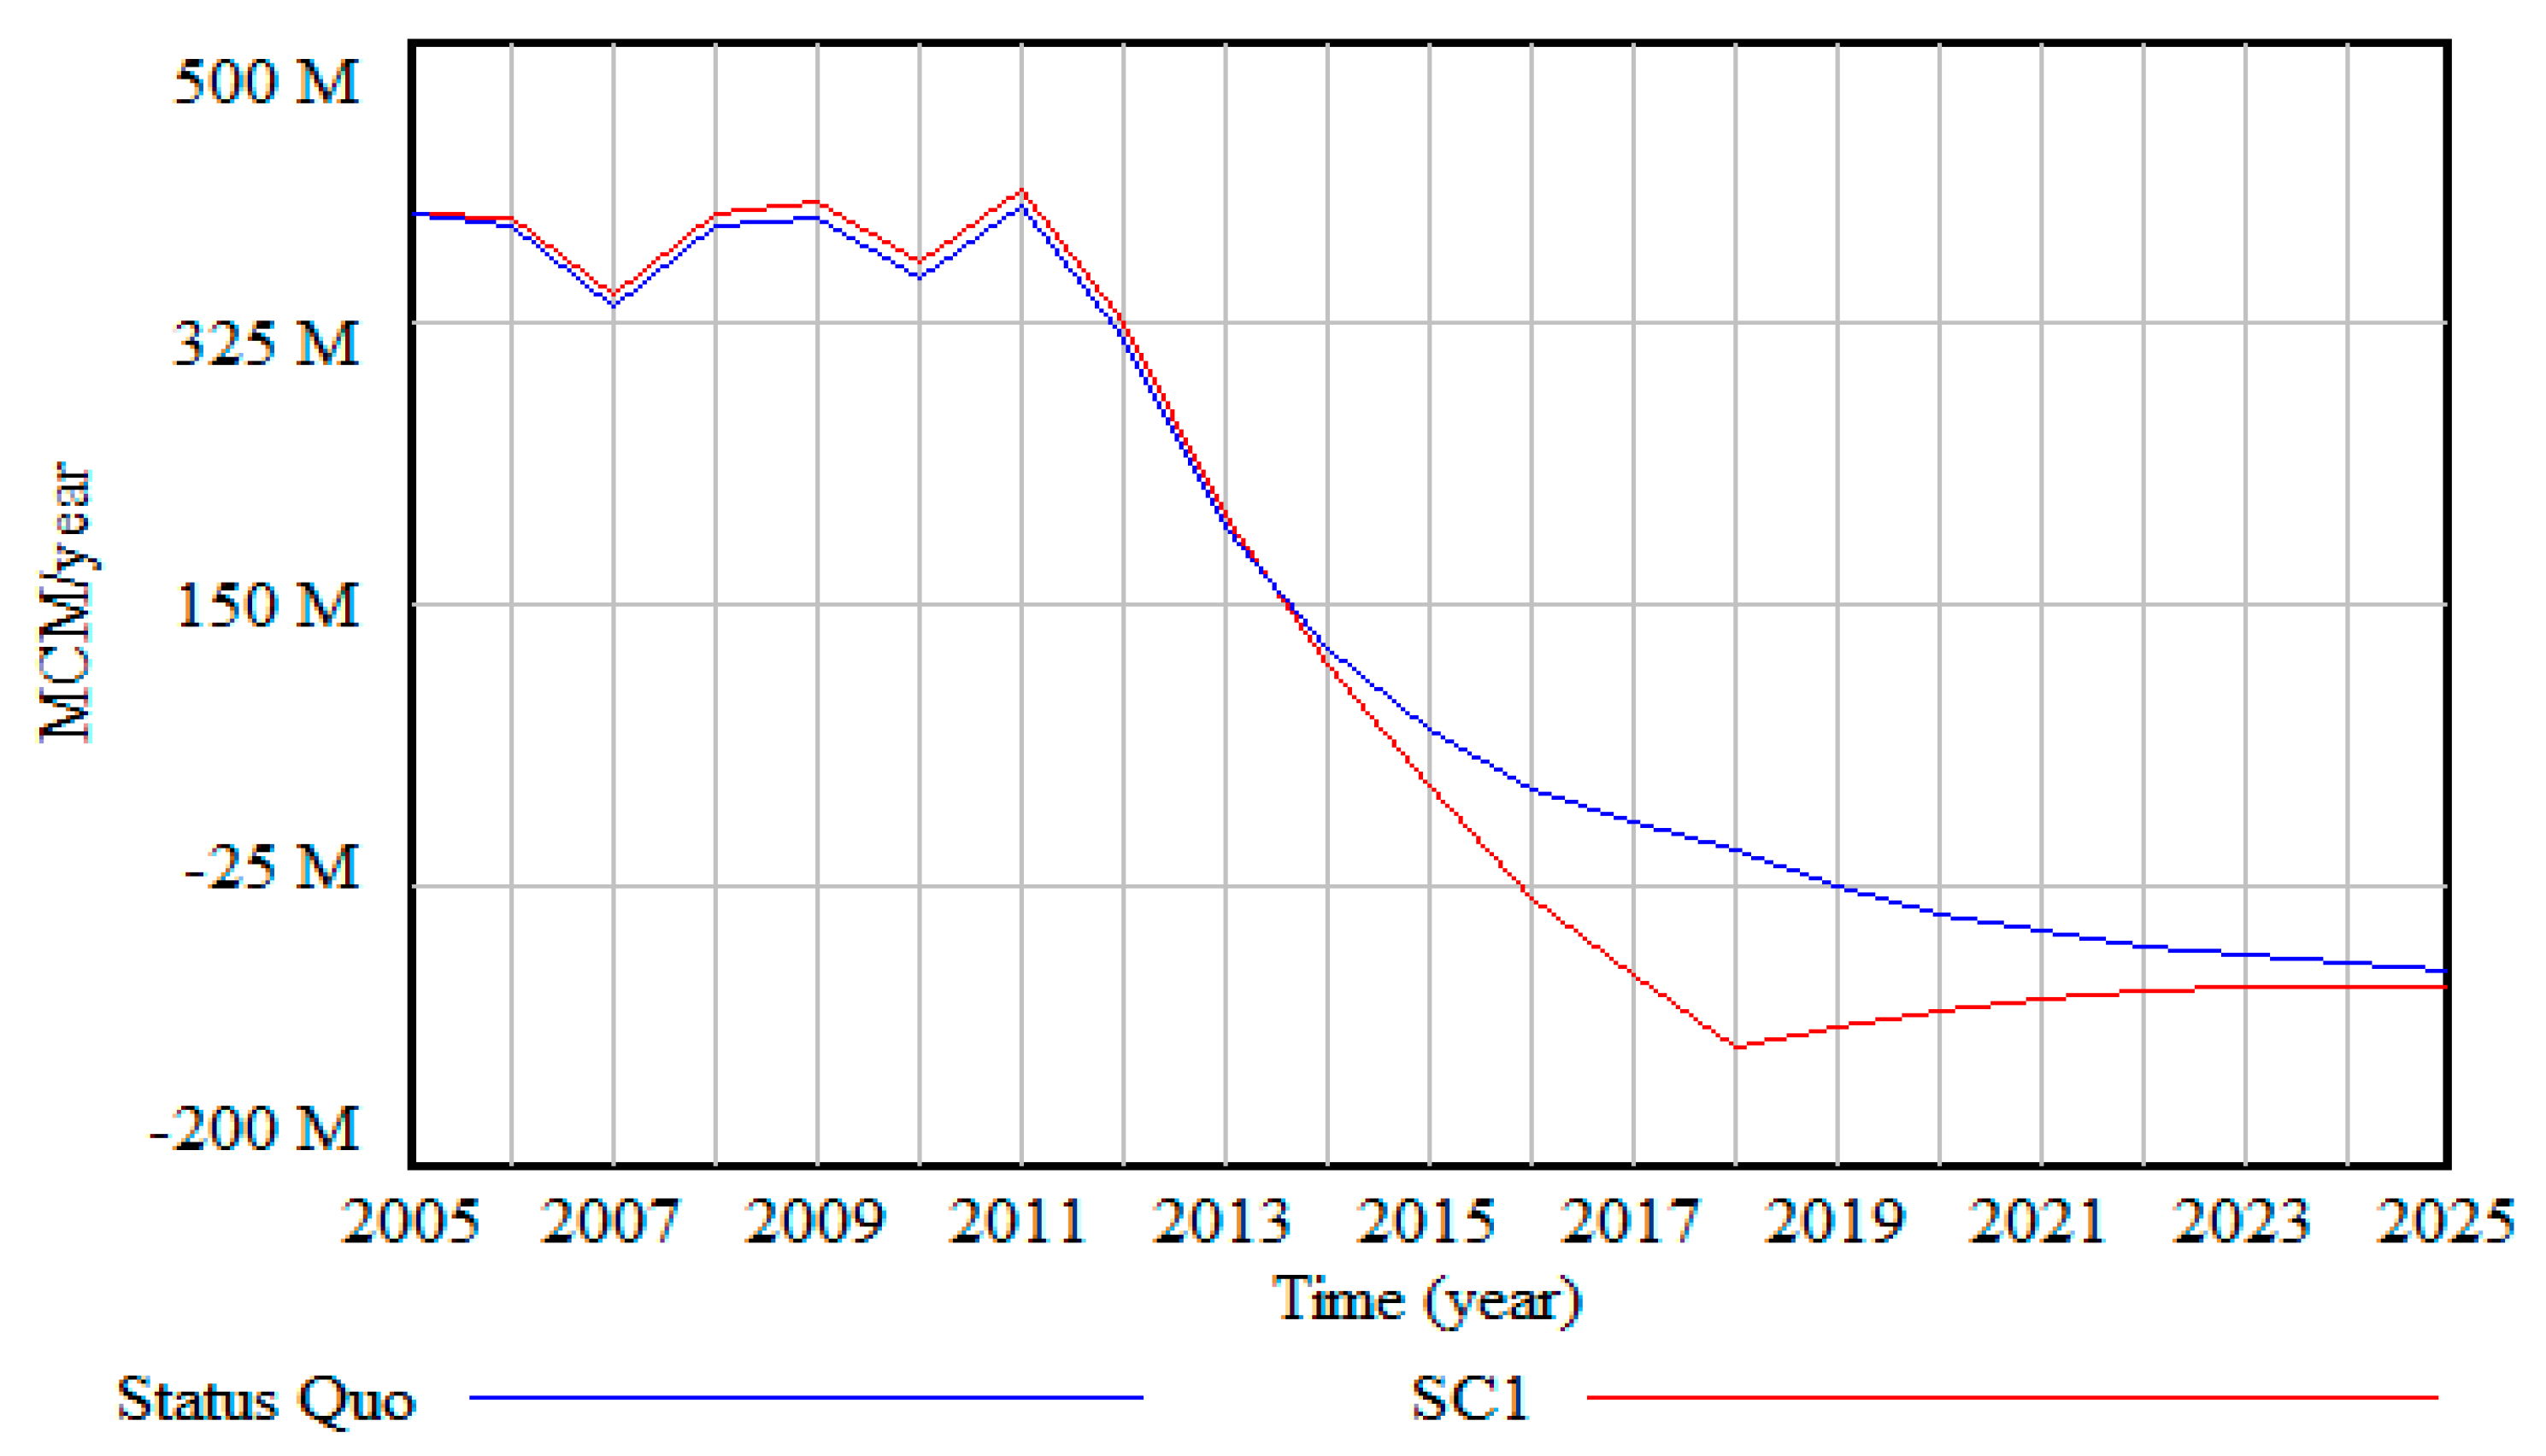
4.1. Status Quo Versus Scenario 1
4.2. Impacts of the Scarcity-Based Tariff on Water Conservation—(SC2)
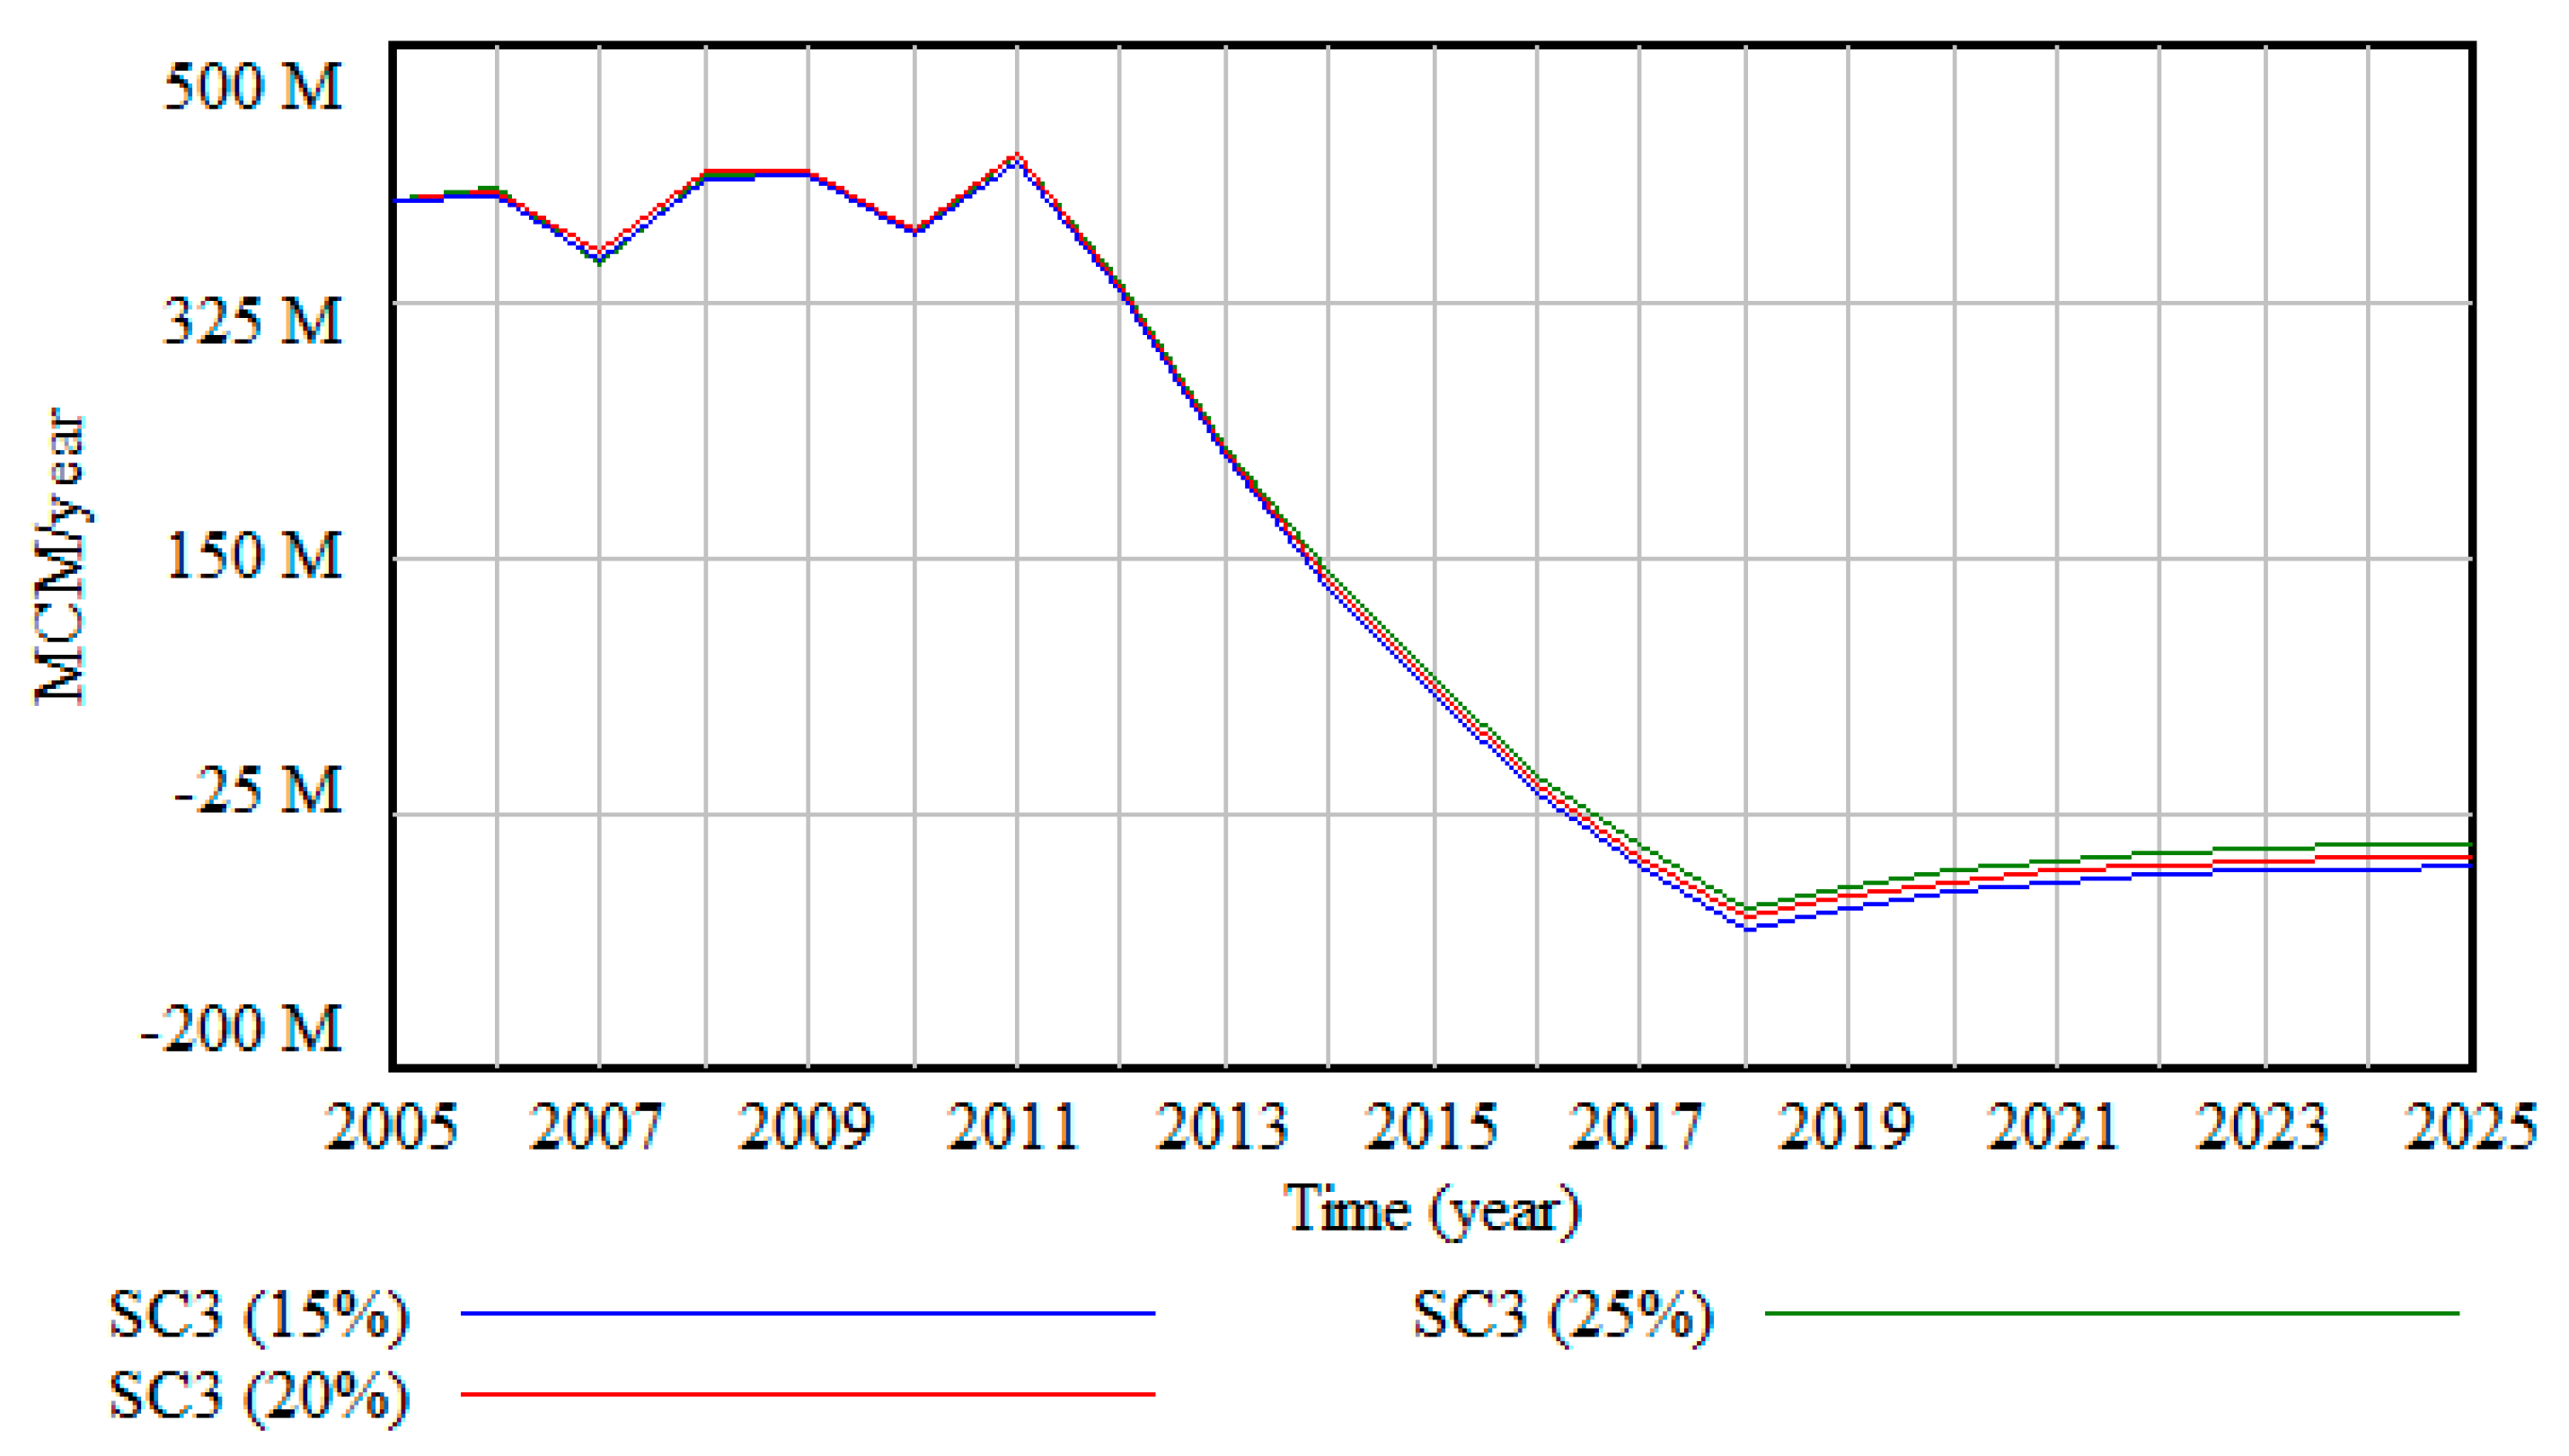
4.3. Impacts of Loss Control on Water Conservation—(SC3)
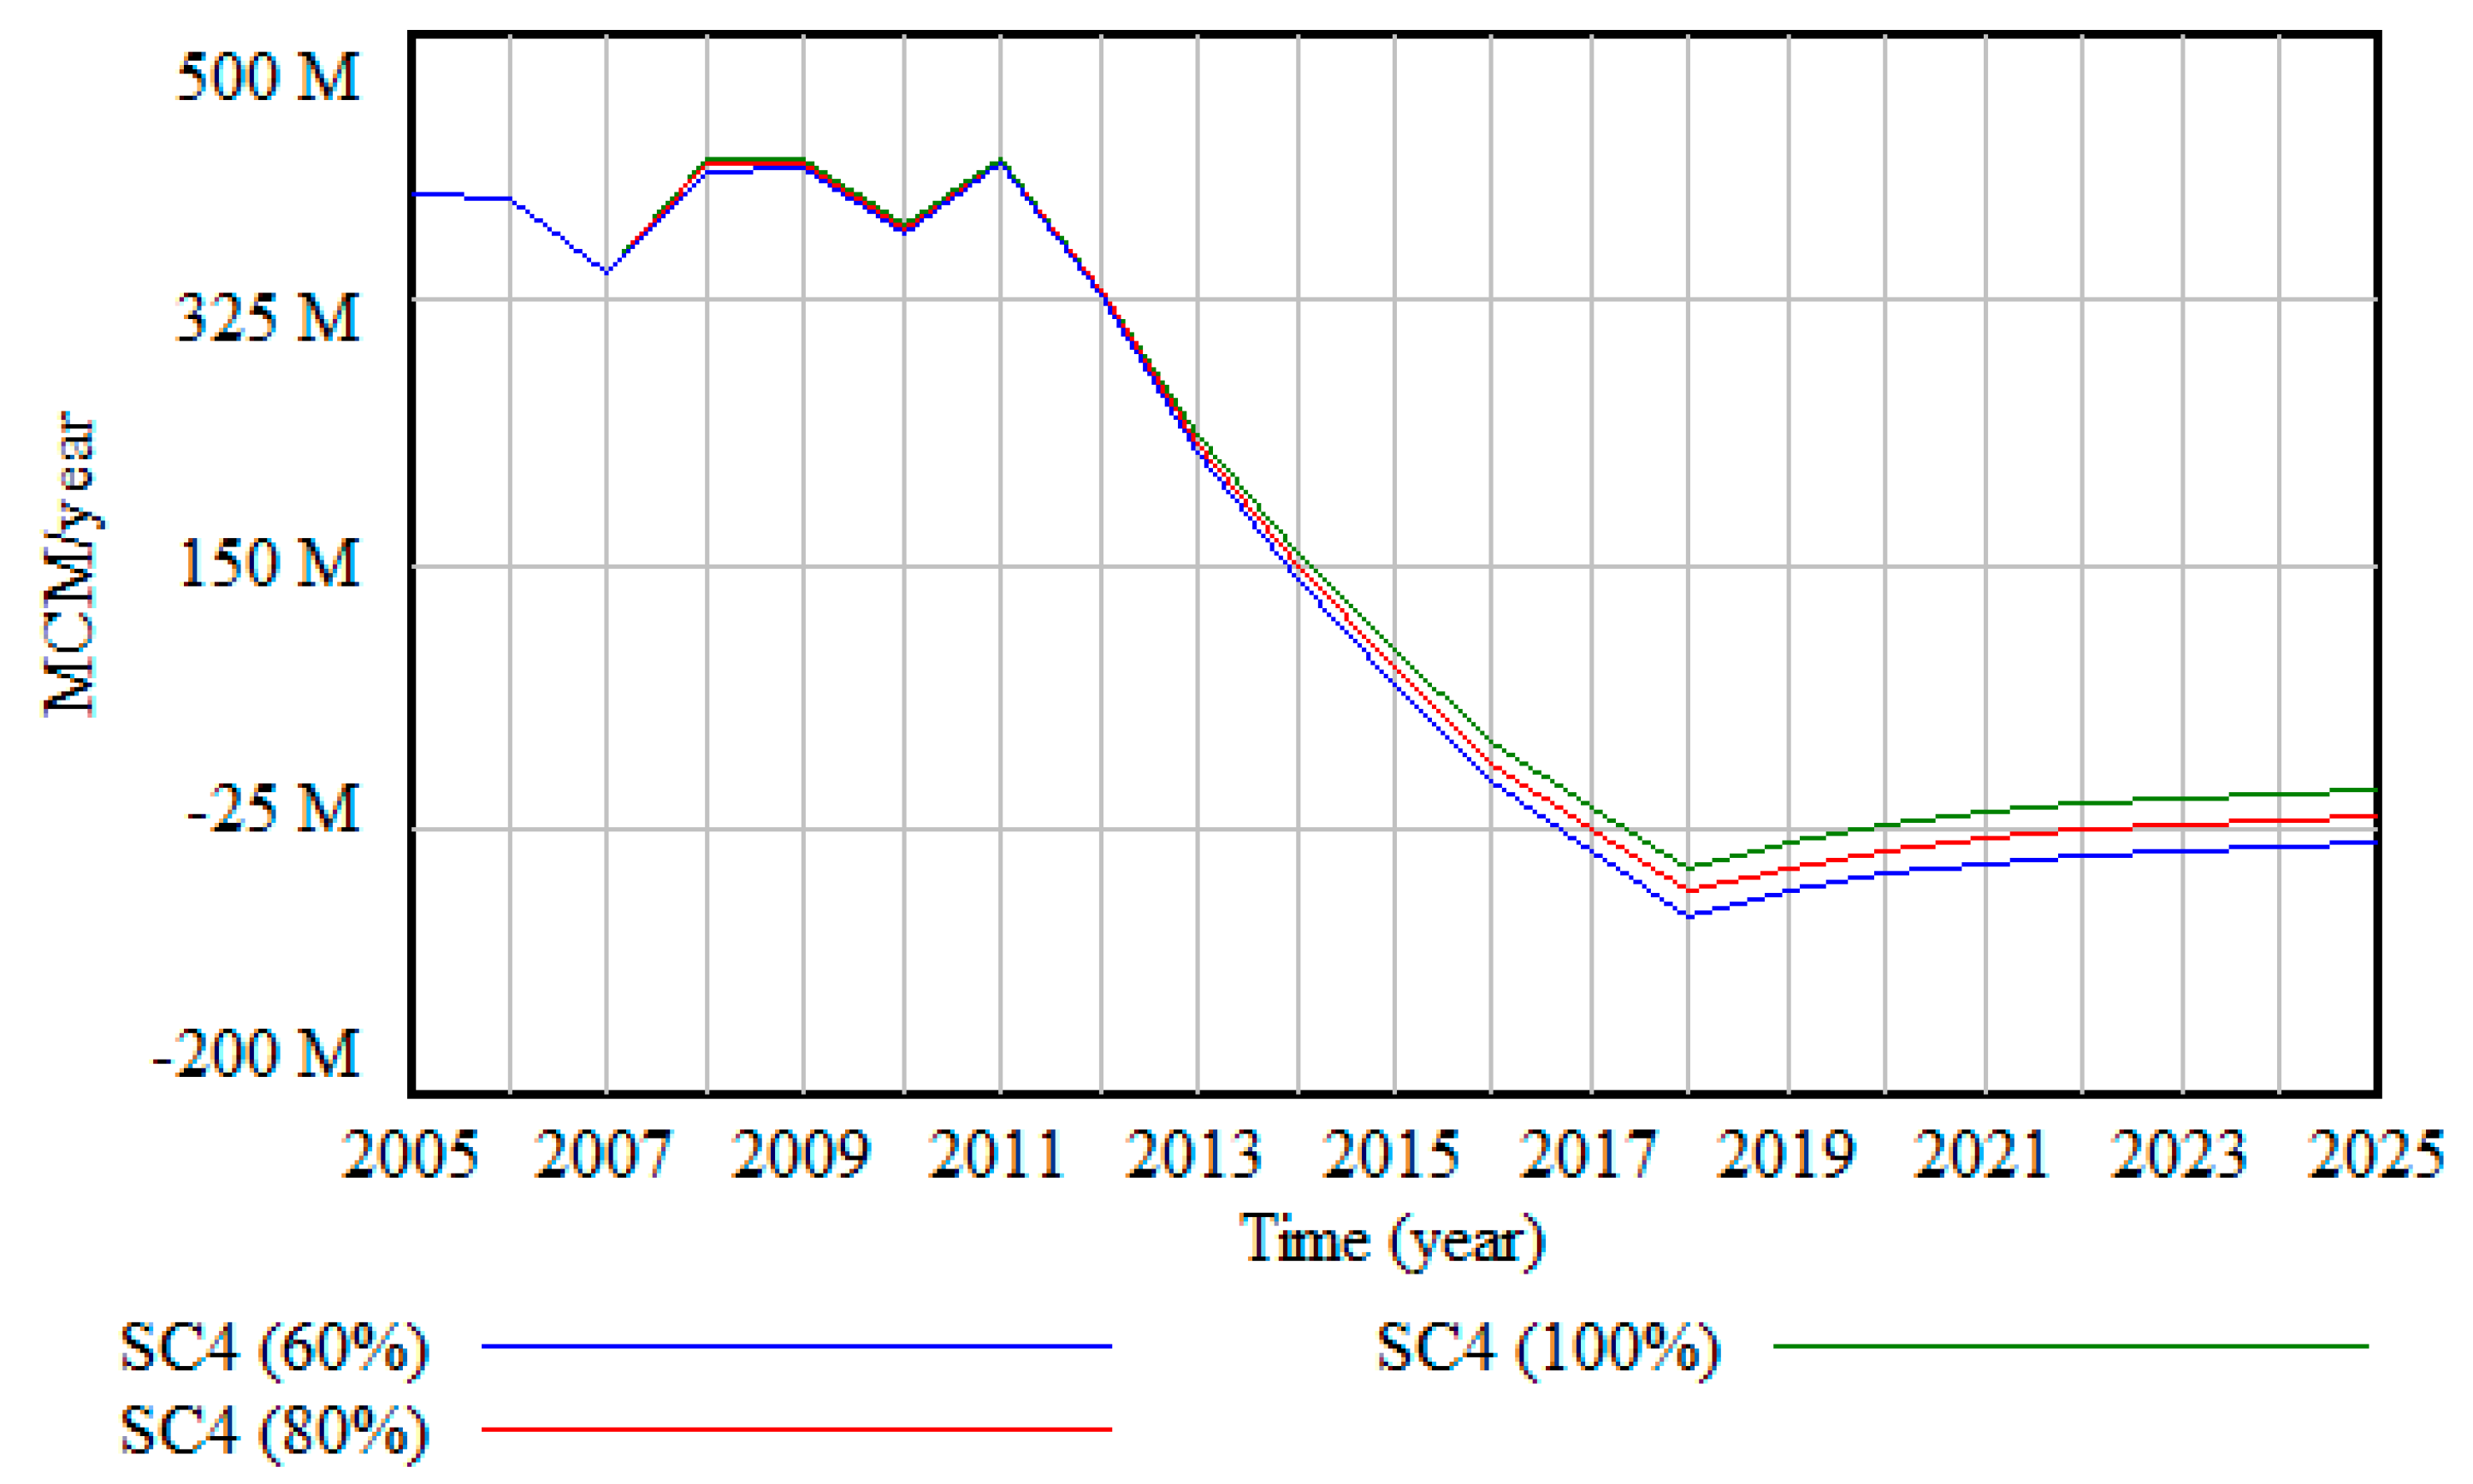
4.4. Impacts of Wastewater Reuse on Water Supply—(SC4)
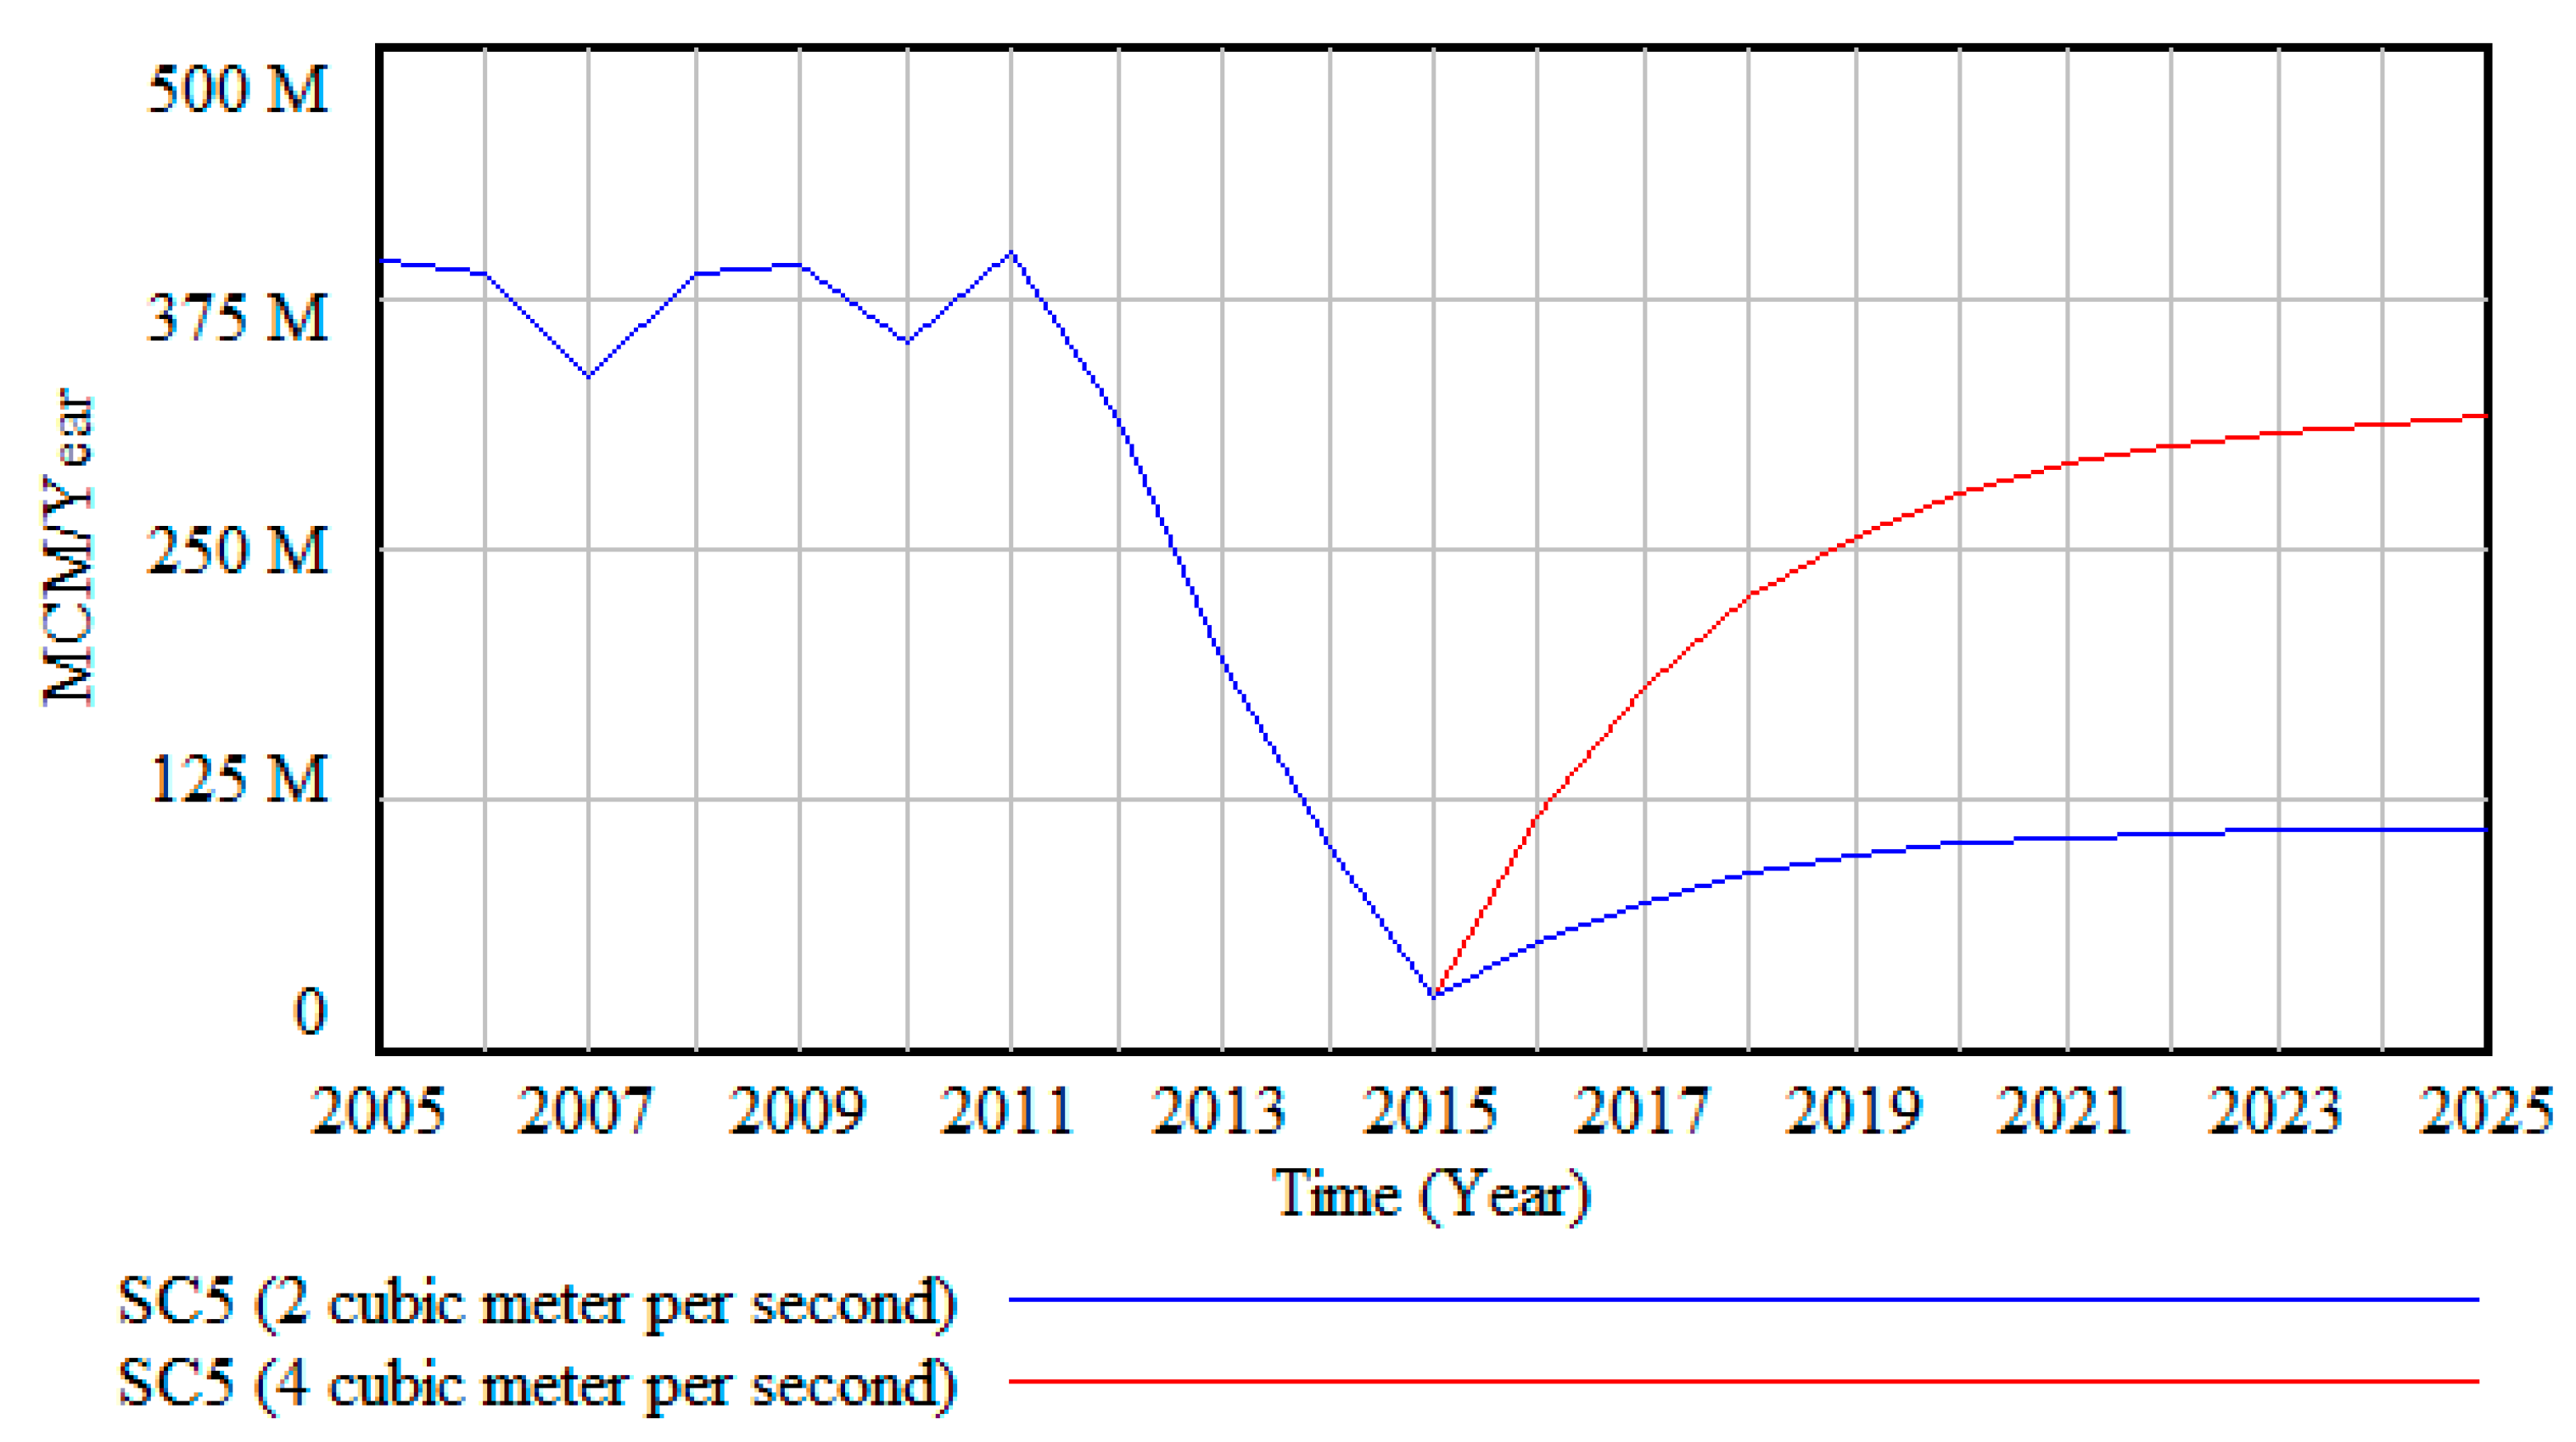
4.5. Impacts of Inter-Basin Water Transfer on Water Supply—(SC5)
4.6. Combining the Impacts of Wastewater Reuse and Scarcity-Based Tariffs on Conservation and Water Supply—(SC6)
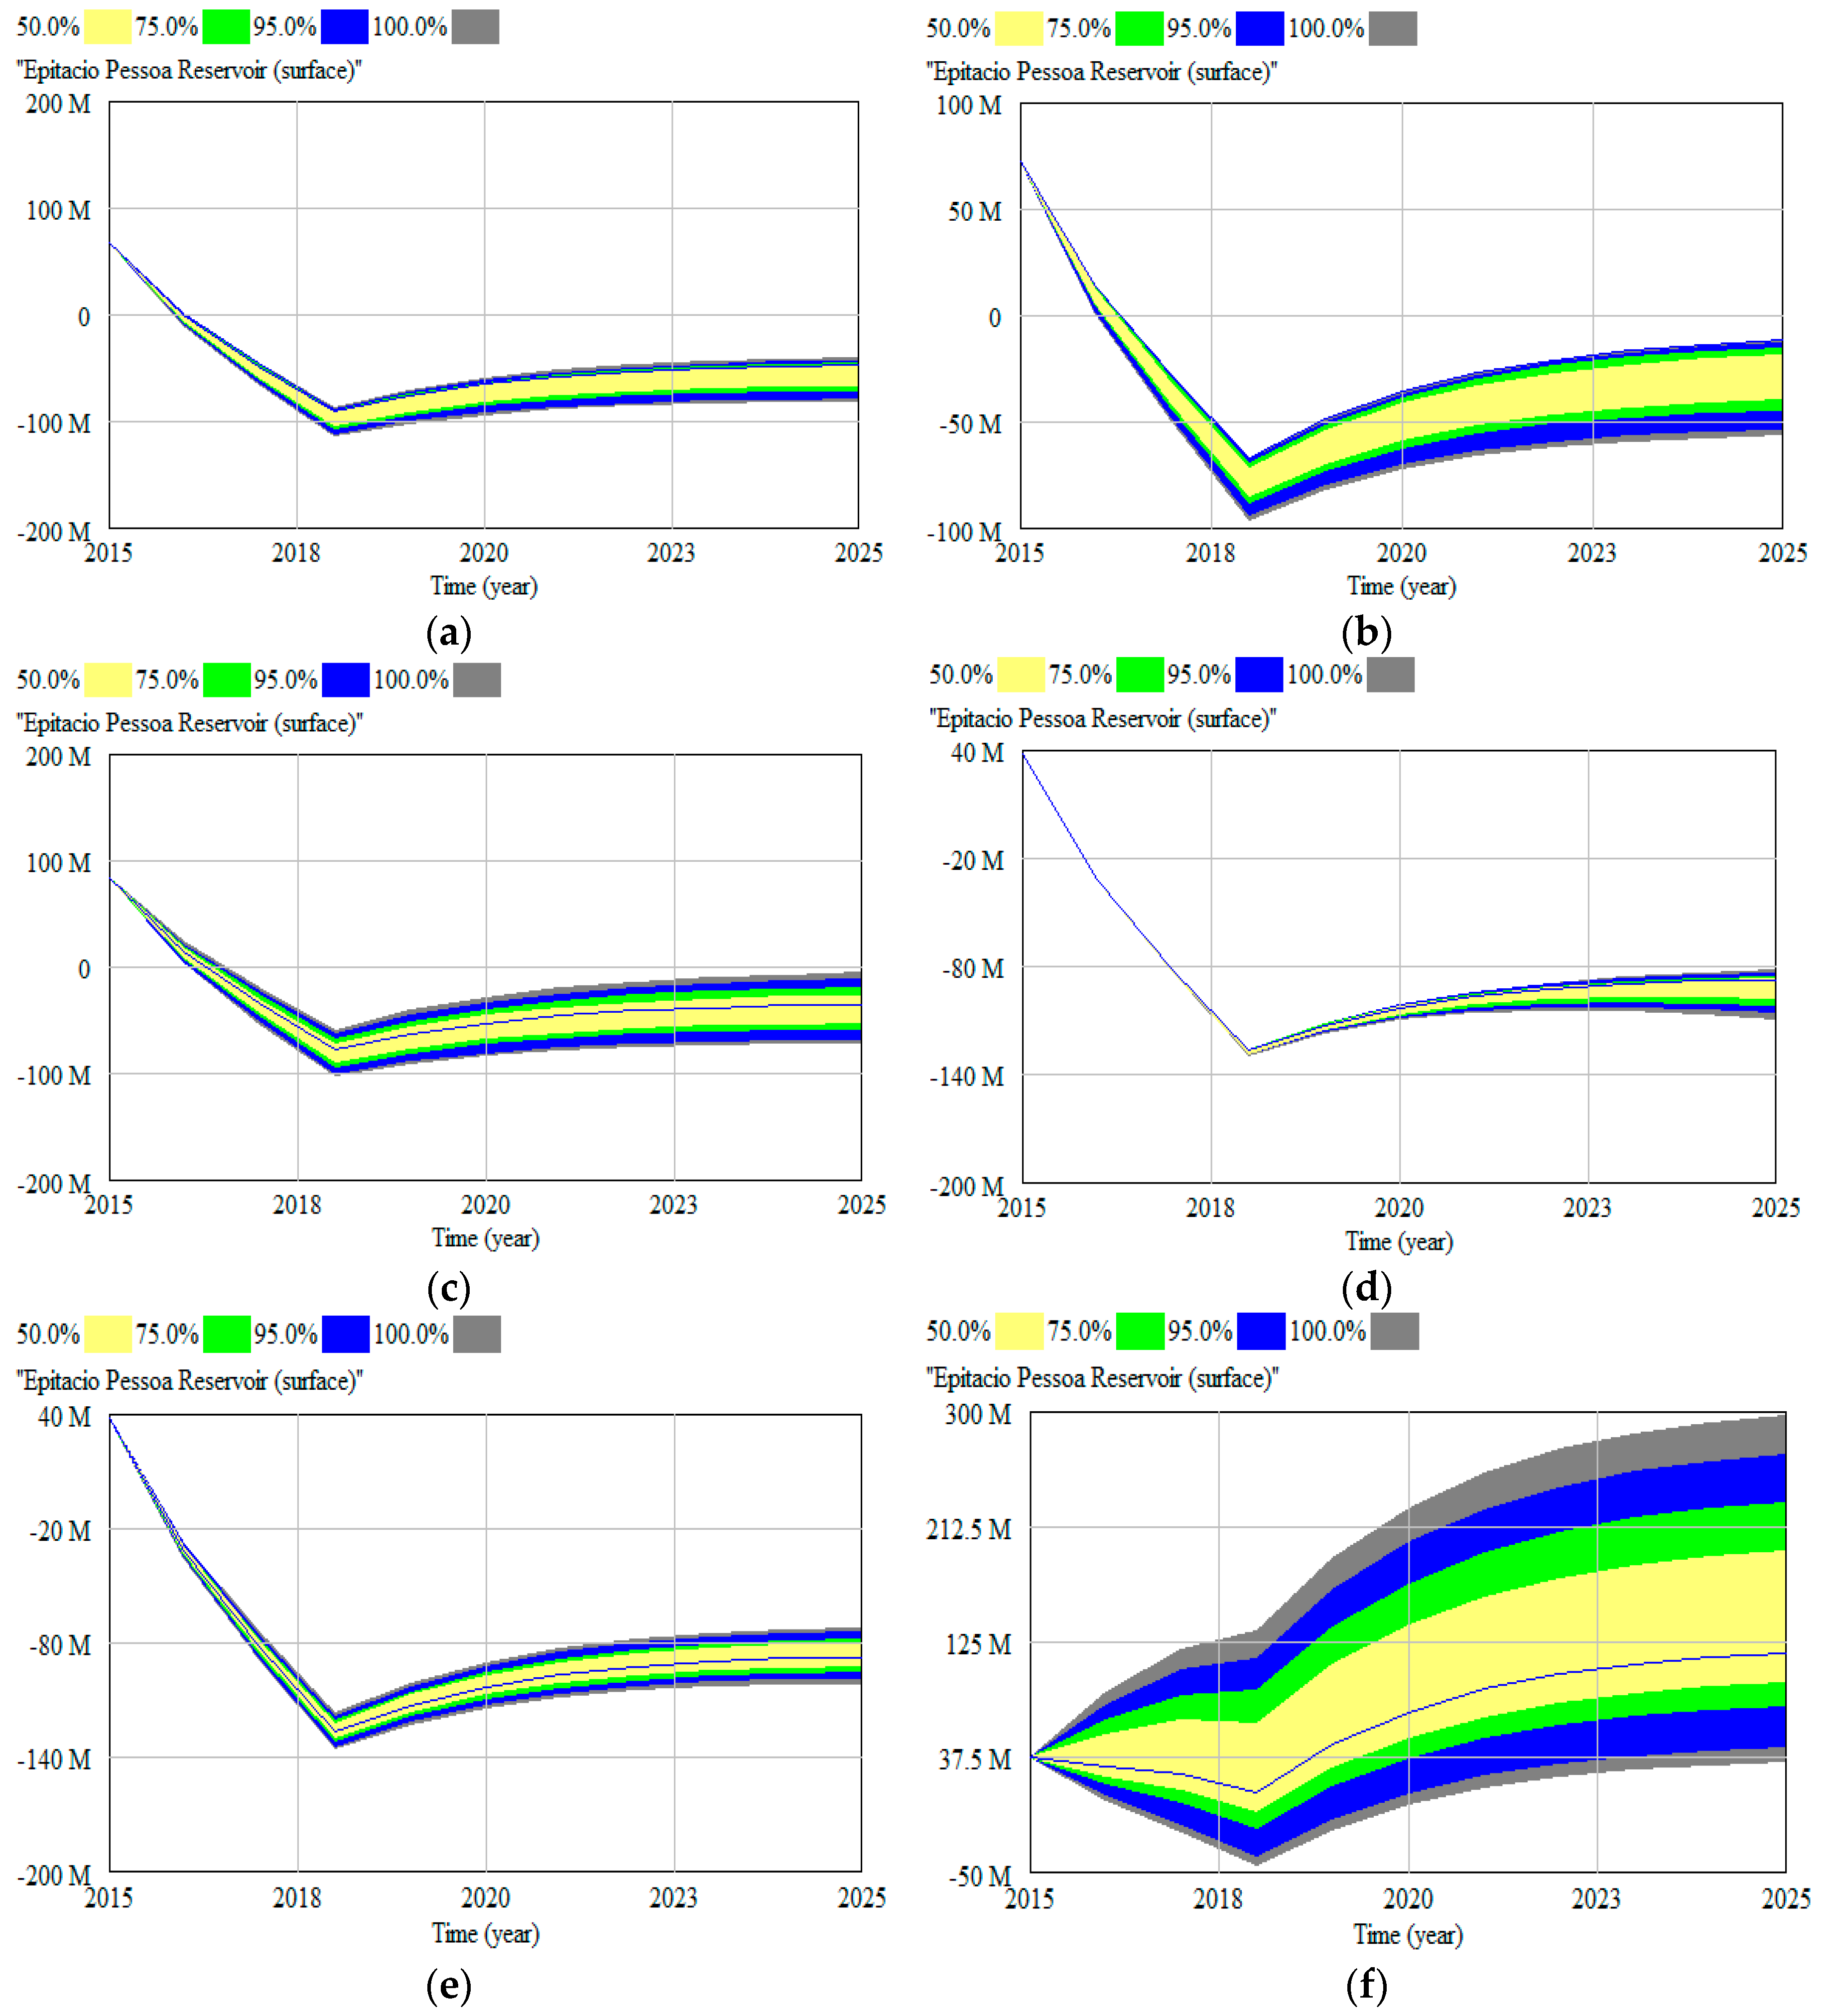
5. Uncertainty Simulation by Monte Carlo Simulation
6. Conclusions
Author Contributions
Funding
Acknowledgments
Conflicts of Interest
References
- Romano, G.; Salvati, N.; Guerrini, A. An Empirical Analysis of the Determinants of Water Demand in Italy. J. Clean. Prod. 2017, 130, 74–81. [Google Scholar] [CrossRef]
- WHO/UNICEF. Progress on Drinking Water, Sanitation and Hygiene. Update. In Joint Monitoring Program for Water Supply, Sanitation and Hygiene (JMP); WHO/UNICEF: New York, NY, USA; Geneva, Switzerland, 2007; pp. 1–66. [Google Scholar]
- Grafton, R.Q.; Chu, L.; Kompas, T. Optimal water tariffs and supply augmentation for cost-of-service regulated water utilities. Util. Policy 2015, 34, 54–62. [Google Scholar] [CrossRef]
- Sahin, O.; Bertone, E.; Beal, C.D.A. Systems approach for assessing water conservation potential through demand-based water tariffs. J. Clean. Prod. 2017, 148, 773–784. [Google Scholar] [CrossRef]
- Lucena, D.P.M.M. Simulations of the Implantation of management actions in Epitácio People and their impacts in the water crisis in Campina Grande-Pb and Region; M.S.c Postgraduate Program in Civil and Environmental Engineering, Center for Technology and Natural Resources, Federal University Campina Grande: Campina Grande, Brazil, 2018. [Google Scholar]
- Grafton, R.Q.; Ward, M.B. Prices versus rationing: Marshallian surplus and mandatory water restrictions. Econ. Rec. 2008, 84, 57–65. [Google Scholar] [CrossRef]
- Bakker, K. Neoliberalizing nature? Market environmentalism in water supply in England and Wales. Ann. Assoc. Am. Geogr. 2005, 95, 542–565. [Google Scholar] [CrossRef]
- Vairavamoorthy, K.; Gorantiwar, S.; Pathirana, A. Managing urban water supplies in developing countries e climate change and water scarcity scenarios. Phys. Chem. Earth Parts A/B/C 2008, 33, 330–339. [Google Scholar] [CrossRef]
- Baños, C.J.; Hernández, M.; Rico, A.M.; Olcina, J.O. The Hydrosocial Cycle in Coastal Tourist Destinations in Alicante, Spain: Increasing Resilience to Drought. Sustainability 2019, 11, 4494. [Google Scholar] [CrossRef]
- Proust, K.; Newell, B. Catchment and Community: Towards a Management-Focused Dynamical Study of the ACT Water. 2006. Available online: http://www.water.anu.edu.au/pdf/publications/Catchment%20and%20Community.pdf. (accessed on 23 September 2019).
- Agência Nacional das Águas (ANA). Reservoir Monitoring System. Available online: http://sar.ana.gov.br/ (accessed on 14 December 2018).
- Instituto Brasileiro de Geografia e Estatística (IBGE). Population Estimates. Available online: https://www.ibge.gov.br/estatisticas/sociais/populacao.html (accessed on 22 January 2019).
- Vieira, Z.M.C.L. Methodology of Conflict Analysis in the Implementation of Water Demand Management Measures. Ph.D. Thesis, Postgraduate Program in Natural Resources, Federal University Campina Grande, Campina Grande, Brazil, 2008. [Google Scholar]
- Nunes, T.H.C.; Galvão, C.O.; Rego, J.C. Rule curve for seasonal increasing of water concessions in reservoirs with low regularized discharges. Braz. Water Res. J. 2016, 21, 493–501. [Google Scholar] [CrossRef]
- Sistema Nacional de Informações sobre Saneamento (SNIS). Electronic Portal. Brasília. Available online: http://www.snis.gov.br (accessed on 9 January 2019).
- Rêgo, J.C.; Galvão, C.O.; Ribeiro, M.M.R.; Albuquerque, J.P.T.; Nunes, T.H.C. The crisis of the large campina supply: Actions of the managers, users, public power, press and population. In Proceedings of the XXI Brazilian Symposium on Water Resources, Water Security and Sustainable Development: Challenges of Knowledge and Management, Brasília, Brazil, 22–27 November 2015. [Google Scholar]
- Rêgo, J.C.; Galvão, C.O.; Ribeiro, M.M.R.; Albuquerque, J.P.T.; Nunes, T.H.C. New considerations on the management of the water resources of the Epitácio Pessoa dam—The drought 2012–2014. In Proceedings of the XII Brazilian Symposium on Water Resources, Water and Development, Natal, Brazil, 4–7 November 2014. [Google Scholar]
- Katz, D. Water use and economic growth: Reconsidering the Environmental Kuznets Curve relationship. J. Clean. Prod. 2015, 88, 205–213. [Google Scholar] [CrossRef]
- Oliveira, G.C.S.; Curi, R.C. Analysis on Water Collection in the Municipality of Campina Grande—PB. In Proceedings of the Anais III International Workshop on Water in the Brazilian Semi-Arid, Campina Grande, Brazil, 4–6 October 2017. [Google Scholar]
- Marzano, R.; Rougé, C.; Garrone, P.; Grilli, L.; Harou, J.J.; Pulido-Velazquez, M. Determinants of the price response to residential water tariffs: Meta-analysis and beyond. Environ. Model. Softw. 2018, 101, 236–248. [Google Scholar] [CrossRef]
- Rico, A.; Olcina, J.; Baños, C.; Garcia, X.; Sauri, D. Declining water consumption in the hotel industry of mass tourism resorts: Contrasting evidence for Benidorm, Spain. Curr. Issues Tour. 2019, 1–14. [Google Scholar] [CrossRef]
- Dinar, A.; Pochat, V.; Albiac-Murillo, J. Introduction. In Water Pricing Experiences and Innovations; Dinar, A., Pochat, V., Albiac-Murillo, J., Eds.; Springer: Cham, Switzerland, 2015; pp. 1–12. [Google Scholar]
- Lopez-Nicolas, A.; Pulido-Velazquez, M.; Rouge, C.; Harou, J.J.; Escriva-Bou, A. Design and assessment of an efficient and equitable dynamic urban water tariff. Application to the city of Valencia, Spain. Environ. Model. Softw. 2018, 101, 137–145. [Google Scholar] [CrossRef]
- Pulido-Velazquez, M.; Alvarez-Mendiola, E.; Andreu, J. Design of efficient water pricing policies integrating basinwide resource opportunity costs. J. Water Resour. Plan. Manag. 2013, 139, 583–592. [Google Scholar] [CrossRef]
- Sahin, O.; Stewart, R.A.; Porter, G. Water security through scarcity pricing and reverse osmosis: A system dynamics approach. J. Clean. Prod. 2014, 88, 160–171. [Google Scholar] [CrossRef]
- Agência Nacional das Águas (ANA). Information Note nº 11/2017/COMAR/SER. 2017. Available online: https://www.ana.gov.br/regulacao/resolucoes-e-normativos/regras-especiais-de-uso-da-agua/marcos-regulatorios/nt_11_2017_comar_sre.pdf (accessed on 16 February 2019).
- Sterman, J.D. Business Dynamics: Systems Thinking and Modeling for a Complex World; Irwin/McGraw-Hill: Boston, MA, USA, 2000. [Google Scholar]
- Meadows, D.H.; Meadows, D.L.; Randers, J.; Behrens, W.W., III. The Limits to Growth: A Report for the Club of Rome’s Project on the Predicament of Mankind; Universe Books: New York, NY, USA, 1972. [Google Scholar]
- Barisa, A.; Rosa, M. A system dynamics model for CO2 emission mitigation policy design in road transport sector. Energy Procedia 2018, 147, 419–427. [Google Scholar] [CrossRef]
- Fontoura, W.B.; Chaves, G.D.L.D.; Ribeiro, G.M. The Brazilian urban mobility policy: The impact in São Paulo transport system using system dynamics. Transp. Policy 2019, 73, 51–61. [Google Scholar] [CrossRef]
- Newell, B.; Siri, J. A role for low-order system dynamics models in urban health policy making. Environ. Int. 2016, 95, 93–97. [Google Scholar] [CrossRef]
- Hill, A.; Camacho, O.M. A system dynamics modelling approach to assess the impact of launching a new nicotine product on population health outcomes. Regul. Toxicol. Pharmacol. 2017, 86, 265–278. [Google Scholar] [CrossRef]
- Recio, A.; Linares, C.; Díaz, J. System dynamics for predicting the impact of traffic noise on cardiovascular mortality in Madrid. Environ. Res. 2018, 167, 499–505. [Google Scholar] [CrossRef]
- Rusiawan, W.; Tjiptoherijanto, P.; Suganda, E.; Darmajanti, L. System dynamics modeling for urban economic growth and CO2 emission: A case study of Jakarta, Indonesia. Procedia Environ. Sci. 2015, 28, 330–340. [Google Scholar] [CrossRef]
- Azis, R.; Blumberga, A.; Bazbauers, G. The role of forest biotechonomy industry in the macroeconomic development model of the national economy of Latvia: A system dynamics approach. Energy Proc. 2017, 128, 32–37. [Google Scholar] [CrossRef]
- Fang, W.; An, H.; Li, H.; Gao, X.; Sun, X.; Zhong, W. Accessing on the sustainability of urban ecological-economic systems by means of a coupled emergy and system dynamics model: A case study of Beijing. Energy Policy 2017, 100, 326–337. [Google Scholar] [CrossRef]
- Allington, G.R.H.; Li, W.; Brown, D.G. Urbanization and environmental policy effects on the future availability of grazing resources on the Mongolian Plateau: Modeling socio-environmental system dynamics. Environ. Sci. Policy 2017, 68, 35–46. [Google Scholar] [CrossRef]
- Wu, D.; Ning, S. Dynamic assessment of urban economy-environment-energy system using system dynamics model: A case study in Beijing. Environ. Res. 2018, 164, 70–84. [Google Scholar] [CrossRef]
- Susnik, J.; Vamvakeridou-Lyroudia, L.S.; Savic, D.A.; Kapelan, Z. Integrated system dynamics modelling for water scarcity assessment: Case study of the Kairouan region. Sci. Total Environ. 2012, 440, 290–306. [Google Scholar] [CrossRef]
- Dai, S.S.; Li, L.H.; Xu, H.G.; Pan, X.L.; Li, X.M. A system dynamics approach for water resources policy analysis in arid land: A model for Manas River Basin. J. Arid Land 2013, 5, 118–131. [Google Scholar] [CrossRef]
- Dawadi, S.; Ahmad, S. Evaluating the impact of demand-side management on water resources under changing climatic conditions and increasing population. J. Environ. Manag. 2013, 114, 261–275. [Google Scholar] [CrossRef]
- Sahin, O.; Siems, R.S.; Stewart, R.A.; Porter, M.G. Paradigm shift to enhanced water supply planning through augmented grids, scarcity pricing and adaptive factory water: A system dynamics approach. Environ. Model. Softw. 2014, 75, 348–361. [Google Scholar] [CrossRef]
- Huanhuan, Q.; Baoxiang, Z.; Fanhai, M. System dynamics modeling for sustainable water management of a coastal area in Shandong Province, China. J. Earth Sci. Eng. 2016, 4, 226–234. [Google Scholar] [CrossRef]
- Weil, T.; Lou, I.; Yang, Z.; Li, Y.A. system dynamics urban water management model for Macau, China. J. Environ. Sci. 2016, 50, 117–126. [Google Scholar] [CrossRef]
- Ahmadi, M.H.; Zarghami, M. Should water supply for megacities depend on outside resources? A Monte-Carlo system dynamics simulation for Shiraz, Iran. Sustain. Cities Soc. 2019, 44, 163–170. [Google Scholar] [CrossRef]
- Zarghami, M.; Akbariyeh, S. System dynamics modeling for complex urban water systems: Application to the city of Tabriz, Iran. Resourc. Conserv. Recycl. 2012, 60, 99–106. [Google Scholar] [CrossRef]
- Ventana Systems. Vensim DSS, 7.2th ed.; Ventana Systems, Inc.: Harvard, MA, USA, 2018. [Google Scholar]
- Medeiros, P.C.; Ribeiro, M.M.R. Price Elasticity of Demand for Water in the Paraíba River Basin. In Proceedings of the VIII Symposium Water Resources, Northeast, Gravatá-PE, Brazil, 17–20 October 2006. [Google Scholar]
- Bank of Northeast Brazil (BNB). Northeastern Water Demand Study and Update of Cost-Efficiency Indices of Sanitary Sewage Projects in Northeastern Brazil; Executed by the Company PBLM—Consulting Ltda: Fortaleza, Brazil, 1997. [Google Scholar]
- Gomes, E.F. Flow Losses and Their Effects on the Operation of the Sanitary Sewage System of Campina Grande-PB; M.S.c Postgraduate Program in Civil and Environmental Engineering, Center for Technology and Natural Resources, Federal University Campina Grande: Campina Grande, Brazil, 2013. [Google Scholar]
- Ministério da Integração Nacional (MIN). São Francisco River Integration Project with Watersheds Northeast. Environmental Impact Report—RIMA. Available online: http://www.integracao.gov.br/saofrancisco/integracao/rima.asp.Acessoem18/09/2018 (accessed on 28 September 2019).
- De Jong, P.; Tanajura, C.A.S.; Sánchez, A.S.; Dargaville, R.; Kiperstok, A.; Torres, E.A. Hydroelectric production from Brazil’s São Francisco River could cease due to climate change and inter-annual variability. Sci. Total Environ. 2018, 634, 1540–1553. [Google Scholar] [CrossRef] [PubMed]


| Aspects | Values |
|---|---|
| Drainage area (km2) | 6727.69 |
| Precipitation (mm/year) | 600 |
| Period of precipitation concentration (month) | 4 (February–May) |
| Minimum Temperature (°C) | 18–22 |
| Maximum Temperature (°C) | 28–31 |
| Evaporation (mm/year) | 2000–2500 |
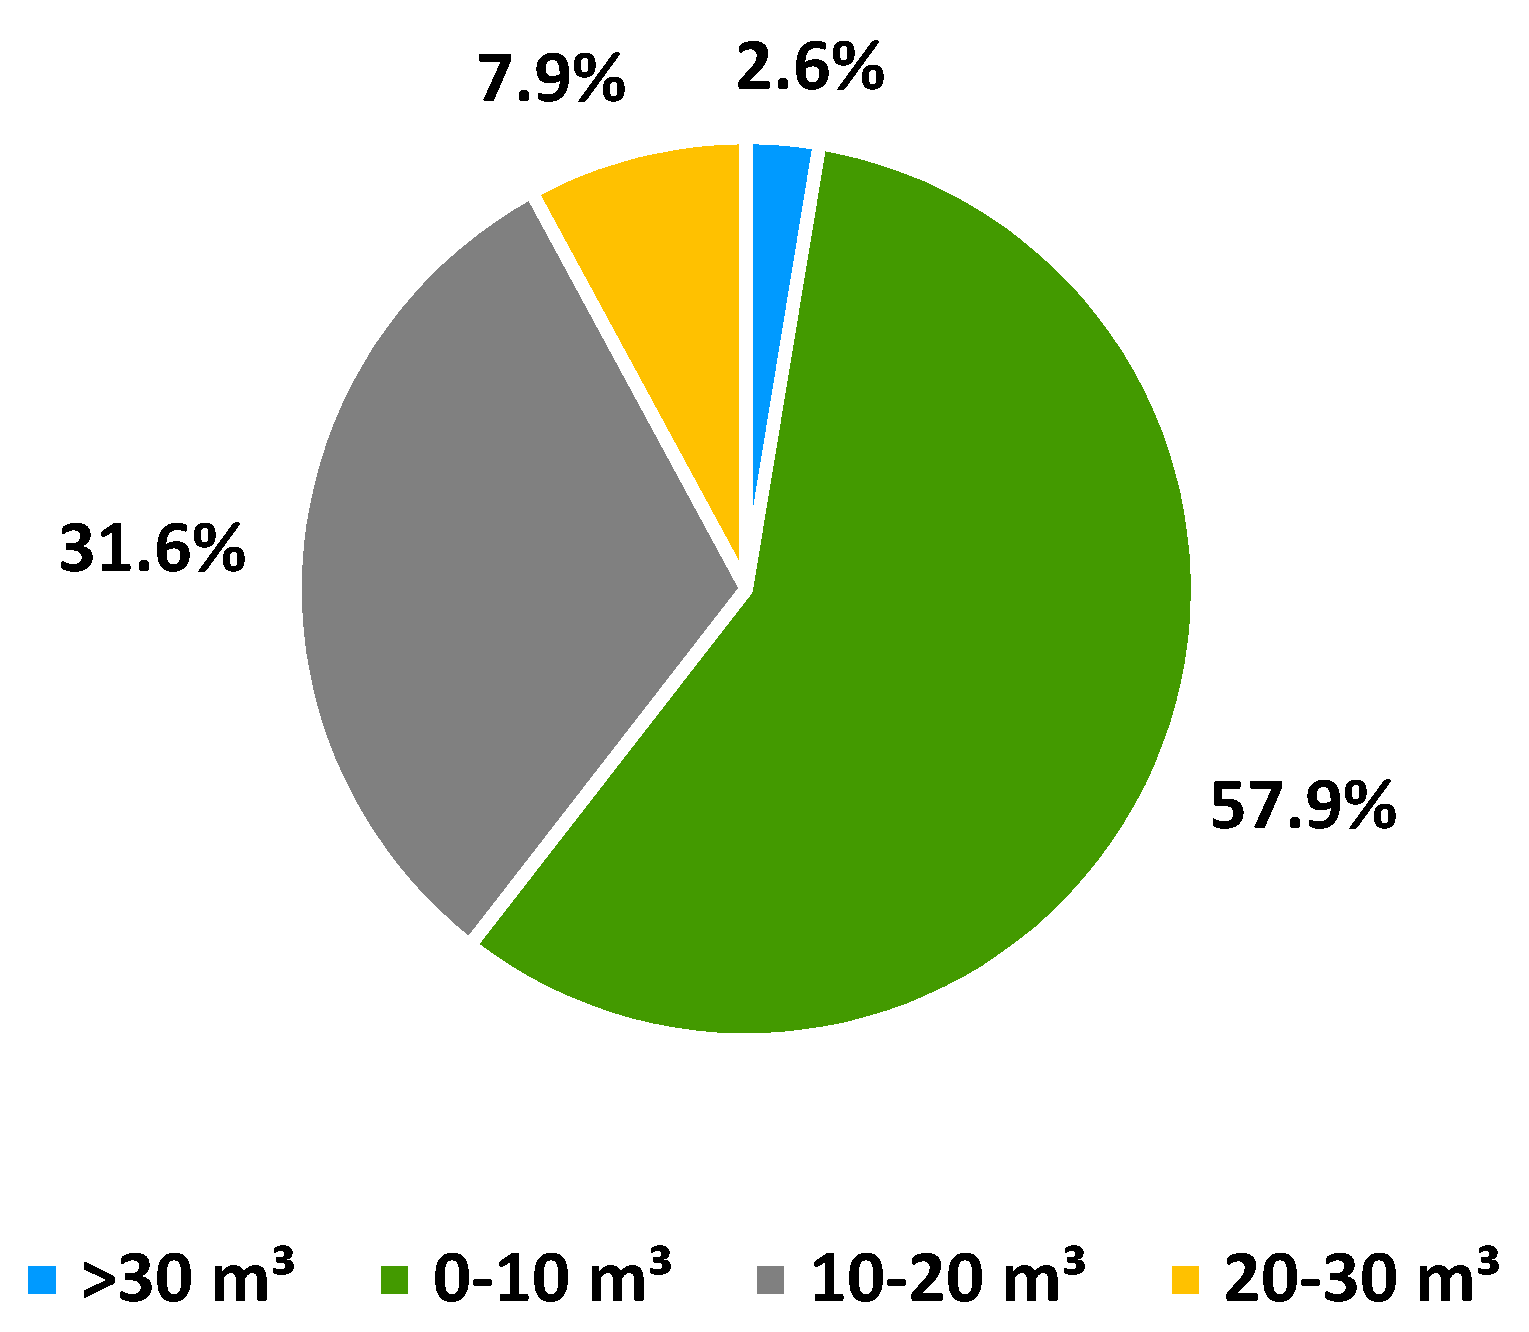
| Monthly Consumption Blocks | Tariff (US$) |
|---|---|
| Minimum Tariff—Consumption ≤ 10 m3 | 11.16 |
| Between 11 and 20 m3 | 1.44 |
| Between 21 and 30 m3 | 1.90 |
| Greater than 30 m3 | 2.57 |
| Scenarios | Scenario Description | |||||
|---|---|---|---|---|---|---|
| Population Growth (%) | Water Use (Liters Per Person Per Day, L/P/D) | Loss Control (LC) (No/Yes) | Scarcity Based (SB) Tariff (No/Yes) | Wastewater Reuse (No/Yes) | São Francisco River Integration Project (PISF) (No/Yes) | |
| Status Quo | 1.0% | Varying | No | No | No | No |
| SC1 | 1.0% | 222 | No | No | No | No |
| SC2 | 1.0% | 222 | No | Yes | No | No |
| SC3 | 1.0% | 222 | Yes | No | No | No |
| SC4 | 1.0% | 222 | No | No | Yes | No |
| SC5 | 1.0% | 222 | No | No | No | Yes |
| SC6 | 1.0% | 222 | No | Yes | Yes | No |
| Parameters | Initial Value | Sensitive Test Interval |
|---|---|---|
| Loss control coefficient | 0.15 | [0.1, 0.3] |
| Scarcity-based tariff | 1 | (0, 3) |
| Wastewater reuse rate | 0.6 | [0.1, 1] |
| Population growth rate | 0.01 | [0.001, 0.04] |
| Domestic demand per capita | 48 | (40, 55) |
| Inter-basin water transfer rate | 2 | (1, 4) |
© 2019 by the authors. Licensee MDPI, Basel, Switzerland. This article is an open access article distributed under the terms and conditions of the Creative Commons Attribution (CC BY) license (http://creativecommons.org/licenses/by/4.0/).
Share and Cite
Correia de Araujo, W.; Oliveira Esquerre, K.P.; Sahin, O. Building a System Dynamics Model to Support Water Management: A Case Study of the Semiarid Region in the Brazilian Northeast. Water 2019, 11, 2513. https://doi.org/10.3390/w11122513
Correia de Araujo W, Oliveira Esquerre KP, Sahin O. Building a System Dynamics Model to Support Water Management: A Case Study of the Semiarid Region in the Brazilian Northeast. Water. 2019; 11(12):2513. https://doi.org/10.3390/w11122513
Chicago/Turabian StyleCorreia de Araujo, Wanderbeg, Karla Patricia Oliveira Esquerre, and Oz Sahin. 2019. "Building a System Dynamics Model to Support Water Management: A Case Study of the Semiarid Region in the Brazilian Northeast" Water 11, no. 12: 2513. https://doi.org/10.3390/w11122513