Salt Tolerance and Desalination Abilities of Nine Common Green Microalgae Isolates
by
Aida Figler
1,2, 
Viktória B-Béres
3,4,
Dalma Dobronoki
1,2,
Kamilla Márton
1,
Sándor Alex Nagy
1 and
István Bácsi
1,* 1
Department of Hydrobiology, University of Debrecen, Egyetem sqr. 1, H-4032 Debrecen, Hungary
2
Pál Juhász-Nagy Doctoral School of Biology and Environmental Sciences, University of Debrecen, Egyetem sqr. 1., H-4032 Debrecen, Hungary
3
MTA Centre for Ecological Research, Danube Research Institute, Department of Tisza Research, Bem sqr. 1, H-4026 Debrecen, Hungary
4
MTA Centre for Ecological Research, GINOP Sustainable Ecosystems Group, Klebelsberg Kuno str. 3, H-8237 Tihany, Hungary
*
Author to whom correspondence should be addressed.
Water 2019, 11(12), 2527; https://doi.org/10.3390/w11122527
Submission received: 29 October 2019
/
Revised: 26 November 2019
/
Accepted: 26 November 2019
/
Published: 29 November 2019
(This article belongs to the Section Wastewater Treatment and Reuse)
Abstract
:In recent years, decline of freshwater resources has been recognized as one of the main environmental problems on global level. In addition to the increasing extent of primary salinization due to climate change, secondary salinization caused by human interventions is also a significantly increasing problem, therefore, the development of various chemical-free, biological desalination and removal procedures will become increasingly important. In the present study, the salinity tolerance, salinity, and nutrient reducing ability of nine common freshwater microalgae species from the genera Chlorella, Chlorococcum, Desmodesmus, Scenedesmus, and Monoraphidium were investigated. Our results proved that the studied green microalgae species are halotolerant ones, which are able to proliferate in environments with high salt concentrations. Furthermore, most of the species were able to reduce conductivity and remove significant amounts of chloride (up to 39%) and nutrients (more than 90% nitrate). The results proved that nitrate removal of the studied species was not influenced by salt concentration, only indirectly via growth inhibition. However, the results also highlighted that N:P ratio of the medium has primarily importance in satisfactory phosphorous removal. It can be concluded that assemblages of the studied microalgae species could be able to adapt to changing conditions even of salt-rich wastewaters and improve water quality during bioremediation processes.
1. Introduction
Salinization of both the terrestrial and aquatic environment is a significantly increasing global problem in the last few decades. In addition to the increasing extent of primary salinization due to climate change, secondary salinization more and more comes to the fore because of the increasing amount of saline wastewaters. The composition and concentration of saline wastewaters are highly variable and depend on the sources [1]. Primary salinization afflict over 20% of the world’s agricultural area [2,3], excessive irrigation or rainfalls could turn saline farmlands to sources of saline wastewaters. Agricultural activities contribute anyway to the increasing amount of saline wastewaters (inappropriate irrigation practices, insufficient drainage, fertilization). Agricultural wastewaters could contain nutrients (nitrogen and phosphorous forms) and non-, or hardly degradable organic chemicals (pesticides and herbicides) beside various salts [4,5,6,7,8]. Aquacultures, especially coastal maricultures also produce large volumes of wastewater containing salts and various contaminants (e.g., antibiotics; [9,10]). Industrial activities connected to agriculture (e.g., food processing industries) are also sources of saline wastewaters (containing high levels of organic contaminants), such as many other industrial sectors (loaded with a wide variety of complex contaminants, including heavy metals). Even wastewater and seawater treatment plants could contribute to saline wastewater production [1].
The treatment of wastewaters with high salt content presents a complicated task for wastewater treatment professionals. Due to the large salt content, saline wastewaters can be introduced neither into surface waters nor into general wastewater treatment systems without pre-treatment [11]. High salt content can significantly change water quality and the species composition of the recipient water body, or it can cause serious damage mainly in biological, but also in physical–chemical steps of wastewater treatment. Not appropriately treated saline wastewater effluents can also cause secondary salinization or sodification by replacement of Ca2+ and Mg2+ with Na+ in the recipient water body and its vicinity [12]. Consequently, the reduction of salt content of saline wastewaters is necessary prior to introduction into surface waters or into general wastewater treatment systems. Desalination can be done by relatively cheap methods: For example, dilution (adding rainwater to the storing ponds), or precipitation (with the addition of lime or lime soda; [12]). Physical and chemical treatment of saline wastewaters is also possible (distillation, vacuum evaporation, ion exchange, electrodialysis, reverse osmosis) but these procedures are generally extremely expensive [11,13]. Most recently biological methods have come to the fore: Macro- (aquatic plants; [14]) and microorganisms (bacteria or algae; [15,16,17]) are used during these processes.
Numerous studies have shown that microalgae can be used to treat wastewater of various origins [18]. Taking into account the bioremediation capabilities of microalgae, it is possible to develop and implement new microalgae-based wastewater bioremediation technologies, since microalgae are known to be able to remove a wide range of pollutants from domestic, industrial, and agricultural wastewaters [19], some microalgae species even can tolerate or reduce the salt content of water [20].
Changes in salt content affect algae in three ways: (i) Osmotic stress that directly affects the water potential of the cell; (ii) ionic (salt) stress caused by unavoidable uptake or release of ions, which is also part of acclimatization; (iii) changes in cellular ion ratios due to selective ion permeability of the membrane [21]. Many algae are able to adapt to changes in salinity by biochemical strategies such as the production and accumulation of osmolytes or operating efficient Na+/K+ pump system [21,22,23,24,25]. The operation of the Na+/K+ pump contributes to the development of osmotic potential and thus has an impact on turgor pressure and cell volume [26]. In algae exposed to high salt content, ion concentration increases in all cell constituents, but ionic proportions may be altered by selective uptake of organelles [21,27]. It was already shown previously that the concentration of Na+ and Cl− were higher in vacuoles than in cytoplasm in the hyperosmotic environment (e.g., in the flagellated green microalga Dunaliella parva [28]). In addition, it was also observed that new vacuoles are formed in the cells of both unicellular and multicellular algae after osmotic stress [21]. Recently it has won another proof that vacuole formation during hypersaline treatment occurred for storing ions (especially Na+ and Cl− [29]). The first phase of response to moderate changes in salinity can be characterized by a rapid change in turgor (walled cells) or volume (wall-less cells) caused by high water inlet or outflow along the osmotic gradient. In the second phase, osmotic control occurs: Concentrations of osmotically active solutes (osmolytes) in the cell change until a new equilibrium is reached. Both phases are part of a feedback signal that provides osmotic adaptation [30,31,32].
As it was mentioned above, composition of saline wastewaters could be very variable. Coexistence of salts, heavy metals, or nonmetallic compounds usually leads to complicated interactions with each other and with living organisms, affecting their salt tolerance. Studies report mainly decreasing salinity tolerance in more complex media in the case of plants [33,34,35,36,37]. The effects are much more varied for algae: Interestingly, more complex media caused weaker growth inhibition than the simpler one with the same salinity in the case of an isolate of the green microalga Scenedesmus [38]. On the other hand, it was also shown for green microalgae, that salinity tolerance could be either enhanced or weakened depending on the composition of culturing media [17].
The ion (nutrient) uptake of microalgae may vary among different species [39,40], which should be taken into account when their application is planned for remediation of saline wastewaters. During the selection of the appropriate microalgae isolates, it should be considered that representatives of the local microalgal flora are more likely to be successful in bioremediation processes than “alien” species (subtropical, tropical isolates). However, in temperate areas, most of the surface waters fall into the category of “freshwater”, i.e., the applicability of species isolated from such habitats for desalinazation of saline wastewaters with very variable salt contents is often questionable. Despite the extensive research since the 1970s, there are—at least according to our knowledge—still limited information in the literature about salt tolerance of common freshwater microalgae species (one recent summary is available in [38]). Thus, the analysis of the salt tolerance of individual isolates in the available algae strain collections is essential for the planning of the remediation of saline wastewaters by biological methods.
In this study, salt tolerance and removal ability of nine green microalgae species (Chlorella sorokiniana, C. vulgaris, Chlorococcum sp., Desmodesmus communis, D. spinosus, Scenedesmus obliquus, S. obtusus, Monoraphidium komarkove, and M. pusillum) were evaluated in artificial media with different NaCl concentrations. The chosen isolates are common green microalgal species occurring in terrestrial/freshwater (the two Chlorella spp. and the Chlorococcum sp.) and mainly freshwater environments (the other taxa), which could be among the first inhabitants of newly formed natural or artificial aquatic habitats [41]. The chosen salt concentration range (500–20,000 mg L−1 NaCl resulting culturing media with conductivity ~800–36,000 μS cm−1) covers the typical salinity range of wastewaters. Salinity is conceptually simple, but technically challenging to define and measure precisely. Electrical conductivity, or “reference conductivity”, as a proxy for salinity is widely used for characterization of natural ground and surface waters, waters used by agriculture and industry, and wastewaters [42]. Conductivity of wastewaters can change within a wide range: 1200 μS cm−1 is considered as high in the case of municipal wastewater, while conductivity of industrial wastewaters can exceed 10,000 μS cm−1 [43]. The aims of the study were to find answers to the question, how the increasing salt concentration affects the growth of the cultures, changes in conductivity, chloride and nutrient (nitrate and phosphate) uptake. Additionally, the effect of salt on biomass production of the different isolates was also evaluated.
We hypothesized the followings:
- -
- It was assumed that those species, which may often occur in terrestrial habitats (Chlorella and Chlorococcum spp.) would be characterized by higher salt tolerance than species more characteristic in freshwater habitats.
- -
- It was hypothesized that the above mentioned often terrestrial species would be able to remove more ions (especially chloride) than species more characteristic in freshwater habitats.
- -
- Intense nutrient removal ability despite high salt concentration was supposed in the case of more tolerant isolates.
2. Materials and Methods
2.1. Strains, Culturing Conditions, and Experimental Design
Isolates maintained in the Algal Culture Collections of the Department of Hydrobiology, University of Debrecen (ACCDH-UD) were applied during the experiments. The nine green algae (Chlorophyta) species were isolated from aquatic habitats in Hungary. The unicellular Chlorella sorokiniana, C. vulgaris, Chlorococcum sp., Monoraphidium komarkovae and M. pusillum, and the coenobial Desmodesmus communis, D. spinosus, Scenedesmus obliquus, and S. obtusus, isolates are maintained as standing and sterile air-bubbled cultures under 14 h light (40 μmol photons m−2 s−1)—10 h dark photoperiod at 24 °C.
The experiments were carried out in shaken cultures (SOH-D2 shaker, 90 rpm, Witeg Labortechnic GmbH, Wertheim, Germany), in Bold’s Basal medium (BBM; [44]) in 100 mL Erlenmeyer flasks with 50 mL final volume. Cultures were kept on 14 h light (40 μmol photons m−2 s−1)—10 h dark photoperiod at 24 °C. The time of exposition was 14 days. NaCl stock solution of 300 g L−1 was added to the treated cultures to reach 500, 1000, 5000, 10,000, 15,000, and 20,000 mg L−1 salt concentrations. Control cultures contained no added NaCl. During the experiments, so called “negative control” compositions (nutrient solutions + salt, without algae) were also used to measure the accurate initial conductivity and chloride content, and to correct the results obtained from the algae cultures with changes in the compositions without algae.
2.2. Measurement of the Growth of the Cultures
Growth of the cultures was followed by counting the number of cells and coenobia. For counting, samples of 1 mL were taken every two days of the experiments, the samples were preserved with formaldehyde (5% final concentration). Individual numbers were counted from 10 µL samples in Bürker chamber, using an Olympus BX50F-3 microscope (Olympus Optical Co., Ltd., Tokyo, Japan) at 400× magnification. To give the NaCl concentrations causing 50% growth inhibition (EC50 values), the extent of growth inhibition (in percentage compared to control) was plotted as functions of NaCl concentrations. Trend lines were fitted to the obtained curves (second order relationship), and from the equations of the trend lines (quadratic equations) the concentrations causing 50% inhibition were calculated.
At the end of the experiments (on the 14th day) the cultures were centrifuged (6000× g, 10 min, Beckman Avanti J-25, Beckman Industries Inc., Fullerton, California, USA), the supernatants were used for the measurements of conductivity, chloride, nitrate, and phosphate content. The pellets (biomass) were freeze-dried (Christ Alpha 1–2 LD plus freeze-dryer equipment, Martin Christ Gefriertrocknungsanlagen GmbH, Osterode am Harz, Germany ) and scaled (Ohaus AdventurerTM Pro analytical scale, Ohaus Corporation, Parsippany, New Jersey, USA) the dry masses were calculated to per unit volume (mg L−1).
2.3. Measurement of Conductivity, Chloride, and Nutrient (Nitrate and Phosphate) Content Changes
Conductivity, chloride, and nutrient (nitrate and phosphate) content of the cultures were measured at the beginning and at the end of the experiments. Baseline values were measured from negative control compositions.
Conductivity was measured from the supernatants using a Hach Lange HQ30d portable multi meter (Hach Lange GmbH, Düsseldorf, Germany) with IntellicalTM CDC401 conductivity measuring electrode (Hach Lange GmbH, Düsseldorf, Germany).
Quantitative measurement of chloride content of the supernatants was done by precipitation titration [45]. The measurement was conducted using 12.5 mL (control, 500, and 1000 mg L−1 NaCl) or 1 mL (5000–20,000 mg L−1 NaCl) of supernatant samples. Potassium chromate indicator was used to indicate the end point of the titration with the silver nitrate measuring solution. The amount of chloride was calculated using the formula given in the method and was expressed as mg L−1 chloride. The degree of reduction of conductivity and chloride content was calculated as a difference between day 0 and 14, and these values were corrected with the changes measured in the negative control compositions, therefore only the reduction by algae was obtained. The degree of reduction in conductivity and chloride content to the 14th day was calculated as percentage considering the initial values as 100%.
To measure the changes in nutrient content, 1 mL of cell-free samples were used collected at the beginning and at the 14th day of experiments. Spectrophotometric methods were applied: Nitrate contents were measured by the salicylic acid colorimetric method (MSZ 1484–13: 2009; [46]) using 40 μL supernatants; phosphate contents were measured by the acidic phosphorous molybdate method (MSZ EN ISO 6878: 2004; [47]) using 200 μL supernatants. The degree of reduction of nitrate and phosphate content was calculated as a difference between day 0 and day 14, and these values were corrected with the changes measured in the negative control compositions, therefore only the reduction by algae was obtained. The degree of reduction in nitrate and phosphate content to the 14th day was calculated as percentage considering the initial values as 100%.
2.4. Statistical Analysis
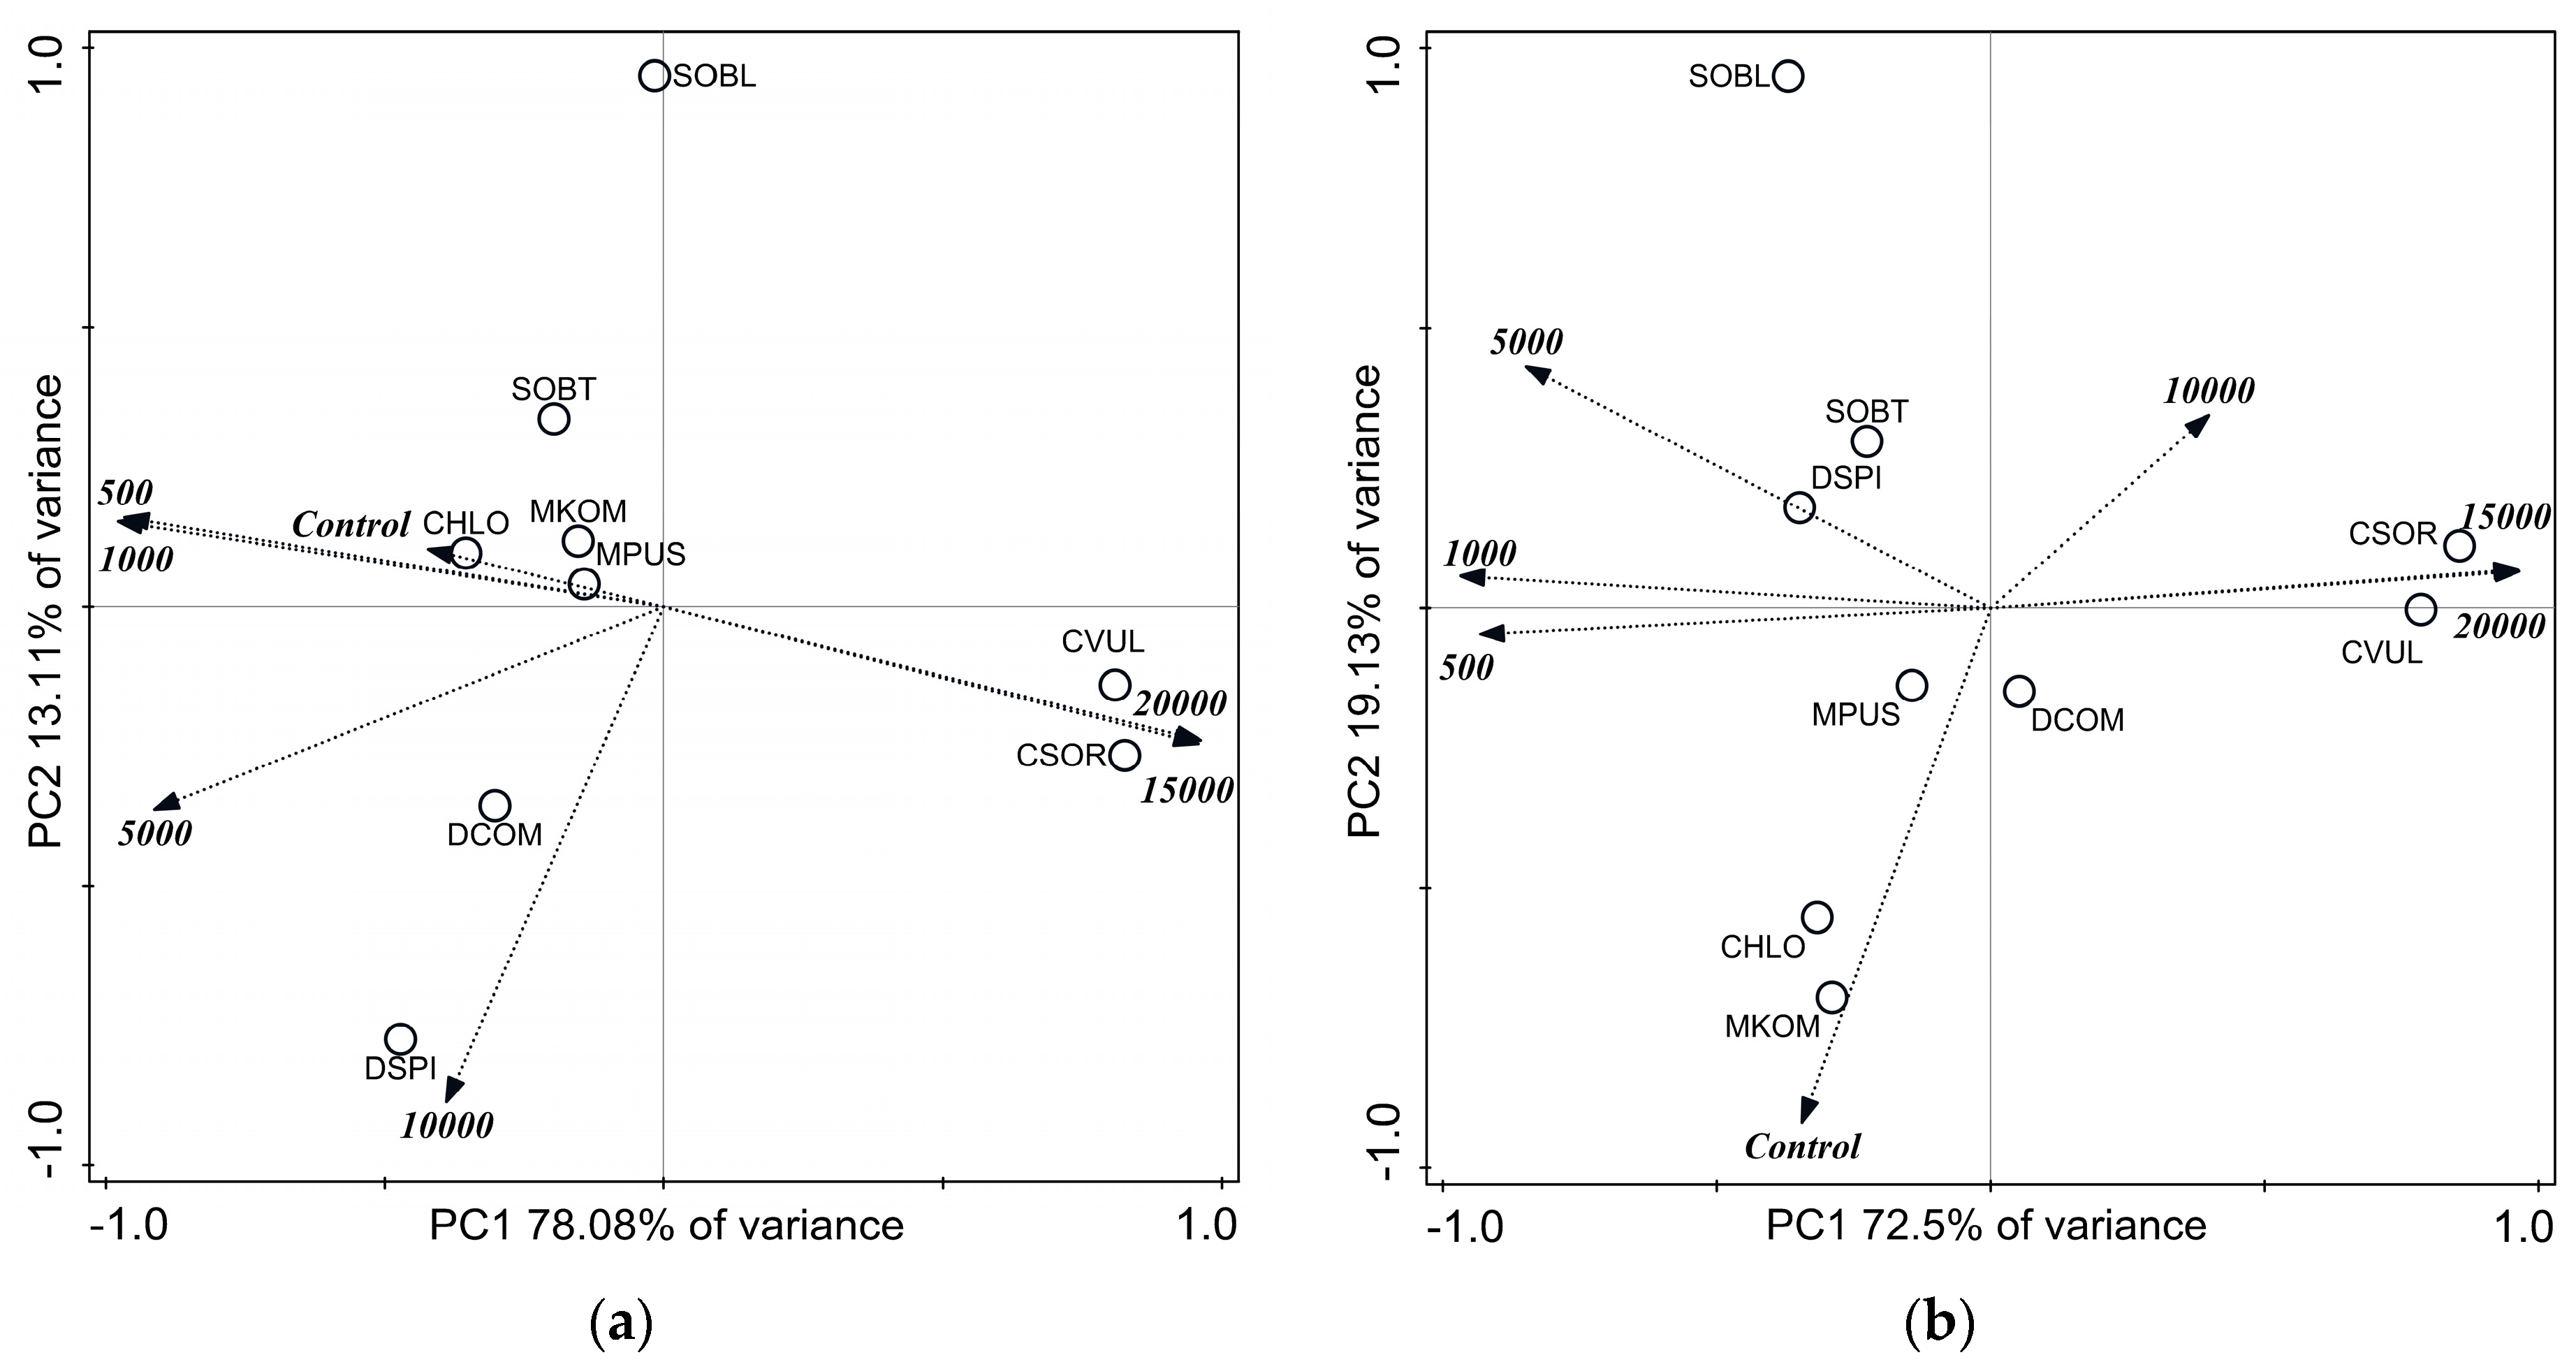
All experiments were done in triplicate, average values and standard deviations were calculated. Differences among tendencies of growth curves based on individual (cell or coenobia) number changes in control and treated cultures were evaluated by one-way analysis of covariance (ANCOVA; [48,49]). Conductivity reduction values and extents of chloride and nutrient removals (%) were compared with one-way analysis of variance (ANOVA). To determine whether conductivity, chloride content, or nutrient content significantly changed over the duration of the experiments, the results of day 0 and 14 were compared with paired t-tests. The Past program was used for the statistical analysis [49]. To present the correlations between the treatments (salt concentrations) and the different variables measured in the cultures of the different isolates, dry mass values (mg L−1), conductivity reduction values, chloride, nitrate, and phosphate removal values (%) were averaged within the three replicates, and were subjected to principal component analysis (PCA, implemented in Canoco 5.0, Microcomputer Power, Ithaca, New York, NY, USA).
3. Results
3.1. Growth and Salt Tolerance of the Cultures
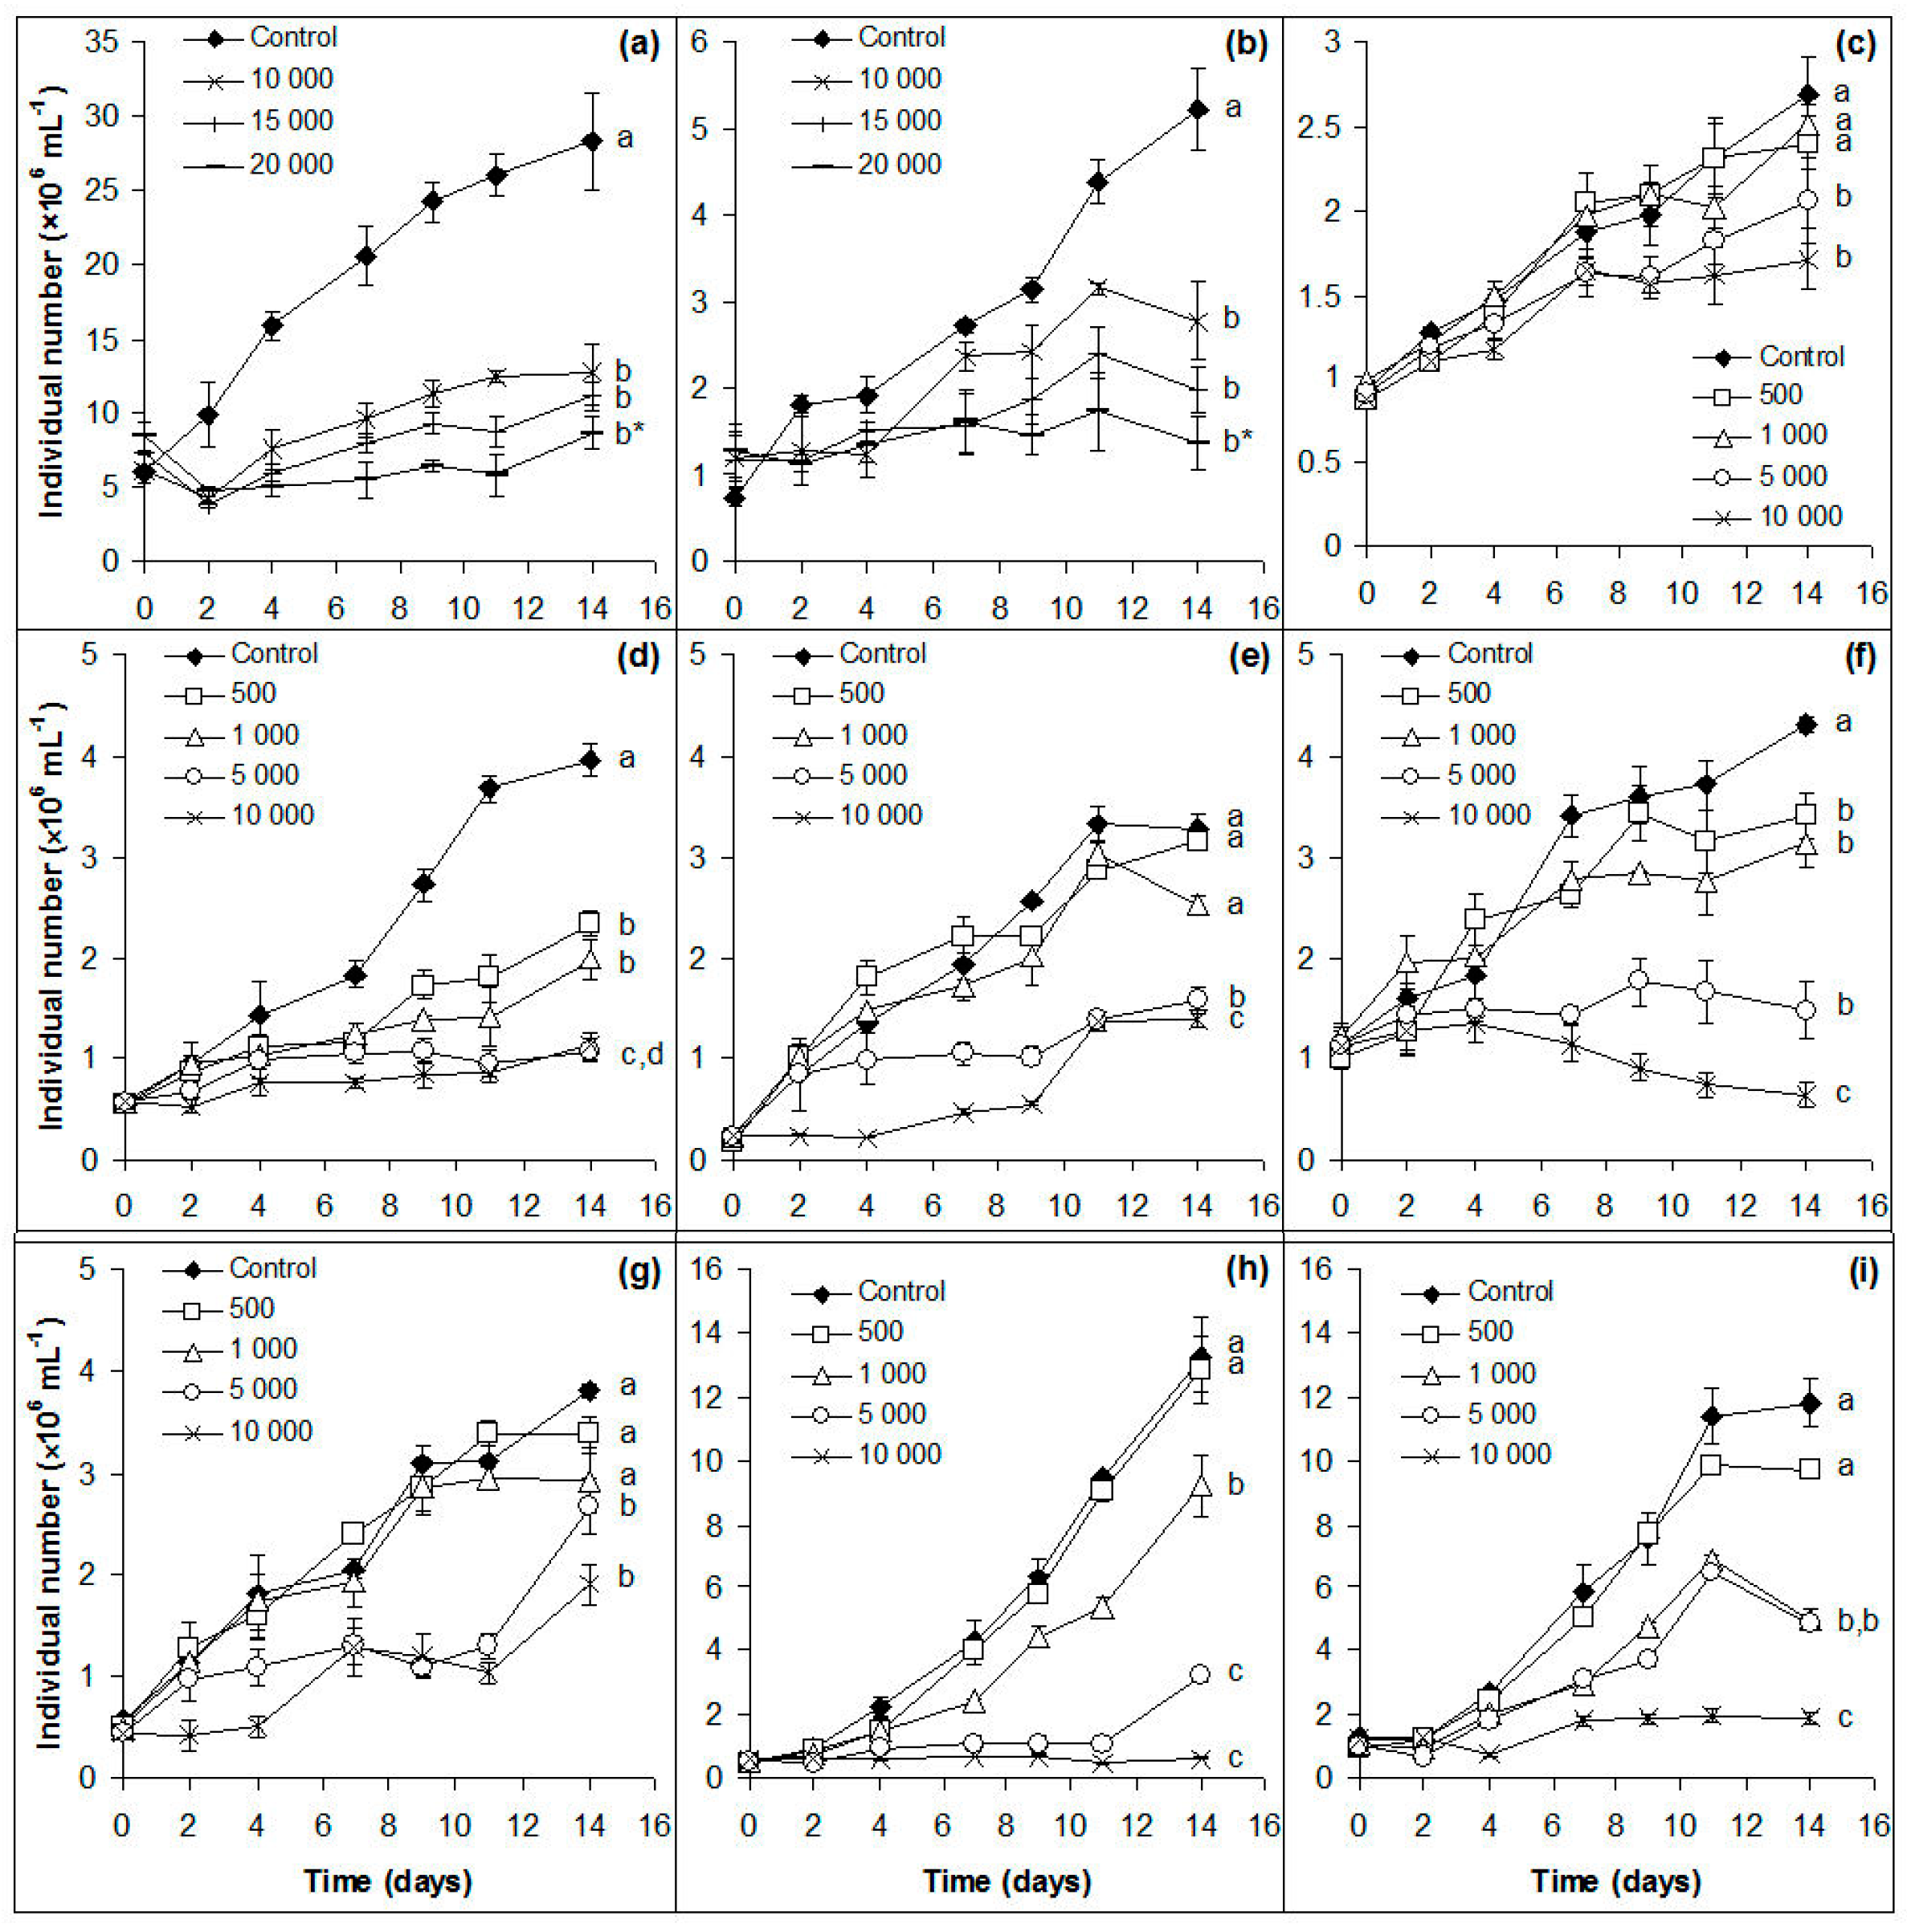
Preliminary experiments showed that Chlorella spp. are able to grow significantly even in the presence of 5000 mg L−1 NaCl, thus 10,000, 15,000, and 20,000 mg L−1 salt concentrations were chosen for further treatments. All the other isolates were treated with 500, 1000, 5000, and 10,000 mg L−1 NaCl.
Significant growth inhibitions were observed in all treated cultures of Chlorella spp. (p < 0.001–0.05; Figure 1a,b); D. communis and S. obliquus (p < 0.01; Figure 1d,f). Growths of the other five isolates were inhibited significantly only from 1000 or 5000 mg L−1 NaCl (p < 0.01–0.05; Figure 1e,g–i). It is worth emphasizing that all species were able to proliferate even in the presence of the highest amount of NaCl, with the exception of S. obliquus and M. komarkove (Figure 1).
Comparing the salt tolerance of the studied algae species, the results show that after 96 h exposure Chlorococcum sp. and D. communis showed the highest tolerance: 50% growth inhibition was not achieved within the tested concentration range (Table 1). C. vulgaris was the third most tolerant isolate: 29,233 mg NaCl was required to achieve 50% growth inhibition (Table 1). On the basis of the initial (96 h) EC50 values, the studied isolates can be ranked in the following order (from the most tolerant one to the less tolerant one): Chlorococcum sp. = D. communis > C. vulgaris > C. sorokiniana > D. spinosus > M. pusillum > S. obtusus > S. obliquus > M. komarkove. Taking into consideration long term salinity tolerance, there were gradual decreases of EC50 values, i.e., gradual decreases of salt tolerance in the case of six out of the nine isolates (C. vulgaris, Desmodesmus spp., S. obliquus, and Monoraphidium spp. (Table 1). Although EC50 values were not calculable, EC25 values showed similar decreasing trend in the case of Chlorococcum sp. (Table 1). EC values for C. sorokiniana and S obtusus changed only slightly to the 14th day, which suggest stable salt tolerance over time (Table 1).
The dry mass data of 14-day-old cultures were subjected to principal component analysis (PCA, Figure 2). A high proportion of the variance was covered in the first two principal components (Figure 2, see labels of axes). Altogether the four axes explained 99.68% of the variances. Growth inhibitions observed on the basis of individual numbers were not clearly supported by dry weights of the collected biomasses. Controversially, dry biomass of C. sorokiniana and C. vulgaris correlated positively with the highest salt concentrations (Figure 2). The distribution of the dry mass values of Chlorococcum sp., Desmodesmus and Scenedesmus spp., and M. pusillum around control and 500–5000 mg L−1 NaCl treatments (Figure 2) suggest only slight changes in dry masses with increasing salt concentration.
Indeed, dry mass of C. sorokiniana increased with increasing salt concentration (Table S1). Significantly lower dry masses occurred only from 5000 mg L−1 NaCl treatment in M. pusillum cultures, and from 10,000 mg L−1 NaCl treatments in C. vulgaris, D. spinosus, and S. obliquus cultures (Table S1). The separated position of M. komarkove (Figure 2) can be explained by the low biomass values in its control and treated cultures (see below).
Comparing the dry masses collected from the similarly treated cultures of the different species, it can be said that among control circumstances Chlorococcum sp. and D. spinosus cultures could be characterized with the highest dry biomasses (Table S1). M. komarkove had significantly lower (p < 0.05) biomass than all other isolates treated with 1000–10,000 mg L−1 NaCl. Treatments with 5000 and 10,000 mg L−1 NaCl resulted significantly lower (p < 0.05) biomass in D. communis, C. vulgaris, and S. obliquus cultures compared to the other isolates. C. sorokiniana had significantly higher biomass (p < 0.05) than C. vulgaris in 15,000 and 20,000 mg L−1 treated cultures (Table S1).
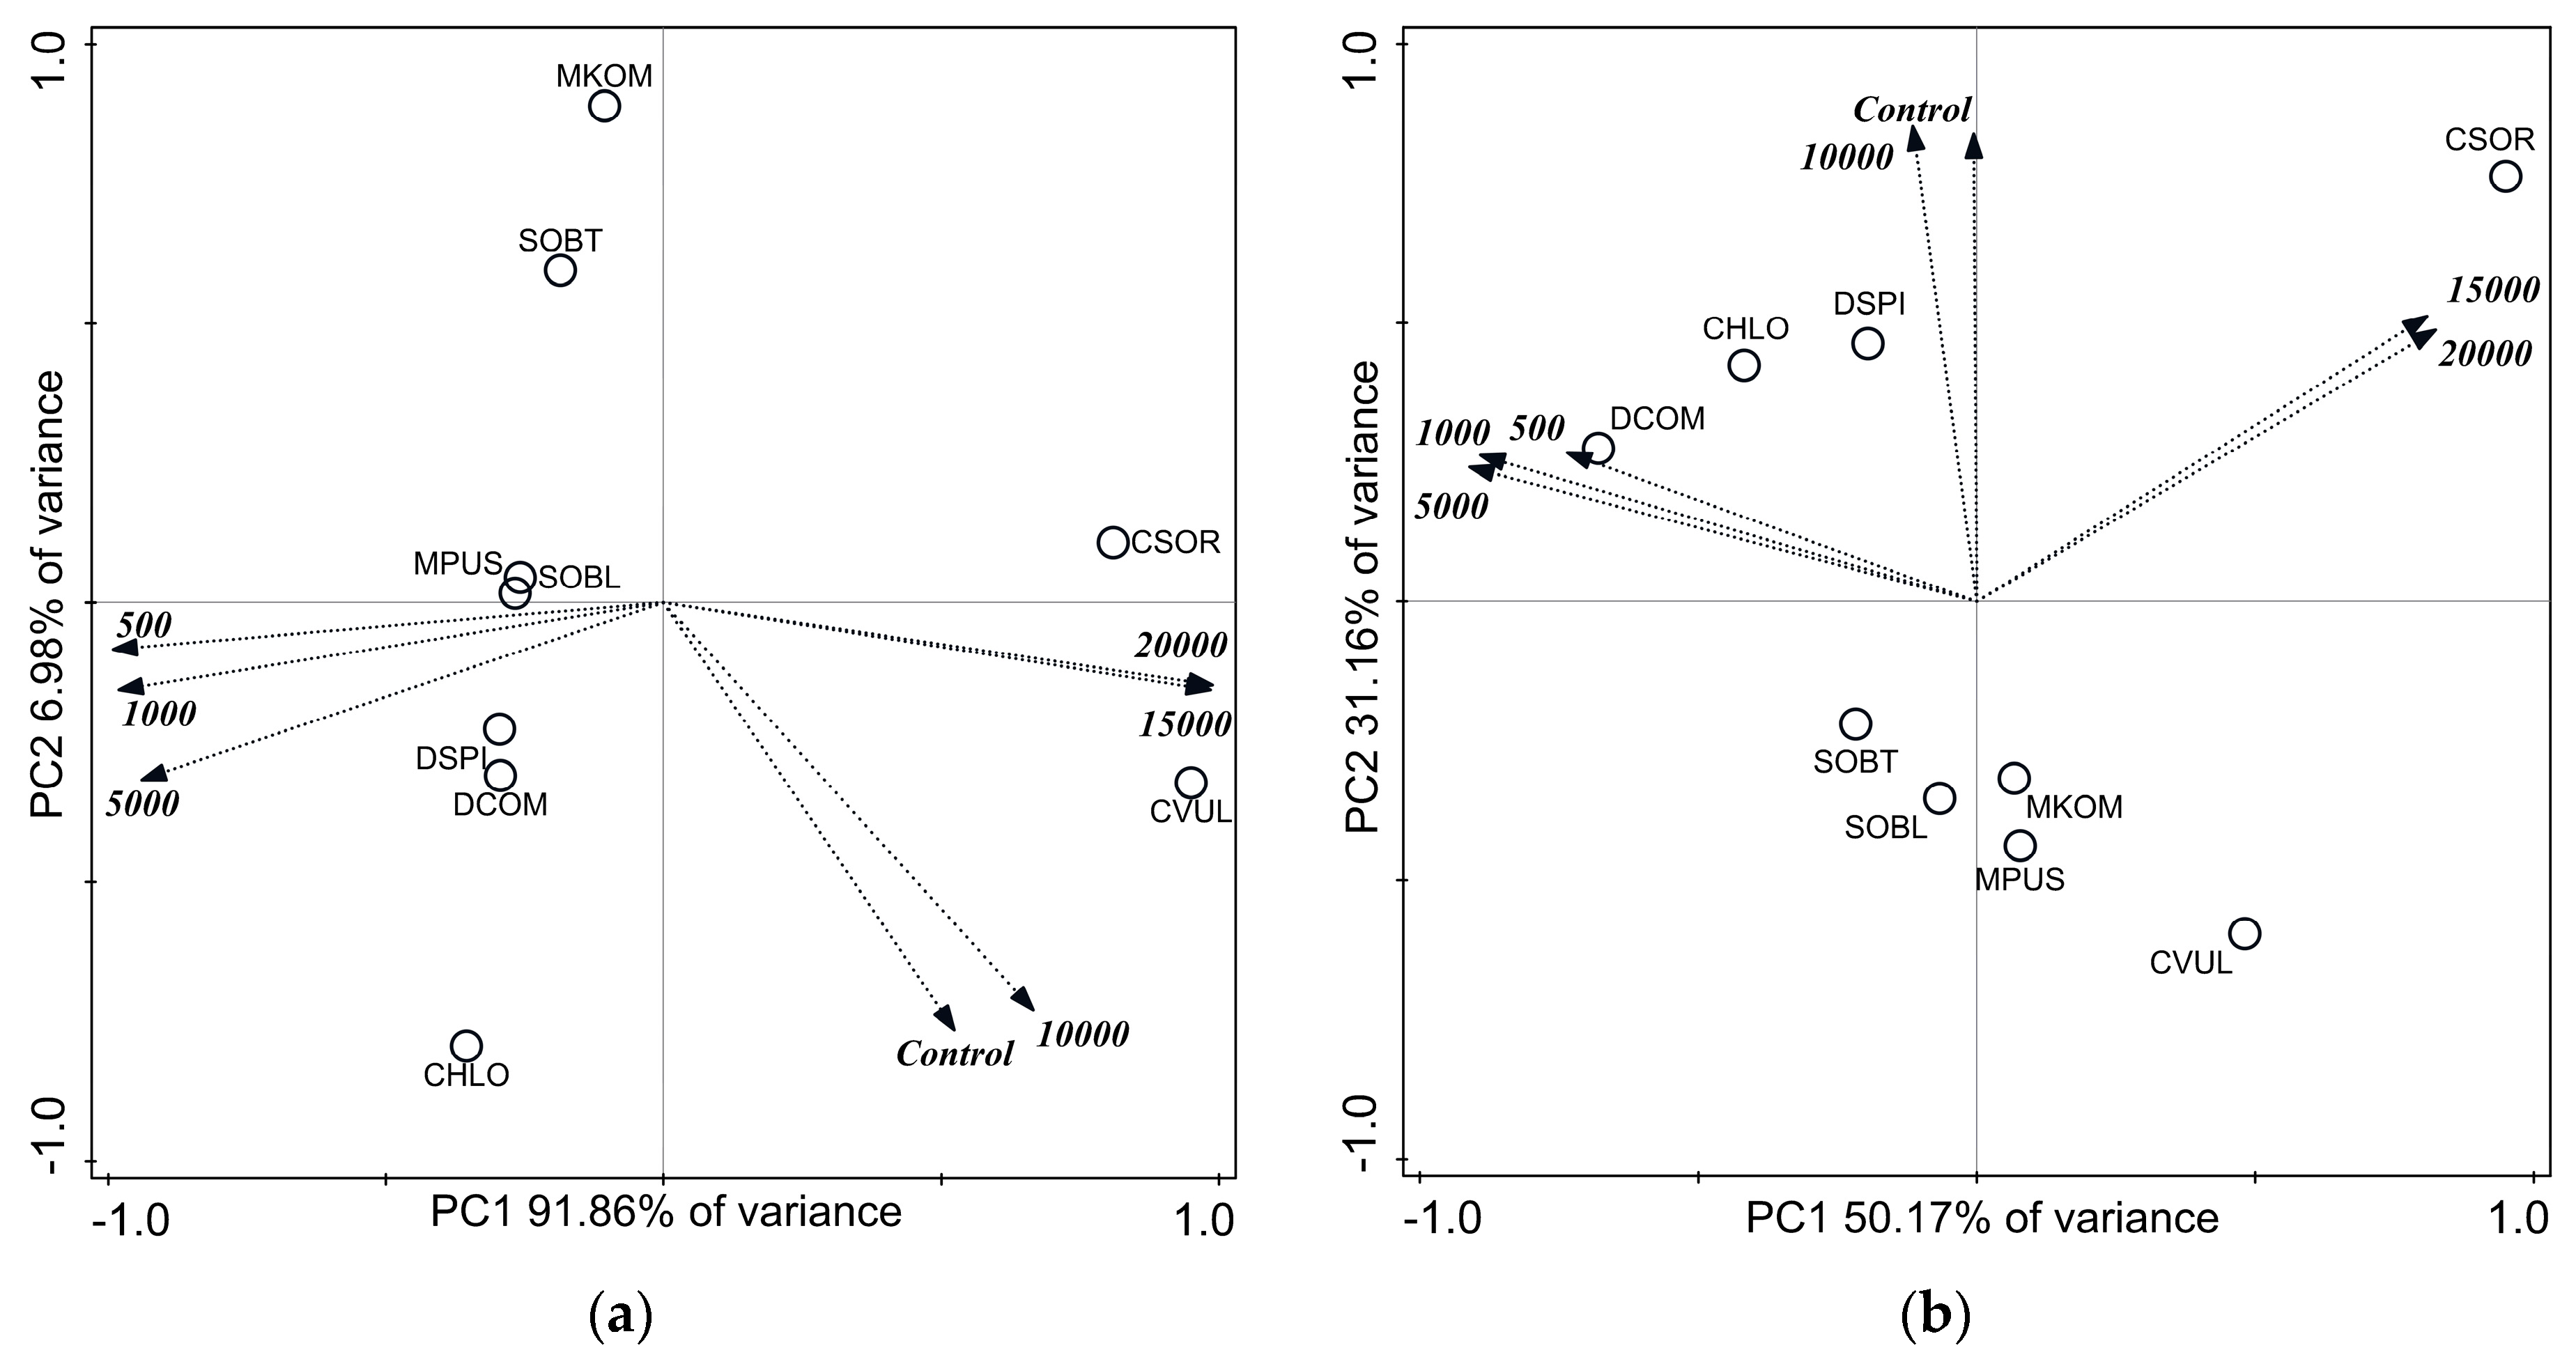
3.2. Conductivity Reduction and Chloride Removal
The conductivity reduction and chloride removal data (% within the 14 days of the exposition time) were subjected to principal component analysis (PCA, Figure 3); in both cases high proportion of the variances were covered in the first two principal components (Figure 3; see labels of axes). Altogether the four axes explained 99.18% and 99.40% of the variances in the case of conductivity reduction and chloride removal, respectively. Conductivity reduction values caused by Chlorella spp. showed positive correlation with the highest NaCl concentrations, that of Desmodesmus spp. also correlated positively with 5000 and 10,000 mg L−1 NaCl (Figure 3a). The position of Chlorococcum sp. and Monoraphidium spp. suggest that these species caused maximal conductivity reduction in control cultures, while conductivity reduction values caused by Scenedesmus spp., especially S. obliquus showed no correlation with NaCl concentration (Figure 3a).
Chloride content changes were more or less similar to conductivity changes, in most cases: Chloride removal values caused by Chlorella species showed positive correlation with the highest NaCl concentrations (Figure 3b). Weaker positive correlation of chloride removal values of M. pusillum and D. communis suggest that NaCl had no significant effect on chloride removal. Lack of any correlation was the most obvious in the case of S. obliquus (Figure 3b).
Conductivity decreased significantly (p < 0.05) from the beginning of the experiments to the 14th day both in control and in treated cultures in the case of five species (Chlorella, Chlorococcum, and Monoraphidium spp.; Table S2). Conductivity reductions in time were significant only in certain cultures of Desmodesmus and Scenedesmus spp. (Table S2). Taking all species into consideration, conductivity reduction ranged from 3% (10,000 mg L−1 treated S. obliquus culture) to 39% (5000 mg L−1 treated D. spinosus culture; Table 2).
Chloride content decreased significantly from the beginning of the experiments to the 14th day both in control and in treated cultures in the case of C. vulgaris and Chlorococcum sp., and in treated cultures of C. sorokiniana and D. spinosus (p < 0.05; Table S3). Chloride content decreased significantly in time only in certain cultures in the case of D. communis, S obliquus, S. obtusus, M. komarkove, and M. pusillum (p < 0.05; Table S3). Clear correlation between salt tolerance and chloride removal was observable only in the case of Chlorella spp., although only chloride removal of C. sorokiniana increased significantly along increasing NaCl concentration. Interestingly, S. obliquus also showed increasing chloride removal ability along NaCl concentration up to 5000 mg L−1 (Table 3).
3.3. Nutrient (Nitrate and Phosphate) Removal
The nitrate and phosphate removal data (% within the 14 days of the exposition time) were subjected to principal component analysis (PCA, Figure 4). The proportions of the variances, which were covered in the first two principal components, were high in the case of both nutrient removals (altogether the four axes explained 99.6% and 98.36% of the variances in the case of nitrate and phosphate removal, respectively). However, the lower values in the case of phosphate removal suggest weaker effects of salt concentration on phosphate uptake than on nitrate removal. (Figure 4; see labels of axes). Nitrate removal correlated positively with the highest NaCl concentration in the case of the Chlorella spp., suggesting high nitrate removal beside high NaCl concentration (Figure 4a). There were positive correlations with lower concentrations in the case of Desmodesmus spp., S. obliquus, and M. pusillum, and there were weak, but opposite correlations in the case of Chlorococcum sp., S. obtusus, and M. komarkove (Figure 4a). It means in the case of Chlorococcum sp. that there were equally high nitrate removals; in the contrary, lower correlation suggest lower nitrate removal of S. obtusus and M. komarkove independently from salt concentration.
Phosphate removal of C. sorokiniana correlated positively with the highest NaCl correlation, suggesting that phosphate removals from cultures with 15,000 and 20,000 mg L−1 were equal to that of control. Phosphate removal values of C. vulgaris, Scenedesmus, and Monoraphidium spp. were separated out to a different cluster (Figure 4b) suggesting that salt concentration had weak or no effect on their phosphate removal.
Nitrate content decreased significantly from the beginning of the experiments to the 14th day in all control and treated cultures (p < 0.05; Table S4). Nitrate removal ranged from 37% (10,000 mg L−1 treated M. komarkove culture) to 99.8% (control C. vulgaris culture; Table 4). The proportion of removed nitrate decreased with increasing salt concentration in the case of all studied isolates, the differences were significant in cultures of Chlorella spp., Chlorococcum sp., D. spinosus, and Monoraphidium spp. (p < 0.05; Table 4). Decreasing proportions of removed nitrate with increasing salt content suggest a clear correlation between growth inhibition and nitrate uptake. Extents of nitrate removal were more reduced in the case of those species, which took up less nitrate already from control cultures (Table 4).
Phosphate content decreased significantly from the beginning of the experiments to the 14th day only in certain cultures of the studied species (p < 0.05; Table S5). Clear trend in phosphate content changes depending on NaCl concentration was observable only in the case of Chlorococcum sp. cultures: Proportion of removed phosphate decreased with increasing salt concentration, but significant differences among control and treated cultures did not occur (Table 5). Significant differences in phosphate removal appeared only among the differently treated D. spinosus cultures (p < 0.05; Table 5). Generally, phosphate removal was low, it ranged from 1% (10,000 mg L−1 treated M. pusillum culture) to 14% (1000 mg L−1 treated D. communis culture; Table 5); there were no observable correlations between salt tolerance and phosphate removal.
4. Discussion
4.1. Growth and Salinity Tolerance of the Cultures
Chlorella and Chlorococcum species often appear also in terrestrial environments thus we hypothesized that they would be characterized by higher salt tolerance than species characteristic more exclusively in freshwater habitats. This hypothesis was confirmed by the results: The Chlorococcum sp. and both Chlorella spp. were among the first four most tolerant species based on 96 h EC50 values. Long term salinity tolerance of these species also was confirmed by the results. Most literature data about salinity tolerance of microalgae are for Chlorella isolates, especially for C. vulgaris. Accurate comparison of literature data with each other and with our results is complicated, because of highly variable experimental designs (measured growth parameters, exposition times, or used culturing media). Almost all available data prove the salinity/NaCl tolerance of Chlorella species [17,32,50,51], only Singh et al. [29] reported that their C. vulgaris isolate was inhibited already from ~1500 mg L−1 (25 mM) NaCl. The same study also presented higher sensitivity of Chlorococcum humicola [29]. We found that our Desmodesmus communis strain also can be characterized with high salt tolerance. Similar high salt tolerance of certain Desmodesmus isolates also was reported [17,52]. In accordance with our results, literature data for Scenedesmus obliquus suggest a more pronounced salt sensitivity of the species [27]. Although salinity changes in a terrestrial habitat or caused by drought (increased evaporation of a small water body) cannot be modeled exactly using exclusively NaCl, the higher salt tolerance of species often appearing in terrestrial habitats undoubtedly can be explained with the adaptation of these species to the stochastically changing salinity of their natural environment [53,54]. Adaptation within relatively short periods was also not unimaginable, the relatively fast adaptation ability of certain green microalgae to increasing salt concentration was proved [32,55]. Higher salinity tolerance can be supposed on the basis of high tolerance against NaCl, since it was also proved that seawater with the same salinity caused much lower inhibition than artificial medium with the same nutrient content and salinity adjusted exclusively with NaCl [38]. Despite of the outstanding salt tolerance of the studied species, only Chlorella spp. can be ranked as slightly salinity tolerant ones according to the classification of Larsen [56].
Growth inhibitions observed on the basis of individual numbers were not clearly supported by dry weights of the collected biomasses. Contradictory dry weight data may be due to increased cell mass because of different accumulation processes, which could be part of the acclimation process to high salinity. Singh et al. [29] observed that cell sizes of Chlorococcum humicola and Chlorella vulgaris were increased during NaCl treatments, sodium content increased of the stressed cells, and chloride accumulation was also detected. Accumulation of osmolytes and stress proteins also could contribute to increased dry masses, despite the individual number-based growth inhibitions [17,29,52].
4.2. Conductivity Reduction and Chloride Removal
The second hypothesis was that terrestrial species would be able to reduce conductivity more (would be able to remove more ions, especially chloride) than species more characteristic in freshwater habitats. This hypothesis was not undoubtedly confirmed by the results. Conductivity reducing ability of the different species showed no significant differences between 500 and 5000 mg L−1 NaCl concentration, which is in accordance with the few literature data: Only slight differences in desalination ability were observed in the case of Scenedesmus sp. and Chlorella vulgaris strains [17]. According to the results of our present study, it cannot be obviously concluded that higher salt tolerance means higher conductivity reducing ability: It is obvious that ~20% reduction in 20,000 mg L−1 NaCl treated Chlorella cultures means more conductivity reduction than ~39% in 5000 mg L−1 treated S. spinosus culture. However, lower conductivity reduction values in 10,000 mg L−1 NaCl treated Chlorella cultures than in 10,000 mg L−1 treated cultures of the other species suggest no clear correlation between salt tolerance and conductivity reducing ability (i.e., more tolerant species not necessarily caused higher conductivity reductions among similar circumstances). The background of this phenomenon could be that the acclimation of algae to high salt concentration involves uptake and export of ions (e.g., Na+ and K+ using redox-driven Na+ pump [57,58]). More tolerant species may have higher plasticity in maintaining their ion balance, ion exchange processes may be more advanced, than ion accumulation. Farghl et al. [50] showed that there could be differences in salt tolerance mechanisms between halophilic and halotolerant taxa. Similarly to conductivity reducing ability, there were not clear correlation between salt tolerance and chloride removal: There were no significant differences of chloride removal of the different isolates within the same circumstances (e.g., 10,000 mg L−1 NaCl treatment; Table 3). As it was already discussed above, chloride accumulation could occur in the presence of NaCl surplus [17,29], but it seems that the phenomenon is influenced by many other environmental circumstances and highly strain-dependent.
4.3. Nutrient (Nitrate and Phosphate) Removal
Intense nutrient removal ability despite high salt concentration was supposed in the case of more tolerant isolates. This assumption was confirmed only in the case of nitrate and it should be noted that the results show a more complex picture. Indeed, more tolerant species could be characterized with higher nitrate removal; however, all isolates showed rather high nitrate removal even in cultures with the highest NaCl concentration. This phenomenon suggests a very intensive nitrate uptake per individual (cell or coenobium) in strongly growth inhibited cultures, even in the case of nitrate removal values showing positive correlation with lower salt concentrations. The production of N-containing osmolytes reported in microalgae (glycine, betaine and/or proline) could be the background of this phenomenon [49,52,59], although the confirmation of this assumption requires further investigations. As a summary, the results suggest that nitrate removal was not significantly affected by the salt content of the medium, only indirectly, through growth inhibition.
There were rather negative correlations between treatments (including control) and phosphate removal values. The surprisingly low, insignificant phosphate removal values in the case of all studied strains, even in control cultures were the background of these results. According to literature data, certain green microalgae species could be able to store phosphate as polyphosphate bodies [60], which could be an explanation of low phosphate removal. Excessive uptake and polyphosphate storage could be a consequence of “luxury uptake”, which does not require prior nutrient starvation [61]. On the other hand, N:P ratio of the culturing medium also affects nutrient uptake. Xin et al. [62] observed maximal (~99%) N and P removal at N:P = 5 in the case of Scenedesmus sp. LX1 strain. Feng et al. [63] also reported 97% ammonium-N and 96% total P removal at N:P = 5 studying Chlorella vulgaris. If the N:P ratio ranged between 1.7 and 2.75, then P removal was only 78% beside 100% ammonium-N removal (Chlorella vulgaris; [64]). Alketife et al. [65] observed lower N (75%) and P (53%) removal at N:P = 3.7 in the case of a Chlorella vulgaris strain. They showed, that maximal removal of both nutrients occurred at N:P = 10, if the initial concentrations were high, while maximal removal occurred at N:P = 7, if initial concentrations were relatively low. According to these observations, the assumption is justified, that low P removal from BBM appeared because of the unbalanced N:P ratio (0.77 for the used culturing medium with high, 41.05 and 53 mg L−1 initial concentrations for N and P, respectively). This assumption and our results are also well supported by recent results of Arora et al. [38]: They reported that P removal was only 15%–16% beside 100% removal of ammonium-N from BBM with 1.88 N:P ratio (using NH4HCO3 as a nitrogen source). On the basis of our results and literature data it could be concluded, that P removal is not affected by the salt concentration and it could be more favorable with appropriate N:P ratio of the culturing medium.
5. Conclusions
Based on the results, each of the nine green microalgae isolates can be considered as salt tolerant. Regarding the conductivity-reducing ability of the cultures, the ion uptake of the growth inhibited treated cultures was also significant in most of the tested isolates, each of them may contribute to the reduction of chloride content. Nitrate removal was significantly reduced only at NaCl concentrations of 5000 mg L−1 and above. In more concentrated solutions, inhibition of nitrate removal is clearly related to lower cell numbers due to inhibition of growth of cultures (less cells take up less nutrients). Wu et al. [66] found that even a slight increase in salinity could lead to 20% decrease of removal activities in constructed wetland assemblages, so application of salt tolerant taxa could prevent these drawbacks. Although performance of the studied microalgae lags behind halophilic bacteria [67], nitrate removal ability of them is comparable with that of certain constructed wetlands with plant assemblages [68,69]. It also has to be emphasized, that the presented high nitrate removal values occurred at high nutrient content, which environmental circumstance is known to be able to decrease nitrate removal abilities even in constructed wetland assemblages [70]. Green microalgae cultures grown in Bold’s Basal medium (BBM; N:P = 0.77) showed no significant phosphate removal. Phosphorus storage may be assumed, but low phosphate uptake most likely occurred due to low N:P ratio of the culturing medium. More satisfactory phosphorous removal could be expected only with higher, more appropriate N:P ratio. Each studied species could be considered as a common one in many types of water bodies, so it is reasonable to assume that the microalgae community would survive after artificial inoculation or natural settling of a newly created wastewater reservoir, and such community would be able to effectively contribute to the remediation of saline wastewaters.
Supplementary Materials
The following are available online at https://www.mdpi.com/2073-4441/11/12/2527/s1. Table S1: Dry weights of biomasses collected on the 14th day from the differently treated cultures of the studied strains; Table S2: Conductivity values (μS/cm) measured at the start (day 0) and at the end (day 14) of the experiments; Table S3: Chloride content values (mg L−1) measured at the start (day 0) and at the end (day 14) of the experiments; Table S4: Nitrate content values (mg L−1) measured at the start (day 0) and at the end (day 14) of the experiments; Table S5: Phosphate content values (mg L−1) measured at the start (day 0) and at the end (day 14) of the experiments.
Author Contributions
Conceptualization, I.B.; Data curation, A.F., D.D., K.M., and I.B.; Formal analysis, A.F. and V.B.-B.; Funding acquisition, S.A.N.; Investigation, A.F., D.D., and K.M.; Methodology, I.B.; Supervision, I.B.; Visualization, V.B.-B.; Writing—original draft, A.F.; Writing—review and editing, V.B.-B. and I.B.
Funding
The research was supported by the grant GINOP-2.2.1-15-2016-00029 “Optimized recycling and reduction of environmental impact of thermal and medicinal water using innovative microbiological, industrial and cavitation techniques”; by the Higher Education Institutional Excellence Programme (NKFIH-1150-6/2019) of the Ministry of Innovation and Technology in Hungary, within the framework of the 4th thematic programme of the University of Debrecen, and by the grant GINOP-2.3.2-15-2016-00019 “Sustainable use of ecosystem services—research for mitigating the negative effect of climate change, land use change and biological invasion”.
Acknowledgments
We are thankful to the Department of Botany, University of Debrecen for the possibility of biomass collection and lyophilization.
Conflicts of Interest
The authors declare no conflict of interest. The funders had no role in the design of the study; in the collection, analyses, or interpretation of data; in the writing of the manuscript, or in the decision to publish the results.
References
- Liang, Y.; Zhu, H.; Bañuelos, G.; Yan, B.; Zhou, Q.; Yu, X.; Cheng, X. Constructed wetlands for saline wastewater treatment: A review. Ecol. Eng. 2019, 98, 275–285. [Google Scholar] [CrossRef]
- Li, J.G.; Pu, L.J.; Han, M.F. Soil salinization in China: Advances and prospects. J. Geogr. Sci. 2014, 24, 943–960. [Google Scholar] [CrossRef]
- Zhang, H.X.; Zhang, G.M.; Lu, X.T. Salt tolerance during seed germination andearly seedlings stages of 12 halophytes. Plant Soil 2015, 388, 229–241. [Google Scholar] [CrossRef]
- Wauchope, R.D. The pesticide content of surface water draining fromagricultural fields—A review. J. Environ. Qual. 1978, 7, 459–472. [Google Scholar] [CrossRef]
- Beltrán, J.M. Irrigation with saline water: Benefits and environmentalimpact. Agric. Water Manag. 1999, 40, 183–194. [Google Scholar] [CrossRef]
- Jiang, D.M.; Wang, X.Y.; Liu, M.H.; Lu, G.F. Study on agricultural structure andnon-point source pollution: A case in Dapu Town of Yixing City. Ecol. Econ. 2006, 2, 270–280. [Google Scholar]
- Ghobadi, N.M.; Rahimi, H.; Sohrabi, T.; Naseri, A.; Tofighi, H. Potential riskof calcium carbonate precipitation in agricultural drain envelopes in arid and semi-arid areas. Agric. Water Manag. 2010, 97, 1602–1608. [Google Scholar] [CrossRef]
- Sun, B.; Zhang, L.X.; Yang, L.Z.; Zhang, F.S.; Norse, D.; Zhu, Z.L. Agriculturalnon-point source pollution in China: Causes and mitigation measures. Ambio 2012, 41, 370–379. [Google Scholar] [CrossRef] [PubMed]
- Dosdat, A.; Gaumet, F.; Chartois, H. Marine aquaculture effluent monitoring:methodological approach to the evaluation of nitrogen and phosphorus excretion by fish. Aquac. Eng. 1995, 14, 59–84. [Google Scholar] [CrossRef]
- Davidson, J.; Helwig, N.; Summerfelt, S.T. Fluidized sand biofilters used to remove ammonia, biochemical oxygen demand, total coliform bacteria, and suspended solids from an intensive aquaculture effluent. Aquac. Eng. 2008, 39, 6–15. [Google Scholar] [CrossRef]
- Hárs, T. Environmental and Economic Impacts of Thermal Waters. Ph.D. Thesis, Szent István University, Gödöllő, Hungary, 2006. [Google Scholar]
- Bayer, A. Water quality issues in multipurpose thermal water utilization. Hidr. Közl. 1985, 4, 247–252. (In Hungarian) [Google Scholar]
- Takács, J.; Nagy, S. The environmental need of thermal water utilization. Bányászat 2009, 77, 169–180. (In Hungarian) [Google Scholar]
- Arámburo-Miranda, I.V.; Ruelas-Ramírez, E.H. Desalination of sea water with aquatic lily (Eichhornia crassipes). Environ. Sci. Pollut. Res. 2017, 24, 25676–25681. [Google Scholar] [CrossRef] [PubMed]
- Yao, Z.; Ying, C.; Lu, J.; Lai, Q.; Zhou, K.; Wang, H.; Chen, L. Removal of K+, Na+, Ca2+, and Mg2+ from saline–alkaline water using the microalga Scenedesmus obliquus. Chin. J. Oceanol. Limnol. 2013, 31, 1248–1256. [Google Scholar] [CrossRef]
- Kokabian, B.; Ghimire, U.; Gude, V.G. Water deionization with renewable energy production in microalgae—Microbial desalination process. Renew. Energy 2018, 122, 354–361. [Google Scholar] [CrossRef]
- Sahle-Demessie, E.; Aly Hassan, A.; El Badawy, A. Bio-desalination of brackish and seawater using halophytic algae. Desalination 2019, 465, 104–113. [Google Scholar] [CrossRef]
- Abdel-Raouf, N.; Al-Homaidan, A.A.; Ibraheem, I.B.M. Microalgae and wastewater treatment. Saudi J. Biol. Sci. 2012, 19, 257–275. [Google Scholar] [CrossRef]
- Delrue, F.; Álvarez-Díaz, P.D.; Fon-Sing, S.; Fleury, G.; Sassi, J.F. The environmental biorefinery: Using microalgae to remediate wastewater, a win-win paradigm. Energies 2016, 9, 132. [Google Scholar] [CrossRef]
- Gan, X.; Shen, G.; Xin, B.; Li, M. Simultaneous biological desalination and lipid production by Scenedesmus obliquus cultured with brackish water. Desalination 2016, 400, 1–6. [Google Scholar] [CrossRef]
- Kirst, G.O. Salinity tolerance of eukaryotic marine algae. Annu. Rev. Plant Physiol. 1989, 41, 21–53. [Google Scholar] [CrossRef]
- Brown, L.M. Photosynthetic and growth responses to salinity in a marine isolate of Nannochloris bacillaris (Chlorophyceae). J. Phycol. 1982, 18, 483–488. [Google Scholar] [CrossRef]
- Alvensleben, N.; Stookey, K.; Magnusson, M.; Heimann, K. Salinity tolerance of Picochlorum atomus and the use of salinity for contamination control by the freshwater cyanobacterium Pseudanabaena limnetica. PLoS ONE 2013, 8, e63569. [Google Scholar] [CrossRef] [PubMed]
- Talebi, A.F.; Tabatabaei, M.; Mohtashami, S.K.; Tohidfar, M.; Moradi, F. Comparative salt stress study on intracellular ion concentration in marine and salt-adapted freshwater strains of microalgae. Not. Sci. Biol. 2013, 5, 309–315. [Google Scholar] [CrossRef]
- Slama, I.; Abdelly, C.; Bouchereau, A.; Flowers, T.; Savouré, A. Diversity, distribution and roles of osmoprotective compounds accumulated in halophytes under abiotic stress. Ann. Bot. 2015, 115, 433–447. [Google Scholar] [CrossRef] [PubMed]
- Erdmann, N.; Hagemann, M. Salt acclimation of algae and cyanobacteria: A comparison. In Algal Adaptation to Environmental Stresses; Rai, L.C., Gaur, J.P., Eds.; Springer: Berlin, Germany, 2001; pp. 323–361. [Google Scholar]
- Demetriou, G.; Neonaki, C.; Navakoudis, E.; Kotzabasis, K. Salt stress impact on the molecular structure and function of the photosynthetic apparatus—The protective role of polyamines. Biochim. Biophys. Acta 2007, 1767, 272–280. [Google Scholar] [CrossRef]
- Hajibagheri, M.A.; Gilmour, D.J.; Collins, J.C.; Flowers, T.J. Xray microanalysis and ultrastructural studies of cell compartments of Dunaliella parva. J. Exp. Bot. 1986, 37, 1725–1732. [Google Scholar] [CrossRef]
- Singh, R.; Upadhyay, A.K.; Chandra, P.; Singh, D.P. Sodium chloride incites reactive oxygen species in green algae Chlorococcum humicola and Chlorella vulgaris: Implication on lipid synthesis, mineral nutrients and antioxidant system. Bioresour. Technol. 2018, 270, 489–497. [Google Scholar] [CrossRef]
- Cram, W.J. Negative feedback regulation of transport in cells. The maintenance of turgor, volume and nutrient supply. In Encyclopedia of Plant Physiology; Liittge, U., Pitman, M.G., Eds.; Springer: Berlin/Heidelberg, Germany, 1976; Volume 2A, pp. 283–316. [Google Scholar]
- Gutknecht, J.; Hastings, D.F.; Bisson, M.A. Ion transport and turgor pressure regulation in giant algal cells. In Membrane Transport in Biology III: Transport across Biological Membranes; Giebisch, G., Tosteson, D.C., Ussing, H.H., Eds.; Springer: Berlin/Heidelberg, Germany, 1978; pp. 125–174. [Google Scholar]
- Li, X.; Yuan, Y.; Cheng, D.; Gao, J.; Kong, L.; Zhao, Q.; Wei, W.; Sun, Y. Exploring stress tolerance mechanism of evolved freshwater strain Chlorella sp. S30 under 30 g/L salt. Bioresour. Technol. 2018, 250, 495–504. [Google Scholar] [CrossRef]
- Fritioff, Å.; Kautsky, L.; Greger, M. Influence of temperature and salinity on heavy metal uptake by submersed plants. Environ. Pollut. 2005, 133, 265–274. [Google Scholar] [CrossRef]
- Hu, Y.; Schmidhalter, U. Drought and salinity: A comparison of their effects on mineral nutrition of plants. J. Plant Nutr. Soil Sci. 2005, 168, 541–549. [Google Scholar] [CrossRef]
- Calheiros, C.S.; Rangel, A.O.; Castro, P.M. Evaluation of different substrates to support the growth of Typha latifolia in constructed wetlands treating tannery wastewater over long-term operation. Bioresour. Technol. 2008, 99, 6866–6877. [Google Scholar] [CrossRef] [PubMed]
- Liu, Y.; Liu, Y.J. Biosorption isotherms, kinetics and thermodynamics. Sep. Purif. Technol. 2008, 61, 229–242. [Google Scholar] [CrossRef]
- Kumari, A.; Das, P.; Parida, A.K.; Agarwal, P.K. Proteomics, metabolomics, andionomics perspectives of salinity tolerance in halophytes. Front. Plant Sci. 2015, 6, 537. [Google Scholar] [CrossRef] [PubMed]
- Arora, N.; Laurens, L.M.L.; Sweeney, N.; Pruthi, V.; Poluri, K.M.; Pienkos, P.T. Elucidating the unique physiological responses of halotolerant Scenedesmus sp. cultivated in sea water for biofuel production. Algal Res. 2019, 37, 260–268. [Google Scholar] [CrossRef]
- Dortch, Q.; Clayton, J.R., Jr.; Thoresen, S.S.; Ahmed, S.I. Species differences in accumulation of nitrogen pools in phytoplankton. Mar. Biol. 1984, 81, 237–250. [Google Scholar] [CrossRef]
- Aravantinou, A.F.; Theodorakopoulos, M.A.; Manariotis, I.D. Selection of microalgae for wastewater treatment and potential lipids production. Bioresour. Technol. 2013, 147, 130–134. [Google Scholar] [CrossRef]
- AlgaeBase. Available online: http://www.algaebase.org (accessed on 12 August 2019).
- Salinometry. Available online: http://salinometry.com (accessed on 24 November 2019).
- Spellman, F.R. Handbook of Water and Wastewater Treatment Plant Operations; CRC Press: Boca Raton, FL, USA; London, UK; New York, NY, USA, 2008. [Google Scholar]
- CCAP Media Recipes. Available online: https://www.ccap.ac.uk/media/documents/BB.pdf (accessed on 24 May 2019).
- Németh, J. Methods of Biological Water Qualification; Institute of Environmental Management, Environmental Protection Information Service: Budapest, Hungary, 1998. [Google Scholar]
- Hungarian Standard MSZ 1484-13: 2009. Water Quality. Part 13: Determination of Nitrate and Nitrite Content by Spectrophotometric Method. Available online: http://www.mszt.hu/web/guest/webaruhaz (accessed on 24 May 2019).
- Hungarian Standard MSZ EN ISO 6878: 2004. Water quality. Determination of phosphorus. Ammonium molybdate spectrometric method (ISO 6878:2004). Available online: https://www.iso.org/standard/36917.html (accessed on 24 May 2019).
- Zar, J.H. Biostatistical Analysis, 3rd ed.; Prentice-Hall International: New Jersey, NJ, USA, 1996. [Google Scholar]
- Hammer, O.; Harper, D.A.T.; Ryan, P.D. PAST: Paleontological statistics software package for education and data analysis. Palaeontol. Electron. 2001, 4, 9. [Google Scholar]
- Fraghl, A.M.; Shaddad, M.A.K.; Galal, H.R.; Hassan, E.A. Effect of salt stress on growth, antioxidant enzymes, lipid peroxidation and some metabolic activities in some freshwater and marine algae. Egypt. J. Bot. 2015, 55, 1–15. [Google Scholar]
- Wang, T.; Ge, H.; Liu, T.; Tian, X.; Wang, Z.; Guo, M.; Chu, J.; Zhuang, Y. Salt stress induced lipid accumulation in heterotrophic culture cells of Chlorella protothecoides: Mechanisms based on the multi-levelanalysis of oxidative response, key enzyme activity and biochemicalalteration. J. Biotechnol. 2016, 228, 18–27. [Google Scholar] [CrossRef]
- Alvensleben, N.; Magnusson, M.; Heimann, K. Salinity tolerance of four freshwater microalgal species and the effects of salinity and nutrient limitation on biochemical profiles. J. Appl. Phycol. 2016, 28, 861–876. [Google Scholar] [CrossRef]
- Kókai, Z.; Bácsi, I.; Török, P.; Buczkó, K.; T-Krasznai, E.; Balogh, C.; Tóthmérész, B.; B-Béres, V. Halophilic diatom taxa are sensitive indicators of even short term changes in lowland lotic systems. Acta Bot. Croat. 2015, 74, 287–302. [Google Scholar] [CrossRef] [Green Version]
- B-Béres, V.; Tóthmérész, B.; Bácsi, I.; Borics, G.; Abonyi, A.; Tapolczai, K.; Rimet, F.; Bouchez, A.; Várbíró, G.; Török, P. Autumn drought drives functional diversity of benthic diatom assemblages of continental streams. Adv. Water Resour. 2019, 126, 129–136. [Google Scholar] [CrossRef] [Green Version]
- Perrineau, M.M.; Zelzion, E.; Gross, J.; Price, D.C.; Boyd, J.; Bhattacharya, D. Evolution of salt tolerance in a laboratory reared population of Chlamydomonas reinhardtii. Environ. Microbiol. 2014, 16, 1755–1766. [Google Scholar] [CrossRef] [PubMed]
- Larsen, H. Halophilic and halotolerant microorganisms—An overview and historical perspective. FEMS Microbiol. Rev. 1986, 39, 3–7. [Google Scholar] [CrossRef]
- Apte, S.K.; Thomas, J. Sodium transport in filamentous nitrogen-fixing cyanobacteria. J. Biosci. 1983, 5, 225–234. [Google Scholar] [CrossRef]
- Wiangnon, K.; Raksajit, W.; Incharoensakdi, A. Presence of a Na+-stimulated P-type ATPase in the plasma membrane of the alkaliphilic halotolerant cyanobacterium Aphanothece halophytica. FEMS Microbiol. Lett. 2007, 270, 139–145. [Google Scholar] [CrossRef] [Green Version]
- Tuna, A.L.; Kaya, C.; Higgs, D.; Murillo-Amador, B.; Aydemir, S.; Girgin, A.R. Silicon improves salinity tolerance in wheat plants. Environ. Exp. Bot. 2008, 62, 10–16. [Google Scholar] [CrossRef]
- Moudřiková, S.; Sadowsky, A.; Metzger, S.; Nedbal, L.; Mettler-Altmann, T.; Mojzeš, P. Quantification of polyphosphate in microalgae by Raman microscopy and by a reference enzymatic assay. Anal. Chem. 2017, 89, 12006–12013. [Google Scholar] [CrossRef]
- Eixler, S.; Karsten, U.; Selig, U. Phosphorus storage in Chlorella vulgaris (Trebouxiophyceae, Chlorophyta) cells and its dependence on phosphate supply. Phycologia 2006, 45, 53–60. [Google Scholar] [CrossRef]
- Li, X.; Hu, H.-Y.; Gan, K.; Sun, Y.-X. Effects of different nitrogen and phosphorus concentrations on the growth, nutrient uptake, and lipid accumulation of a freshwater microalga Scenedesmus sp. Bioresour. Technol. 2010, 101, 5494–5500. [Google Scholar]
- Feng, Y.; Li, C.; Zhang, D. Lipid production of Chlorella vulgaris cultured in artificial wastewater medium. Bioresour. Technol. 2011, 102, 101–105. [Google Scholar] [CrossRef] [PubMed]
- Aslan, S.; Kapdan, I.K. Batch kinetics of nitrogen and phosphorus removal from synthetic wastewater by algae. Ecol. Eng. 2006, 28, 64–70. [Google Scholar] [CrossRef]
- Alketife, A.M.; Judd, S.; Znad, H. Synergistic effects and optimization of nitrogen and phosphorus concentrations on the growth and nutrient uptake of a freshwater Chlorella vulgaris. Environ. Technol. 2017, 38, 94–102. [Google Scholar] [CrossRef] [PubMed]
- Wu, Y.; Tam, N.F.Y.; Wong, M.H. Effects of salinity on treatment of municipal wastewater by constructed mangrove wetland microcosms. Mar. Pollut. Bull. 2008, 57, 727–734. [Google Scholar] [CrossRef] [PubMed]
- Margesin, R.; Schinner, F. Potential of halotolerant and halophilic microorganisms for biotechnology. Extremophiles 2001, 5, 73–83. [Google Scholar] [CrossRef]
- Maine, M.; Sune, N.; Hadad, H.; Sánchez, G.; Bonetto, C. Nutrient and metal removal in a constructed wetland for wastewater treatment from ametallurgic industry. Ecol. Eng. 2006, 26, 341–347. [Google Scholar] [CrossRef]
- Park, J.-H.; Kim, S.-H.; Delaune, R.D.; Cho, J.-S.; Heo, J.-S.; Ok, Y.S.; Seo, D.-C. Enhancement of nitrate removal in constructed wetlands utilizing a combined autotrophic and heterotrophic denitrification technology for treating hydroponic wastewater containing high nitrate and low organic carbon concentrations. Agric. Water Manag. 2015, 162, 1–14. [Google Scholar] [CrossRef]
- Liang, Y.; Zhu, H.; Bañuelos, G.; Yan, B.; Shutes, B.; Cheng, X.; Chen, X. Removal of nutrients in saline wastewater using constructed wetlands: Plant species, influent loads and salinity levels as influencing factors. Chemosphere 2017, 187, 52–61. [Google Scholar] [CrossRef]
Figure 1.
Growth of control and NaCl-treated cultures of (a) Chlorella sorokiniana; (b) Chlorella vulgaris; (c) Chlorococcum sp.; (d) Desmodesmus communis; (e) Desmodesmus spinosus; (f) Scenedesmus obliquus; (g) Scenedesmus obtusus; (h) Monoraphidium komarkove; and (i) Monoraphidium pusillum based on individual numbers (cell numbers: (a–c) and (h–i) and coenobium numbers: (d–g). The numbers (from 500 to 20,000) indicate the salt concentrations in mg L−1 used in the treatments. Mean values (n = 3) and standard deviations are plotted. Different lowercase letters indicate significant differences (p < 0.05) among tendencies of growth curves. Asterisks indicate when the significant difference is only partial and cannot be marked by a different letter.

Figure 2.
Score plot of the first two principal components from principal component analysis of dry mass data of 14-day-old cultures of control and NaCl-treated green microalgae isolates. Treatments are indicated by loading vectors, numbers in italics indicates salt concentrations in mg L−1. Four letter codes are used for species names abbreviations: CSOR: Chlorella sorokiniana; CVUL: Chlorella vulgaris; CHLO Chlorococcum sp.; DCOM: Desmodesmus communis; DSPI: Desmodesmus spinosus; SOBL: Scenedesmus obliquus; SOBT: Scenedesmus obtusus; MKOM: Monoraphidium komarkove; and MPUS: Monoraphidium pusillum.

Figure 3.
Score plot of the first two principal components from principal component analysis of (a) conductivity reduction and (b) chloride removal data (% within the 14 days of the exposition time) of control and NaCl-treated green microalgae isolates. Treatments are indicated by loading vectors, numbers in italics indicate salt concentrations in mg L−1. Four letter codes are used for species names abbreviations: CSOR: Chlorella sorokiniana; CVUL: Chlorella vulgaris; CHLO Chlorococcum sp.; DCOM: Desmodesmus communis; DSPI: Desmodesmus spinosus; SOBL: Scenedesmus obliquus; SOBT: Scenedesmus obtusus; MKOM: Monoraphidium komarkove; and MPUS: Monoraphidium pusillum.

Figure 4.
Score plot of the first two principal components from principal component analysis of (a) nitrate and (b) phosohate removal data (% within the 14 days of the exposition time) of control and NaCl-treated green microalgae isolates. Treatments are indicated by loading vectors, numbers in italics indicates salt concentrations in mg L−1. Four letter codes are used for species names abbreviations: CSOR: Chlorella sorokiniana; CVUL: Chlorella vulgaris; CHLO Chlorococcum sp.; DCOM: Desmodesmus communis; DSPI: Desmodesmus spinosus; SOBL: Scenedesmus obliquus; SOBT: Scenedesmus obtusus; MKOM: Monoraphidium komarkove; and MPUS: Monoraphidium pusillum.


Table 1.
NaCl concentrations (mg L−1) causing 50% growth inhibition of the studied green microalgal strains after 4, 7, and 14 days of exposition (EC50 values).
Table 1.
NaCl concentrations (mg L−1) causing 50% growth inhibition of the studied green microalgal strains after 4, 7, and 14 days of exposition (EC50 values).
| Algae Strains | EC50 (mg L−1 NaCl) | ||
|---|---|---|---|
| 4th Day | 7th Day | 14th Day | |
| Chlorella sorokiniana | 9426 | 9594 | 9209 |
| Chlorella vulgaris | 29,233 | 21,230 | 10,890 |
| Chlorococcum sp. | n.c. 1 | n.c. | n.c. |
| (EC25 = 13,426) | (EC25 = 11,243) | (EC25 = 5092) | |
| Desmodesmus communis | n.c. | 6386 | 2801 |
| (EC25 = 3961) | |||
| Desmodesmus spinosus | 7361 | 5595 | 4382 |
| Scenedesmus obliquus | 5779 | 3585 | 3033 |
| Scenedesmus obtusus | 6273 | n.c. | n.c. |
| (EC25 = 2867) | (EC25 = 2924) | (EC25 = 3079) | |
| Monoraphidium komarkove | 3146 | 2464 | 2719 |
| Monoraphidium pusillum | 6638 | 5227 | 3789 |
1 n.c.: EC50 values are not calculable; EC25 values are given in these cases.
Table 2.
Extent of conductivity reduction (%) in the differently treated cultures of the studied green microalgal strains. Mean values and standard deviations are plotted (n = 3).
Table 2.
Extent of conductivity reduction (%) in the differently treated cultures of the studied green microalgal strains. Mean values and standard deviations are plotted (n = 3).
| Cond. (%) | CSOR | CVUL | CHLO | DCOM | DSPI | SOBL | SOBT | MKOM | MPUS |
|---|---|---|---|---|---|---|---|---|---|
| Control | 11.3 | 10.7 | 32.1 | 16.7 | 14.8 | 14.8 | 18.7 | 9.6 | 7.5 |
| ±0.2 a | ±0.8 a | ±4.8 b | ±14.5 a,b | ±1.3 a,b | ±10.4 a,b | ±5.3 a,b | ±3.8 a | ±2.9 a | |
| 500 | - | - | 30.1 | 20.2 | 27.0 | 22.2 | 21.5 | 22.9 | 24.1 |
| ±5.0 a | ±11.2 a | ±3.5 a | ±6.0 a | ±6.4 a | ±3.3 *,a | ±2.4 *,a | |||
| 1000 | - | - | 27.9 | 28.3 | 28.7 | 26.1 | 23.8 | 24.2 | 21.2 |
| ±0.6 a | ±14.0 a | ±9.4 a | ±9.7 a | ±11.7 a | ±8.3 *,a | ±8.1 *,a | |||
| 5000 | - | - | 23.8 | 29.7 | 38.5 | 7.8 | 26.3 | 20.2 | 21.3 |
| ±2.5 a | ±19.6 a | ±16.7 a | ±2.9 a | ±2.2 a | ±3.9 a | ±3.0 *,a | |||
| 10,000 | 20.0 | 17.6 | 24.5 | 29.1 | 36.2 | 2.8 | 12.1 | 21.4 | 22.2 |
| ±1.6 *,a | ±4.0 a | ±3.6 a | ±6.4 a | ±11.6 a | ±0.8 b | ±0.9 a | ±2.9 a | ±2.6 *,a | |
| 15,000 | 22.9 | 19.1 | - | - | - | - | - | - | - |
| ±0.9 *,a | ±4.7 a | ||||||||
| 20,000 | 22.1 | 22.4 | - | - | - | - | - | - | - |
| ±4.6 *,a | ±4.2 a |
CSOR: Chlorella sorokiniana; CVUL: Chlorella vulgaris; CHLO: Chlorococcum sp.; DCOM: Desmodesmus communis; DSPI: Desmodesmus spinosus; SOBL: Scenedesmus obliquus; SOBT Scenedesmus obtusus; MKOM: Monoraphidium komarkove; and MPUS: Monoraphidium pusillum. Asterisks indicate significant differences among the differently treated cultures of a species (columns; p < 0.05). Different lowercase letters indicate significant differences among the different isolates within the same treatment (raws; p < 0.05).
Table 3.
Extent of chloride removal (%) in the differently treated cultures of the studied green microalgal strains. Mean values and standard deviations are plotted (n = 3).
Table 3.
Extent of chloride removal (%) in the differently treated cultures of the studied green microalgal strains. Mean values and standard deviations are plotted (n = 3).
| Cl− (%) | CSOR | CVUL | CHLO | DCOM | DSPI | SOBL | SOBT | MKOM | MPUS |
|---|---|---|---|---|---|---|---|---|---|
| Control | 12.0 | 14.6 | 39.3 | 21.7 | 20.2 | 2.6 | 17.5 | 41.9 | 20.3 |
| ±5.4 a | ±2.9 a | ±10.2 a | ±18.4 a | ±11.3 a | ±0.1 a,CHSP | ±13.0 a | ±19.4 a | ±1.2 a | |
| 500 | - | - | 24.3 | 7.4 | 27.0 | 23.4 | 19.9 | 24.4 | 26.7 |
| ±7.1 *,a | ±6.4 b | ±3.5 a | ±7.3 *,a,b | ±10.3 a,b | ±1.3 a | ±1.3 a | |||
| 1000 | - | - | 24.0 | 12.1 | 25.3 | 25.5 | 17.1 | 23.7 | 22.2 |
| ±3.1 *,a | ±5.2 a | ±6.9 a | ±1.8 *,a | ±5.3 a | ±7.6 a | ±7.6 a | |||
| 5000 | - | - | 22.5 | 12.7 | 28.9 | 39.1 | 30.6 | 18.8 | 9.7 |
| ±0.7 *,a | ±11.0 a | ±16.7 a | ±8.3 *,a | ±9.4 a | ±9.7 a | ±5.6 *,a | |||
| 10,000 | 26.7 | 21.9 | 18.8 | 15.7 | 17.1 | 23.4 | 20.8 | 21.0 | 24.3 |
| ±1.5 *,a | ±3.4 a | ±1.8 *,a | ±2.0 a | ±1.0 a | ±0.7 *,a | ±4.2 a | ±2.8 a | ±2.8 a | |
| 15,000 | 28.6 | 23.8 | - | - | - | - | - | - | - |
| ±0.9 *,a | ±3.9 a | ||||||||
| 20,000 | 28.8 | 26.9 | - | - | - | - | - | - | - |
| ±2.8 *,a | ±4.9 a |
CSOR: Chlorella sorokiniana; CVUL: Chlorella vulgaris; CHLO: Chlorococcum sp.; DCOM: Desmodesmus communis; DSPI: Desmodesmus spinosus; SOBL: Scenedesmus obliquus; SOBT Scenedesmus obtusus; MKOM: Monoraphidium komarkove; and MPUS: Monoraphidium pusillum. Asterisks indicate significant differences among the differently treated cultures of a species (columns; p < 0.05). Different lowercase letters indicate significant differences among the different isolates within the same treatment (raws; p < 0.05).
Table 4.
Extent of nitrate removal (%) in the differently treated cultures of the studied strains. Mean values and standard deviations are plotted (n = 3).
Table 4.
Extent of nitrate removal (%) in the differently treated cultures of the studied strains. Mean values and standard deviations are plotted (n = 3).
| NO3− (%) | CSOR | CVUL | CHLO | DCOM | DSPI | SOBL | SOBT | MKOM | MPUS |
|---|---|---|---|---|---|---|---|---|---|
| Control | 94.8 | 99.9 | 96.4 | 85.5 | 91.1 | 80.5 | 76.1 | 76.8 | 88.9 |
| ±1.0 a | ±0.1 a | ±1.0 a | ±2.6 b | ±0.2 a,b | ±2.0 b | ±4.8 c | ±2.1 b,c | ±3.1 a,b | |
| 500 | - | - | 93.7 | 88.6 | 83.1 | 76.4 | 70.6 | 69.1 | 86.5 |
| ±3.4 a | ±3.2 a | ±0.1 *,a | ±2.4 a,b | ±6.3 a,b | ±8.3 b | ±3.3 a | |||
| 1000 | - | - | 90.3 | 85.4 | 78.0 | 81.3 | 70.6 | 52.1 | 82.8 |
| ±1.8 a | ±5.9 a | ±0.8 *,*,a | ±2.0 a | ±7.8 a,b | ±13.7 b | ±4.8 a | |||
| 5000 | - | - | 90.9 | 71.9 | 83.0 | 69.3 | 51.6 | 40.4 | 61.1 |
| ±6.6 a | ±6.7 a | ±0.6 *,a | ±18,9 a | ±12.4 a,b | ±4.0 *,b | ±1.7 *,a | |||
| 10,000 | 88.3 | 96.5 | 80.6 | 71.3 | 59.1 | 56.8 | 42.2 | 36.8 | 57.4 |
| ±1.1 a | ±0.1 a | ±0.8 *,a | ±7.0 a | ±0.2 *,*,*,a,b | ±11.3 a,b | ±20.7 b | ±3. *3 b | ±4.5 *,a,b | |
| 15,000 | 69.0 | 95.1 | - | - | - | - | - | - | |
| ±2.2 *,a | ±3.1 b | ||||||||
| 20,000 | 72.5 | 91.6 | - | - | - | - | - | - | |
| ±1.0 *,a | ±0.4 *,b |
CSOR: Chlorella sorokiniana; CVUL: Chlorella vulgaris; CHLO: Chlorococcum sp.; DCOM: Desmodesmus communis; DSPI: Desmodesmus spinosus; SOBL: Scenedesmus obliquus; SOBT Scenedesmus obtusus; MKOM: Monoraphidium komarkove; and MPUS: Monoraphidium pusillum. Asterisks indicate significant differences among the differently treated cultures of a species (columns; p < 0.05) Asterisks indicate significant differences among the differently treated cultures of a species (columns; p < 0.05). Different lowercase letters indicate significant differences among the different isolates within the same treatment (raws; p < 0.05).
Table 5.
Extent of phosphate removal (%) in the differently treated cultures of the studied strains. Mean values and standard deviations are plotted (n = 3).
Table 5.
Extent of phosphate removal (%) in the differently treated cultures of the studied strains. Mean values and standard deviations are plotted (n = 3).
| PO43− (%) | CSOR | CVUL | CHLO | DCOM | DSPI | SOBL | SOBT | MKOM | MPUS |
|---|---|---|---|---|---|---|---|---|---|
| Control | 10.4 | 1.1 | 12.0 | 4.0 | 13.1 | 4.4 | 2.4 | 3.2 | 4.5 |
| ±0.0 a | ±0.8 b | ±3.9 a | ±2.8 b | ±0.8 a | ±2.4 a,b | ±1.9 b | ±1.7 b | ±2.6 a,b | |
| 500 | - | - | 10.0 | 3.8 | 5.0 | 4.5 | 5.1 | 1.6 | 2.7 |
| ±5.5 a | ±1.4 a | ±0.5 *,a | ±2.5 a | ±1.9 a | ±1.3 a,CHSP | ±0.7 a,CHSP | |||
| 1000 | - | - | 9.0 | 14.4 | 5.0 | 4.0 | 8.2 | 3.7 | 2.1 |
| ±3.1 a | ±7.3 a | ±0.1 *,a | ±1.5a,DECO | ±2.5 a | ±2.9a,DECO | ±1.6a,DECO | |||
| 5000 | - | - | 6.6 | 12.2 | 7.5 | 5.7 | 4.6 | 3.3 | 4.6 |
| ±3.3 a | ±7.6 a | ±1.2 *,*,a | ±4.1 a | ±2.3 a | ±2.7 a | ±3.9 a | |||
| 10,000 | 9.8 | 1.3 | 6.0 | 10.3 | 7.9 | 1.6 | 5.8 | 5.0 | 1.0 |
| ±0.8 a | ±1.0 b | ±2.6 a | ±1.8 b | ±0.6*,*,a | ±0.8 b | ±0.4 a,b | ±0.6 a,b | ±0.4 b | |
| 15,000 | 12.1 | 2.2 | - | - | - | - | - | - | - |
| ±1.3 a | ±1.3 b | ||||||||
| 20,000 | 10.4 | 2.4 | - | - | - | - | - | - | - |
| ±0.2 a | ±0.1 b |
CSOR: Chlorella sorokiniana; CVUL: Chlorella vulgaris; CHLO: Chlorococcum sp.; DCOM: Desmodesmus communis; DSPI: Desmodesmus spinosus; SOBL: Scenedesmus obliquus; SOBT Scenedesmus obtusus; MKOM: Monoraphidium komarkove; and MPUS: Monoraphidium pusillum. Asterisks indicate significant differences among the differently treated cultures of a species (columns; p < 0.05) Asterisks indicate significant differences among the differently treated cultures of a species (columns; p < 0.05). Different lowercase letters indicate significant differences among the different isolates within the same treatment (raws; p < 0.05).
© 2019 by the authors. Licensee MDPI, Basel, Switzerland. This article is an open access article distributed under the terms and conditions of the Creative Commons Attribution (CC BY) license (http://creativecommons.org/licenses/by/4.0/).
Share and Cite
MDPI and ACS Style
Figler, A.; B-Béres, V.; Dobronoki, D.; Márton, K.; Nagy, S.A.; Bácsi, I. Salt Tolerance and Desalination Abilities of Nine Common Green Microalgae Isolates. Water 2019, 11, 2527. https://doi.org/10.3390/w11122527
AMA Style
Figler A, B-Béres V, Dobronoki D, Márton K, Nagy SA, Bácsi I. Salt Tolerance and Desalination Abilities of Nine Common Green Microalgae Isolates. Water. 2019; 11(12):2527. https://doi.org/10.3390/w11122527
Chicago/Turabian StyleFigler, Aida, Viktória B-Béres, Dalma Dobronoki, Kamilla Márton, Sándor Alex Nagy, and István Bácsi. 2019. "Salt Tolerance and Desalination Abilities of Nine Common Green Microalgae Isolates" Water 11, no. 12: 2527. https://doi.org/10.3390/w11122527
Note that from the first issue of 2016, this journal uses article numbers instead of page numbers. See further details here.