Assessing Future Impacts of Climate Change on Water Supply System Performance: Application to the Pozzillo Reservoir in Sicily, Italy


Department of Civil Engineering and Architecture, University of Catania, 95123 Catania, Italy
*
Author to whom correspondence should be addressed.
†
Currently a private consultant.
Water 2019, 11(12), 2531; https://doi.org/10.3390/w11122531
Submission received: 8 November 2019
/
Revised: 26 November 2019
/
Accepted: 27 November 2019
/
Published: 29 November 2019
(This article belongs to the Section Water Resources Management, Policy and Governance)
Abstract
:Climate change induced by greenhouse gas emissions is expected to alter the natural availability of water, affecting domestic, agricultural and industrial uses. This work aims at assessing the possible future impacts of climate change on precipitation, temperature and runoff, and to simulate the effects on reservoir demand–performance curves. To this aim, a modeling chain is set up, based on the combined use of regional climate models (RCMs) and water supply system simulation models. The methodology is applied to the Pozzillo reservoir, located in Sicily (Italy), which has experienced several droughts in the past. We use an RCM model that, based on a previous study, has proved to be the most reliable in the area, among those of the EURO-CORDEX initiative. RCM precipitation and temperature monthly time series are used to generate future reservoir inflow data, according to two representative concentration pathways, RCP4.5 (intermediate emissions scenario) and RCP8.5 (high emissions scenario) and a two-step bias correction procedure. Simulation of the reservoir indicated that, due to reservoir inflow reduction induced by climate change, performances of the Pozzillo reservoir are predicted to decrease significantly in the future, with impacts of RCP8.5 generally higher than RCP4.5.
Keywords:
water supply systems; Mediterranean climate; irrigation; reliability; vulnerability; RCM; RCP; EURO-CORDEX1. Introduction
Climate change, related to greenhouse gas emissions, potentially modifies the spatial and temporal distribution of water resources, and thus increases problems in their management [1,2]. In arid regions, which are more prone to droughts and water deficit, and water management is already challenged by many problems, climate change adaptation is of special concern [3,4,5]. Adaptation choices cover a wide range of options, from adaptive demand management to utilization of remaining marginal water sources [6,7]. Starting from the first decade of the 21st century, highly developed countries have implemented adaptation measures, which include optimization of reservoir operation taking into account of modified water resource availability scenarios [8,9,10], though transferring advanced tools for water management to decision makers may be challenging [11].
Several studies have attempted to assess the potential future impacts of climate change on the natural availability of water resources and demands, relatively to various areas of the globe: central Mexico [12], southwestern United States [13], Malaysia [14], West Bank in Israel [15], Corfu [16], and Turkey [17]. These studies are based on the analysis of climate projections obtained by perturbing Global Climate Models (GCMs) with greenhouse gas emission scenarios defined internationally by climate experts. GCMs provide, for a range of scenarios, climate projections up to the end of the present century. Currently, the scenarios are defined as representative concentration pathways (RCPs) which are characterized by the radiative forcing in W/m2 reached at year 2100. RCP4.5 and RCP8.5 are assumed as intermediate and extreme scenarios. Given the low spatial resolution of GCMs, Regional climate models (RCMs) based on dynamical downscaling of the former are often used in studies at the catchment scale. Most of the studies find a significant modification of the hydrological cycle components, and in particular of annual flows and groundwater availability. The impacts on the water cycle may be exacerbated by the projected increase of irrigation demands, due to rising mean temperatures and thus higher evapotranspiration rates [18]. The impacts on the performances of water supply systems under the changed scenarios of water availability have been studied in some research works, which however are mostly outdated because referred to the IPCC fourth assessment report (AR4). Christensen et al. [19] analyzed the effects of climate change on the hydrology and water resources of the Colorado River basin, finding a reduction of annual hydropower production under the future climate scenarios of the AR4. Minville et al. [20] evaluated the impacts on hydropower, power plant efficiency, unproductive spills and reservoir reliability due to changes in the hydrological regimes induced by climate change in the Peribonka River water resource system (Quebec, Canada). Adamec et al. [21] evaluated the impacts of climate change on reservoir operations within the Connecticut River Basin, considering two dams that operate to meet hydropower and flood control objectives, finding that climate change impacts depend significantly on what are the management goals to pursue. Ashofteh et al. [22] studied the impact of climate change on the inflow volume to a reservoir and the volume of downstream water demand in an East Azerbaijan river basin. Garrote et al. [23] performed a quantitative assessment of climate change vulnerability of irrigation demands in Mediterranean Europe, based on the Water Availability and Adaptation Policy Analysis (WAAPA) model that allows the estimation of demand-reliability curves, analyzing over sixty river basin districts of Southern Europe. The analysis of reservoir performance can allow to derive reservoir operating rules that optimize the performances of reservoirs in the future scenarios, as illustrated by Wurbs et al. [24], that discussed on how to incorporate climate change in water availability modeling, based on a modeling strategy combining climate, watershed hydrology, and water-management models. For, instance Raje et al. [25], studied climate change impacts on a multipurpose reservoir performance and derived adaptive policies for possible future scenarios, carrying out an application to a case study of Hirakud reservoir on the Mahanadi river in Orissa, India, a multipurpose reservoir serving flood control, irrigation and power generation. Ashofteh et al. [26] used multi-objective genetic programming to calculate optimal reservoir-operating rules under baseline and climatic-change conditions, with applications to the Aidoghmoush Reservoir (located in East Azerbaijan, Iran).
In this paper, we propose a methodology for assessing the impacts of climate change on reservoir performance based on the use of RCMs of the AR5 and demand-performance curves. These curves are plots of the value of a performance indicator as a function of the total annual demand, and allow understanding which modifications of the performance are expected in the future if the demand remains equal to current, or which changes of the demand are required to keep the current performance in the future. The methodology is applied to the Pozzillo reservoir, which is the main reservoir of the most important water supply system in Sicily, a region that suffers water scarcity and droughts [27,28,29], but for which no specific studies about the future impacts of climate change have been carried out to date. The work also aims at assessing the potential future changes in precipitation, temperature, and streamflow (reservoir inflows) in the relative catchment. For the purposes of this study, we use the RCM data of the Euro-CORDEX initiative [30], and refer to both future scenarios RCP4.5 and RCP8.5. The impacts are assessed at three future time horizons: 2040, 2070 and 2100. The methodology includes the application of a parsimonious bias correction to both the primary meteorological data (rainfall and temperature) and the hydrological data (streamflows). The results of this study can help water resource managers in the region to develop specific climate change adaptation measures.
2. Materials and Methods
2.1. Overview
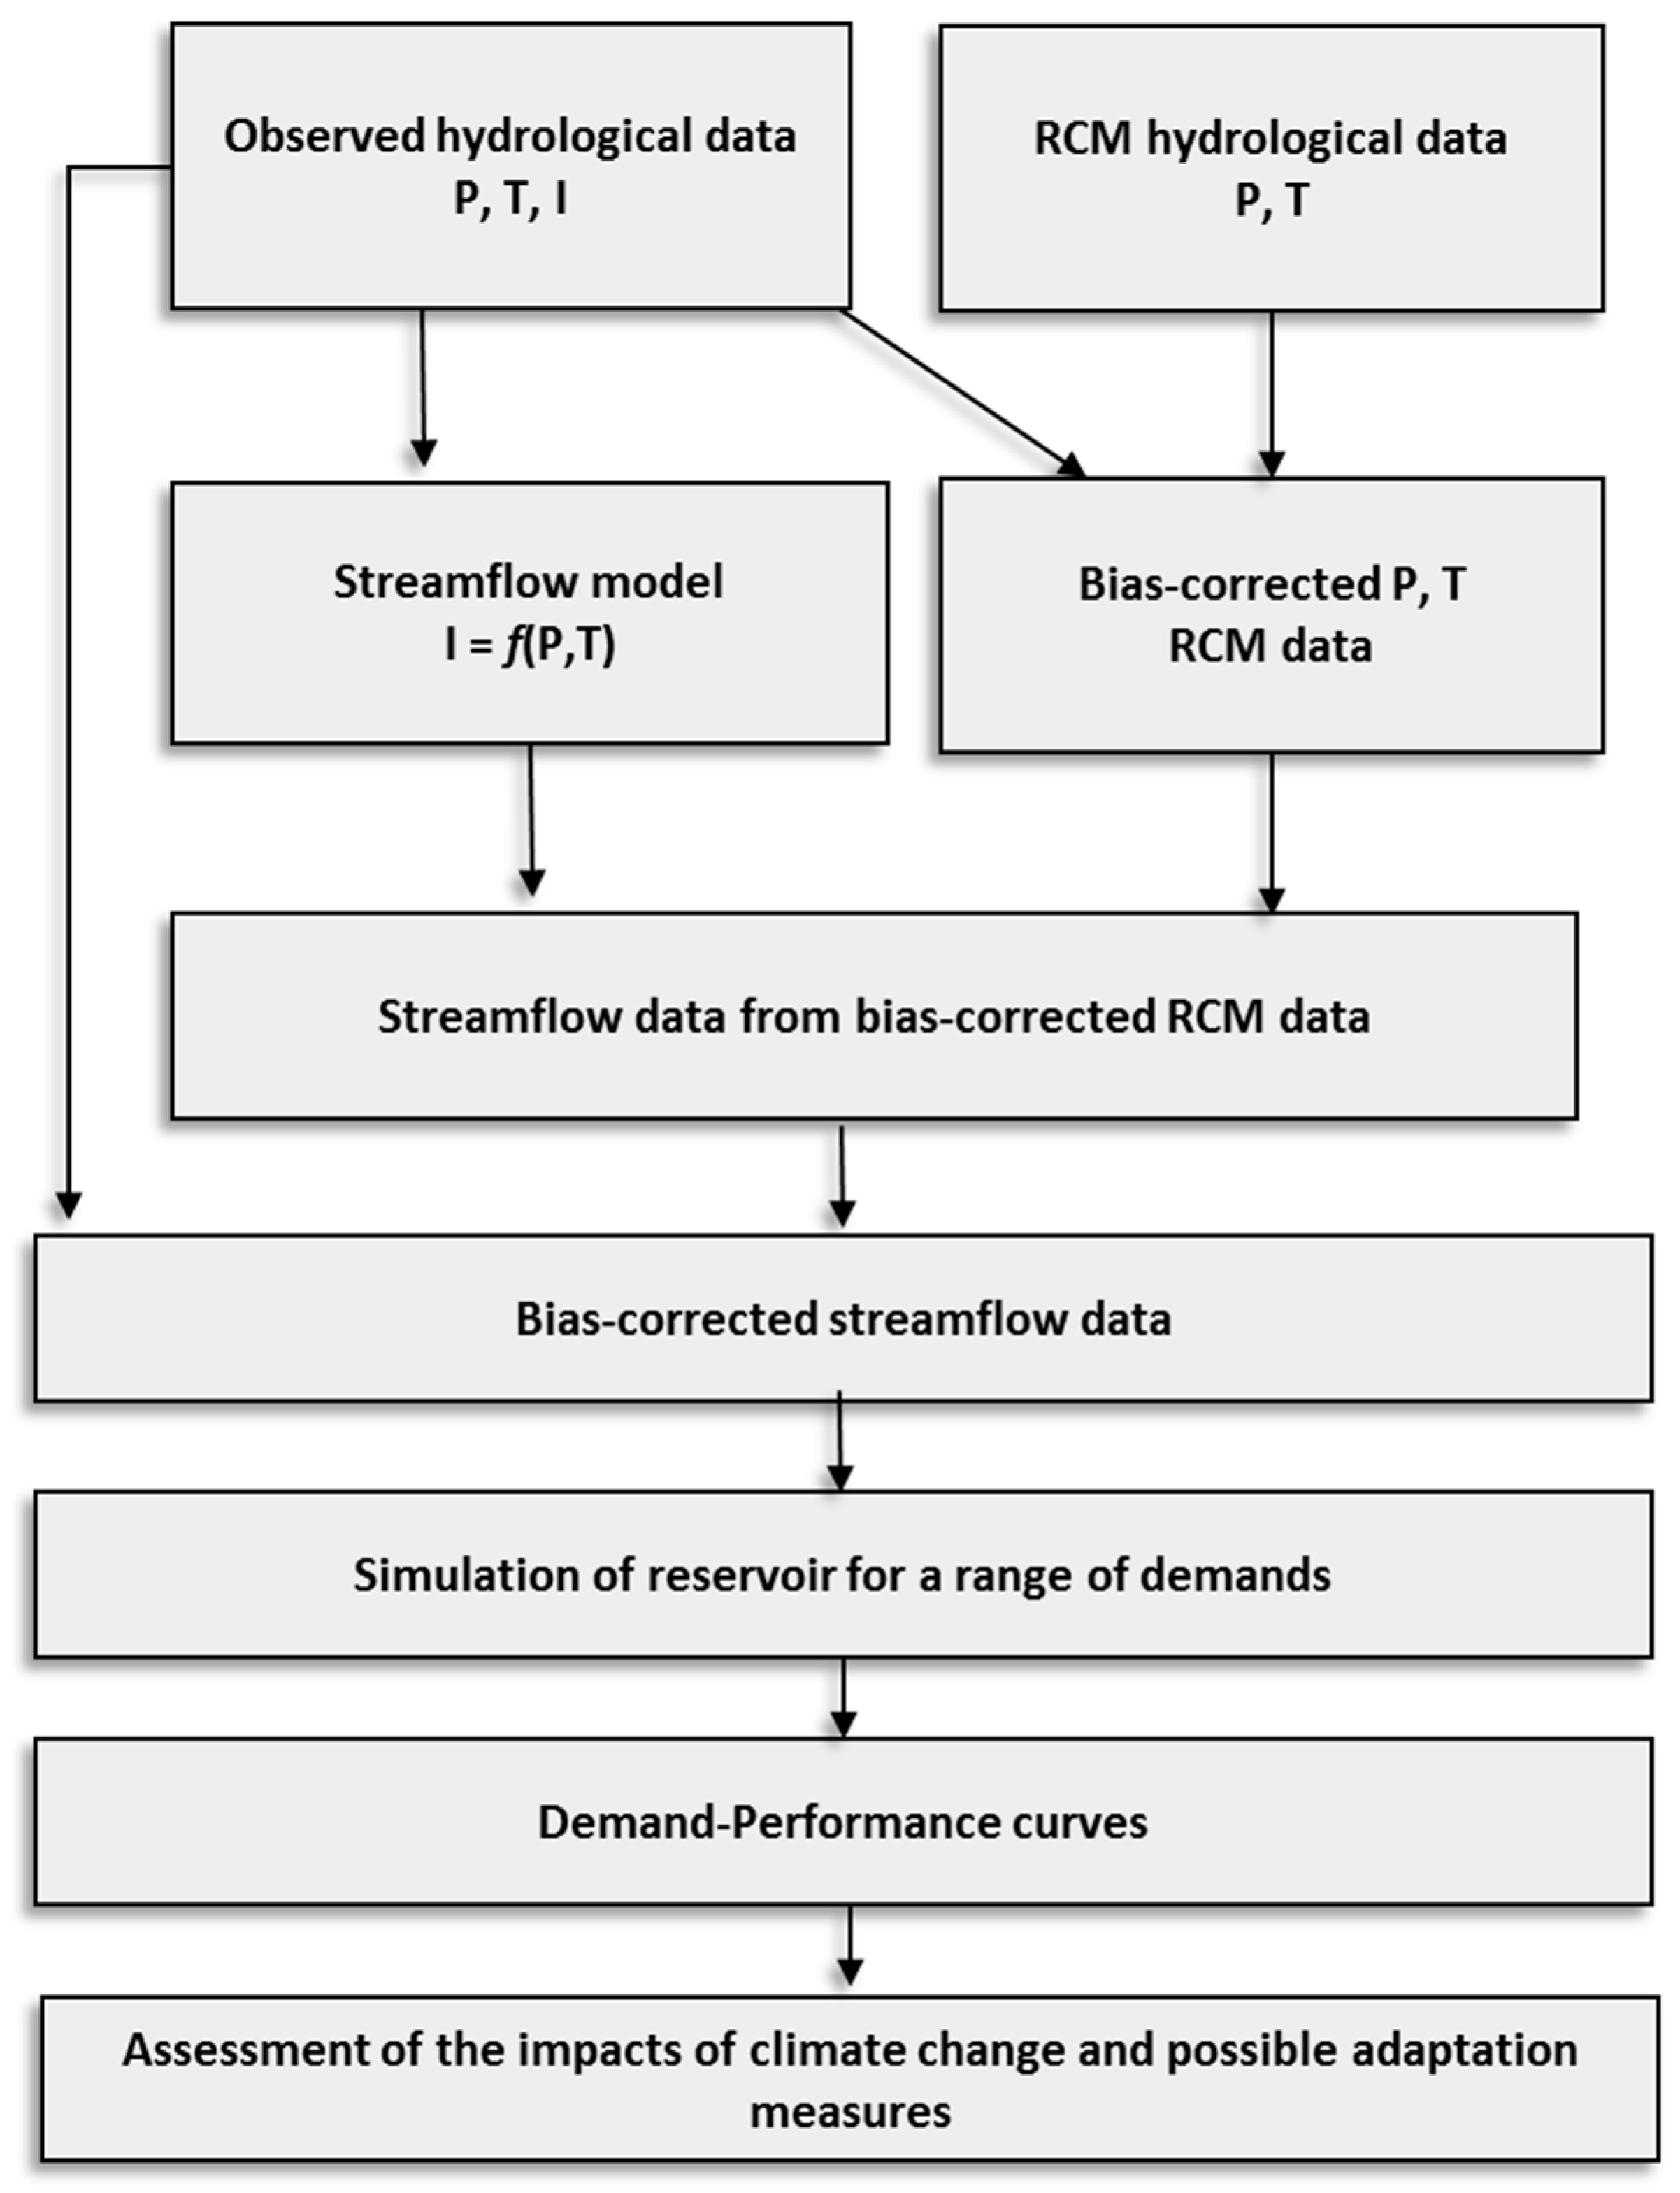
Figure 1 shows an overview of the proposed methodology for assessing the impacts of future climate change scenarios on reservoir performance. Input data consist of observed meteorological and hydrological data, i.e., precipitation, temperature and river streamflows, inflowing to the reservoir, as well as available RCM simulations for the area of interest. As is customary when analyzing large reservoirs, a monthly time scale is adopted.
Several RCM simulations are available for most parts of the planet, under the Coordinated Downscaling Experiment (CORDEX). For Europe, data from several GCM-RCM combinations are available at a 0.11° resolution (approximately 12 km) from the Euro-CORDEX initiative. The quality of the climate models available can be assessed by measuring how well they reproduce the observed climate in a reference historical period. In this paper, we then follow a subset approach, which consists in carrying out the impact analysis using the ensemble the m best models [31]. This approach usually leads results that are more reliable than using the ensemble of all models available, even for m = 1. Nonetheless, even after selection, RCM data are generally affected by significant errors [32,33,34,35,36]. Thus, we apply a first bias correction of monthly precipitation and temperature. Observed precipitation and temperature are then used to calibrate on observed streamflows a hydrological model for streamflow estimation. Such a model is therefore applied to simulate streamflows using as input the RCM data, both for a control (baseline) period and the future, under the two RCPs, 4.5 and 8.5. Then, a second bias correction step is applied to the generated streamflow data, in order to have reliable data for reservoir simulation. It is important that this second correction step does not undermine parsimony of the whole procedure (i.e., the total number of corrections has to be relatively low) [37]. After this second correction phase and the computation of other necessary hydrological data (such as evaporation from the stored water free surface making use of RCM temperature series), simulation of the reservoir is carried out. Then performances of the reservoir water supply with reference to the water demand are assessed in terms reliability and vulnerability with reference to future and control periods. This enables to evaluate the impacts of climate change by assessing the variation of performance indices in future scenarios with respect to control period. In the following subsections, the various steps are described in more detail.
2.2. Precipitation and Temperature Data Processing
Due to uncertainties in the RCM scenarios, monthly precipitation and mean temperature series must first be compared with the corresponding observations for the historical period, as raw RCM data may differ significantly from observations in the control period. A typical choice as a control (or baseline) period is 1971–2000—the length of 30 year is widely recognized by climate scientists as a standard to define “climate normals” [38]. Then, in order make the RCM simulation more reliable, the observed information is exploited, and a “bias correction” is applied to the control and future period [39]. To this end, several methods have been proposed, as reviewed by Teuschbein and Seibert [40]. In this work we apply the so-called linear-scaling method, whose main advantage is parsimony [41]. According to this method, the RCM monthly precipitation data are corrected by multiplicative factors that bring the monthly means of corrected precipitation to match their observed values. On the other hand, the temperature data are adjusted through an additive term that brings the corrected average monthly mean temperature to equal the observed values. Thus, the corrections are the following for precipitation and temperature, respectively:
where P denotes precipitation and T temperature, the overline indicates the mean operation, the subscript o indicates observed values and m those simulated by the RCM; superscript c stands for “control period” (i.e., 1971–2000 in this paper); t = 1, 2, …, 12 is the month index. The corrected control and future data are given by the following equations:
where, in addition to previously declared symbols, prime stands for “corrected value”, superscript f indicates a future period and i = 1, 2, …, 30 is the year index. Thus, the result of previous equations is a series of 12 × 30 = 360 values for each period.
2.3. Hydrologic Modeling and Correction
Since RCM simulations do not directly provide river streamflow data, rainfall-runoff modeling is necessary in order to estimate future streamflows from RCM precipitation and temperature data. In this work, we use a data-driven approach, and specifically, multiple regression to model monthly streamflows as a function of precipitation and temperature. The model is first calibrated and validated on observed data. Thus, simultaneous observations of precipitation, temperature and streamflow data are needed to build the model. In particular, we consider the following regressive lumped model [42,43]:
where I indicates streamflow, the four parameters to be calibrated are in Greek letters (α, β, γ and δ), and subscript e indicates that the value is estimated from the regressive model. As can be seen, in order to take into account time dependence, lag-1 streamflows are used as input to the model. These streamflows are not the observed values, but the estimated ones. Thus, an iterative procedure is applied to calibrate the model. Calibration is carried out by minimizing the sum of squared errors:
where n is the number of years used for calibration of the streamflow model.
The performance of the streamflow regressive model can be assessed by a series of indicators such as the widely used mean error (or bias) ME, the root mean squared error RMSE and the Nash-Sutcliffe efficiency E. We assume that most readers are familiar with these indices and thus do not show the related formulas; they can however refer to other papers [43,44]. After calibration, corrected RCM precipitation and temperature data can be used as input to the model to generate future and control period data. Variations of reservoir performance (impacts of climate change) are assessed using these two sets of data, which are consistent as both derive from the same RCM.
The control and future streamflows obtained in this stage are thus given by the following formulas:
These series are corrected again by the linear-scaling method, so that corrected streamflows in the control period have monthly averages that match the corresponding observed values:
It is worthwhile to notice that the two-step linear-scaling bias correction implies, for each period, three correction operations per month (one correction per each of the three variables involved: precipitation, temperature and streamflow). Hence it is more parsimonious than all other, more sophisticated, one-step bias correction methods of precipitation and temperature only that involve at least two corrections per variable: for instance, correction for mean and variance of only precipitation and temperature would imply four corrections per month [40].
2.4. Reservoir Simulation and Performance Assessment
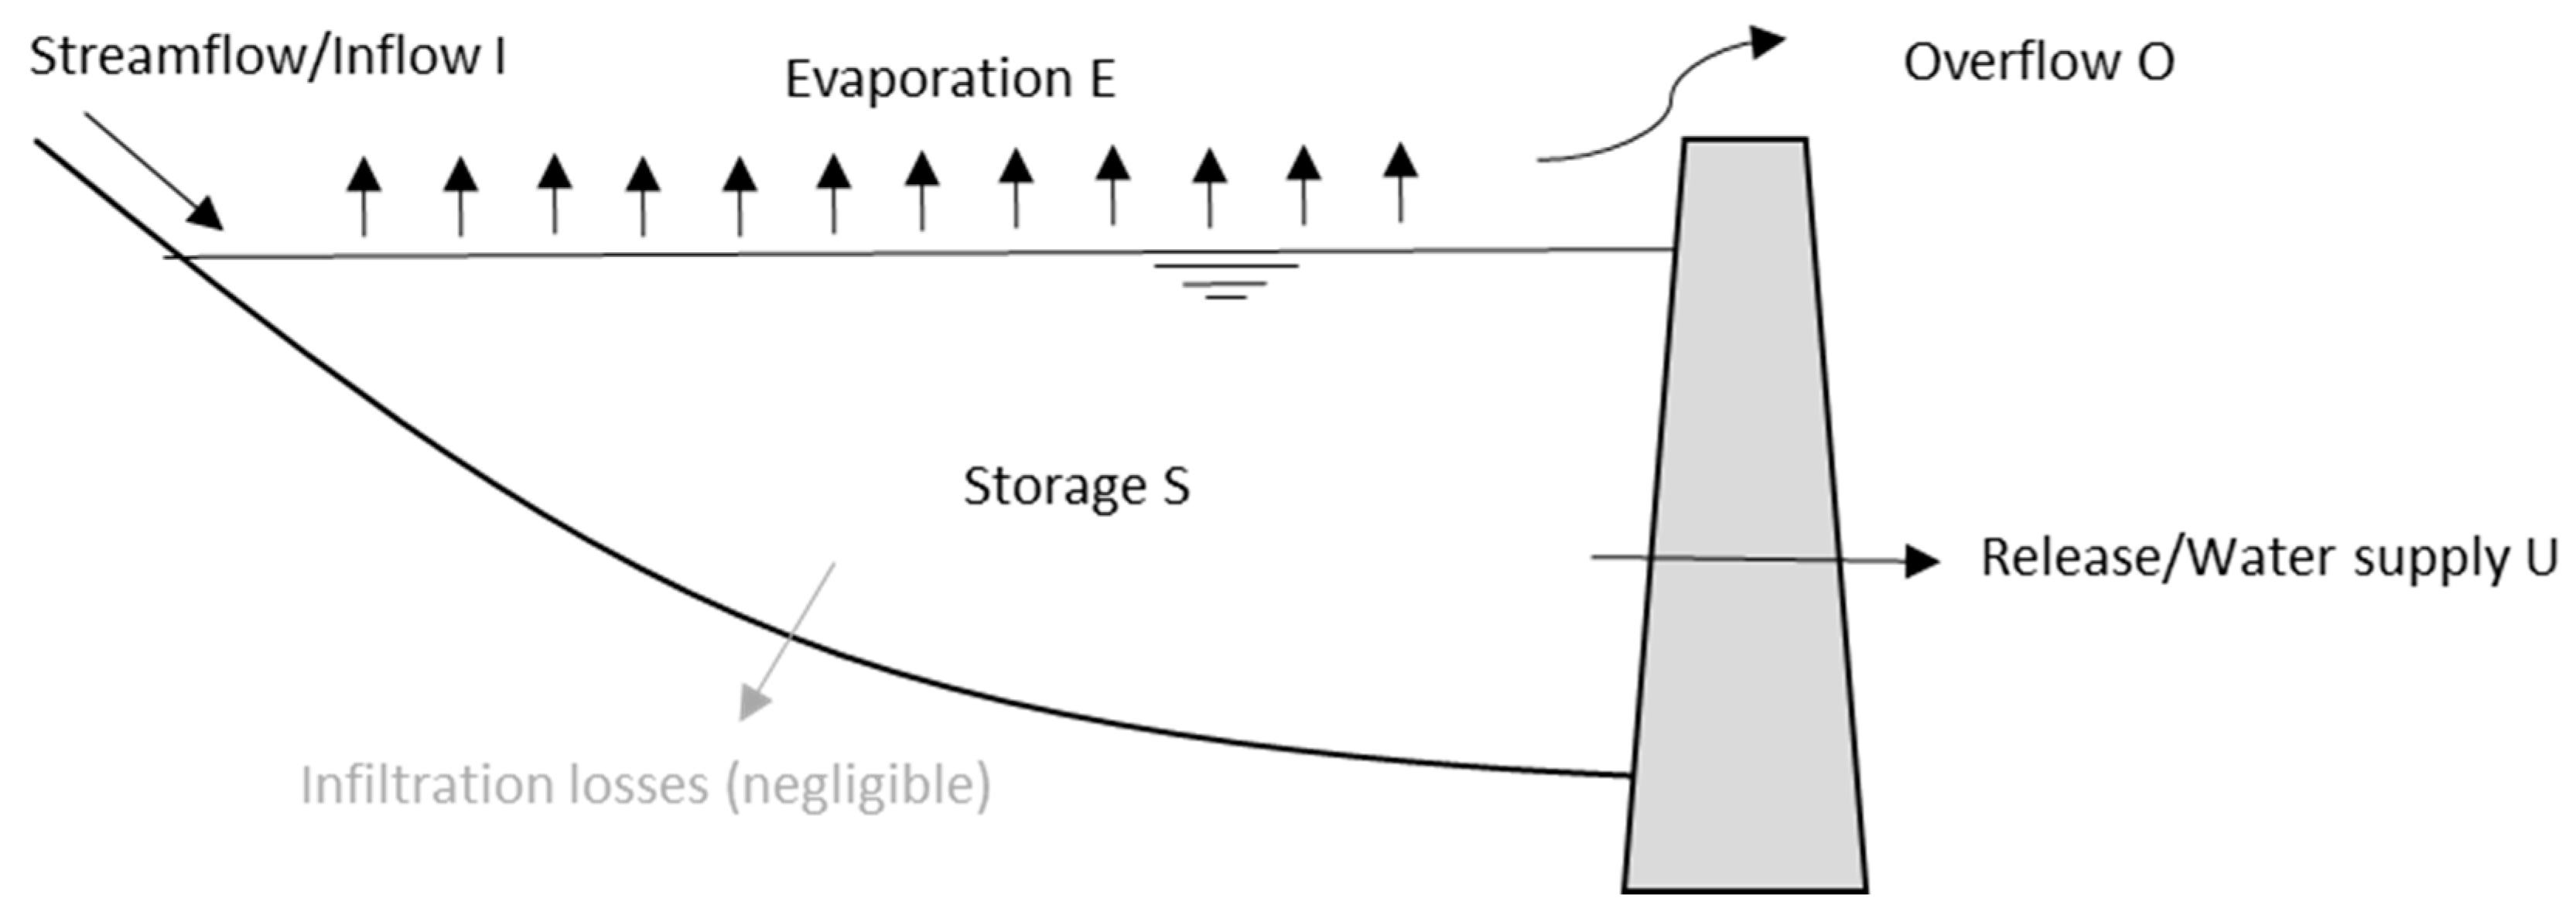
Reservoir is simulated by the following water balance equation (see Figure 2):
which expresses conservation of mass: k is the time step (month), S is the volume stored in the reservoir, I is reservoir inflow (river streamflow), E is evaporation from the free water surface, U is the release (or water supply) and O are storage losses due to reservoir overflows, which may occur during flood periods. Infiltration losses due to leakage at the bottom of the reservoir are neglected, due to the very low permeability of the lake bottom. All quantities are volumes. Evaporation can be estimated using empirical formulas based on temperature data. In particular, in this paper, we use the following empirical equation based on Sicilian reservoir data [45]:
where A is the area of the free water surface, usually expressed as a function of storage A = A(S) and Tk is mean temperature at current month k. Regarding the release term, this is determined by the water demands D and the reservoir operating rule. In this paper, we consider the Standard Operating Policy (SOP) as the operating rule:
Equation (14) is subject to the following constraints, which determine the overflows:
where Smin and Smax are respectively the minimum (usually zero) and maximum storage (reservoir capacity).
The reservoir is simulated using the inflows obtained after the second bias correction, i.e., Equations (12) and (13). For the control period (1971–2000) and the three future periods in both RCPs, the performances of the reservoir are assessed in terms of temporal and volumetric reliability, and Beard’s vulnerability index. These indices are defined based on the degree at which water demands are satisfied [46]. In particular, temporal reliability is defined as the probability that at a given time step the reservoir is able to satisfy water demand, and can be estimated by its frequency:
where ns is the number of months in the simulation when the demand is satisfied (Uk = Dk) and N is the total number of simulated months. For instance in our 30-year simulations, N = 30 × 12 = 360.
Volumetric reliability is defined as the ratio between the total water supply and total demand volumes:
Vulnerability indices are instead aimed at measuring how severe the consequences of water deficits may be. Different measures are used in the literature as alternative indicators of vulnerability. Here we consider the Beard index, computed as follows:
where and are respectively the total annual demand and release.
Simulations are carried out by considering several demand levels, and by computing the corresponding indices. This allows to analyze the impacts of climate change independently of the demand, and to make considerations, e.g., on what is the level of demand that would keep future performances equal to current.
3. Case Study and Data
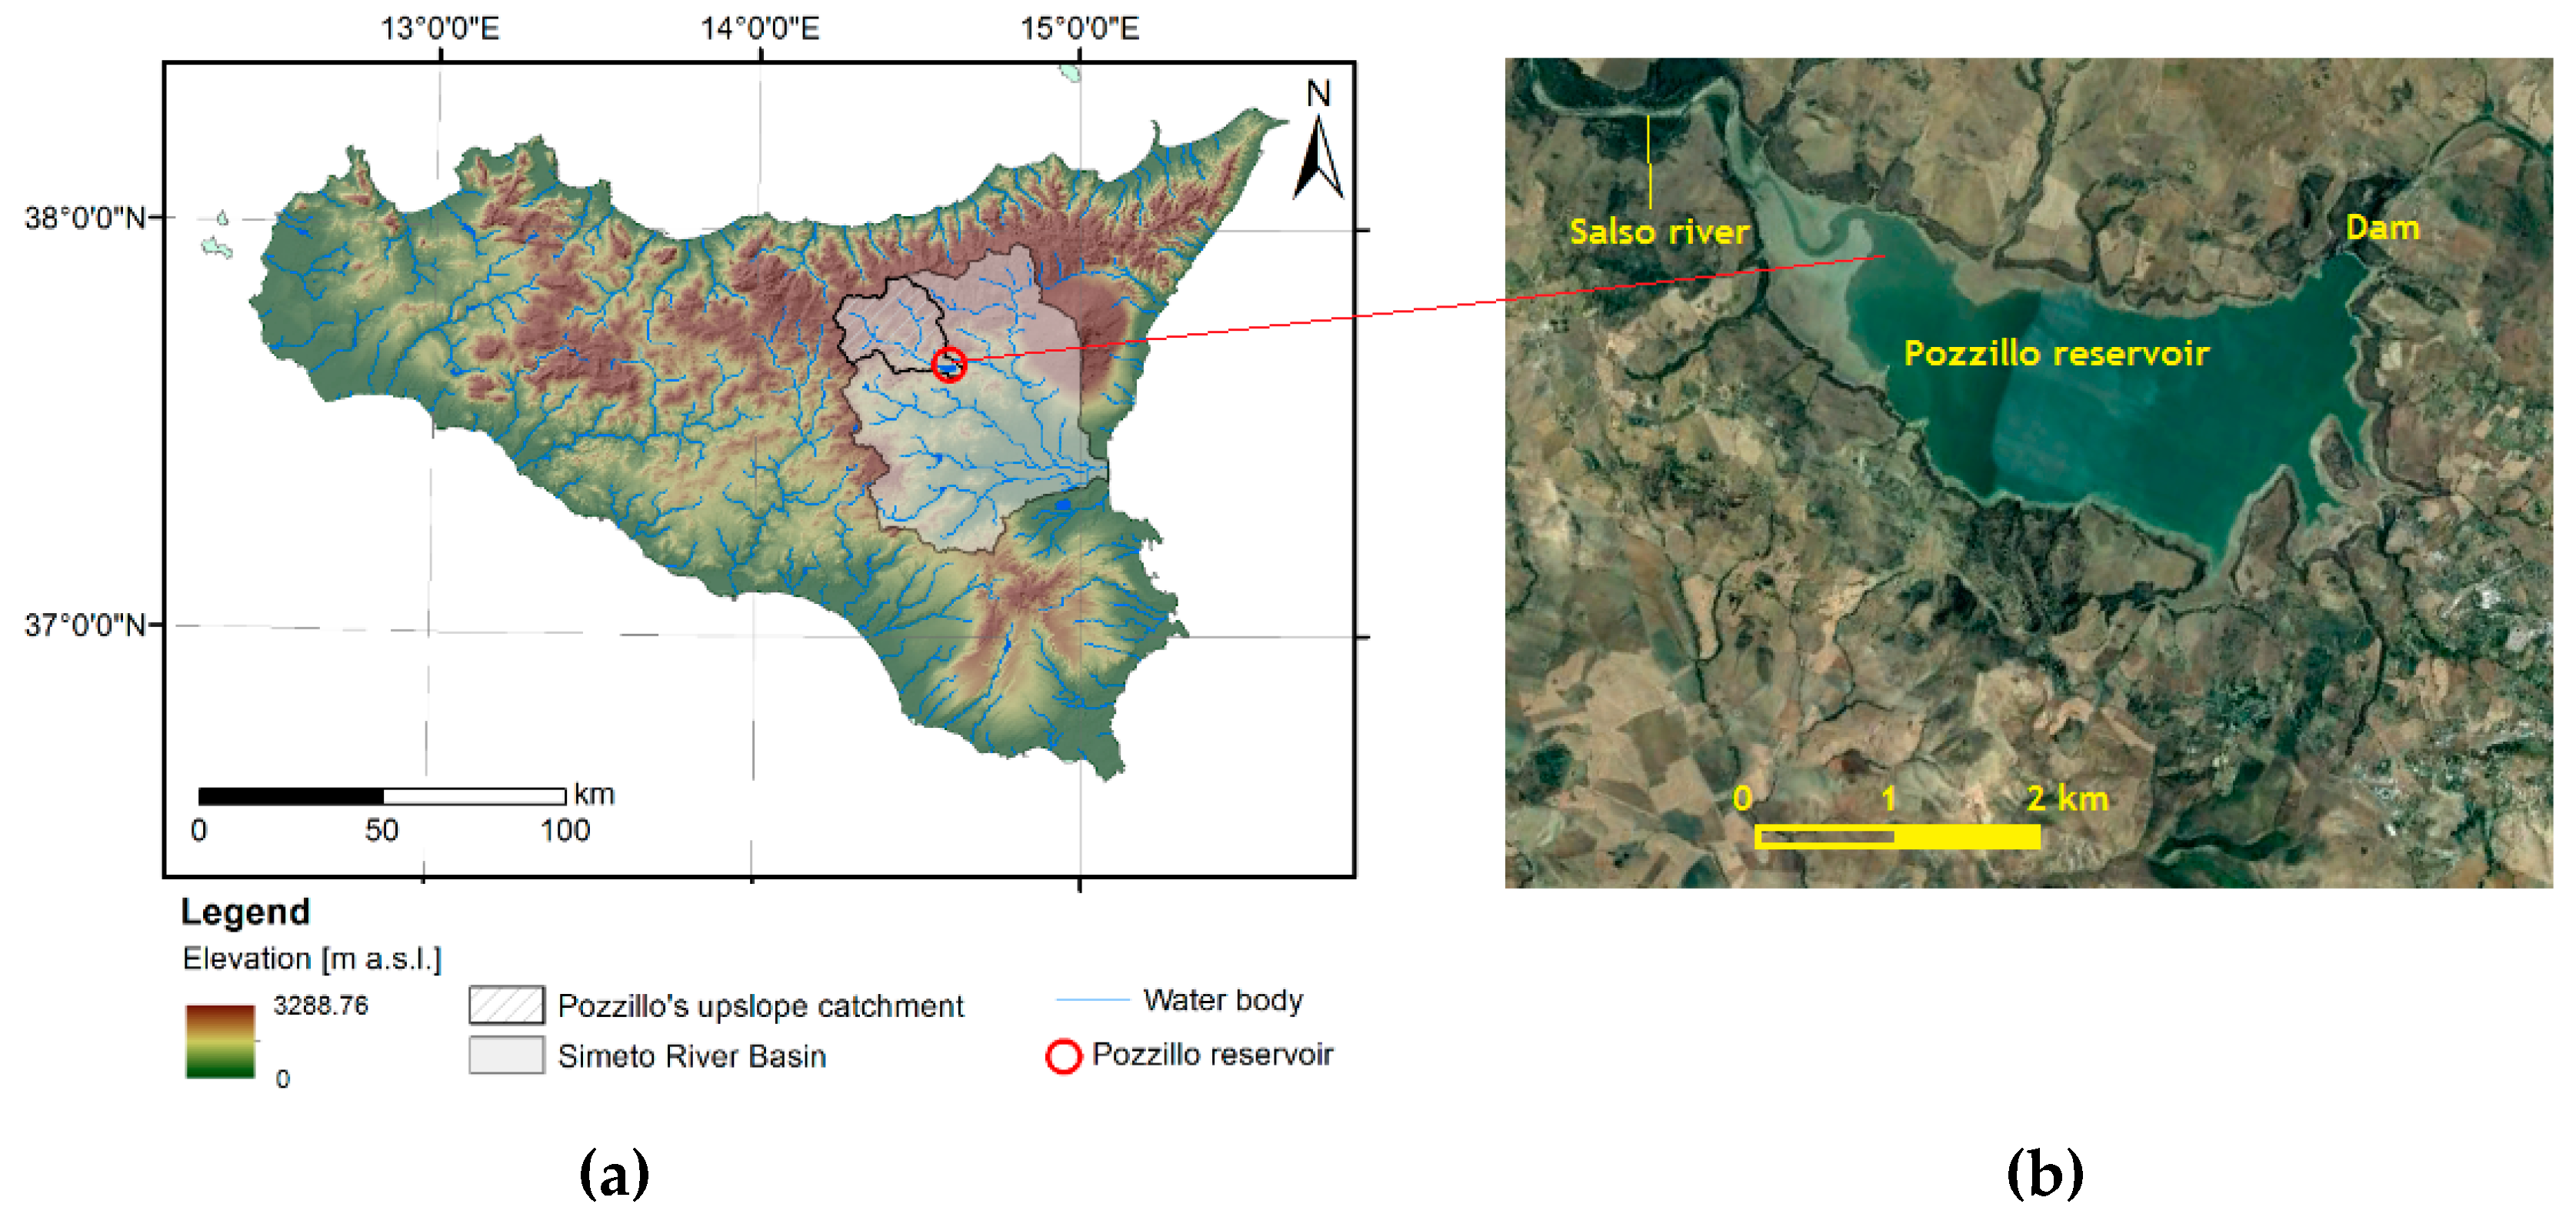
The Pozzillo reservoir is the largest in Sicily, with a net capacity of 123.50 . The reservoir is within the Salso-Simeto system that is part of the more complex water supply system of the Catania Plain [47], located in the eastern part of the island (Figure 3).
The main storage infrastructures of the entire system—in addition to the Pozzillo reservoir—are: the Ancipa reservoir, the S. Domenica, Contrasto and Ponte Barca intakes, the Lentini reservoir and some hydroelectric power plants. The Salso-Simeto system comprises the Pozzillo and Ancipa reservoirs, which serve the Land reclamation consortium 9 (LRC9) of Sicily, and the municipal demand of nine municipalities in the Caltanissetta province. In this paper we consider only the irrigation demand of the LRC9, as done in other previous studies [47,48,49]. This demand amounts in average 88 hm3 yearly and is concentrated only in the period May–October, where is distributed as in Table 1. When performing the analysis of performances by varying the demand level, the yearly total was distributed according to the monthly percentages shown in the table.
To apply Equation (15) for estimating evaporation, the function that relates reservoir storage and area of the free water surface is needed. This is derived from the most recent bathymetric survey campaign data available. The following equation provides a good approximation of the measured data:
with A in km2 and S in hm3.
Regarding the climate projections, in a previous study we have analyzed in detail the reliability of 14 RCMs from the Euro-CORDEX initiative [50]. In particular, the performances were assessed by comparing the historical RCM data with observations in the baseline period. We then apply the subset approach for the particular case of m = 1, i.e., use the model that performs the best. As already mentioned, this generally provides more reliable results than considering the ensemble of all available models [31]. From this mentioned previous study the SMHI-RCA4 RCM [51] nested on the CNRM-CM5 GCM, revealed to be the most reliable RCM in our study area, which is thus the model by which we perform our impact assessments.
Observed monthly precipitation and mean temperature data have been retrieved from the Meteorological Network of the Sicilian Water Observatory, previously managed by the National Hydrographic and Mareographic Service. Areal precipitation and temperature has then been computed from the weather stations within the catchment that drains into the reservoir (area 577 km2) using the Thiessen polygons method. Inflows were derived from [45], based on the analysis of monitoring data of the historical activity of the reservoir. Observed areal precipitation, temperature and reservoir inflows data, have allowed together to calibrate the regressive model for indirect inflow estimation. The following equation has been obtained by optimizing all four parameters via the MS Excel® Solver tool:
The model had the following performances in reproducing the observations: 3.050, 0.195, 15.72, and 0.680. In particular, with reference to the value of the Nash Sutcliffe efficiency E, these performances can be deemed satisfactory for the purpose of this work, and in line with previous studies [42,43,52].
4. Results
4.1. Impact of Climate Change on Hydrological Variables
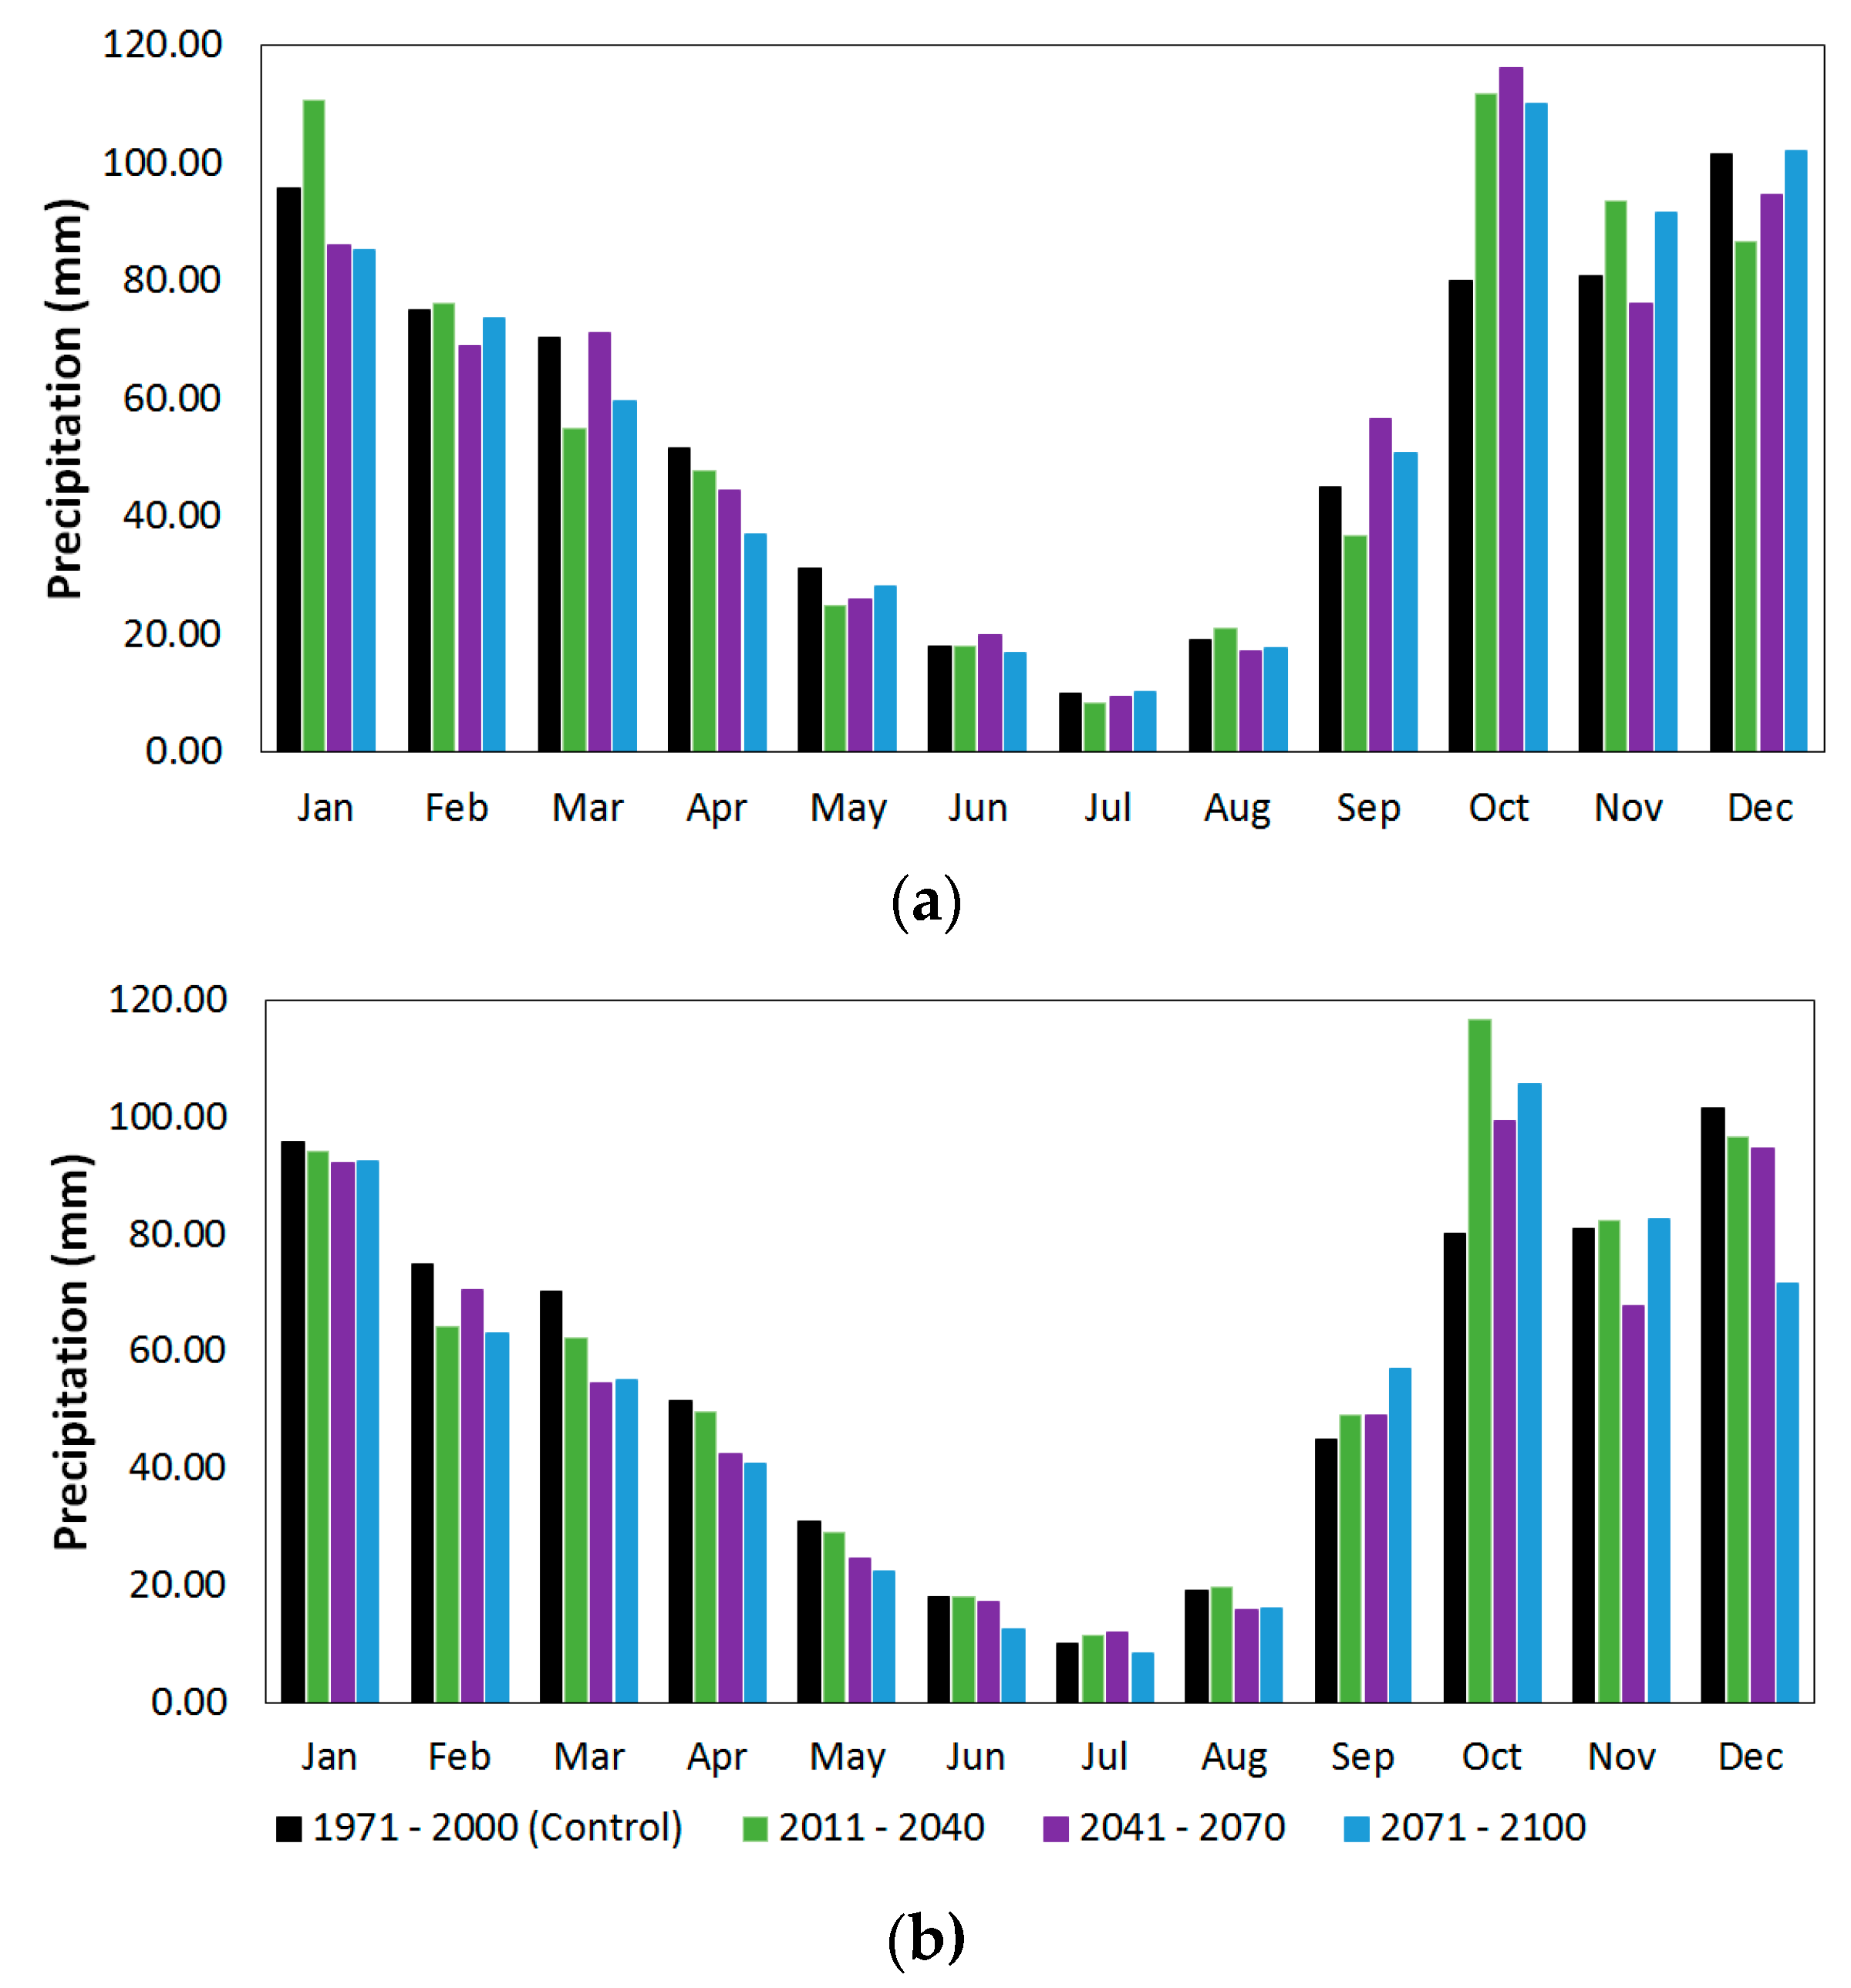
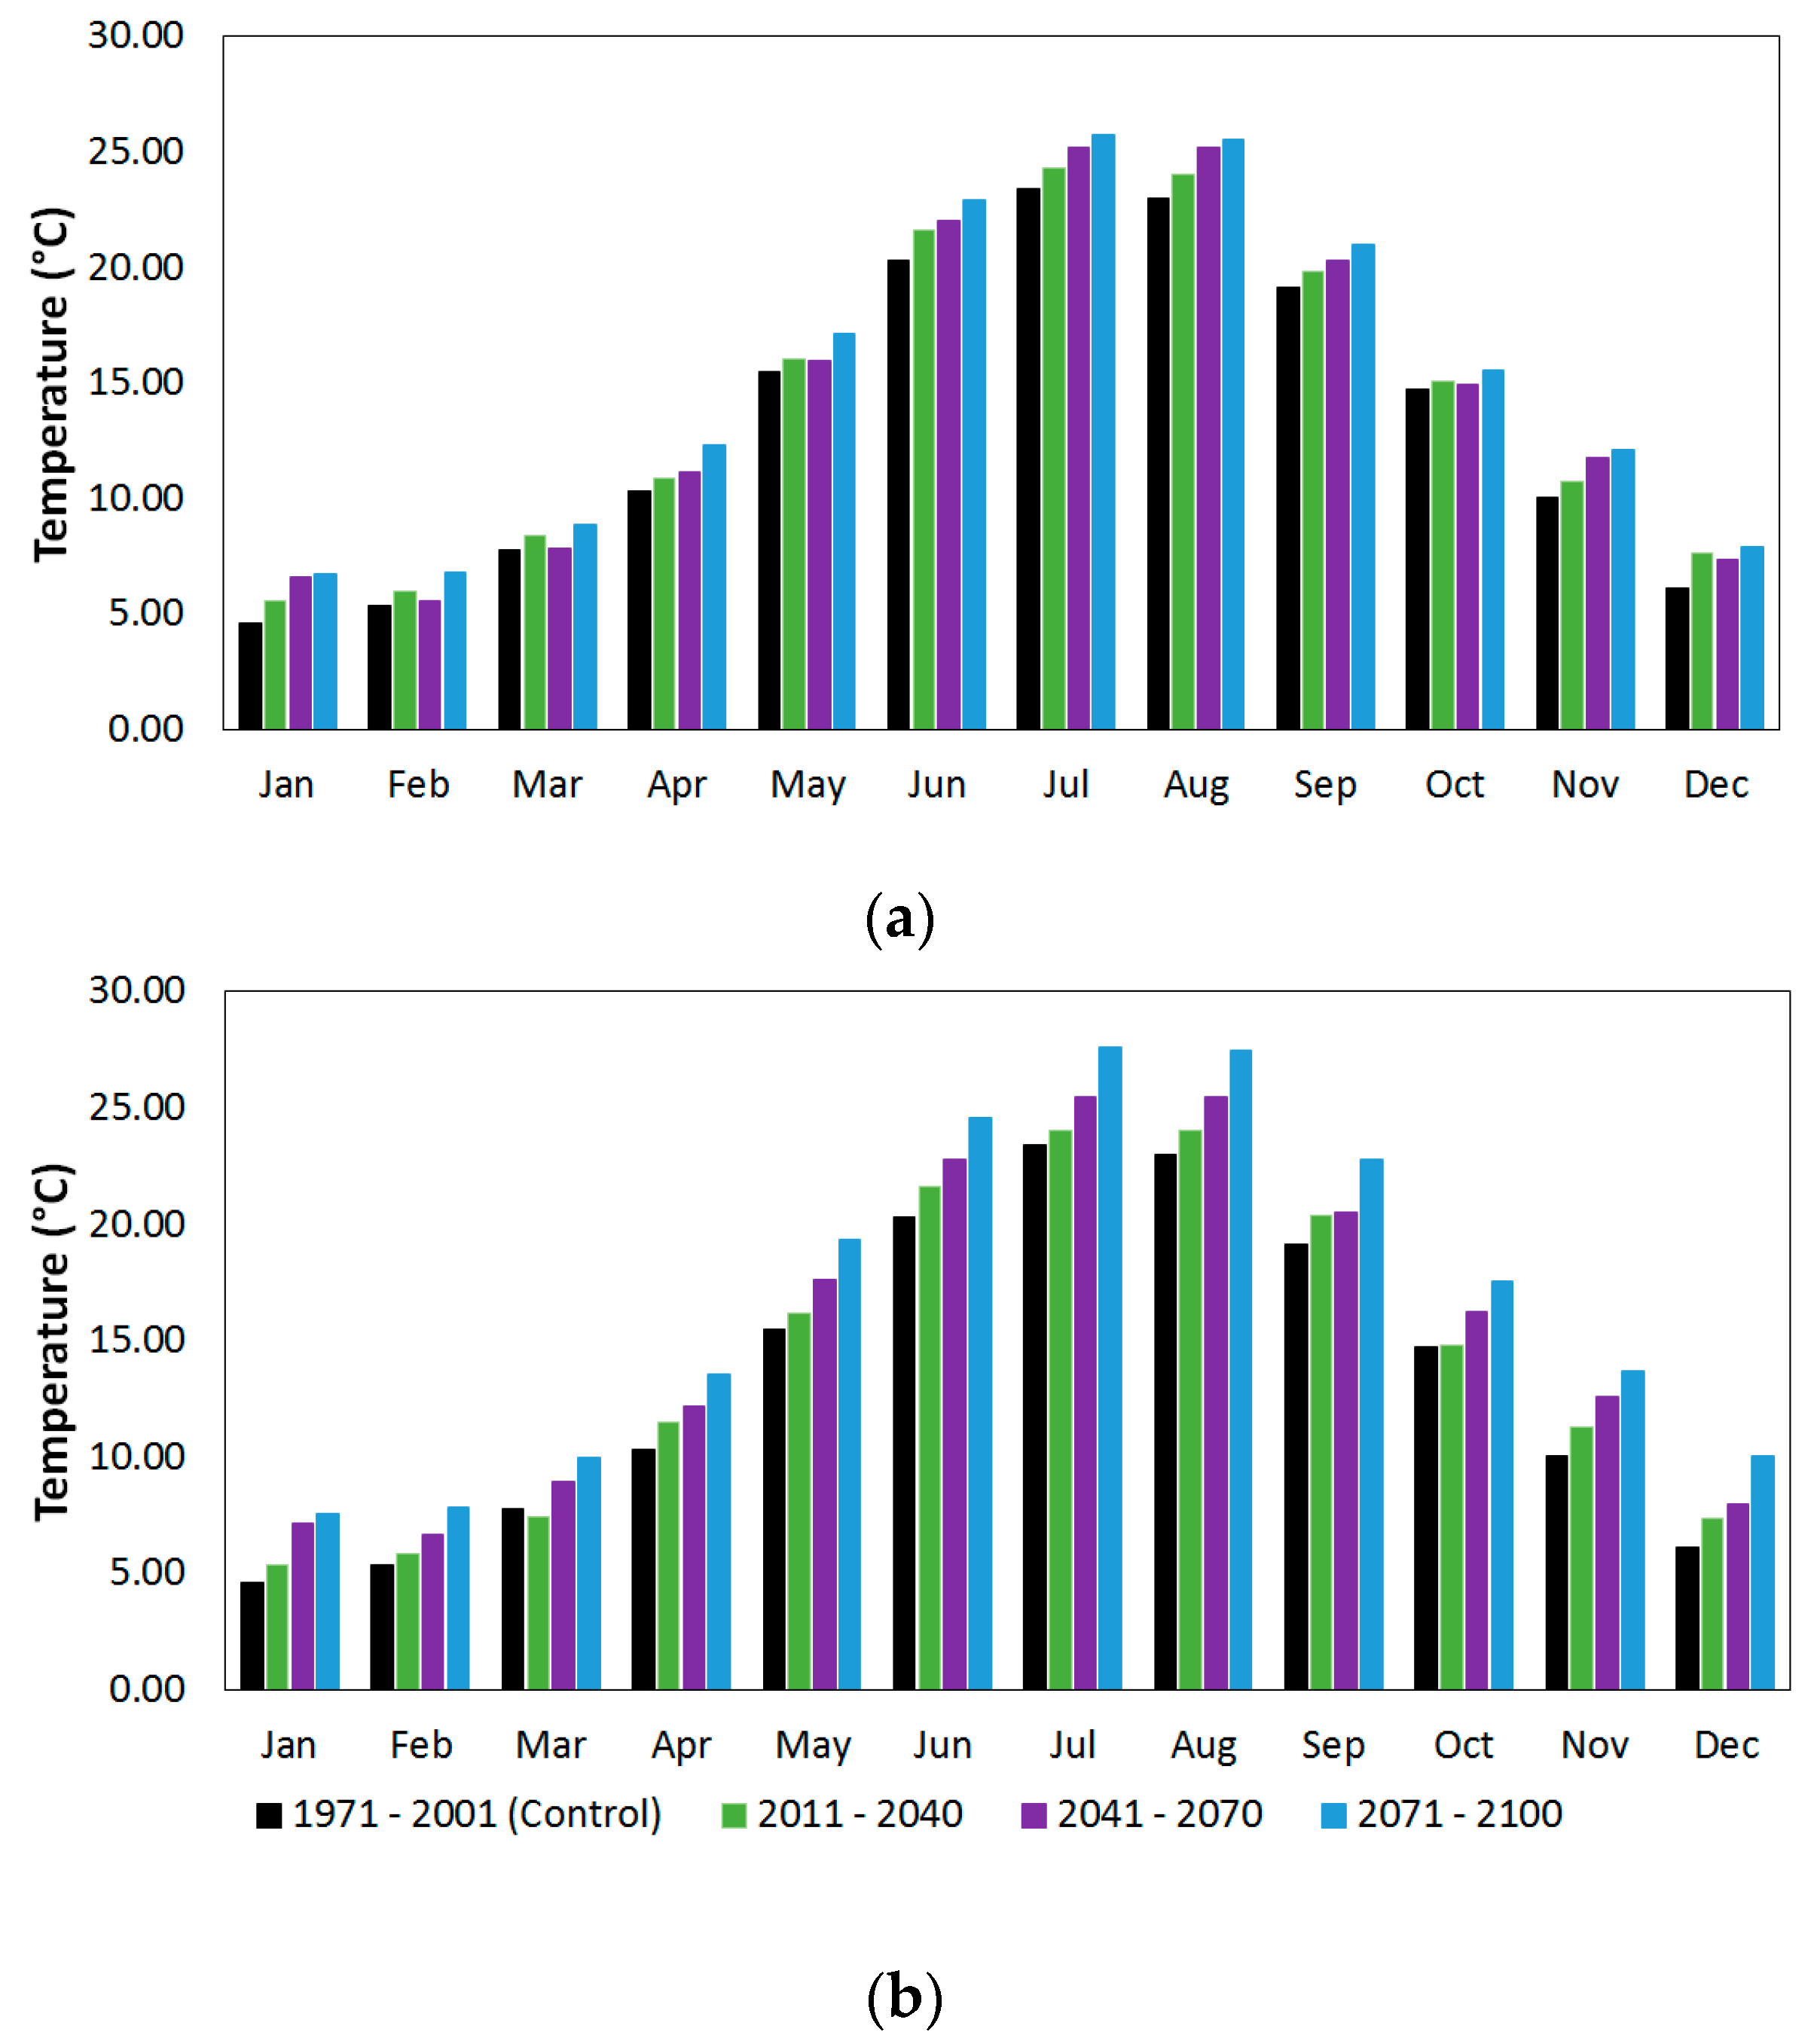
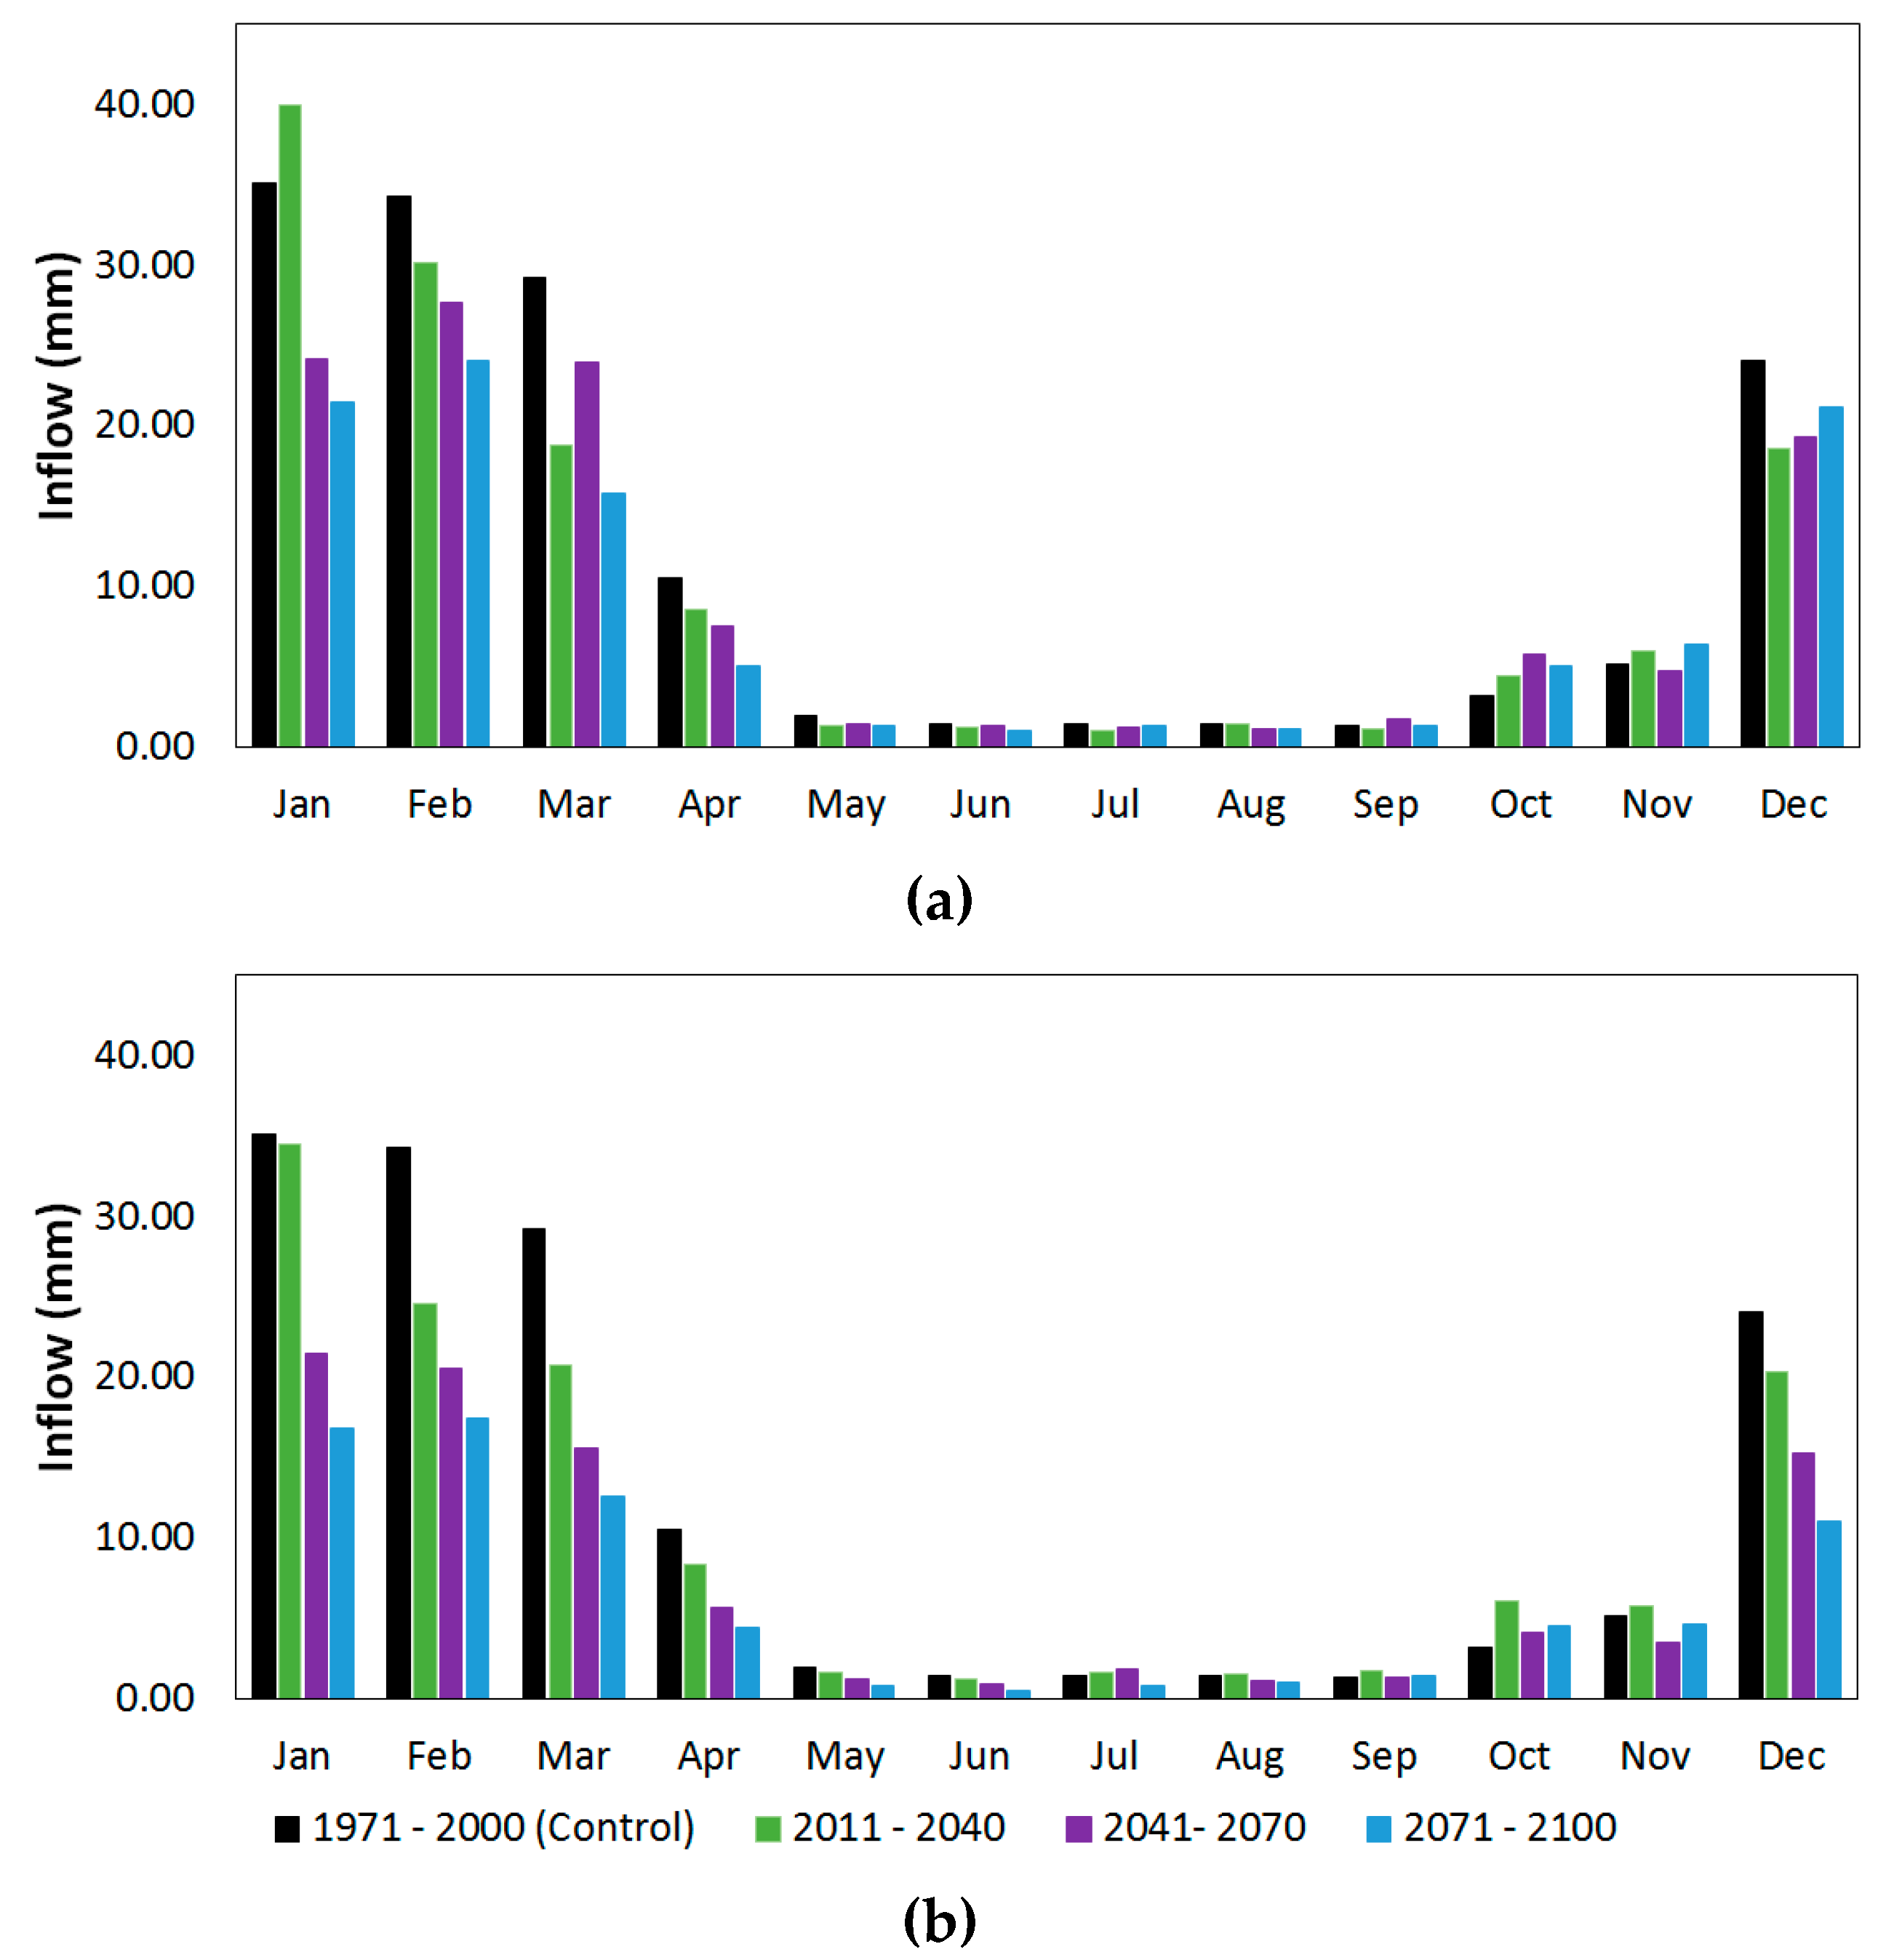
Monthly precipitation of the selected RCM data have been corrected for their bias, and a comparison of the current and future data for both scenarios is presented in Figure 4. Specifically, three 30-year future periods have been considered, namely 2011–2040, 2041–2070, and 2071–2100. Mean annual precipitation in scenario RCP4.5 increases in all three future periods, though the increase is less significant moving forward in time: 691.9 mm for 2011–2040, 687.6 mm for 2041–2070, and 684.0 mm for 2071–2100, against 679.5 mm in the control period. For RCP 8.5, precipitation decreases to 694.7, 641.7 and 629.4 mm, respectively, for the three subsequent future periods. However, at the monthly scale it can be seen that in certain months precipitation is expected to increase in both RCPs. This is the case of October and some future periods of November and September. On the other hand, precipitation in spring months tends to decrease for both RCPs. Predictions of temperature appear more consistent, since an increase in both scenarios is observed for all months and for all future periods, with a positive trend (Figure 5).
Such changes in temperature clearly have impacts on river streamflow (Figure 6). In particular, an increase of temperature causes higher evapotranspiration and thus a decrease of streamflow, as correctly reflected by the negative exponent of the empirical model of Equation (22). On the other hand, a decrease of precipitation causes a decrease of baseflow and surface runoff, which yields a decrease in streamflows (positive exponent of precipitation in Equation (22)). Given the expected future decrease in precipitation and increase in temperature for scenario RCP8.5, a marked streamflow decrease is to be expected (Figure 6b). For scenario RCP4.5 (Figure 6a), annual runoff decreases for all future periods as well, although for the near future 2011–2040, in some months (e.g., January) the effect of increasing precipitation seems to prevail on the increase of temperature. Nevertheless, this is not the case for the remainder of the months, so it can be concluded that for RCP4.5 a decrease in runoff is expected for all future periods.
4.2. Impacts of Climate Change on Reservoir Performance
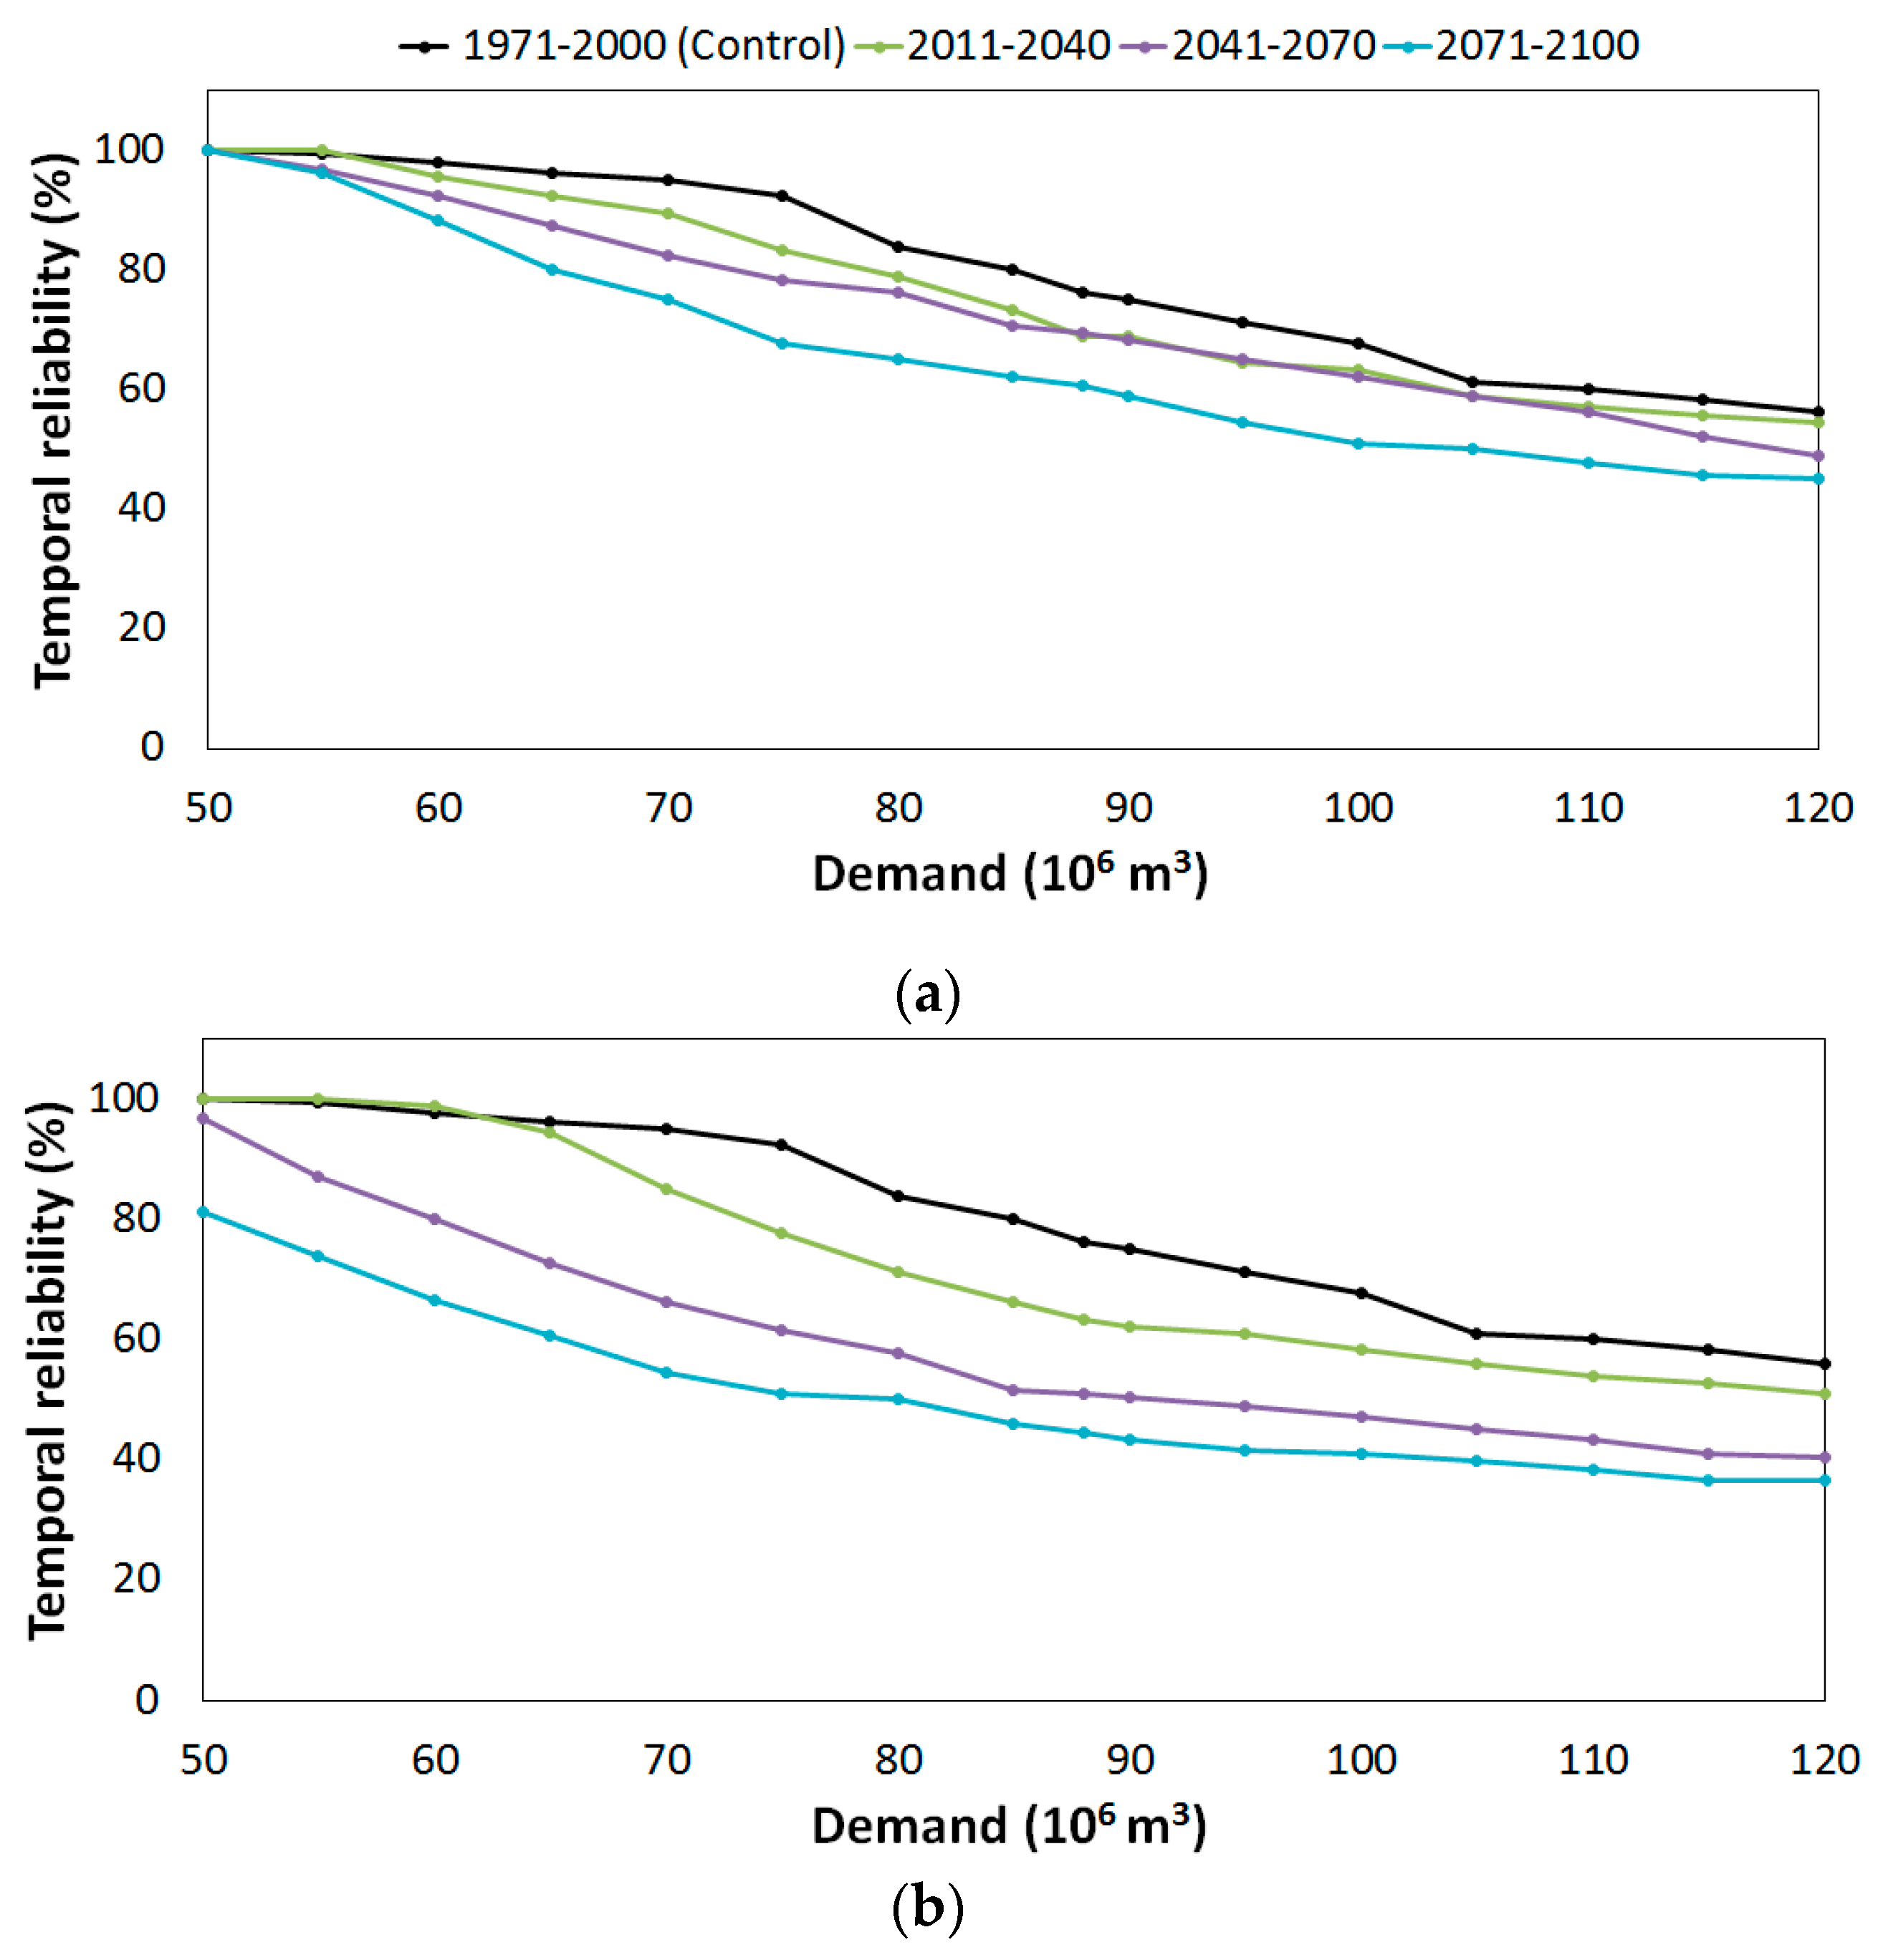
Once all the data for application of Equations (14)–(17) have been obtained, the Pozzillo reservoir has been simulated for all the periods of interest and for both RCP4.5 and 8.5 scenarios. Figure 7 shows the impacts of climate change on reservoir temporal reliability. In particular, temporal reliability is plotted against total annual demand, always assumed with the same monthly distribution as in Table 1. From the Figure, a significant future decrease of temporal reliability can be inferred, which becomes more so moving forward in time. As expected, the RCP8.5 produces much more severe impacts than scenario RCP4.5. As shown in Table 2, under the optimistic hypothesis that total irrigation demand remains unchanged respect to the control period, temporal reliability decreases down to 60.6% (−20.4% variation respect to control period) and 44.4% (−41.6% variation), respectively for RCP4.5 and 8.5. Conversely, if in the future the same performances of the control period want to be attained, a reduction in demand down to 68.9 hm3 and 53.5 hm3, will be necessary, respectively for RCP4.5 and 8.5.
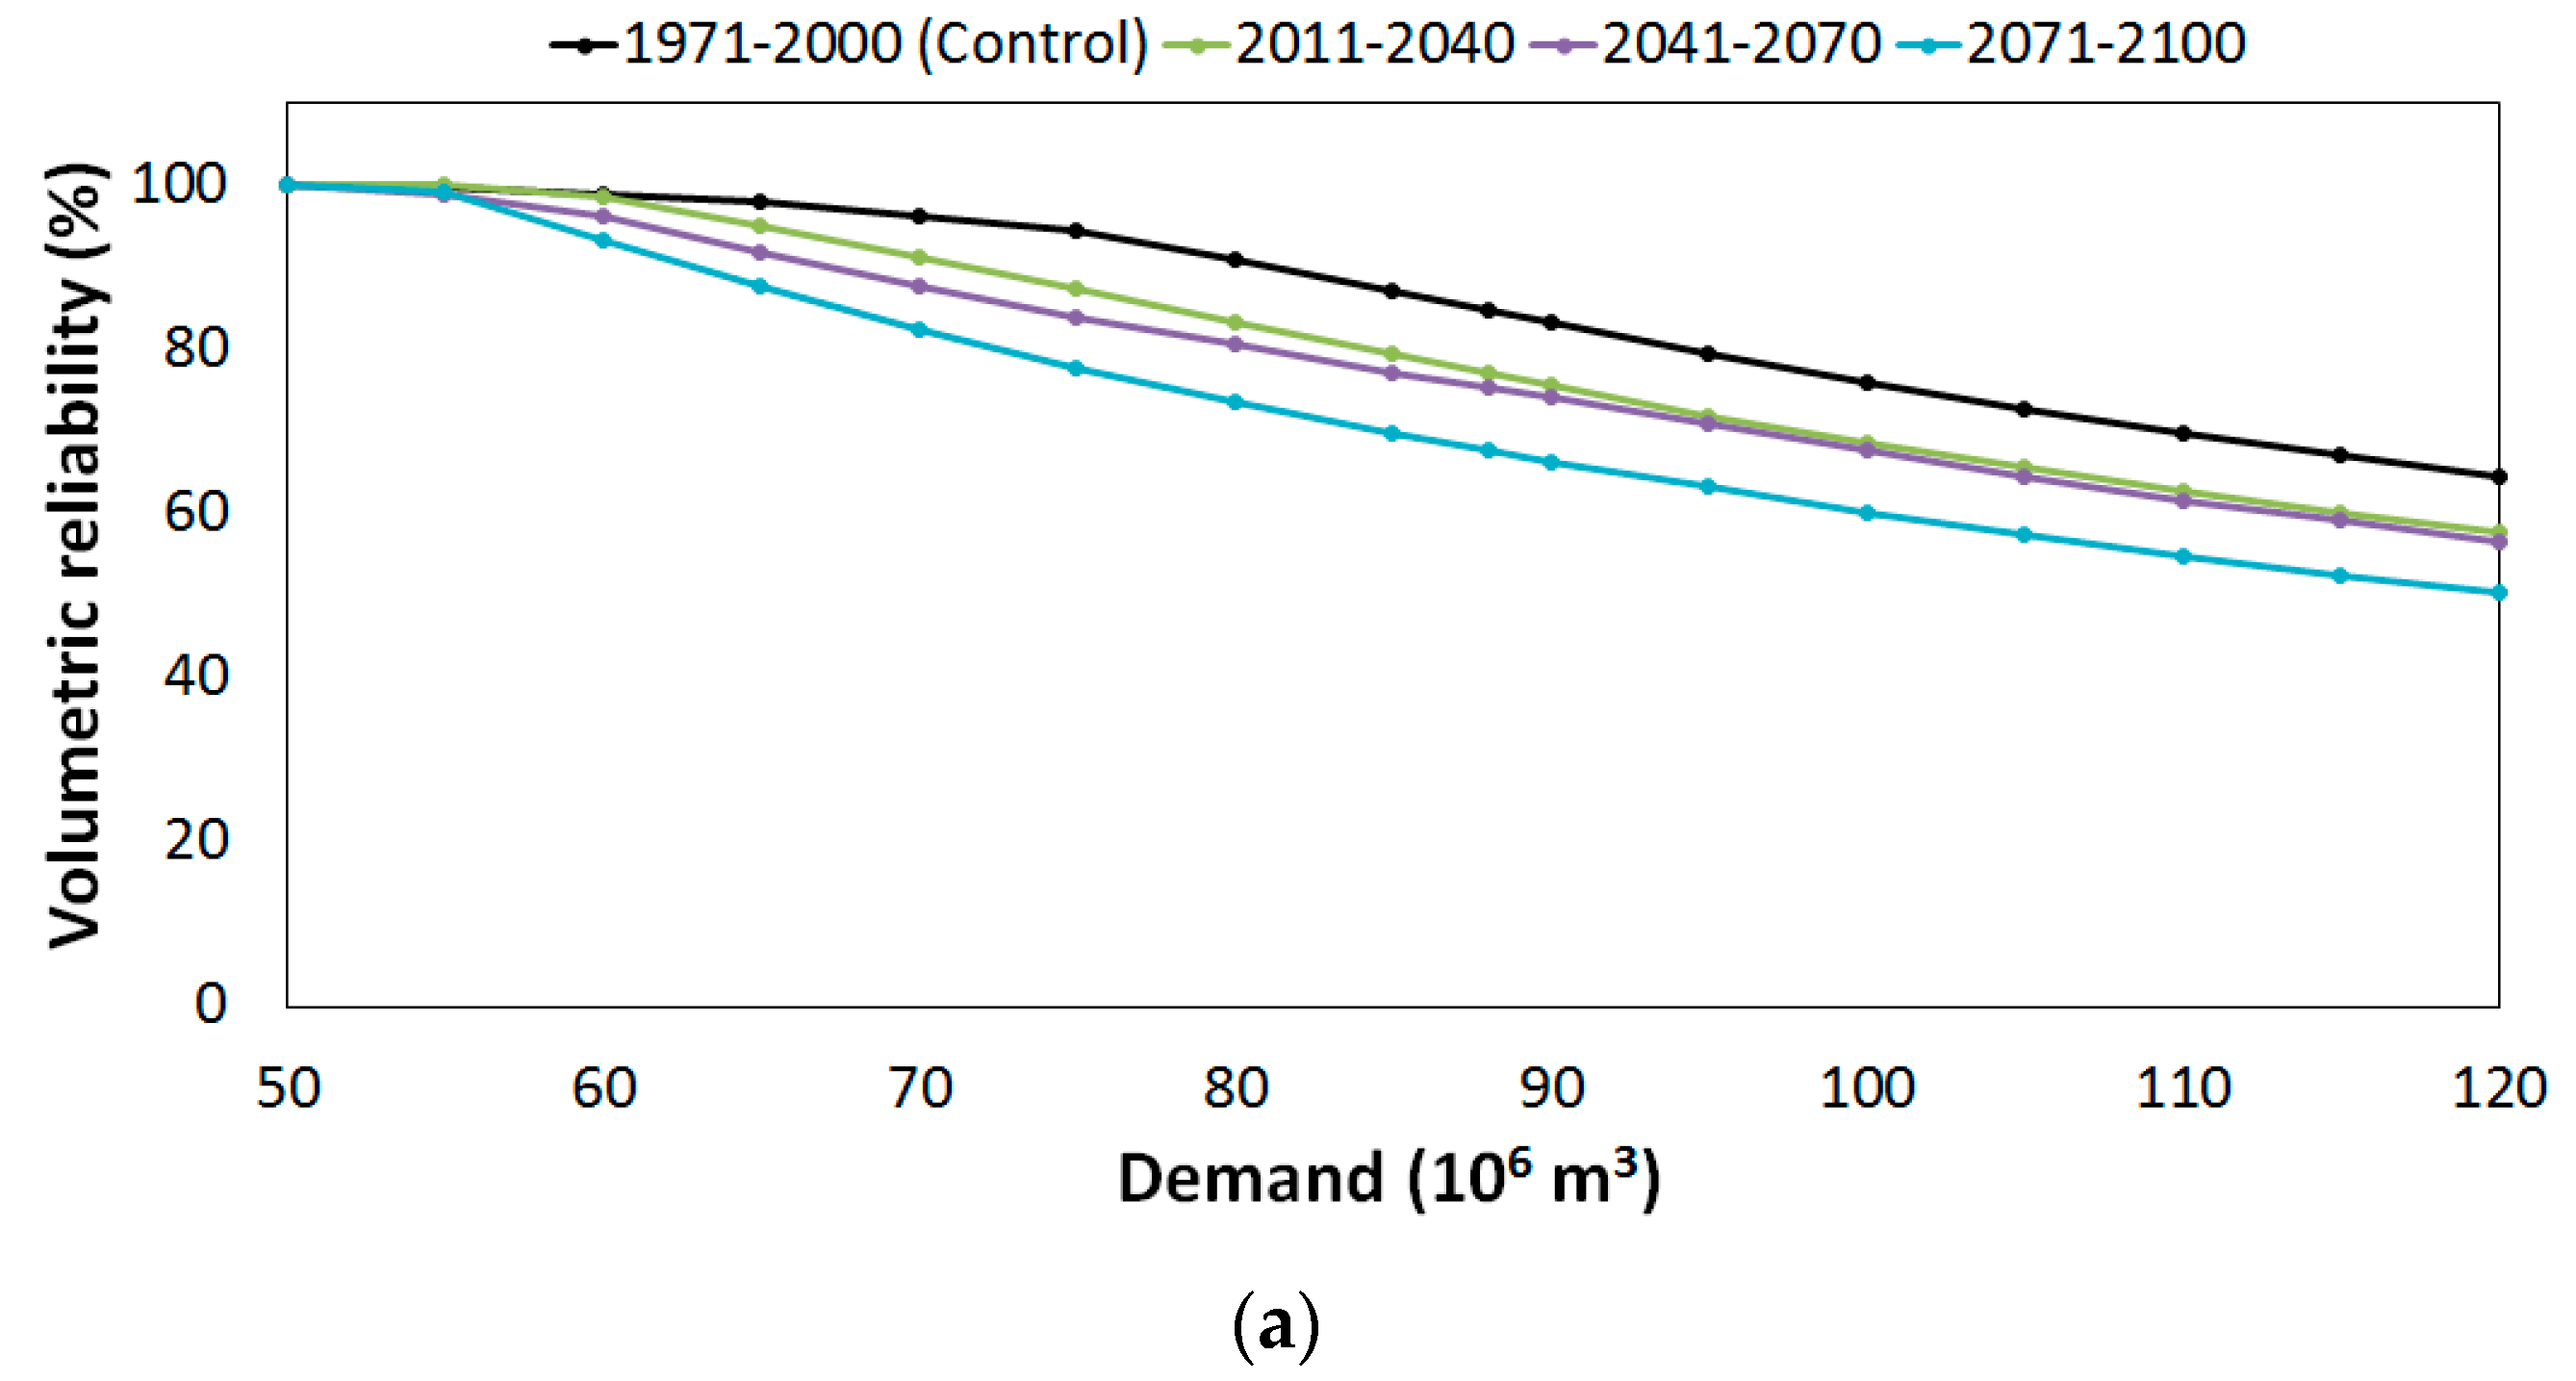
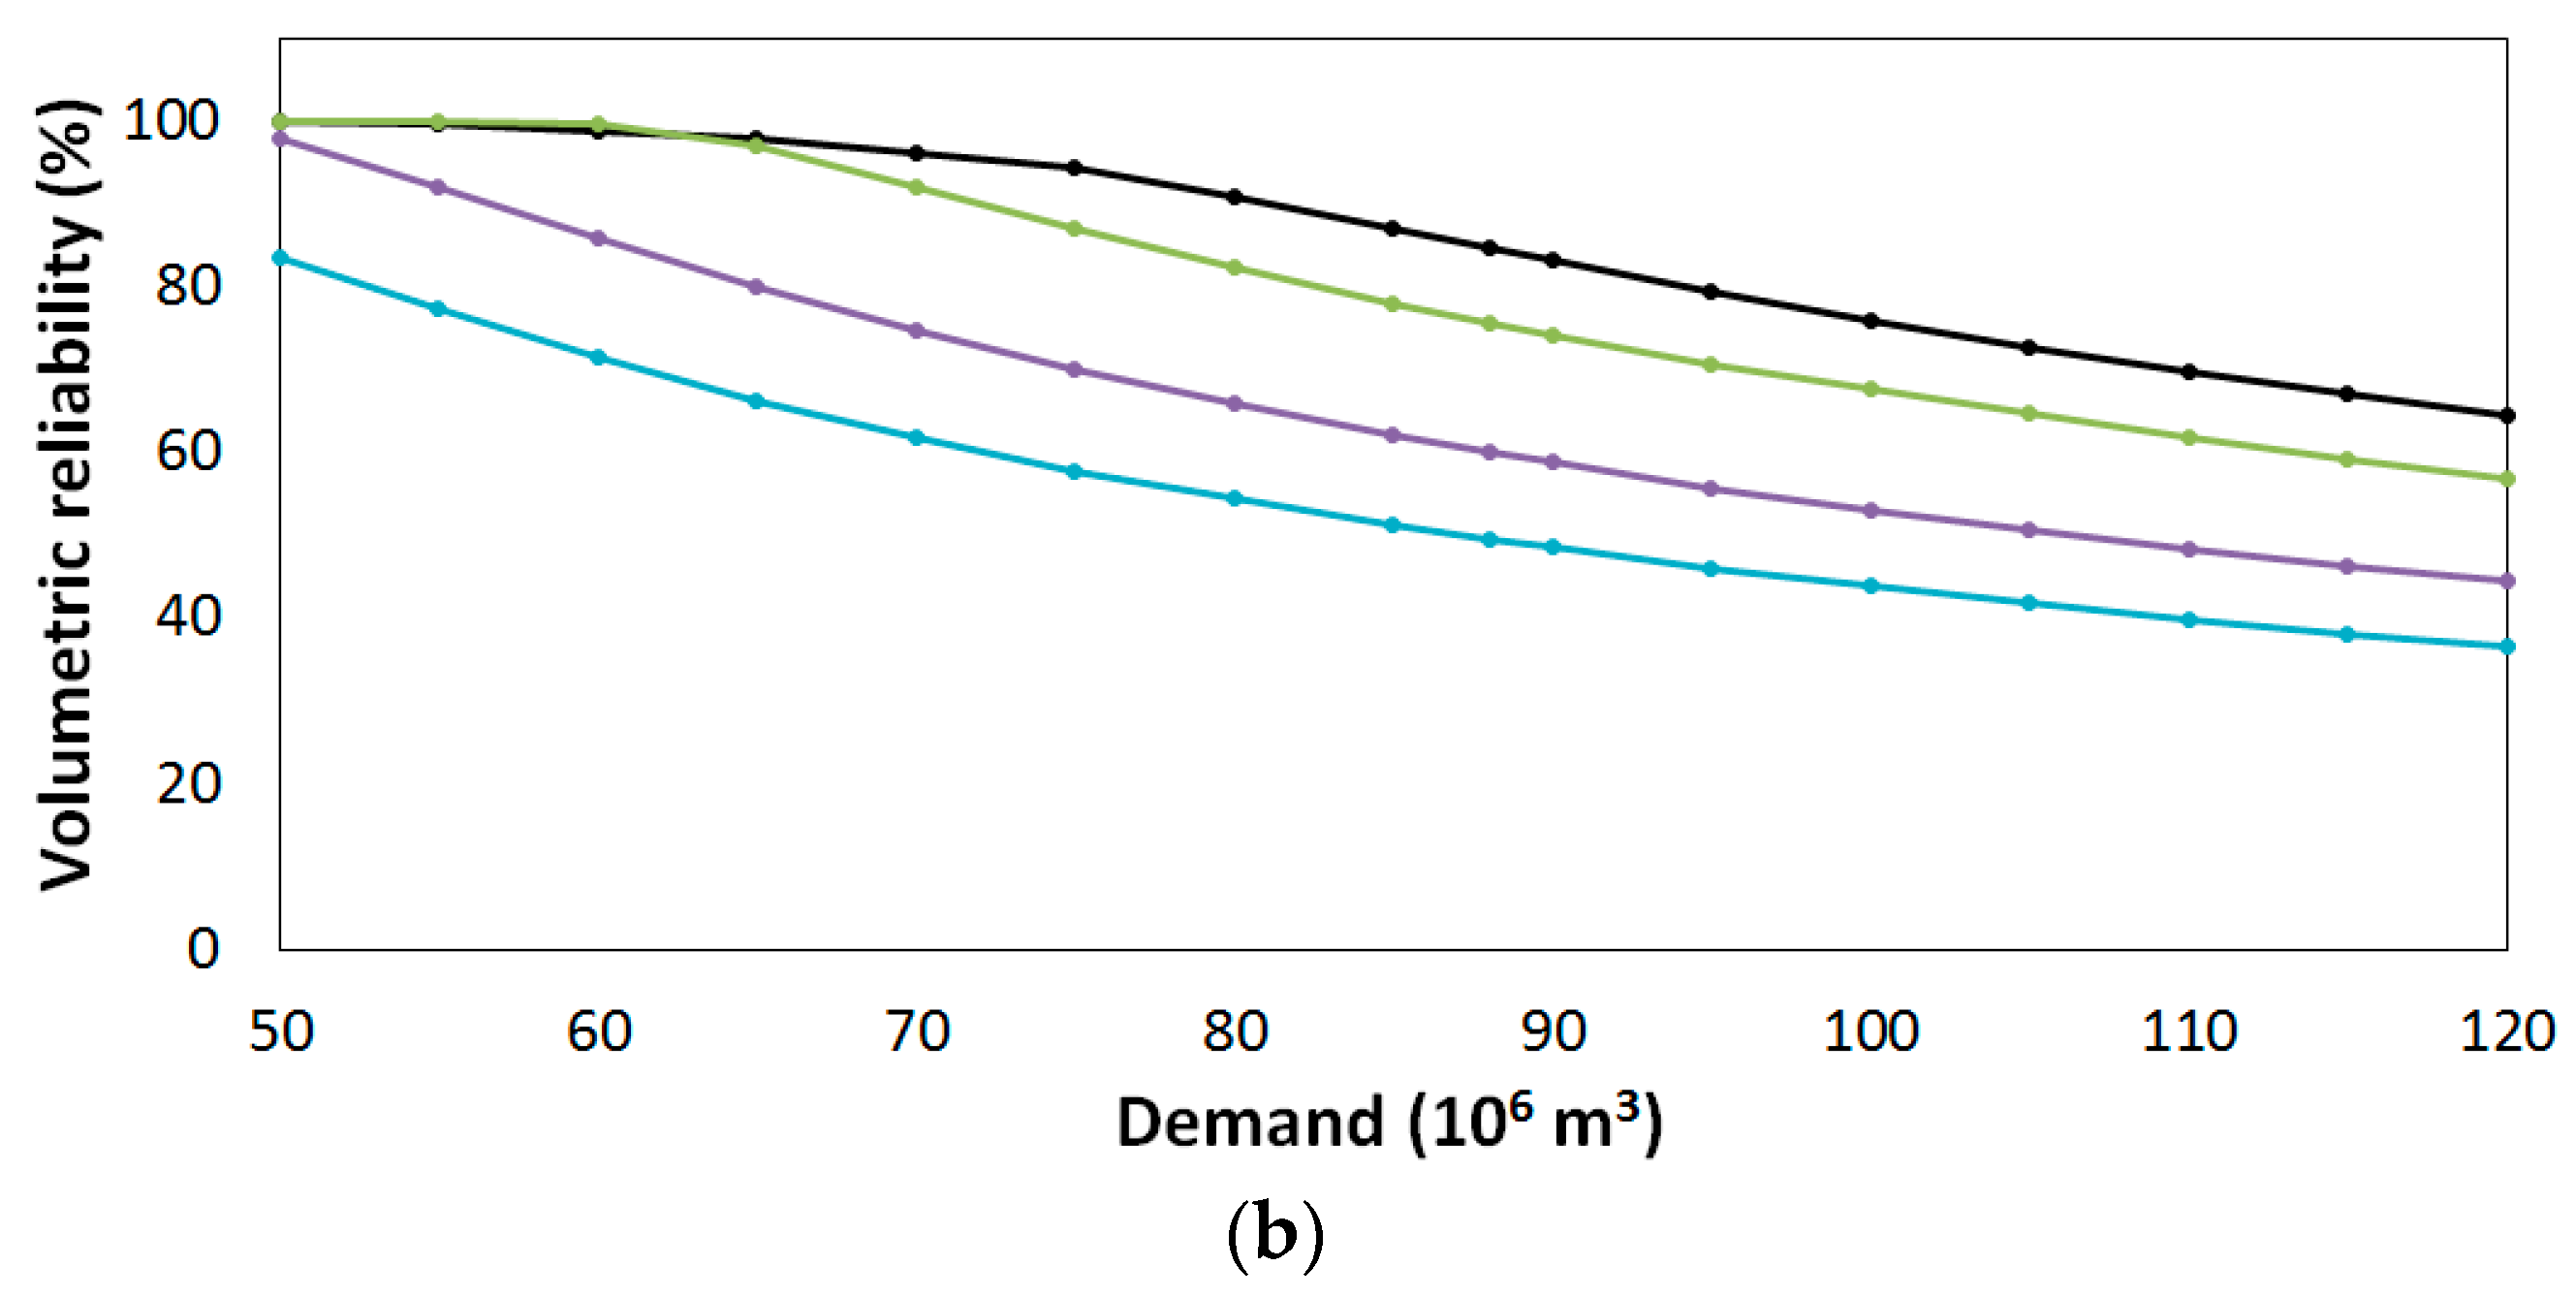
The impacts of climate change on volumetric reliability are shown in Figure 8. Plots confirm a general decreasing pattern in the future as in the case of temporal reliability, although decreases are less marked. This is reasonably due to the fact that temporal availability is a measure of deficit occurrence regardless of their entity. With reference to current demand (88 hm3), the reduction in reliability is down to 67.6 % (−20.3% variation) and 49.6% (−41.5%) for RCP4.5 and 8.5 respectively. On the other hand, the demand should reduce down to 67.8 hm3 (−23.0%) and 49.2 hm3 (−44.1%) for the two scenarios to maintain the same volumetric reliability as in the control period.
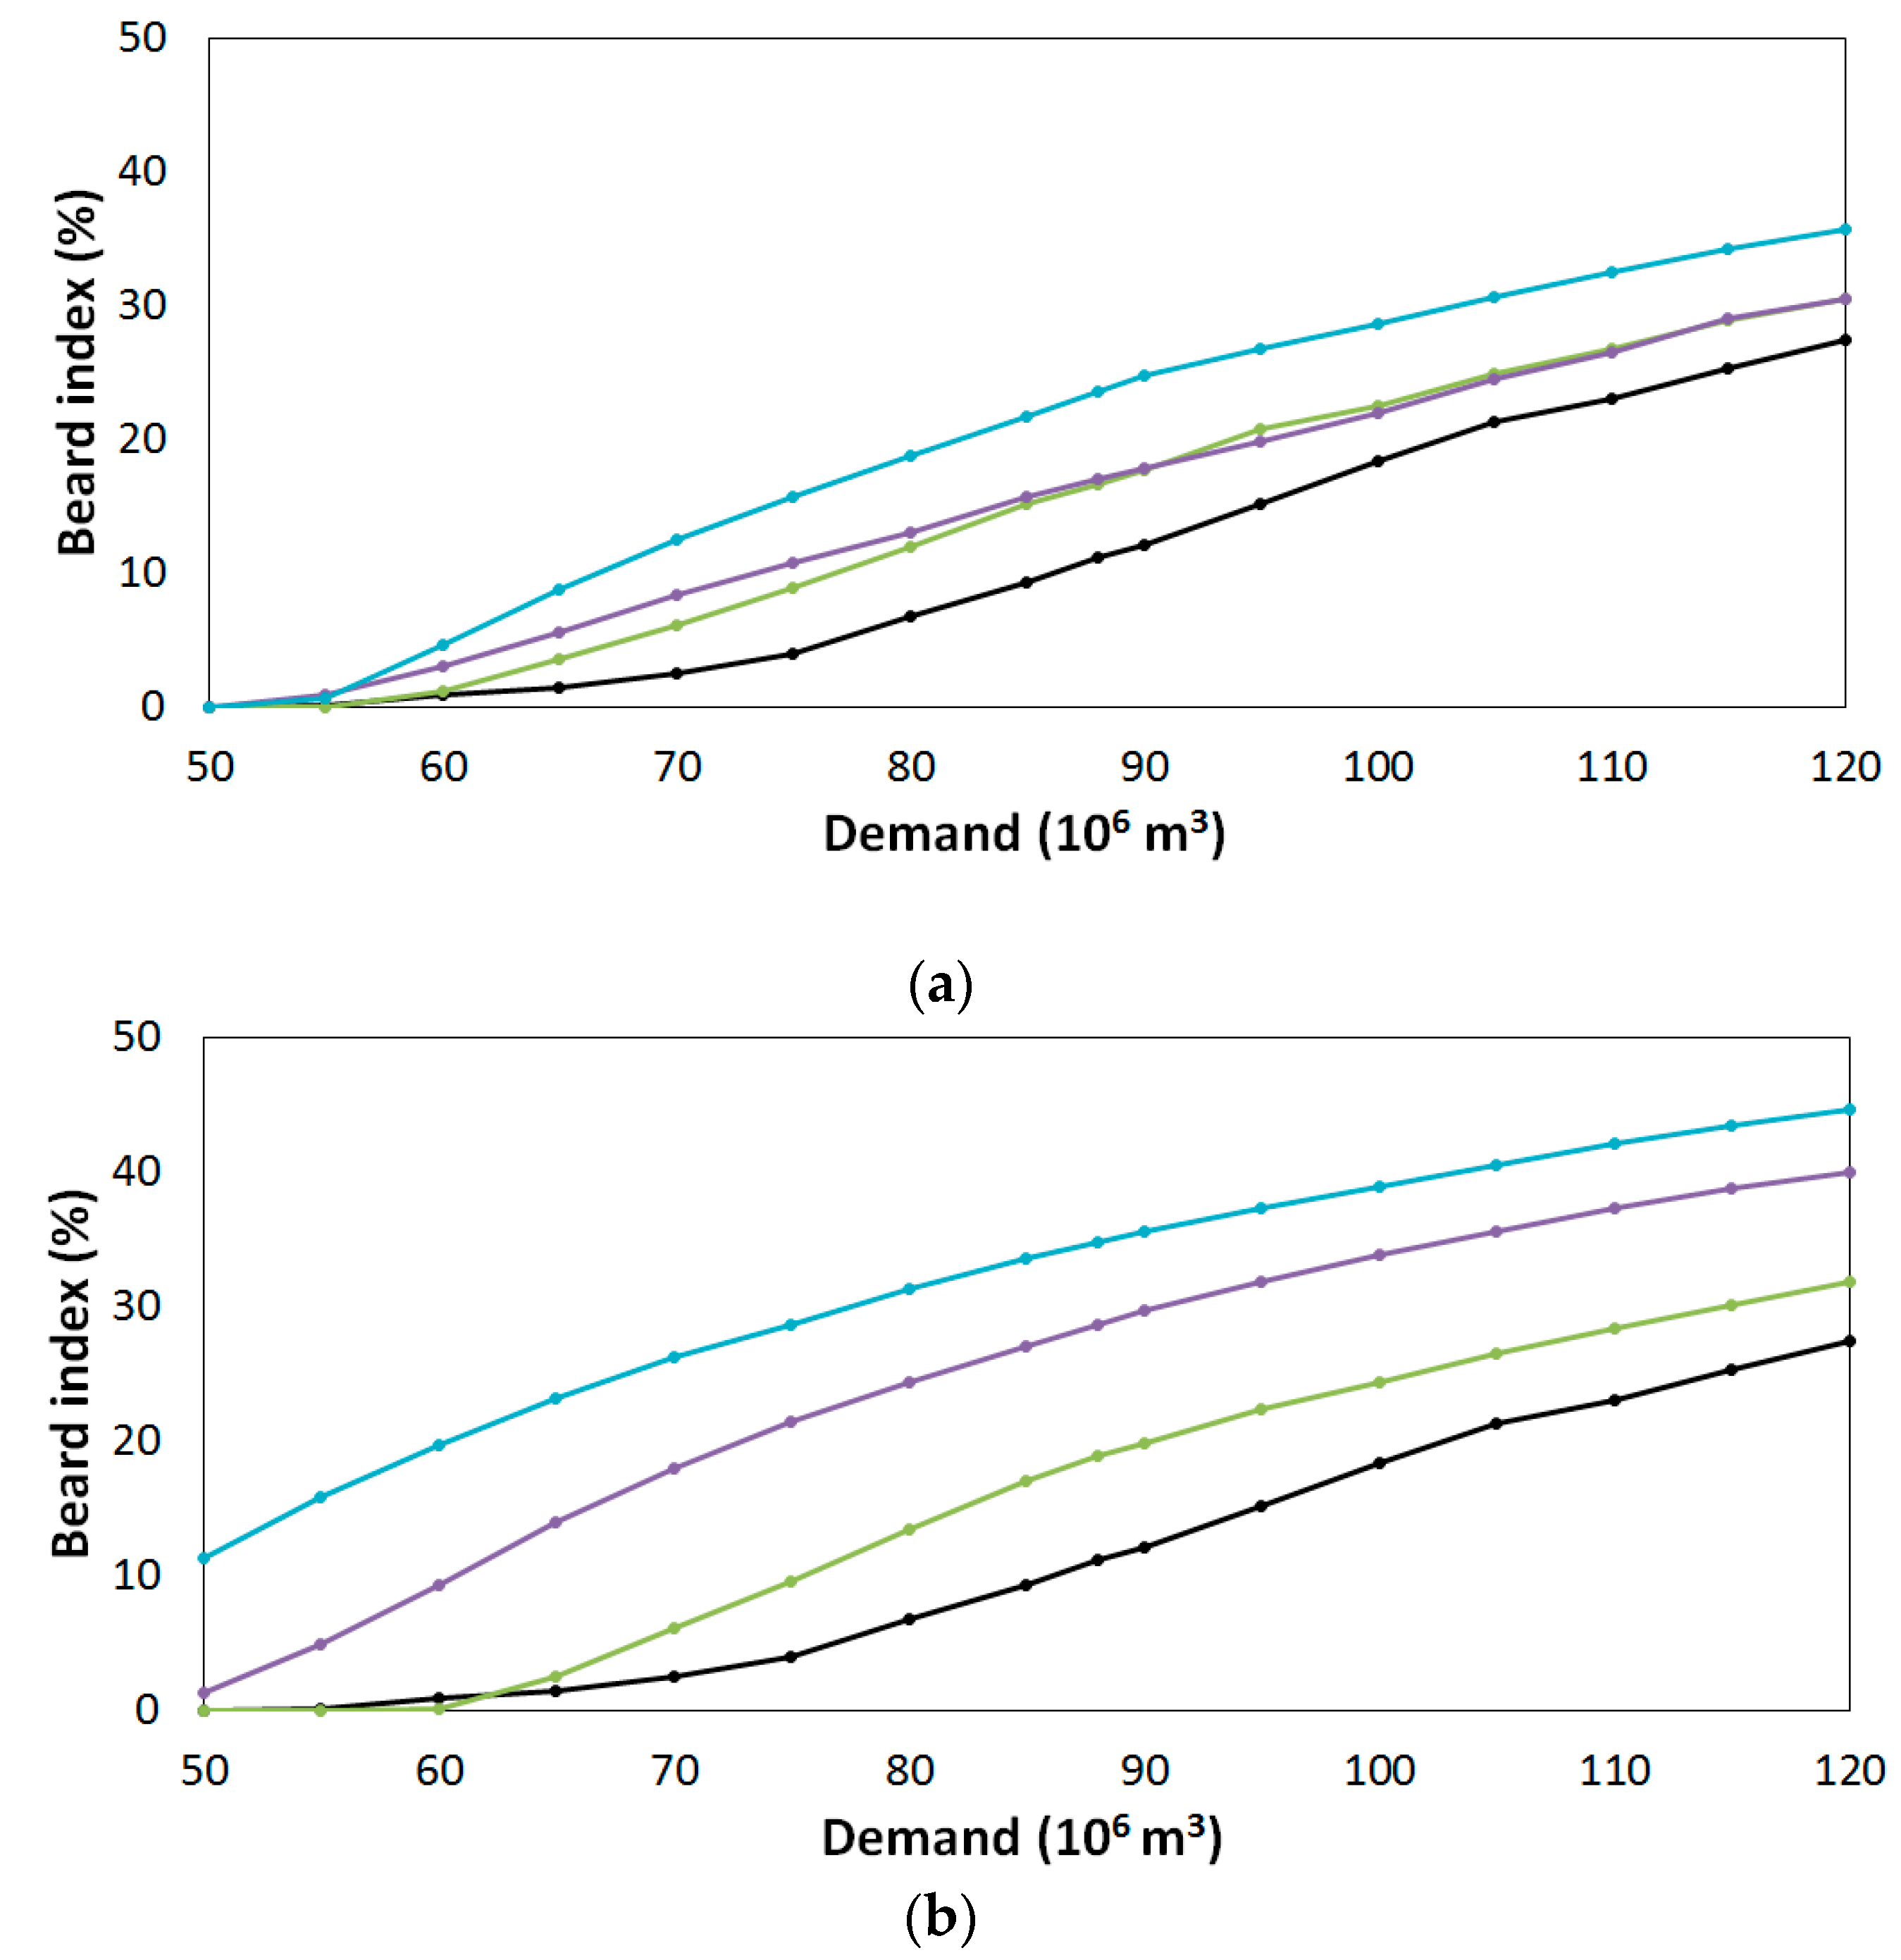
In Figure 9 similar plots are shown with reference to vulnerability. From the plots significant increases of vulnerability can inferred, which indicates that climate change is expected to severely aggravate impacts of deficits. With reference to RCP4.5 scenario, the vulnerability curves show limited change between periods 2011–2040 and 2041–2070. On the other hand, as expected, for RCP8.5 the increase of vulnerability is very high with reference to the same periods.
Under the hypothesis that the demand remains stable in the future and equal to 88 hm3, vulnerability increases from 11.2% to 18.9% (+69.1%), 28.7% (+155.8), 34.8% (+211.0%), respectively for the subsequent three future periods. In order to maintain the future the same vulnerability of the control period, demand should decrease up to 68.2 hm3 (−22.4%) for RCP4.5 and to 50.0 hm3 (−43.2%) for RCP8.5.
The above results have been synthesized in Table 2 and Table 3. In particular, Table 2 shows the reduction of performances for a demand that does not change in the future, in both RCPs and for any period. Table 3 reports the demand level needed in the future to have performances unchanged respect to historical values of each index.
As can be seen from Table 2, the Beard vulnerability index has the highest variations of performances, for both RCP4.5 and RCP8.5. However, these do not correspond to the highest demand reductions needs, which are instead associated to volumetric vulnerability, except for period 2011–2040 in RCP4.5 where temporal vulnerability is more restrictive in this sense (Table 3).
5. Discussion
The presented results clearly indicate that negative impacts of climate change on the performance of the Pozzillo reservoir are expected in the future. To the knowledge of the authors, this study is the first that analyses the potential impacts of climate change on reservoir performances in Sicily, and one of the few in Italy, even though National and European water policy has dealt with the topic in the last years. Although the National Adaptation Plan to Climate Change [53] addresses concerns about possible increase of water scarcity and droughts in Italy, yet it lacks of analysis of future impacts of climate change within the Adaptation Plan. Though this is therein ascribed to the large level of uncertainty of climate model simulations, it should be pointed out that such uncertainty can be partly circumvented by checking RCM accuracy in reproducing current climate and by applying bias correction. In this study, we have capitalized on a previous study to select the best RCM among other fourteen of the EURO-CORDEX initiative, based on the accuracy of reproduction of observed statistics. The selected model has been then processed with bias correction, which improved significantly the reliability of the data. Thus, the selection and subsequent bias correction enables to reduce drastically RCM data uncertainty.
Among the limitations of our study is that irrigation demands may increase with the increase of temperatures, due to increased evapotranspiration. This aspect is not taken into account in our model, but this means that climate change impacts may be also worse than those predicted by the present research. Also, the simple hydrological model we use neglects some climate change feedbacks which may change the calibrated parameters; for instance vegetation feedbacks may have a role [54,55], these feedbacks are however difficult to predict, considering also that for the case study area the needed data is scarcely available. However, our approach is robust respect to these feedbacks, as the impacts of a given demand change are easily readable from the demand-performance curves presented in the previous section.
In this study we found a decrease of runoff and thus of reservoir operational performance. This is not always the case in non-Mediterranean areas: for instance [56] found, by applying an approach based on the combination of GCMs and a reservoir simulation model to a case study in Tennessee (USA), that runoff will increase inducing better operational performances. In another study regarding the Hirakud reservoir on the Mahanadi river in Orissa, India, where also multiple purposes of the reservoir have been taken into account as well as GCM uncertainty by the use of projections from several different models, a decrease of operational performance has been found [25]. This has been found also for the Colorado River basin [19]. In another study [22], performance were assessed taking also into account the variation of crop water needs induced by temperature increase due to climate change. Results for this study showed that the reliability index decreased (4%) while vulnerability and resiliency indexes increased by 38% and 4%, respectively; however, the decrease in performances could be nulled by optimizing the reservoir operating rule.
Though this study analyses only a part of a complex water supply system, it reveals a quite urgent need to implement climate change adaptation measures. As discussed by Rossi [57], three types of measures can be implemented to decrease the vulnerability of water supply systems to droughts, which can be transferred also to adapt to climate change: reduction of the demand, increase of water resources and measures to reduce socio-economic and environmental impacts of climate change. Regarding the reduction of demand, it should be acknowledged that technological innovations are currently ongoing in agriculture the Simeto river valley, which may bring to higher irrigation efficiency. For instance, some farms are starting to install smart systems to improve irrigation efficiency, based on real time soil moisture measurements and also the use of UAVs for monitoring crop water stress. Increase of water resources is quite difficult to achieve in arid areas as Sicily. New resources are quite scarce, and one of the few possibilities to increase water supply system resilience is to build infrastructures that allow inter-basin and within-basin water transfers. A comprehensive analysis of adaptation strategies, which is however beyond the scope of the present work, should benefit from the application Multi-Criteria Analysis and Robust Decision Approaches [58].
6. Conclusions
In this research we have analyzed how climate change induced by greenhouse gas emissions may affect the performance of reservoirs in semi-arid Mediterranean areas, with a specific application to the Pozzillo reservoir in Sicily. Results show that precipitation is expected to slightly increase annually for the RCP4.5 (intermediate emission scenario), and to significantly decrease for RCP8.5 (high emission scenario), while temperature increases in both scenarios, with a clear positive trend, and at a higher rate for RCP8.5. For both scenarios, these changes in the meteorological variables cause a decrease of reservoir inflows, which is more pronounced again for RCP8.5. The impacts of climate change on reservoir inflows also increase moving toward 2100, and so are the impacts on reservoir performance. If one desires no reduction of performances of the Pozzillo reservoir (i.e., equal to those in the control period 1971–2001), then the demand should decrease significantly: down to −23.0% for RCP4.5 and to −44.1% for RCP8.5. These results indicate that measures for climate change adaptation should be implemented soon, in order to avoid socio-economic impacts. Further research may focus on analyzing more explicitly the impacts of climate modeling uncertainty on the results of the present study, for instance, by presenting the range of performance curves obtained using all the CORDEX models available.
Author Contributions
Conceptualization, D.J.P. and A.C.; Formal analysis, D.J.P. and R.M.; Funding acquisition, A.C.; Investigation, D.J.P., R.M. and A.C.; Methodology, D.J.P. and A.C.; Project administration, A.C.; Resources, A.C.; Supervision, D.J.P. and A.C.; Visualization, D.J.P. and R.M.; Writing—original draft, D.J.P.; Writing—review and editing, D.J.P. and A.C.
Funding
This research was partially funded by the European Union for the LIFE 17 CCA/IT/000115 SimetoRES project and by University of Catania, Department of Civil Engineering and Architecture, for the PANTA REI research project. D.J.P. conducted this research within the post-doctoral research program “Studio dei processi idrologici relativi a frane superficiali in un contesto di cambiamenti climatici” funded by University of Catania.
Acknowledgments
The authors will like to thank the five referees that helped to improve the paper with their comments.
Conflicts of Interest
The authors declare no conflict of interest.
References
- Field, C.B.; Barros, V.R.; Dokken, D.J.; Mach, K.J.; Mastrandrea, M.D.; Bilir, T.E.; Chatterjee, M.; Ebi, K.L.; Estrada, Y.O.; Genova, R.C.; et al. Climate Change 2014 Impacts, Adaptation and Vulnerability: Part. A: Global and Sectoral Aspects: Working Group II Contribution to the Fifth Assessment Report of the Intergovernmental Panel on Climate Change; Cambridge University Press: Cambridge, UK, 2014; ISBN 9781107415379. [Google Scholar]
- Quevauviller, P.; Barceló, D.; Beniston, M.; Djordjevic, S.; Harding, R.J.; Iglesias, A.; Ludwig, R.; Navarra, A.; Navarro Ortega, A.; Mark, O.; et al. Integration of research advances in modelling and monitoring in support of WFD river basin management planning in the context of climate change. Sci. Total Environ. 2012, 440, 167–177. [Google Scholar] [CrossRef] [PubMed]
- Garrote, L. Managing Water Resources to Adapt to Climate Change: Facing Uncertainty and Scarcity in a Changing Context. Water Resour. Manag. 2017, 31, 2951–2963. [Google Scholar] [CrossRef]
- Iglesias, A.; Garrote, L.; Flores, F.; Moneo, M. Challenges to Manage the Risk of Water Scarcity and Climate Change in the Mediterranean. Water Resour. Manag. 2007, 21, 775–788. [Google Scholar] [CrossRef]
- Bird, D.N.; Benabdallah, S.; Gouda, N.; Hummel, F.; Koeberl, J.; La Jeunesse, I.; Meyer, S.; Prettenthaler, F.; Soddu, A.; Woess-Gallasch, S. Modelling climate change impacts on and adaptation strategies for agriculture in Sardinia and Tunisia using AquaCrop and value-at-risk. Sci. Total Environ. 2016, 543, 1019–1027. [Google Scholar] [CrossRef]
- Olmstead, S.M. Climate change adaptation and water resource management: A review of the literature. Energy Econ. 2014, 46, 500–509. [Google Scholar] [CrossRef]
- Pahl-Wostl, C. Transitions towards adaptive management of water facing climate and global change. Water Resour. Manag. 2007, 21, 49–62. [Google Scholar] [CrossRef]
- Arnell, N.W.; Delaney, E.K. Adapting to climate change: Public water supply in England and Wales. Clim. Chang. 2006, 78, 227–255. [Google Scholar] [CrossRef]
- Tanaka, S.K.; Zhu, T.; Lund, J.R.; Howitt, R.E.; Jenkins, M.W.; Pulido, M.A.; Tauber, M.; Ritzema, R.S.; Ferreira, I.C. Climate Warming and Water Management Adaptation for California. Clim. Chang. 2006, 76, 361–387. [Google Scholar] [CrossRef]
- Medellín-Azuara, J.; Harou, J.J.; Olivares, M.A.; Madani, K.; Lund, J.R.; Howitt, R.E.; Tanaka, S.K.; Jenkins, M.W.; Zhu, T. Adaptability and adaptations of California’s water supply system to dry climate warming. Clim. Chang. 2008, 87, 75–90. [Google Scholar] [CrossRef]
- Purkey, D.R.; Huber-Lee, A.; Yates, D.N.; Hanemann, M.; Herrod-Julius, S. Integrating a Climate Change Assessment Tool into Stakeholder-Driven Water Management Decision-Making Processes in California. Water Resour. Manag. 2006, 21, 315–329. [Google Scholar] [CrossRef]
- Herrera-Pantoja, M.; Hiscock, K.M. Projected impacts of climate change on water availability indicators in a semi-arid region of central Mexico. Environ. Sci. Policy 2015, 54, 81–89. [Google Scholar] [CrossRef]
- Seager, R.; Ting, M.; Li, C.; Naik, N.; Cook, B.; Nakamura, J.; Liu, H. Projections of declining surface-water availability for the southwestern United States. Nat. Clim. Chang. 2013, 3, 482–486. [Google Scholar] [CrossRef]
- Dlamini, N.S.; Kamal, M.R.; Soom, M.A.B.M.; Mohd, M.S.F.B.; Abdullah, A.F.B.; Hin, L.S. Modeling Potential Impacts of Climate Change on Streamflow Using Projections of the 5th Assessment Report for the Bernam River Basin, Malaysia. Water 2017, 9, 226. [Google Scholar] [CrossRef]
- Mizyed, N. Impacts of Climate Change on Water Resources Availability and Agricultural Water Demand in the West Bank. Water Resour. Manag. 2009, 23, 2015–2029. [Google Scholar] [CrossRef]
- Kanakoudis, V.; Tsitsifli, S.; Papadopoulou, A.; Cencur Curk, B.; Karleusa, B. Water resources vulnerability assessment in the Adriatic Sea region: The case of Corfu Island. Environ. Sci. Pollut. Res. 2017, 24, 20173–20186. [Google Scholar] [CrossRef]
- Nistor, M.M.; Man, T.C. Water availability variation under climate change in Turkey during 21 St century. Carpathian J. Earth Environ. Sci. 2019, 14, 19–28. [Google Scholar] [CrossRef]
- Rehana, S.; Mujumdar, P.P. Regional impacts of climate change on irrigation water demands. Hydrol. Process. 2013, 27, 2918–2933. [Google Scholar] [CrossRef]
- Christensen, N.S.; Wood, A.W.; Voisin, N.; Lettenmaier, D.P.; Palmer, R.N. The effects of climate change on the hydrology and water resources of the Colorado River basin. Clim. Chang. 2004, 62, 337–363. [Google Scholar] [CrossRef]
- Minville, M.; Brissette, F.; Krau, S.; Leconte, R. Adaptation to Climate Change in the Management of a Canadian Water-Resources System Exploited for Hydropower. Water Resour. Manag. 2009, 23, 2965–2986. [Google Scholar] [CrossRef]
- Adamec, K.; Palmer, R.N.; Polebitski, A.; Ahlfeld, D.; Steinschneider, S.; Pitta, B.; Brown, C. Evaluation of Climate Change Impacts to Reservoir Operations within the Connecticut River Basin. In World Environmental and Water Resources Congress 2010; American Society of Civil Engineers: Reston, VA, USA, 2010; pp. 92–100. [Google Scholar]
- Ashofteh, P.S.; Haddad, O.B.; Mariño, M.A. Climate Change Impact on Reservoir Performance Indexes in Agricultural Water Supply. J. Irrig. Drain. Eng. 2013, 139, 85–97. [Google Scholar] [CrossRef]
- Garrote, L.; Iglesias, A.; Granados, A.; Mediero, L.; Martin-Carrasco, F. Quantitative Assessment of Climate Change Vulnerability of Irrigation Demands in Mediterranean Europe. Water Resour. Manag. 2015, 29, 325–338. [Google Scholar] [CrossRef]
- Wurbs, R.A.; Muttiah, R.S.; Felden, F. Incorporation of Climate Change in Water Availability Modeling. J. Hydrol. Eng. 2005, 10, 375–385. [Google Scholar] [CrossRef]
- Raje, D.; Mujumdar, P.P. Reservoir performance under uncertainty in hydrologic impacts of climate change. Adv. Water Resour. 2010, 33, 312–326. [Google Scholar] [CrossRef]
- Ashofteh, P.-S.; Haddad, O.B.; Loáiciga, H.A. Evaluation of Climatic-Change Impacts on Multiobjective Reservoir Operation with Multiobjective Genetic Programming. J. Water Resour. Plan. Manag. 2015, 141, 04015030. [Google Scholar] [CrossRef]
- Bonaccorso, B.; Peres, D.J.; Cancelliere, A.; Rossi, G. Large Scale Probabilistic Drought Characterization Over Europe. Water Resour. Manag. 2013, 27, 1675–1692. [Google Scholar] [CrossRef]
- Bonaccorso, B.; Peres, D.J.; Castano, A.; Cancelliere, A. SPI-Based Probabilistic Analysis of Drought Areal Extent in Sicily. Water Resour. Manag. 2015, 29, 459–470. [Google Scholar] [CrossRef]
- Bonaccorso, B.; Bordi, I.; Cancelliere, A.; Rossi, G.; Sutera, A. Spatial variability of drought: An analysis of the SPI in Sicily. Water Resour. Manag. 2003, 17, 273–296. [Google Scholar] [CrossRef]
- Jacob, D.; Petersen, J.; Eggert, B.; Alias, A.; Christensen, O.B.; Bouwer, L.M.; Braun, A.; Colette, A.; Déqué, M.; Georgievski, G.; et al. EURO-CORDEX: New high-resolution climate change projections for European impact research. Reg. Environ. Chang. 2014, 14, 563–578. [Google Scholar] [CrossRef]
- Boé, J.; Terray, L. Can metric-based approaches really improve multi-model climate projections? The case of summer temperature change in France. Clim. Dyn. 2015, 45, 1913–1928. [Google Scholar] [CrossRef]
- Wilby, R.L. Evaluating climate model outputs for hydrological applications. Hydrol. Sci. J. 2010, 55, 1090–1093. [Google Scholar] [CrossRef]
- Piani, C.; Weedon, G.P.; Best, M.; Gomes, S.M.; Viterbo, P.; Hagemann, S.; Haerter, J.O. Statistical bias correction of global simulated daily precipitation and temperature for the application of hydrological models. J. Hydrol. 2010, 395, 199–215. [Google Scholar] [CrossRef]
- Johnson, F.; Sharma, A. A nesting model for bias correction of variability at multiple time scales in general circulation model precipitation simulations. Water Resour. Res. 2012, 48. [Google Scholar] [CrossRef] [Green Version]
- Mascaro, G.; Viola, F.; Deidda, R. Evaluation of Precipitation From EURO-CORDEX Regional Climate Simulations in a Small-Scale Mediterranean Site. J. Geophys. Res. Atmos. 2018, 123, 1604–1625. [Google Scholar] [CrossRef]
- Peres, D.J.; Cancelliere, A. Modeling impacts of climate change on return period of landslide triggering. J. Hydrol. 2018, 567, 420–434. [Google Scholar] [CrossRef]
- Nijssen, B.; Chegwidden, O. Streamflow Bias Correction for Climate Change Impact Studies: Harmless Correction or Wrecking Ball? In American Geophysical Union, Fall Meeting 2017, Abstract #PA41A-0290; American Geophysical Union: Washington, DC, USA, 2017. [Google Scholar]
- WMO. WMO Guidelines on the Calculation of Climate Normals; WMO: Geneva, Switzerland, 2017; pp. 1–29. [Google Scholar]
- Mehan, S.; Gitau, M.; Flanagan, D. Reliable Future Climatic Projections for Sustainable Hydro-Meteorological Assessments in the Western Lake Erie Basin. Water 2019, 11, 581. [Google Scholar] [CrossRef] [Green Version]
- Teutschbein, C.; Seibert, J. Bias correction of regional climate model simulations for hydrological climate-change impact studies: Review and evaluation of different methods. J. Hydrol. 2012, 456–457, 12–29. [Google Scholar] [CrossRef]
- Lenderink, G.; Buishand, A.; Van Deursen, W. Estimates of future discharges of the river Rhine using two scenario methodologies: Direct versus delta approach. Hydrol. Earth Syst. Sci. 2007, 11, 1145–1159. [Google Scholar] [CrossRef]
- Cutore, P.; Cristaudo, G.; Campisano, A.; Modica, C.; Cancelliere, A.; Rossi, G. Regional Models for the Estimation of Streamflow Series in Ungauged Basins. Water Resour. Manag. 2007, 21, 789–800. [Google Scholar] [CrossRef]
- Peres, D.J.; Cancelliere, A. Environmental Flow Assessment Based on Different Metrics of Hydrological Alteration. Water Resour. Manag. 2016, 30, 5799–5817. [Google Scholar] [CrossRef]
- Peres, D.J.; Iuppa, C.; Cavallaro, L.; Cancelliere, A.; Foti, E. Significant wave height record extension by neural networks and reanalysis wind data. Ocean Model. 2015, 94, 128–140. [Google Scholar] [CrossRef]
- Indelicato, S.; Tamburino, V.; Barbagallo, S.; Mazzola, G. Risorse Idriche Nei Grandi Serbatoi Artificiali Siciliani. I Contributo; Quaderno n.; CSEI Catania: Catania, Italy, 1989. (In Italian) [Google Scholar]
- Hashimoto, T.; Stedinger, J.R.; Loucks, D.P. Reliability, resiliency, and vulnerability criteria for water resource system performance evaluation. Water Resour. Res. 1982, 18, 14–20. [Google Scholar] [CrossRef] [Green Version]
- Cancelliere, A.; Giuliano, G.; Nicolosi, V.; Rossi, G. Optimal Short-Term Operation of a Multipurpose Reservoir System under Limited Water Supply; IAHS-AISH Publ.: Wallingford, UK, 2003; pp. 200–207. [Google Scholar]
- Cancelliere, A.; Giuliano, G.; Ancarani, A.; Rossi, G. A Neural Networks Approach for Deriving Irrigation Reservoir Operating Rules. Water Resour. Manag. 2002, 16, 71–88. [Google Scholar] [CrossRef]
- Cancelliere, A.; Ancarani, A.; Rossi, G. Susceptibility of Water Supply Reservoirs to Drought Conditions. J. Hydrol. Eng. 1998, 3, 140–148. [Google Scholar] [CrossRef]
- Peres, D.J.; Caruso, M.F.; Cancelliere, A. Assessment of Climate-Change Impacts on Precipitation Based on Selected RCM Projections. European Water 2017, 59, 9–15, E.W. Publications. [Google Scholar]
- Jones, C.G.; Samuelsson, P.; Kjellstr¨Om, E. Regional climate modelling at the Rossby Centre. Tellus A Dyn. Meteorol. Oceanogr. 2011, 63, 1–3. [Google Scholar] [CrossRef]
- Moriasi, D.N.; Arnold, J.G.; van Liew, M.W.; Bingner, R.L.; Harmel, R.D.; Veith, T.L. Model Evaluation Guidelines for Systematic Quantification of Accuracy in Watershed Simulations. Trans. ASABE 2007. [Google Scholar] [CrossRef]
- CMMC. Piano Nazionale di Adattamento ai Cambiamenti Climatici; CMMC: Lecce, Italy, 2017. (In Italian) [Google Scholar]
- Sykes, M.T. Climate Change Impacts: Vegetation. Encycl. Life Sci. 2009. [Google Scholar] [CrossRef]
- Bachelet, D.; Neilson, R.P.; Lenihan, J.M.; Drapek, R.J. Climate Change Effects on Vegetation Distribution and Carbon Budget in the United States. Ecosystems 2001, 4, 164–185. [Google Scholar] [CrossRef]
- Rungee, J.; Kim, U. Long-term assessment of climate change impacts on Tennessee Valley Authority Reservoir operations: Norris Dam. Water 2017, 9, 649. [Google Scholar] [CrossRef]
- Rossi, G. Policy framework of drought risk mitigation. In Handbook of Drought and Water Scarcity: Management of Drought and Water Scarcity; Eslamian, S., Eslamian, F.A., Eds.; CRC Press: Boca Raton, FL, USA, 2017; pp. 569–588. [Google Scholar]
- Kwakkel, J.H.; Haasnoot, M.; Walker, W.E. Comparing Robust Decision-Making and Dynamic Adaptive Policy Pathways for model-based decision support under deep uncertainty. Environ. Model. Softw. 2016, 86, 168–183. [Google Scholar] [CrossRef] [Green Version]
Figure 1.
Steps of the proposed methodology for assessing the impact of climate change scenarios on reservoir performance.
Figure 1.
Steps of the proposed methodology for assessing the impact of climate change scenarios on reservoir performance.

Figure 2.
Water balance of a reservoir.

Figure 3.
Location of the Pozzillo reservoir in Sicily (Italy) (a), and an aerial view of the reservoir (b).
Figure 3.
Location of the Pozzillo reservoir in Sicily (Italy) (a), and an aerial view of the reservoir (b).

Figure 4.
Future vs. control mean monthly precipitation for two climate change scenarios: (a) RCP4.5 and (b) RCP8.5.
Figure 4.
Future vs. control mean monthly precipitation for two climate change scenarios: (a) RCP4.5 and (b) RCP8.5.

Figure 5.
Future vs. control mean monthly temperature for two climate change scenarios: (a) RCP4.5 and (b) RCP8.5.
Figure 5.
Future vs. control mean monthly temperature for two climate change scenarios: (a) RCP4.5 and (b) RCP8.5.

Figure 6.
Future vs. control mean monthly reservoir inflow for two climate change scenarios: (a) RCP4.5 and (b) RCP8.5.
Figure 6.
Future vs. control mean monthly reservoir inflow for two climate change scenarios: (a) RCP4.5 and (b) RCP8.5.

Figure 7.
Future vs. control mean monthly Pozzillo’s reservoir temporal reliability for two climate change scenarios: (a) RCP4.5 and (b) RCP8.5.
Figure 7.
Future vs. control mean monthly Pozzillo’s reservoir temporal reliability for two climate change scenarios: (a) RCP4.5 and (b) RCP8.5.

Figure 8.
Future vs. control mean monthly Pozzillo’s reservoir volumetric reliability for two climate change scenarios: (a) RCP4.5 and (b) RCP8.5.
Figure 8.
Future vs. control mean monthly Pozzillo’s reservoir volumetric reliability for two climate change scenarios: (a) RCP4.5 and (b) RCP8.5.


Figure 9.
Future vs. control mean monthly Pozzillo’s reservoir vulnerability, in terms of the Beard Index, for two climate change scenarios: (a) RCP4.5 and (b) RCP8.5.
Figure 9.
Future vs. control mean monthly Pozzillo’s reservoir vulnerability, in terms of the Beard Index, for two climate change scenarios: (a) RCP4.5 and (b) RCP8.5.


Table 1.
Distribution of monthly irrigation demands, expressed as percentage of the yearly total, for the Pozzillo reservoir (after [48]).
Table 1.
Distribution of monthly irrigation demands, expressed as percentage of the yearly total, for the Pozzillo reservoir (after [48]).
| May. | Jun. | Jul. | Aug. | Sep. | Oct. |
|---|---|---|---|---|---|
| 3.98% | 13.18% | 27.95% | 28.98% | 19.66% | 6.25% |
Table 2.
Performances corresponding to a future yearly demand equal to the one in the control period (88 hm3). In brackets, the variations of each indicator respect to the value in the control period. Values in bold indicate maximum variations.
Table 2.
Performances corresponding to a future yearly demand equal to the one in the control period (88 hm3). In brackets, the variations of each indicator respect to the value in the control period. Values in bold indicate maximum variations.
| Period | RT (%) | RV (%) | IB (%) | |||
|---|---|---|---|---|---|---|
| RCP4.5 | RCP8.5 | RCP4.5 | RCP8.5 | RCP4.5 | RCP8.5 | |
| 1971–2001 (control) | 76.1 | 76.1 | 84.8 | 84.8 | 11.2 | 11.2 |
| 2011–2040 | 68.9 (−9.5%) | 63.3 (−16.8%) | 77.1 (−9.1%) | 75.7 (−10.7%) | 16.7 (+48.8%) | 18.9 (+69.1%) |
| 2041–2070 | 69.4 (−8.8%) | 51.1 (−32.8%) | 75.3 (−11.2%) | 60.1 (−29.1%) | 17.1 (+52.4%) | 28.7 (+155.8%) |
| 2071–2100 | 60.6 (−20.4%) | 44.4 (−41.6%) | 67.6 (−20.3%) | 49.6 (−41.5%) | 23.6 (+110.7%) | 34.8 (+211.0%) |
Table 3.
Future demands corresponding to the performances in the control period. In brackets, the variations respect to the demand in the control period. Values in bold indicate maximum negative variations.
Table 3.
Future demands corresponding to the performances in the control period. In brackets, the variations respect to the demand in the control period. Values in bold indicate maximum negative variations.
| Period | D(RT) (hm3) | D(RV) (hm3) | D(IB) (hm3) | |||
|---|---|---|---|---|---|---|
| RCP4.5 | RCP8.5 | RCP4.5 | RCP8.5 | RCP4.5 | RCP8.5 | |
| 2011–2040 | 82.5 (−6.3%) | 76.3 (−13.4%) | 78.0 (−11.3%) | 77.4 (−12.0%) | 78.7 (−10.5%) | 77.1 (−12.4%) |
| 2041–2070 | 80.0 (−9.1%) | 62.7 (−28.8%) | 73.8 (−16.2%) | 60.9 (−30.8%) | 75.8 (−13.9%) | 62.0 (−29.5%) |
| 2071–2100 | 68.9 (−21.7%) | 53.5 (−39.2%) | 67.8 (−23.0%) | 49.2 (−44.1%) | 68.2 (−22.4%) | 50.0 (−43.2%) |
© 2019 by the authors. Licensee MDPI, Basel, Switzerland. This article is an open access article distributed under the terms and conditions of the Creative Commons Attribution (CC BY) license (http://creativecommons.org/licenses/by/4.0/).
Share and Cite
MDPI and ACS Style
Peres, D.J.; Modica, R.; Cancelliere, A. Assessing Future Impacts of Climate Change on Water Supply System Performance: Application to the Pozzillo Reservoir in Sicily, Italy. Water 2019, 11, 2531. https://doi.org/10.3390/w11122531
AMA Style
Peres DJ, Modica R, Cancelliere A. Assessing Future Impacts of Climate Change on Water Supply System Performance: Application to the Pozzillo Reservoir in Sicily, Italy. Water. 2019; 11(12):2531. https://doi.org/10.3390/w11122531
Chicago/Turabian StylePeres, David J., Rosario Modica, and Antonino Cancelliere. 2019. "Assessing Future Impacts of Climate Change on Water Supply System Performance: Application to the Pozzillo Reservoir in Sicily, Italy" Water 11, no. 12: 2531. https://doi.org/10.3390/w11122531
Note that from the first issue of 2016, this journal uses article numbers instead of page numbers. See further details here.