Changes in the Risk of Extreme Climate Events over East Asia at Different Global Warming Levels


1
Key Laboratory of Land Surface Pattern and Simulation, Institute of Geographic Sciences and Natural Resources Research, Chinese Academy of Sciences, Beijing 100101, China
2
College of Resources and Environment, University of Chinese Academy of Sciences, Beijing 100049, China
*
Author to whom correspondence should be addressed.
†
Jintao Zhang and Fang Wang are the co-first authors, and they contributed equally to this work.
Water 2019, 11(12), 2535; https://doi.org/10.3390/w11122535
Submission received: 29 September 2019
/
Revised: 20 November 2019
/
Accepted: 28 November 2019
/
Published: 30 November 2019
(This article belongs to the Special Issue Modeling and Monitoring Climate Extremes and Impacts on Natural-Human Systems)
Abstract
:Limiting the global temperature increase to a level that would prevent “dangerous anthropogenic interference with the climate system” is the focus of intergovernmental climate negotiations, and the cost-benefit analysis to determine this level requires an understanding of how the risk associated with climate extremes varies with different warming levels. We examine daily extreme temperature and precipitation variances with continuous global warming using a non-stationary extreme value statistical model based on the Coupled Model Intercomparison Project Phase 5 (CMIP5). Our results show the probability of extreme warm and heavy precipitation events over East Asia (EA) will increase, while that of cold extremes over EA will decrease as global warming increases. A present-day 1-in-20-year heavy precipitation extreme in EA is projected to increase to 1.3, 1.6, 2.5, and 3.4 times more frequently of the current climatology, at the global mean warming levels of 1.5 °C, 2 °C, 3 °C, and 4 °C above the preindustrial era, respectively. Moreover, the relative changes in probability are larger for rarer events. These results contribute to an improved understanding of the future risk associated with climate extremes, which helps scientists create mitigation measures for global warming and facilitates policy-making.
1. Introduction
According to the Fifth Assessment Report of the Intergovernmental Panel on Climate Change (IPCC), the global mean temperature increased by 0.85 °C (0.65–1.06 °C) over the period 1880–2012 [1]. Climate extremes are occurring more frequently in recent decades, with heightening global warming, and these extremes have widespread influences both on the natural ecosystem and the human society [2,3]. There is an increasing number of investigations into global [4,5,6] and regional [7,8,9,10] climate extremes using a suite of extreme climate indices developed by the Expert Team on Climate Change Detection and Indices (ETCCDI) [11]. Annual daily maximum (TXx), daily minimum (TNn) temperatures and maximum 5-day precipitation (Rx5day) are among the most representative indicators of climate extremes. There is a general agreement at the global level regarding the nature of the observed and simulated changes in the three indicators despite some differences between observations and simulations. This agreement provides a foundation for future projections.
Determined in the recent Paris Agreement, a limit of 2.0 °C is set on the increase in the global mean temperature, and efforts are being made to limit the warming to 1.5 °C relative to preindustrial levels [12,13]. Found in most past studies, the projected climate changes at a specific time in the future is determined based on pre-set forcing scenarios (e.g., the Representative Concentration Pathway (RCP)) [14]. To contrast, the focus of the Paris Agreement and current intergovernmental mitigation commitments is on global mean warming limits. It should be noted that global climate change may lead to a series of variations in regional climate extremes, which has diverse impacts, and currently there is no objective warming target that can really identify when the climate system can no longer bear the risk of dangerous interference [1,2].
More recent studies have focused on changes in the risk of climate extremes under the 2.0 °C and 1.5 °C levels, and the benefits of limiting the increase in global mean temperature to 1.5 °C rather than 2.0 °C have been analyzed [9,15,16,17]. However, considering the thermal inertia and complexity of the climate system, along with its carbon cycle feedback and radiative efficiencies [18], global warming may reach a higher level than 2.0 °C. A rapid reduction in global greenhouse gas emissions is needed to reach the 2.0/1.5 °C goals [19]. Therefore, studies of the risk of climate extremes at higher global temperatures are needed. According to the Intended Nationally Determined Contributions (INDCs), to which 192 countries have contributed [20], if the current decarbonization rates remain relatively constant for the period beyond 2030, which is consistent with the “continuing action” pathway discussed in Rogelj et al. (2016) [21], CAT (2017) [22], and Wang et al. (2018) [23], by 2100, the global mean temperature will be approximately 3 °C above the preindustrial level. Further, if global mitigation efforts are not taken immediately, the projected global mean temperature increase could exceed 4 °C during the 21st century [24,25] and have severely negative impacts on natural ecosystems and human society [3].
Linking regional-and national-scale global warming to specified limits on the global mean temperature increase (global warming limits) would benefit the development and adaption of policy related to climate negotiations [26]. A key issue is how changes in regional climate extremes vary with continuous global warming. The focus of our study is to examine changes in annual temperature and precipitation extremes over East Asia (EA) associated with continuous global warming using a non-stationary extreme value statistical model and comprehensive dataset from 31 Global Climate Models (GCMs) from the Fifth Coupled Climate Model Intercomparison Project (CMIP5) [27]. We compare the risks associated with temperature and precipitation extremes at different warming limits, which provides a useful tool for policy adaption and design.
2. Data and Methods
2.1. Data Description
The simulated daily temperature and precipitation data from 31 GCMs from the CMIP5 [27] were adopted for calculating the extreme temperature and precipitation indices (Table 1). These simulations include both historical simulations (years 1860–2005) and future climate projections (years 2006–2100) under the RCP 8.5 scenario [14]. Basic information about 31 GCMs is listed in Table S1. We selected only the first run of the multi-ensemble models to ensure consistency. All model data were interpolated to a common 1.5° × 1.5° horizontal grid using a bilinear interpolation algorithm from ensemble analysis. We evaluated the model performance before projection research; while the general features of the observed TXx, TNn, and Rx5day were reasonably reproduced by the model, mild biases were shown (Figures S1 and S2).
2.2. Methodology
We follow the approach of Kharin et al. (2013) [28] therein for analysis of temperature and precipitation extreme amounts in terms of return values of their annual extremes. Return value (RV) is determined as the quantiles of a Generalized Extreme Value (GEV) distribution. Annual temperature and precipitation extreme data, which is a combination of the Historical simulations (1860–2005) and the RCP8.5 simulations (2006–2100), were fitted to a GEV distribution. The cumulative distribution function (CDF) of the GEV is given by:
where is the shape parameter, is the location parameter, and is the (positive) scale parameter. These parameters are estimated based on the method of maximum likelihood [28,29]. The fundamental assumption in extreme event risk management is that there is a time-invariant probability distribution ( associated with each variable whose parameters can be estimated based on historical observations. However, this assumption long has been compromised due to substantial changes in the climate due to anthropogenic influences [30]. Significant linear trends in GEV parameters are observed in almost all regions under most GCMs. A significant increase in location parameters is observed when fitting both the temperature and precipitation extreme data. However, the change of scale parameter of temperature extremes is not as remarkable as that of the precipitation extremes (Figures S3–S5). Therefore, we propose a non-stationary GEV model for fitting temperature and precipitation extreme data within the context of global warming. Comprehensively, we assume the location parameter () and the log of the scale parameter () linearly depend on the global mean warming relative to preindustrial era () as follows:
The global mean temperature change in this study is defined relative to the preindustrial period (1860–1880). Since we mainly focused on the relationship between the annual extremes and the corresponding global warming conditions, the interannual variability of the climate system is smoothed by a 21-year moving average when computing annual extremes and global mean temperature changes (), and similar approaches have been adopted in previous studies [16,31,32]. The intercept coefficients ( and ) and the constant shape parameter () determine the probability distribution of the annual extremes for the preindustrial period ( = 0). The five parameters (, , , , and ) are estimated for each GCMs at every grid point.
The rarity of climate extremes is characterized by the return period. Based on the GEV distributions fitted by the data from the 31 CMIP5 model simulations, the changes in the RV for a given return period, and the corresponding changes in the probability of climate extremes relative to a certain warming level could be estimated. We defined = 1 °C as the representative of the present-day climate (Figure S6) and evaluated changes in the annual temperature and precipitation extremes in a warmer future ( = 1.5, 2, 3, and 4 °C).
To quantitatively express the probability that an extreme event will occur, we considered the following risk ratio (RR):
where is the probability of reaching a specific present-day intensity (e.g., the probability that an extreme high temperature event will exceed a 20-year RV is 5%), is the corresponding probability of reaching this temperature intensity in future scenarios, and an indicates an increased risk of extreme events. We first computed the RRs based on the GEV distributions of the individual model, and then a multi-model ensemble median was adopted.
3. Results
3.1. Changes in the Probability Distribution of Climate Extremes
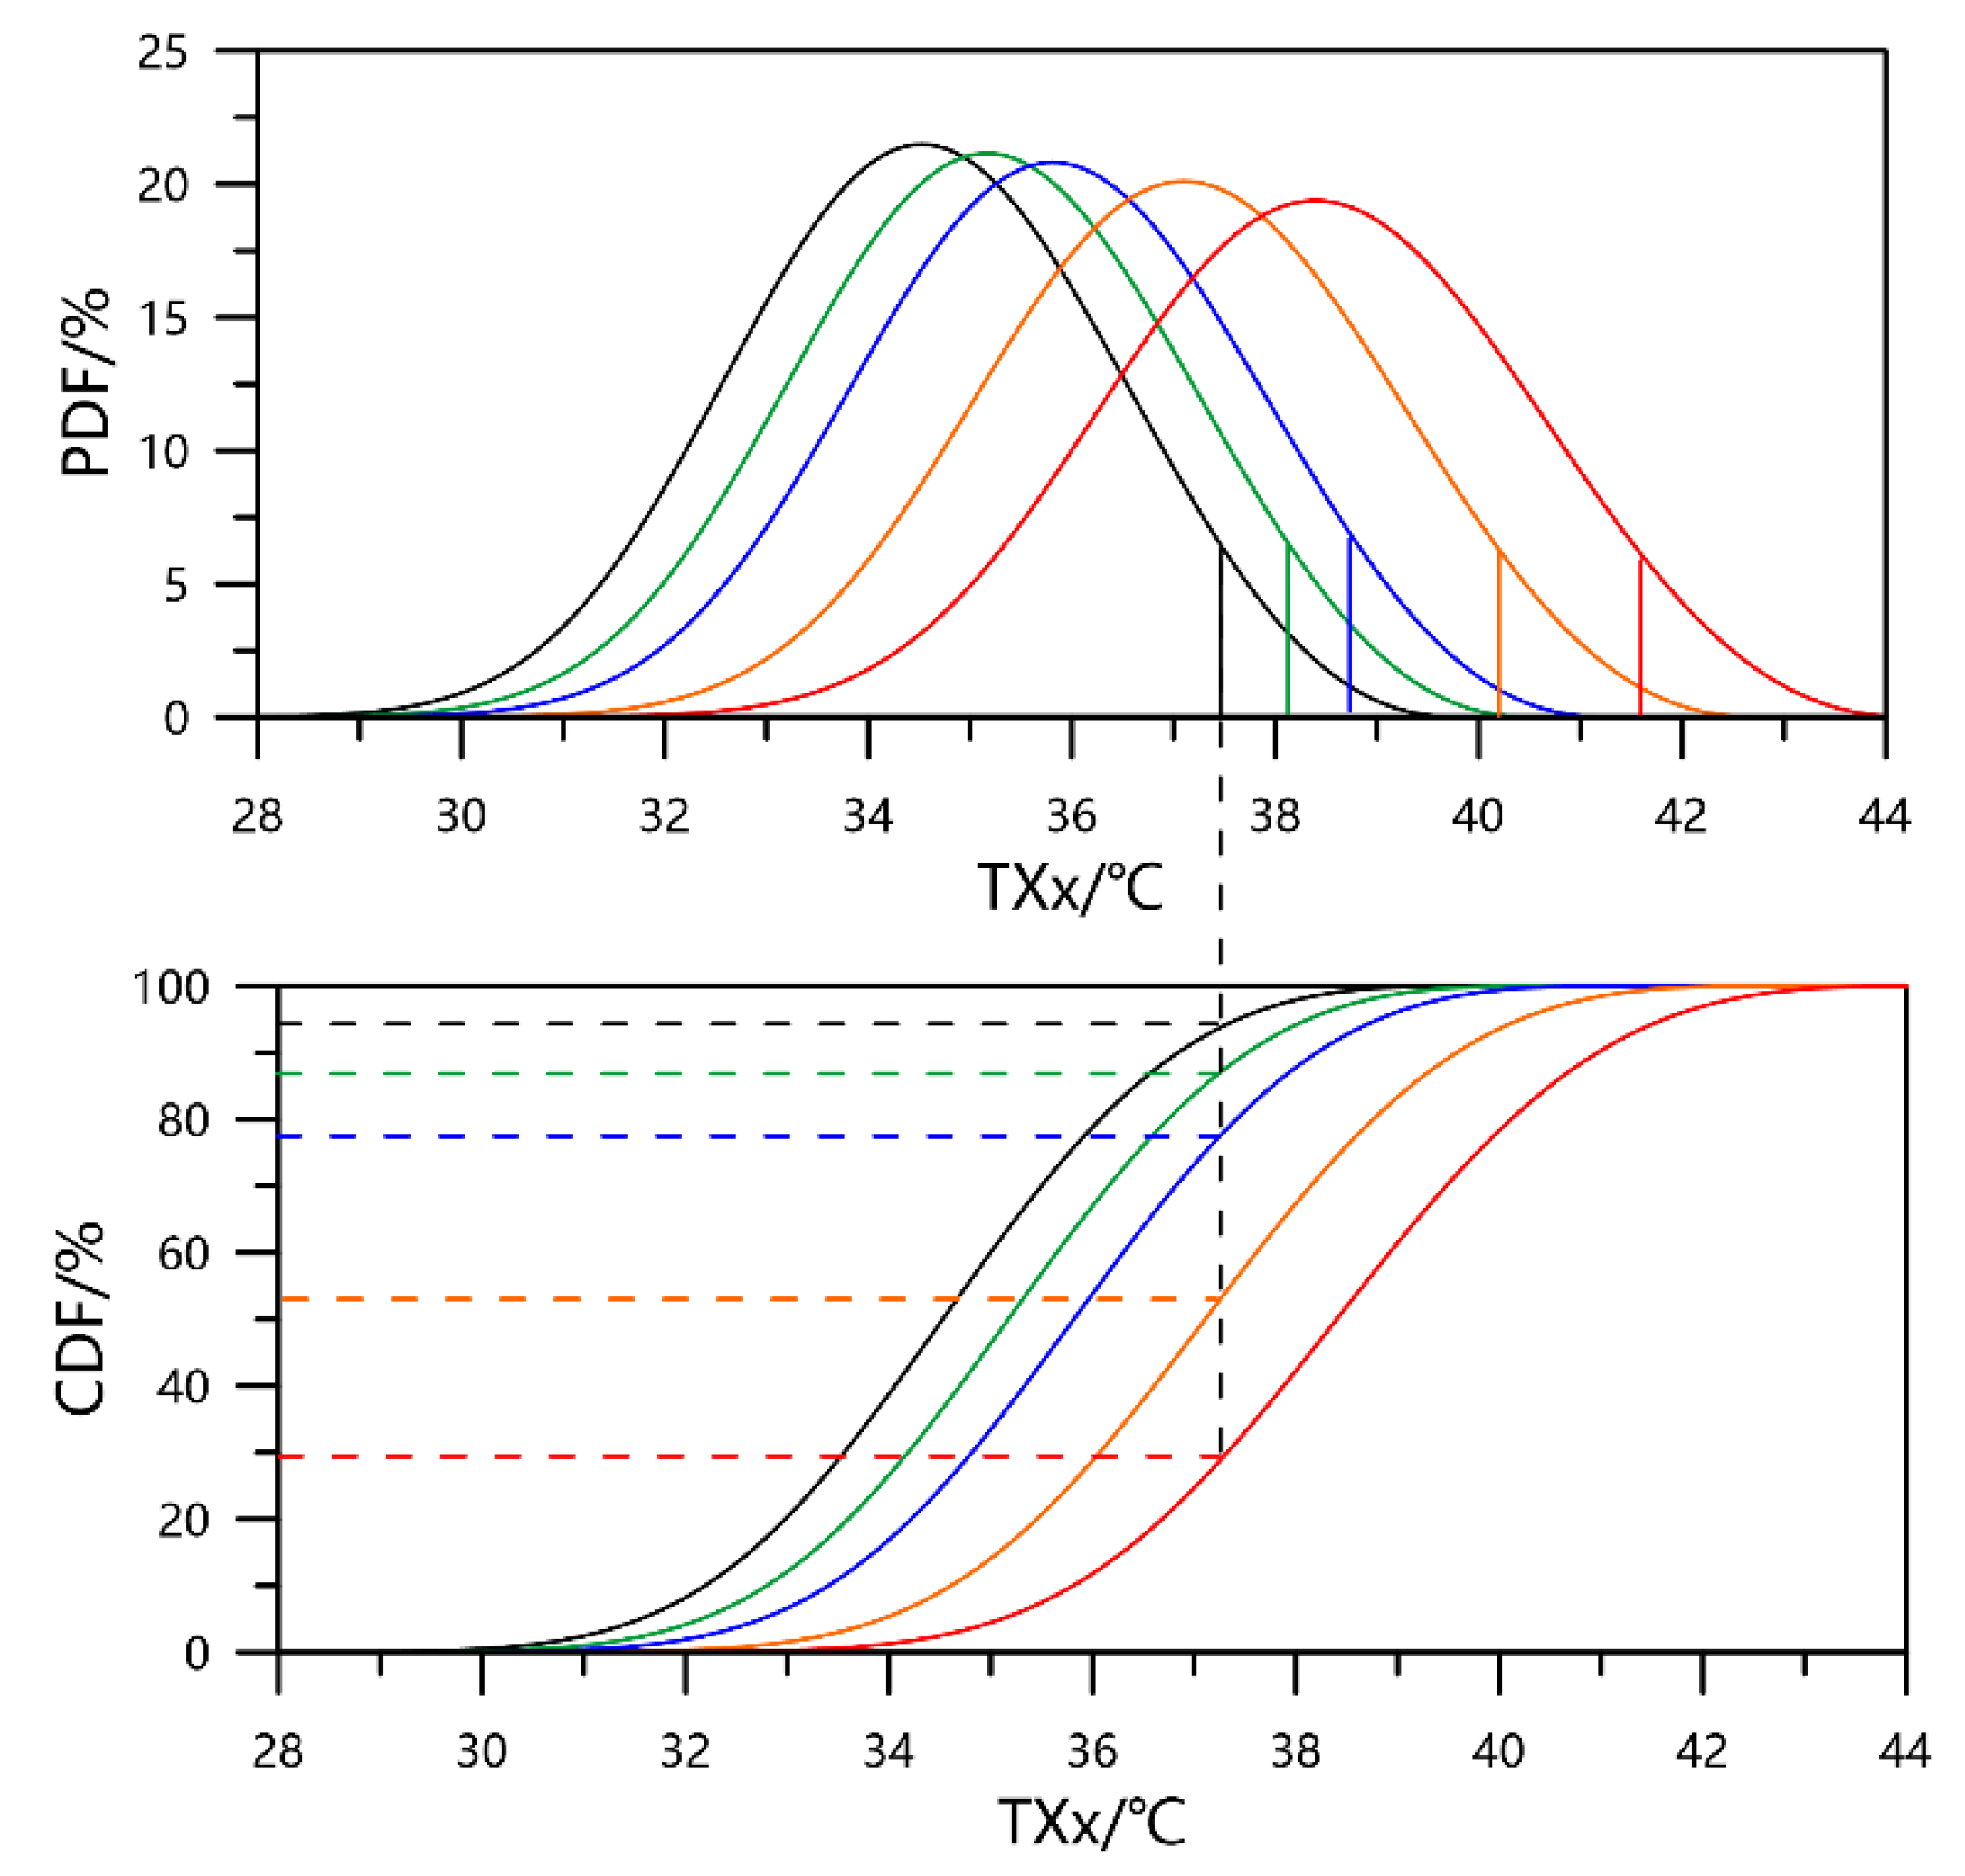
Figure 1 displays the GEV distribution for the model grid box that contains Beijing, China for the annual maximum temperature (TXx) at different global warming levels. We see that for Beijing, the 20-year return value increases by approximately 0.7, 1.4, 2.8, and 4.2 °C above present-day temperatures at the four global warming levels (corresponding to = 1.5, 2, 3, and 4 °C), respectively. A warm temperature extreme exceeding the 20-year RV at current climatology occurs approximately 2.5 times more frequently (about once every 8 years) for the 1.5 °C global warming. and occurs approximately 14 times more frequently for the 4 °C global warming.
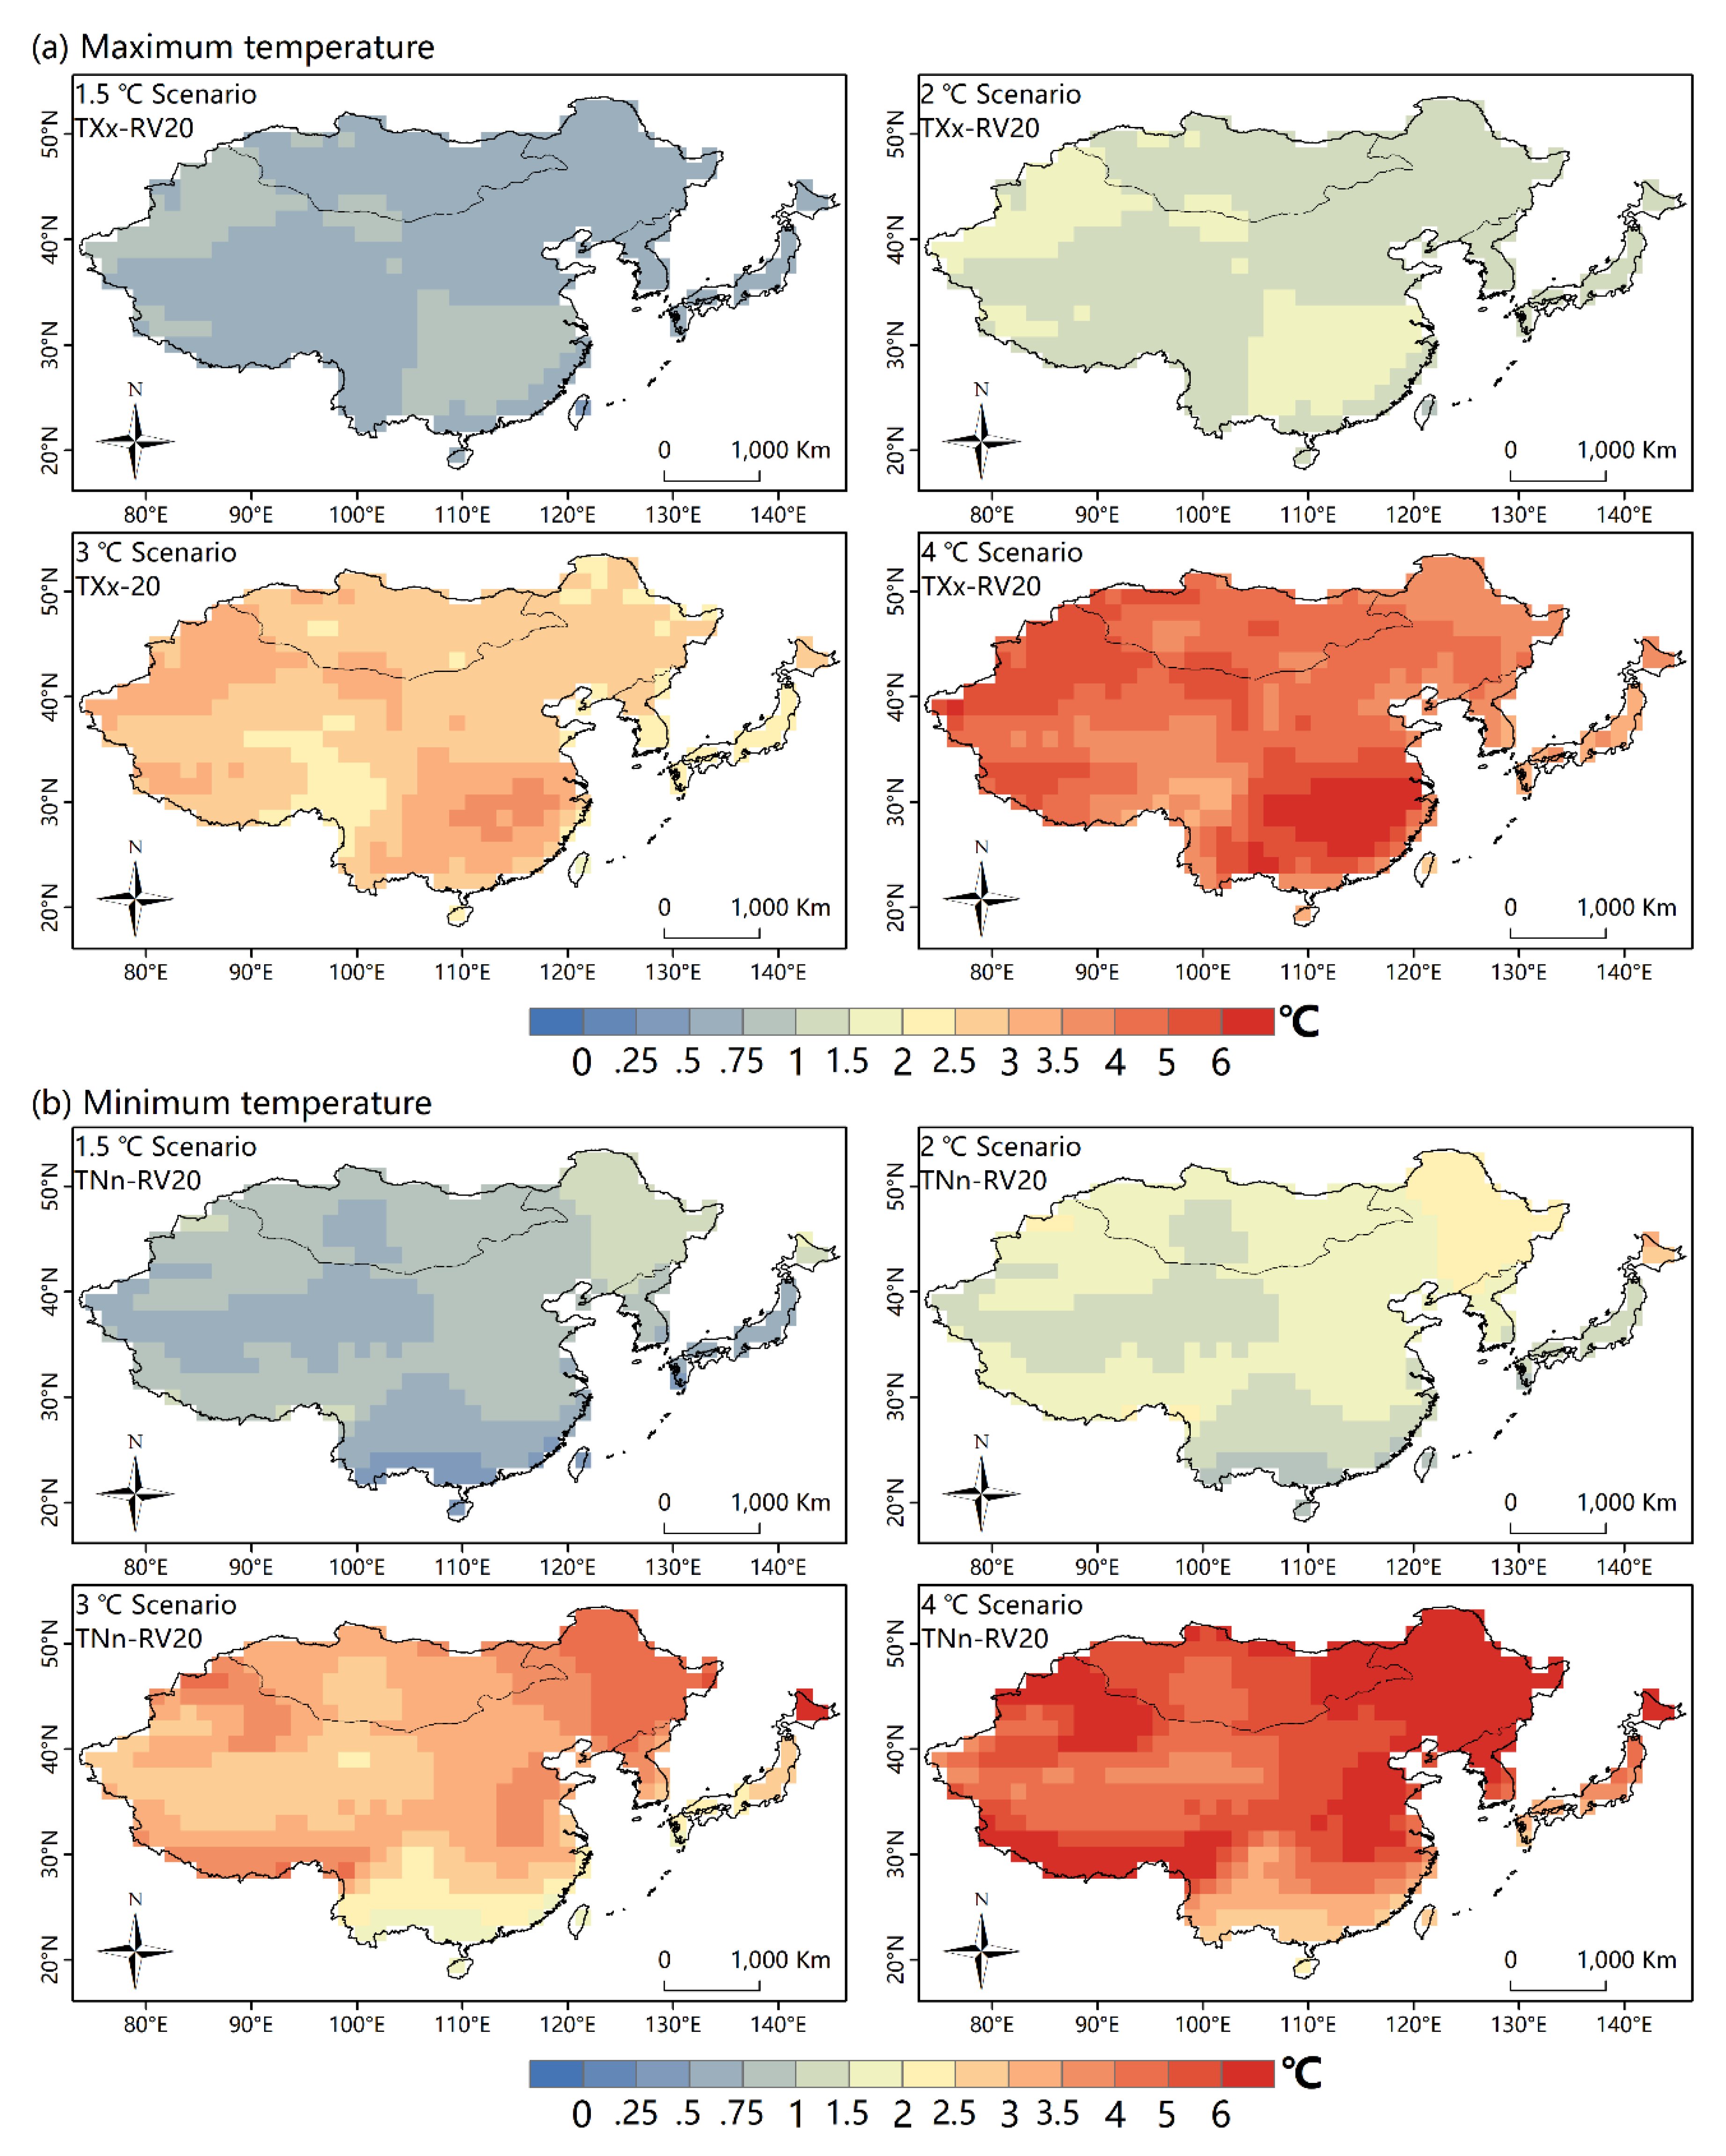
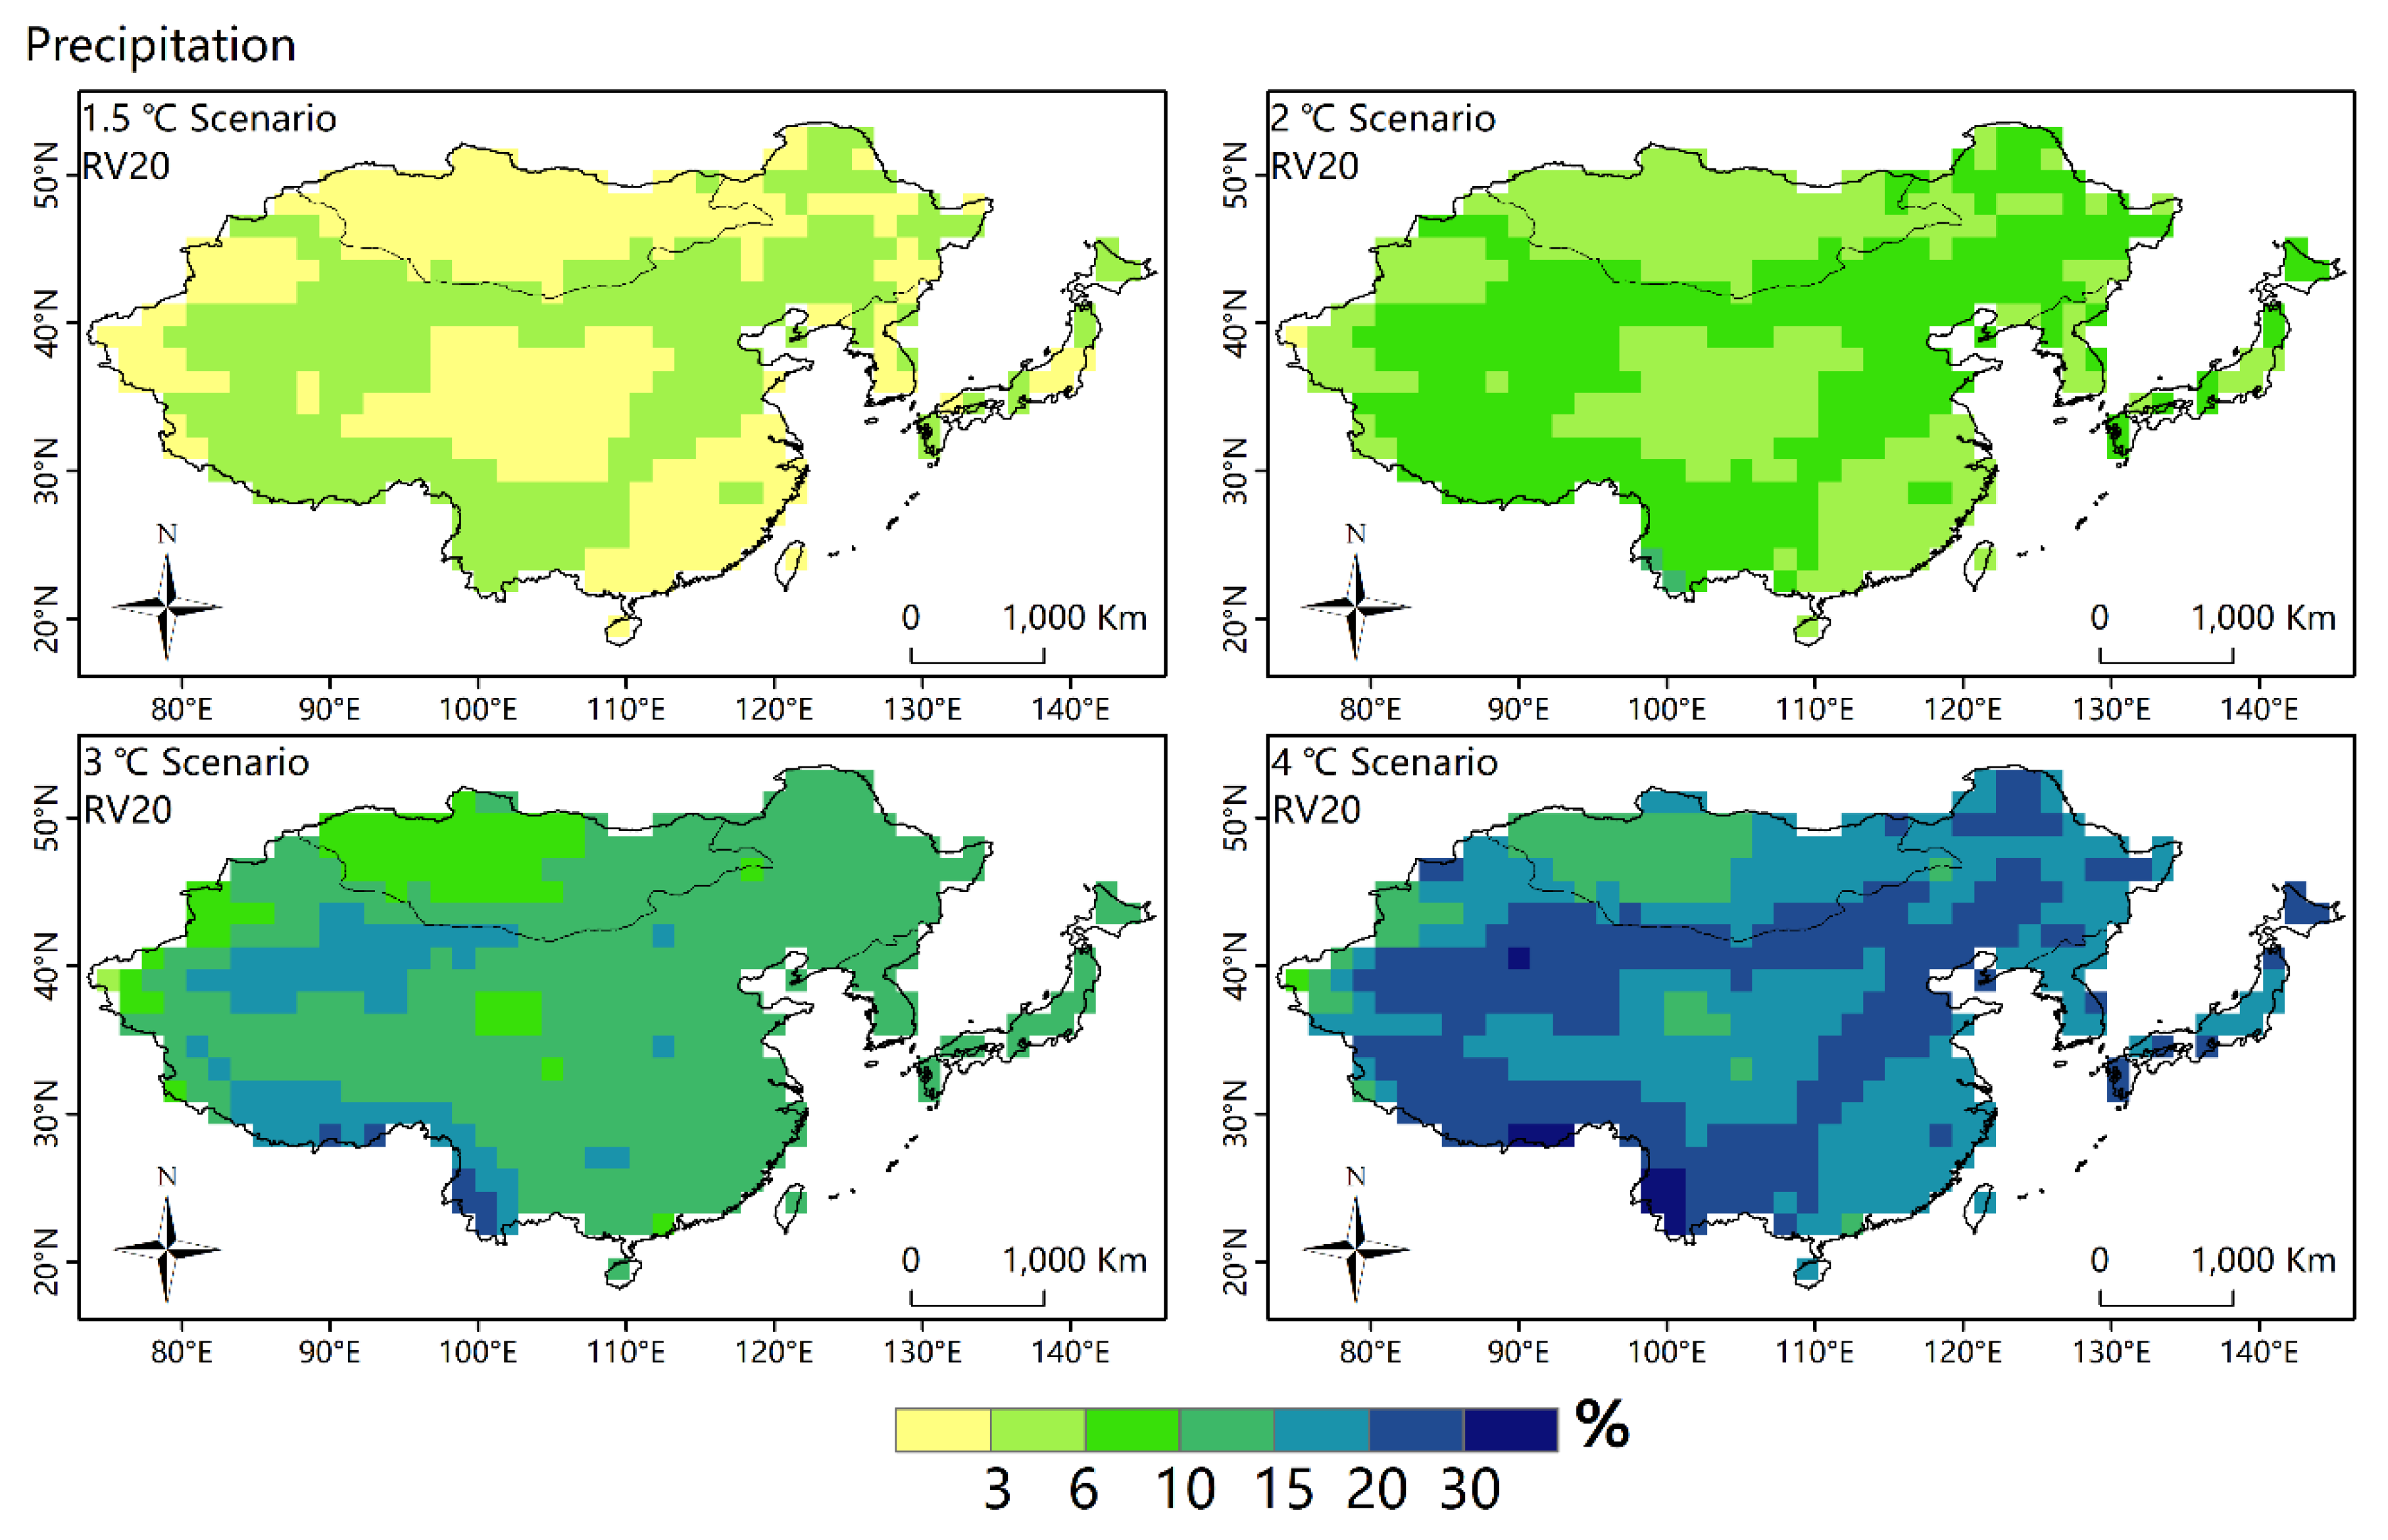
Projected changes in the 20-year RV for TXx and TNn above those corresponding to the present-day climate at different global warming levels are displayed in Figure 2. Generally, the magnitude of the increase in the RV for the temperature extremes is larger than that of the mean state. Considerable warming in TNn occurs in northern high latitudes, which presumably could be related to the retreating snow cover under the global warming [6]. Unlike TNn, a greater uniformity in the warming of TXx is expected over EA. The most pronounced warming in TXx in southern China may be related to the precipitation deficits and soil-moisture feedbacks in the region [33]. The changes in the 20-year RV for Rx5day are displayed in Figure 3. The RV for precipitation extremes continues to increase with global warming with a relatively uniform increase in magnitude. Rx5day in EA increases with the availability of moisture at a rate roughly close to the Clapeyron–Clausius rate of about 6–7%/°C, which is consistent with the thermodynamic principles based on previous research [34]. The more prominent growth of Rx5day at the edge of the Tibetan Plateau may be related to topographical effects [35]. The spatial pattern of the RV for the extremes does not vary for different RVs (e.g., a 1-in-50-year event) (Figures S7 and S8). We noticed that the increase in the location parameter of the GEV largely determines warming in the case of temperature and an increase in intensity in the case of precipitation.
3.2. Risk Ratios at Different Warming Levels
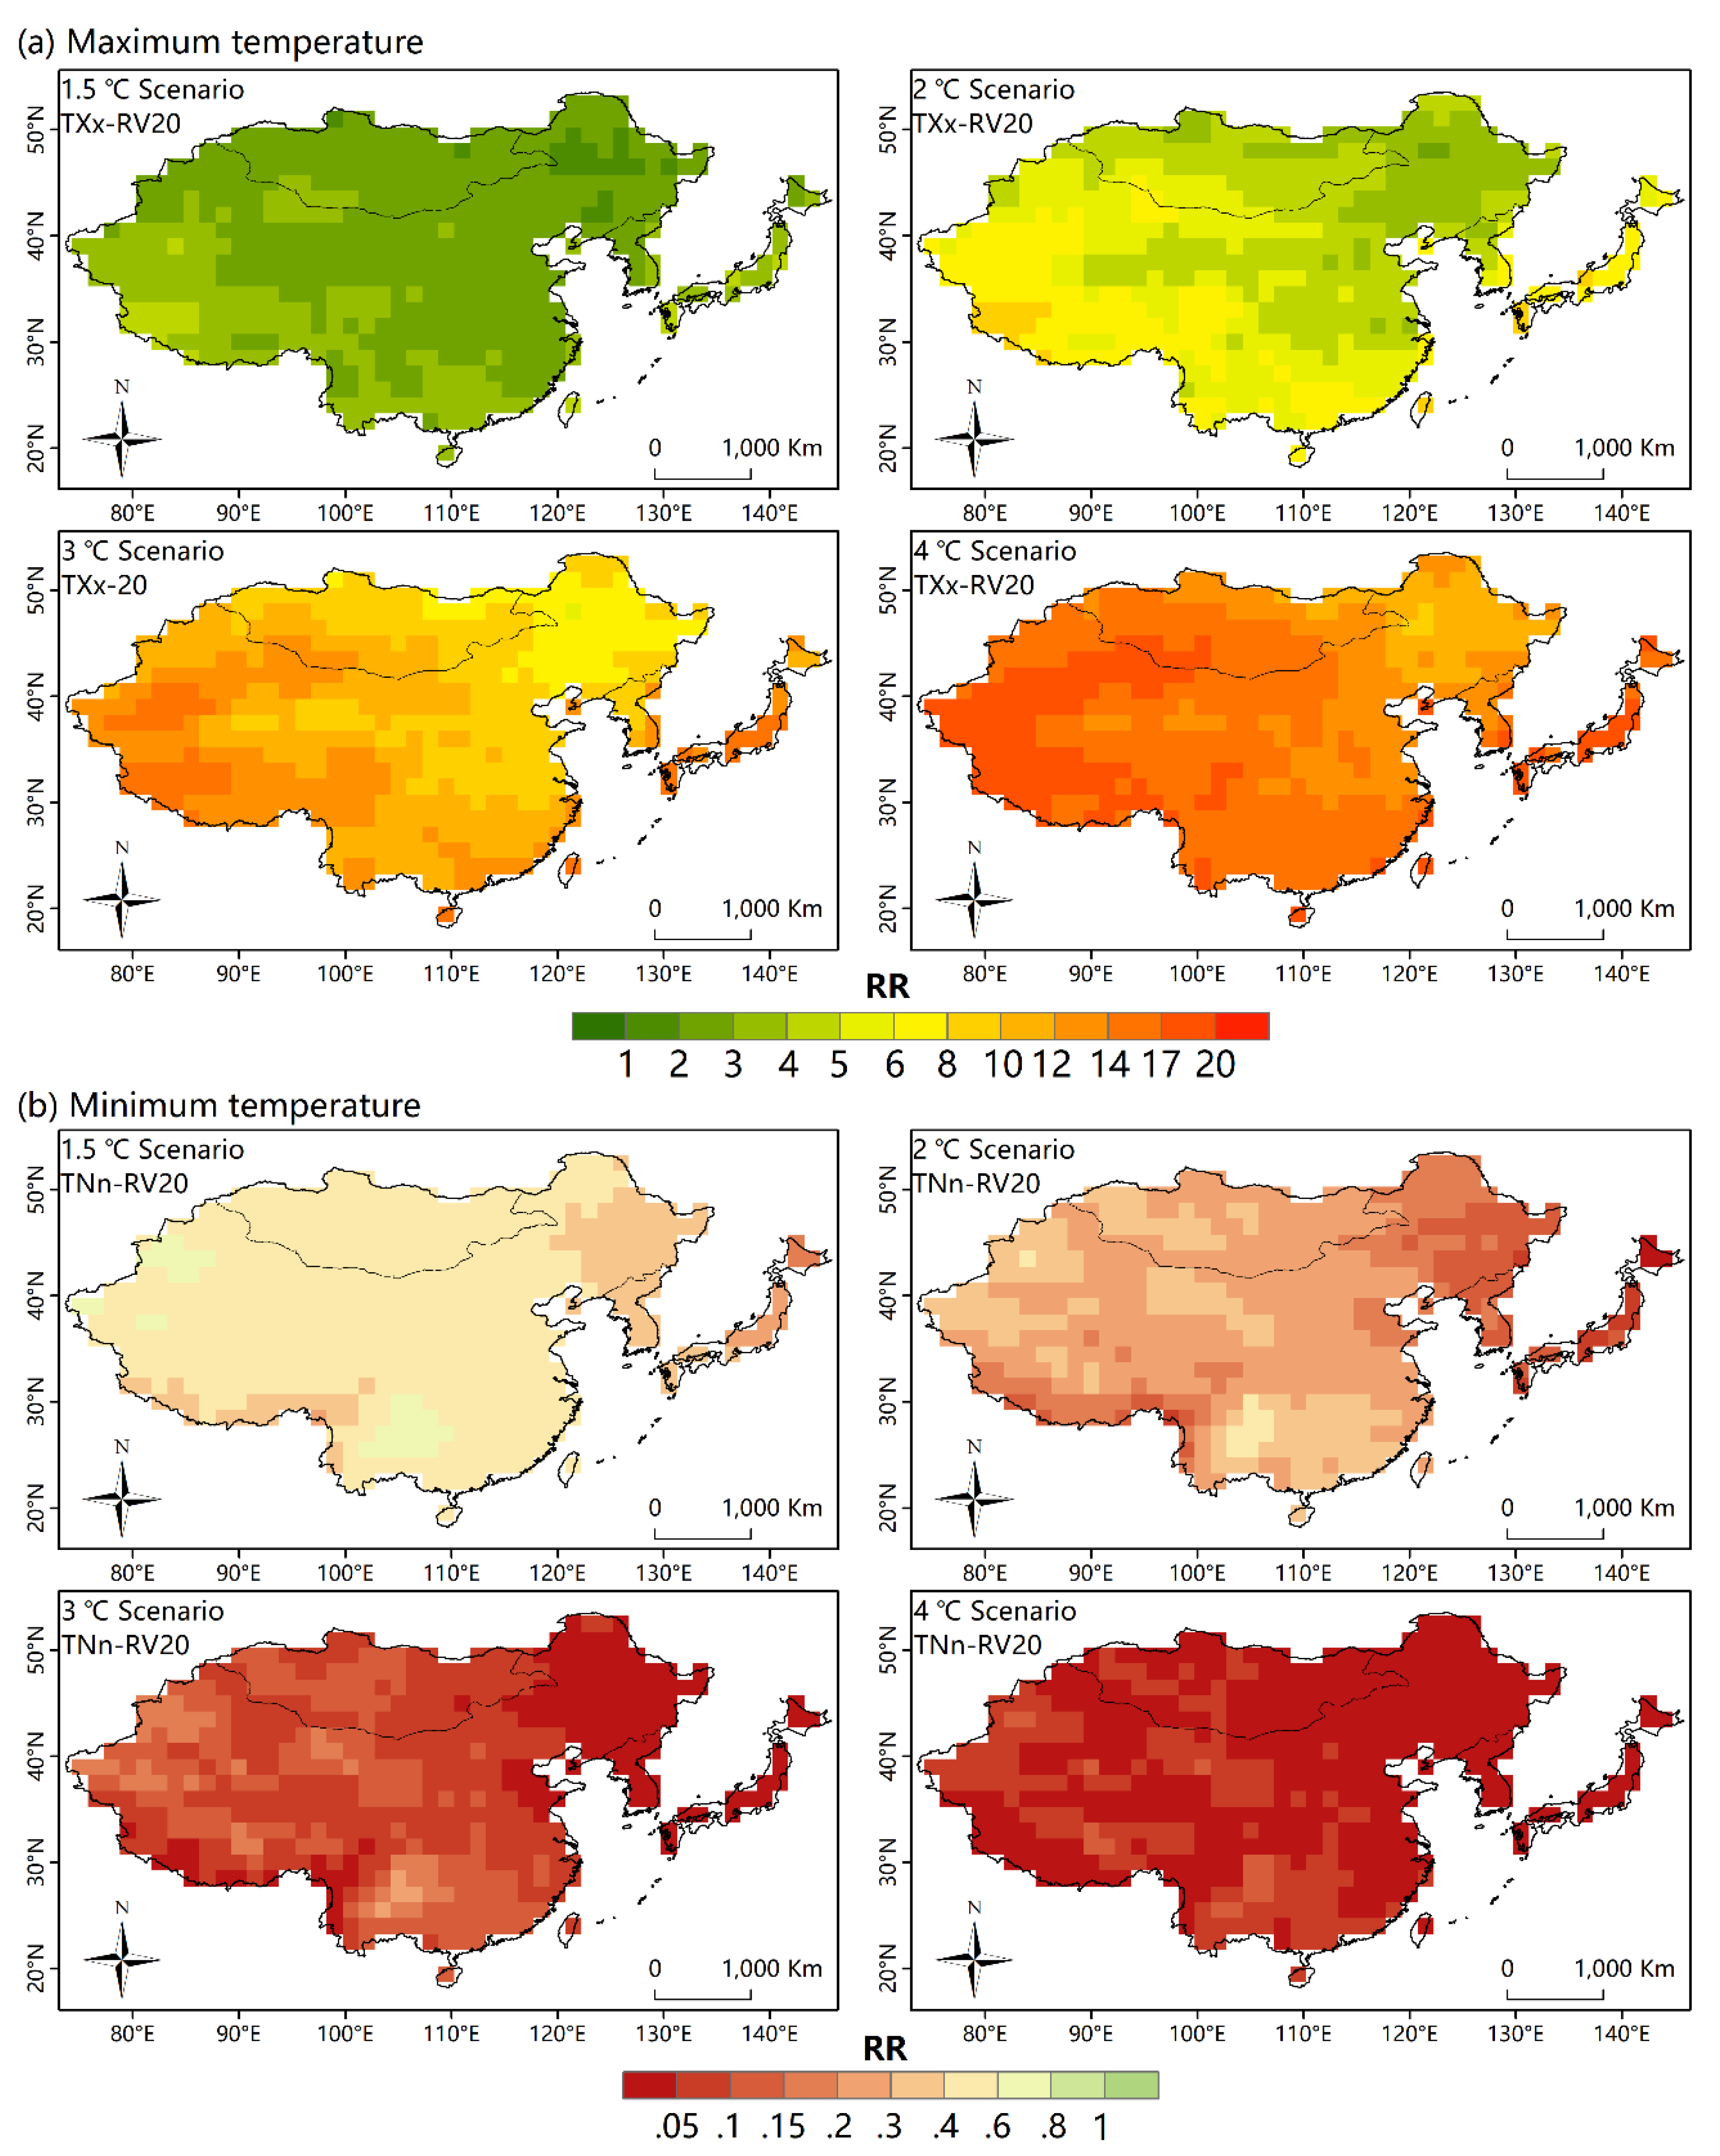
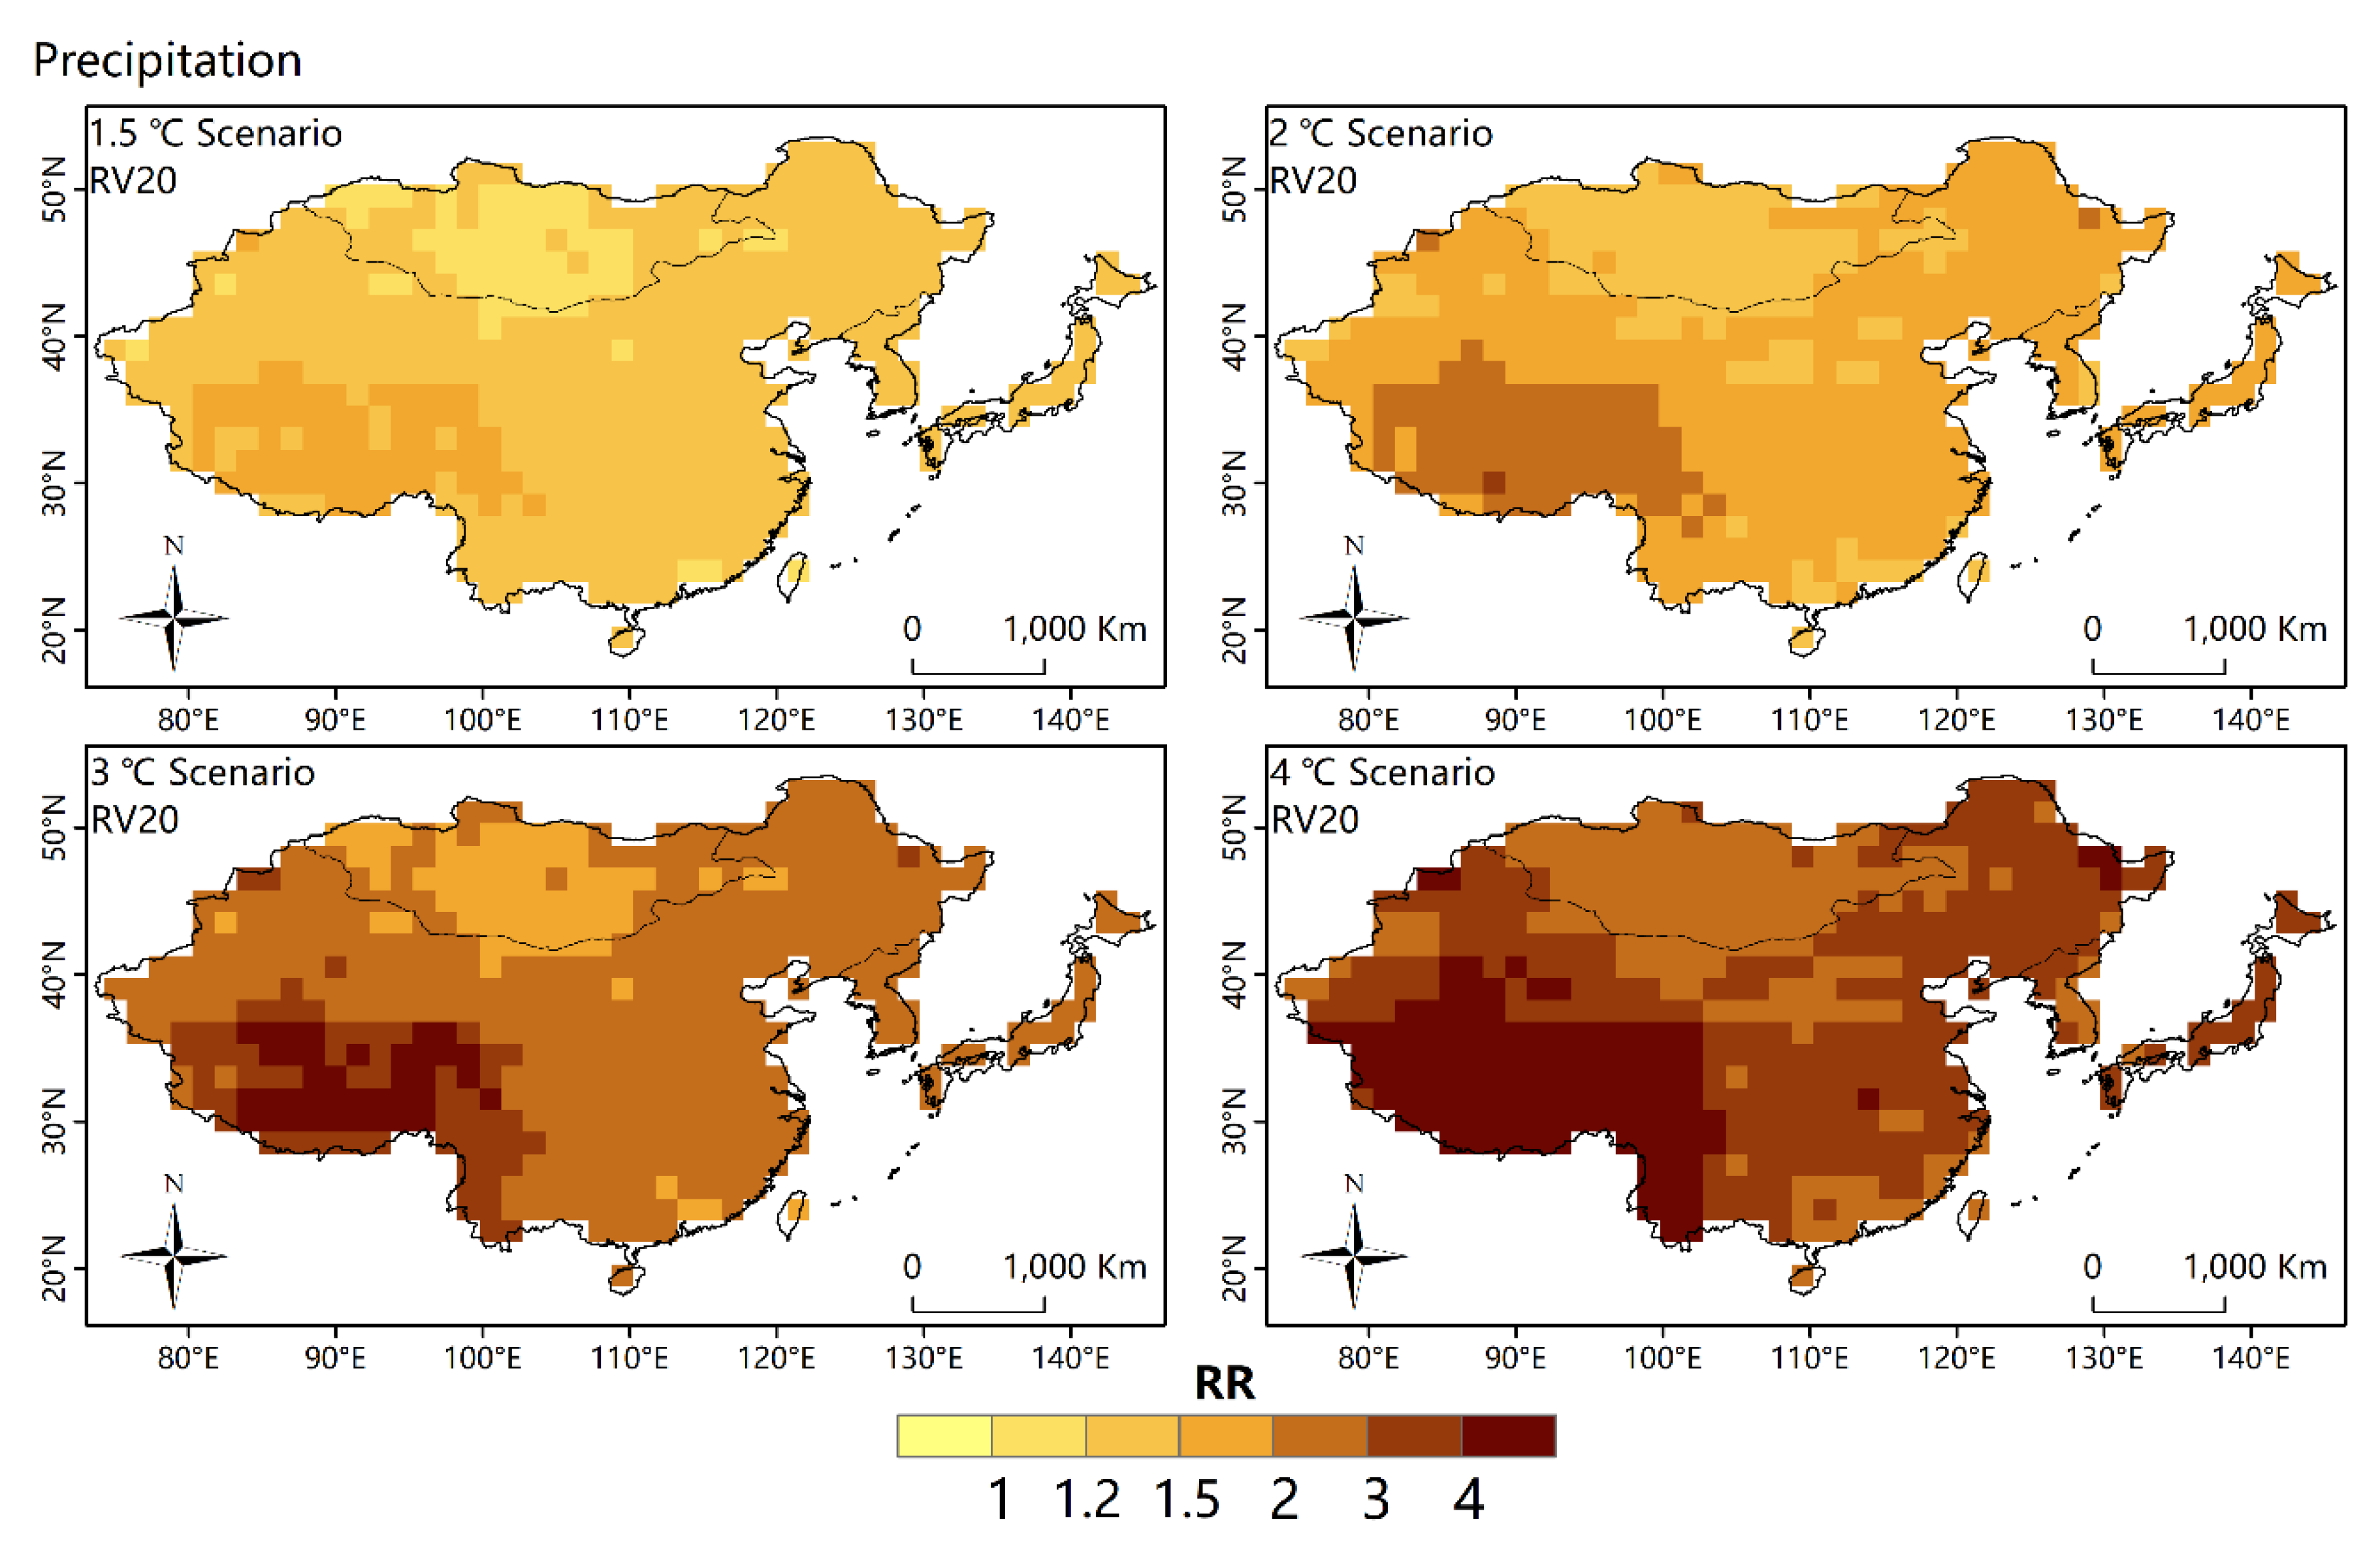
Figure 4 displays the spatial patterns of the RRs for the warm (TXx) and cold (TNn) extremes that exceed current 20-year RVs to those corresponding to the 1.5 °C, 2 °C, 3 °C, and 4 °C global warming levels. The RR of warm extremes at higher warming levels is higher than 1 everywhere, indicating more frequent occurrences of warm extremes above the current level (with higher values in Japan and Western China). The regional average RRs for the 20-year warm extremes over EA are 2.8, 5.2, 10.6, and 14.9 at the four warming levels, indicating multiple occurrences of warm extremes in the future. To contrast, the frequency of occurrence of cold extremes will decline. The RR for the a current 1-in-20-year cold extreme at the higher warming level is less than 1 everywhere, with the most significant decreases in the areas of northeastern China, the southern periphery of the Tibetan Plateau, the Korean peninsula, and Japan. The regional average RRs for the 20-year cold extremes over EA are 0.49, 0.25, 0.08, and 0.03 at the four warming levels, which corresponds to a decrease in the risk of a cold extreme by more than half. The RRs for the heavy precipitation extremes (Rx5day) are shown in Figure 5. The RRs for extreme precipitation events are generally lower than that for extreme high temperature events. The largest increase in the RRs is in the Tibetan Plateau and its periphery. The median RRs for 20-year heavy precipitation extremes over EA are 1.3, 1.6, 2.5, and 3.4, at the four warming levels. The spatial patterns of the RRs for 1-in-50-year events are quite similar to those for 1-in-20-year events (Figures S9 and S10). However, the magnitude of the changes in the RRs for temperature and precipitation extremes that exceed current 50-year RVs at the same warming level are significantly larger.
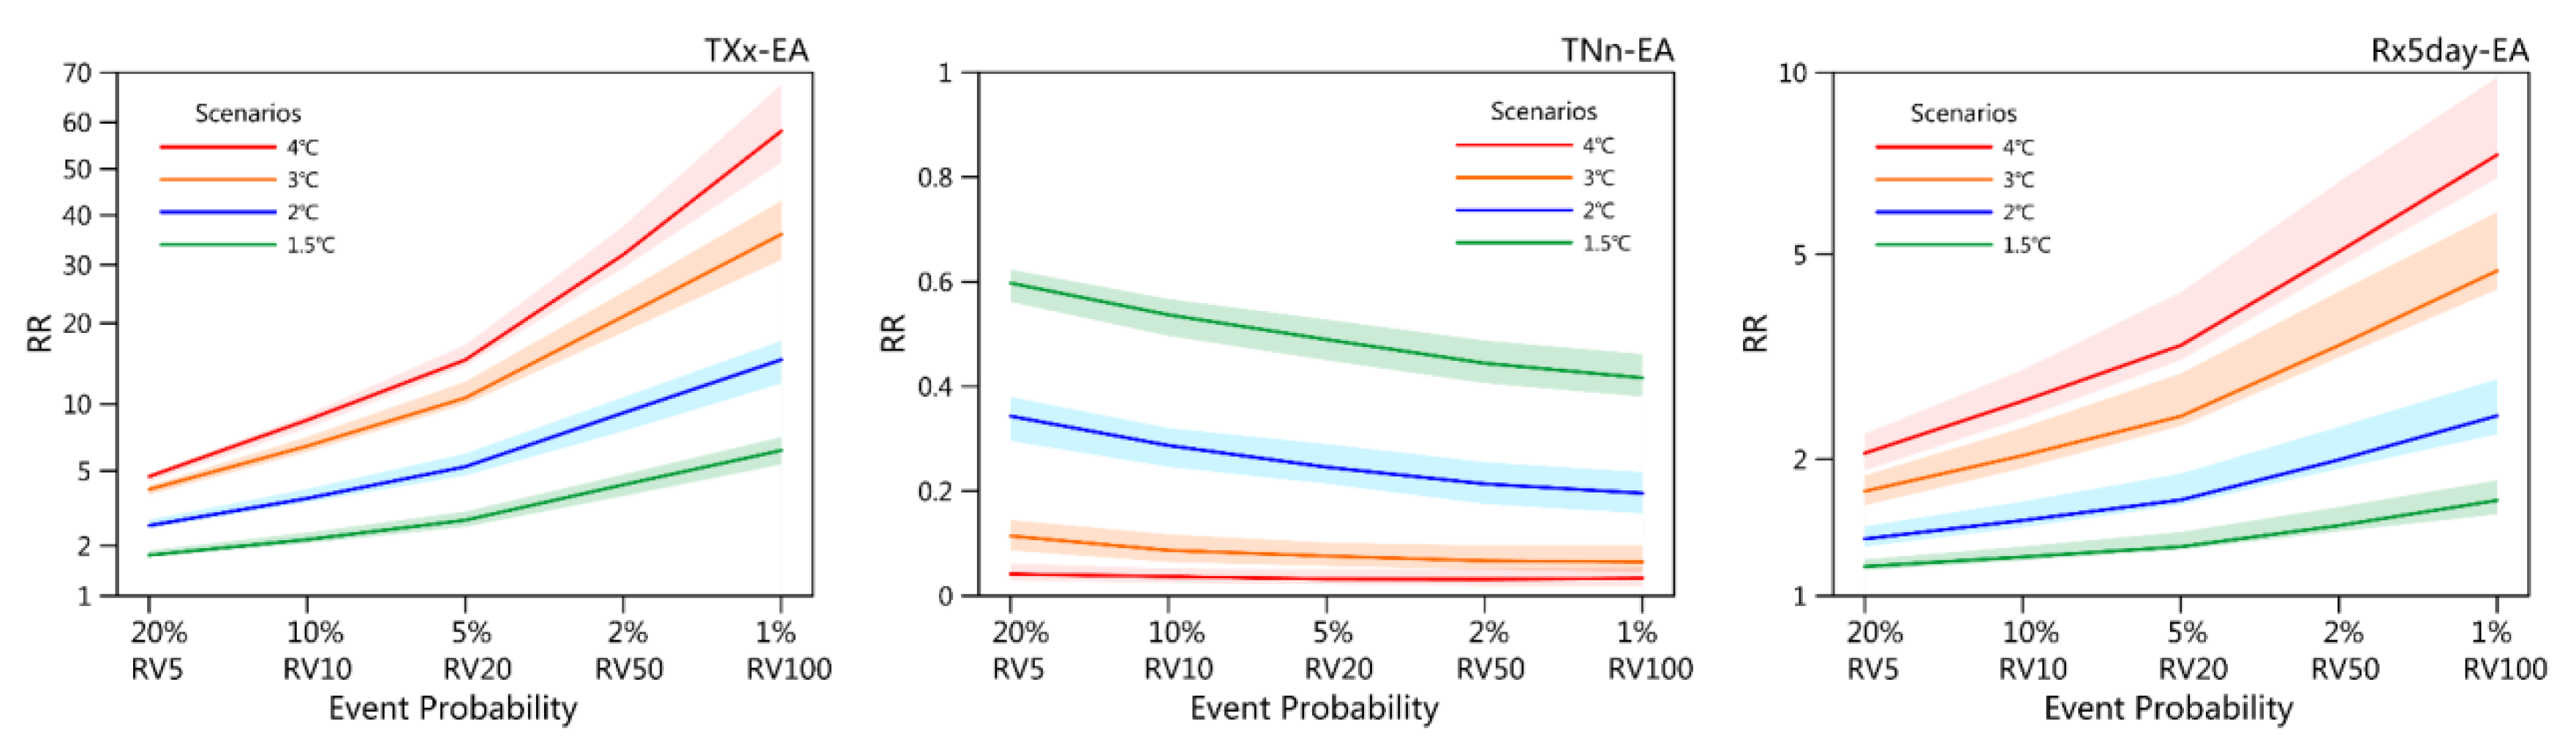
The regional average RRs over EA for the extreme temperature and precipitation for different frequencies at different warming levels compared with the present-day climatology are displayed in Figure 6. The RR values vary for different event frequencies and different types of extremes.
Accompanying the GEV distribution shift to the right (Figure 1), the relative changes in the occurrence probability are larger for the rarer events. This means larger RRs for warm and heavy precipitation extremes with longer return periods (TXx and Rx5day), and smaller RRs for cold extremes (TNn) with longer return periods. The multi-model spreads of RR values increase with an increase in the global warming level, indicating increasing uncertainty. Further considering the sensitivity of the magnitude of the increase in the relative frequency (RR values) of events of different frequency to the enhancement of global warming, a greater increase in the relative frequency for rarer events is observed in Figure 6.
4. Discussion
Global temperature targets (e.g., 2.0/1.5 °C) are the focus of intergovernmental climate negotiations. Understanding the connection between regional climate change and global temperature targets is important for policy makers and the public, as it increases the understanding of climate change issues among non-professionals. Our results show a significant increase in the probability and intensity of regional extreme temperature and precipitation events with continuous global warming. Stipulating that global warming is limited to lower levels, the EA region is projected to benefit from robust reductions in exposure to dangerous temperature and precipitation extremes. Based on a non-stationary extreme value statistical model, our results are valid over a global warming continuum (rather than being limited to a predetermined scenario or a few discrete temperature targets, as in previous studies), which provides richer information for climate policy making.
Earlier studies mainly focus on the trends and/or spatial patterns of extreme climate changes at several certain thresholds, but it remains unclear that how climate extremes vary with continuous global warming. It is reported that some extreme climate indices are linearly correlated with global temperature changes [26,36], which is consistent with our use of a non-stationary GEV distribution. It is noticed that linear relationships are meaningful only when the associated projection uncertainties remain within reasonable bounds. Some abrupt changes in the climate system may occur due to ’tipping points’ [37] and lead to nonlinear changes in regional temperature and precipitation. Therefore, the limitations of linear assumption need to be highlighted in applications.
The risk results form a complex confluence of factors, including exposure and vulnerability [38,39,40]. Nevertheless, a simple framework that compares only the probabilities of temperature and precipitation extremes associated with different warming levels (called “risk ratios” in our study and other similar studies) may be useful [41]. This is because its simplicity allows for explicit assumptions and provides a starting point for advanced approaches [42]. The changes in the magnitude of RRs estimated by our study should be accurate if we assume that the consequences of the climate extremes do not change with global warming.
5. Conclusions
We investigated the changes in temperature and precipitation extremes with respect to continuous global warming over East Asia and estimated the probabilities of those extreme events with different frequencies. We used a non-stationary GEV distribution approach and data from an ensemble of Global Climate Models (GCMs) from the Fifth Coupled Climate Model Intercomparison Project (CMIP5). The main findings are summarized as follows:
- (1)
- There will be a significant increase in warm (TXx) and heavy precipitation (Rx5day) extremes—but a significant decrease in cold (TNn) extremes—in a warmer climate with the GEV distribution shift to the right.
- (2)
- Significantly larger changes in the probabilities of the extreme events will be seen with higher global warming levels. The probability that a warm extreme exceeding the 20-year RV of current climate conditions over EA is projected to increase to 2.8, 5.2, 10.6, and 14.9 times the present-day value at the 1.5 °C, 2 °C, 3 °C, and 4 °C warming levels, respectively. The probability that extreme heavy precipitation with the same frequency over EA is projected to increase to 1.3, 1.6, 2.5, and 3.4 times the present-day value at the above four warming levels, respectively. The probability that a cold extreme with same frequency over EA is projected to decrease to 0.49, 0.25, 0.08, and 0.03 times the present-day value at the above four warming levels, respectively. Moreover, the relative changes in the probability are larger for rarer events.
Supplementary Materials
The following are available online at https://www.mdpi.com/2073-4441/11/12/2535/s1, Table S1: basic information of 31 Global Climate Models (GCMs) from the Coupled Model Intercomparison Project Phase 5 (CMIP5), Figure S1: the time series of regional average TXx, TNn and Rx5day over East Asia and the four subregions, a comparison of observed data and CMIP5 simulated data. Blue solid lines indicate the observed time series and blue dashed lines denote linear trends. Black lines and shades indicate the simulated time series of multi-model median and interquartile range, respectively, and linear trends of the multi-model median are shown in black dashed lines correspondingly. Only the common parts of the OBS and MME series are adopted to estimate linear trends, Figure S2: the spatial patterns of present climatology of annual mean precipitation, Rx5day, and CDD over East Asia (EA), based on observed (OBS) data and multi-model ensemble median (MME) from CMIP5, Figure S3: the regional average of the location parameter () and the log of the scale parameter () over EA, fitted to simulated TXx (a), TNn (b), and Rx5day (c) of 31 individual CMIP5 models (in different color lines), with corresponding global mean warming. Figure S4 corresponds to Figure S3, but for region means of four subregions. Figure S5: The number of GCMs with statistically significant results (based on Student’s t test, α = 0.05) in fitting results of Generalized Extreme Value distribution (GEV) parameter, Figure S6: the multi-model median 20- and 50-year return valves (RVs) of annual warm and cold temperature extremes as well as annual 5-day precipitation extremes, at present-day climate. Figure S7 corresponds to Figure 2, but for changes in 50-year RVs of annual warm and cold temperature extremes. Figure S8 corresponds to Figure 3, but for changes in 50-year RVs of annual 5-day precipitation extremes. Figure S9 corresponds to Figure 4, but for extremes defined as accumulations that exceed current 50-year RVs. Figure S10 corresponds to Figure 5, but for extremes defined as accumulations that exceed current 50-year RVs. Figure S11 corresponds to Figure 6, but for regional averages of four subregions.
Author Contributions
Writing-original draft preparation, J.Z.; writing-extensively revised writing, F.W.
Funding
This work was supported by the National Key Research and Development Program of China(2016YFA0602704), the Strategic Leading Science and Technology Program of the Chinese Academy of Sciences (XDA20020202), and the National Natural Science Foundation of China (41771050).
Acknowledgments
We would like to thank four anonymous reviewers for their helpful comments.
Conflicts of Interest
The authors declare no conflict of interest.
References
- IPCC. Climate Change 2014: Synthesis Report. Contribution of Working Groups I, II and III to the Fifth Assessment Report of the Intergovernmental Panel on Climate Change; Cambridge University Press: Cambridge, UK; New York, NY, USA, 2014. [Google Scholar]
- IPCC. Managing the Risks of Extreme Events and Disasters to Advance Climate Change Adaptation. A Special Report of Working Groups I and II of the Intergovernmental Panel on Climate Change; Cambridge University Press: Cambridge, UK; New York, NY, USA, 2012. [Google Scholar]
- Bank, W. Turn down the Heat: Climate Extremes, Regional Impacts, and the Case for Resilience; A Report for the World Bank by the Potsdam Institute for Climate Impact Research and Climate Analytics; The World Bank: Washington, DC, USA, 2012. [Google Scholar]
- Alexander, L.V.; Zhang, X.; Peterson, T.C.; Caesar, J.; Gleason, B.; Klein Tank, A.M.G.; Haylock, M.; Collins, D.; Trewin, B.; Rahimzadeh, F.; et al. Global observed changes in daily climate extremes of temperature and precipitation. J. Geophys. Res. Atmos. 2006, 111. [Google Scholar] [CrossRef]
- Frich, P.; Alexander, L.V.; Della-Marta, P.; Gleason, B.; Haylock, M.; Tank, A.M.G.K.; Peterson, T. Observed coherent changes in climatic extremes during the second half of the twentieth century. Clim. Res. 2002, 19, 193–212. [Google Scholar] [CrossRef]
- Sillmann, J.; Kharin, V.V.; Zwiers, F.W.; Zhang, X.; Bronaugh, D. Climate extremes indices in the CMIP5 Multi-model ensemble: Part 2. Future climate projections. J. Geophys. Res. Atmos. 2013, 118, 2473–2493. [Google Scholar] [CrossRef]
- Zhou, B.; Wen, Q.H.; Xu, Y.; Song, L.; Zhang, X. Projected Changes in Temperature and Precipitation Extremes in China by the CMIP5 Multi-model Ensembles. J. Clim. 2014, 27, 6591–6611. [Google Scholar] [CrossRef]
- Ying, X.; Jie, W.; Ying, S.; Bo-Tao, Z.; Rou-Ke, L.; Jia, W. Change in Extreme Climate Events over China Based on CMIP5. Atmos. Ocean. Sci. Lett. 2015, 8, 185–192. [Google Scholar] [CrossRef]
- Xu, Y.; Zhou, B.-T.; Wu, J.; Han, Z.-Y.; Zhang, Y.-X.; Wu, J. Asian climate change under 1.5–4 °C warming targets. Adv. Clim. Chang. Res. 2017, 8, 99–107. [Google Scholar] [CrossRef]
- Shi, C.; Jiang, Z.-H.; Chen, W.-L.; Li, L. Changes in temperature extremes over China under 1.5 °C and 2 °C global warming targets. Adv. Clim. Chang. Res. 2018, 9, 120–129. [Google Scholar] [CrossRef]
- Zhang, X.; Alexander, L.; Hegerl, G.C.; Jones, P.; Tank, A.K.; Peterson, T.C.; Trewin, B.; Zwiers, F.W. Indices for monitoring changes in extremes based on daily temperature and precipitation data. Wiley Interdiscip. Rev. Clim. Chang. 2011, 2, 851–870. [Google Scholar] [CrossRef]
- United Nations Framework Convention on Climate (UNFCCC). Adoption of the Paris Agreement: Proposal by the President; FCCC/CP/2015/L.9/Rev.1; UNFCCC: Geneva, Switzerland, 2015. [Google Scholar]
- UNFCCC. Synthesis Report on the Aggregate Effect of the Intended Nationally Determined Contributions; FCCC/CP/2015/7; United Nations Office UNFCCC: Paris, France, 2015. [Google Scholar]
- Van Vuuren, D.P.; Edmonds, J.; Kainuma, M.; Riahi, K.; Thomson, A.; Hibbard, K.; Hurtt, G.C.; Kram, T.; Krey, V.; Lamarque, J.F.; et al. The representative concentration pathways: An overview. Clim. Chang. 2011, 109, 5–31. [Google Scholar] [CrossRef]
- Dosio, A.; Fischer Erich, M. Will Half a Degree Make a Difference? Robust Projections of Indices of Mean and Extreme Climate in Europe Under 1.5 °C, 2 °C, and 3 °C Global Warming. Geophys. Res. Lett. 2017, 45, 935–944. [Google Scholar] [CrossRef]
- Schleussner, C.-F.; Lissner, T.K.; Fischer, E.M.; Wohland, J.; Perrette, M.; Golly, A.; Rogelj, J.; Childers, K.; Schewe, J.; Frieler, K.; et al. Differential climate impacts for policy-relevant limits to global warming: The case of 1.5 °C and 2 °C. Earth Syst. Dyn. 2016, 7, 327–351. [Google Scholar] [CrossRef]
- Zhang, W.; Zhou, T.; Zou, L.; Zhang, L.; Chen, X. Reduced exposure to extreme precipitation from 0.5 °C less warming in global land monsoon regions. Nat. Commun. 2018, 9, 3153. [Google Scholar] [CrossRef] [PubMed]
- Steinacher, M.; Joos, F.; Stocker, T.F. Allowable carbon emissions lowered by multiple climate targets. Nature 2013, 499, 197–201. [Google Scholar] [CrossRef] [PubMed]
- Rogelj, J.; Luderer, G.; Pietzcker, R.C.; Kriegler, E.; Schaeffer, M.; Krey, V.; Riahi, K. Energy system transformations for limiting end-of-century warming to below 1.5 °C. Nat. Clim. Chang. 2015, 5, 519. [Google Scholar] [CrossRef]
- UNFCCC. National Inventory Submissions; UNFCCC: Bonn, Germany, 2019. [Google Scholar]
- Rogelj, J.; den Elzen, M.; Höhne, N.; Fransen, T.; Fekete, H.; Winkler, H.; Schaeffer, R.; Sha, F.; Riahi, K.; Meinshausen, M. Paris Agreement climate proposals need a boost to keep warming well below 2 °C. Nature 2016, 534, 631. [Google Scholar] [CrossRef]
- CAT. Addressing Global Warming. Available online: https://climateactiontracker.org/global/temperatures/ (accessed on 24 July 2019).
- Wang, F.; Tokarska, K.B.; Zhang, J.; Ge, Q.; Hao, Z.; Zhang, X.; Wu, M. Climate Warming in Response to Emission Reductions Consistent with the Paris Agreement. Adv. Meteorol. 2018, 2018, 1–9. [Google Scholar] [CrossRef]
- Betts, R.A.; Collins, M.; Hemming, D.L.; Jones, C.D.; Lowe, J.A.; Sanderson, M.G. When could global warming reach 4 °C? Philos. Trans. R. Soc. A Math. Phys. Eng. Sci. 2011, 369, 67–84. [Google Scholar] [CrossRef]
- Sanderson, M.G.; Hemming, D.L.; Betts, R.A. Regional temperature and precipitation changes under high-end (≥4 °C) global warming. Philos. Trans. R. Soc. A Math. Phys. Eng. Sci. 2011, 369, 85–98. [Google Scholar] [CrossRef]
- Seneviratne, S.I.; Donat, M.G.; Pitman, A.J.; Knutti, R.; Wilby, R.L. Allowable CO2 emissions based on regional and impact-related climate targets. Nature 2016, 529, 477. [Google Scholar] [CrossRef]
- Taylor, K.E.; Stouffer, R.J.; Meehl, G.A. An Overview of CMIP5 and the Experiment Design. Bull. Am. Meteorol. Soc. 2011, 93, 485–498. [Google Scholar] [CrossRef]
- Kharin, V.V.; Zwiers, F.W.; Zhang, X.; Wehner, M. Changes in temperature and precipitation extremes in the CMIP5 ensemble. Clim. Chang. 2013, 119, 345–357. [Google Scholar] [CrossRef]
- Cox, D.R.; Hinkley, D.V. Theoretical Statistics; Chapman and Hall: London, UK, 1974; p. 511. [Google Scholar]
- Milly, P.C.D.; Betancourt, J.; Falkenmark, M.; Hirsch, R.M.; Kundzewicz, Z.W.; Lettenmaier, D.P.; Stouffer, R.J. Stationarity Is Dead: Whither Water Management? Science 2008, 319, 573. [Google Scholar] [CrossRef] [PubMed]
- Huang, J.; Yu, H.; Dai, A.; Wei, Y.; Kang, L. Drylands face potential threat under 2 °C global warming target. Nat. Clim. Chang. 2017, 7, 417. [Google Scholar] [CrossRef]
- Robert, V.; Andreas, G.; Stefan, S.; Erik, K.; Annemiek, S.; Paul, W.; Thomas, M.; Oskar, L.; Grigory, N.; Claas, T.; et al. The European climate under a 2 °C global warming. Environ. Res. Lett. 2014, 9, 034006. [Google Scholar]
- Mueller, B.; Seneviratne, S.I. Hot days induced by precipitation deficits at the global scale. Proc. Natl. Acad. Sci. USA 2012, 109, 12398. [Google Scholar] [CrossRef] [PubMed]
- Allen, M.R.; Ingram, W.J. Constraints on future changes in climate and the hydrologic cycle. Nature 2002, 419, 224. [Google Scholar] [CrossRef]
- Wang, B.; Bao, Q.; Hoskins, B.; Wu, G.; Liu, Y. Tibetan Plateau warming and precipitation changes in East Asia. Geophys. Res. Lett. 2008, 35. [Google Scholar] [CrossRef]
- Wang, X.; Jiang, D.; Lang, X. Future extreme climate changes linked to global warming intensity. Sci. Bull. 2017, 62, 1673–1680. [Google Scholar] [CrossRef]
- Lenton, T.M.; Held, H.; Kriegler, E.; Hall, J.; Lucht, W.; Rahmstorf, S.; Schellnhuber, H. Tipping elements in the Earth’s climate system. Proc. Natl. Acad. Sci. USA 2007, 105, 1786–1793. [Google Scholar] [CrossRef]
- Handmer, J.; Honda, Y.; Kundzewicz, Z.W.; Arnell, N.; Benito, G.; Hatfield, J.; Mohamed, I.F.; Peduzzi, P.; Wu, S.; Sherstyukov, B.; et al. Changes in impacts of climate extremes: Human systems and ecosystems. In Managing the Risks of Extreme Events and Disasters to Advance Climate Change Adaptation; Field, C.B., Barros, V., Stocker, T.F., Qin, D., Dokken, D.J., Ebi, K.L., Mastrandrea, M.D., Mach, K.J., Plattner, G.-K., Allen, S.K., et al., Eds.; Cambridge University Press: Cambridge, UK; New York, NY, USA, 2012; pp. 231–290. [Google Scholar]
- Leonard, M.; Westra, S.; Phatak, A.; Lambert, M.; van den Hurk, B.; McInnes, K.; Risbey, J.; Schuster, S.; Jakob, D.; Stafford-Smith, M. A compound event framework for understanding extreme impacts. Wiley Interdiscip. Rev. Clim. Chang. 2014, 5, 113–128. [Google Scholar] [CrossRef]
- Oppenheimer, M.; Campos, M.; Warren, R.; Birkmann, J.; Luber, G.; O’Neill, B.; Takahashi, K. Emergent risks and key vulnerabilities. In Climate Change 2014: Impacts, Adaptation, and Vulnerability. Part A: Global and Sectoral Aspects; Contribution of Working Group II to the Fifth Assessment Report of the Intergovernmental Panel on Climate Change; Field, C.B., Barros, V.R., Dokken, D.J., Mach, K.J., Mastrandrea, M.D., Bilir, T.E., Chatterjee, M., Ebi, K.L., Estrada, Y.O., Genova, R.C., et al., Eds.; Cambridge University Press: Ambridge, UK; New York, NY, USA, 2014. [Google Scholar]
- National Academies of Sciences, Engineering, and Medicine. Attribution of Extreme Weather Events in the Context of Climate Change; The National Academies Press: Washington, DC, USA, 2016. [Google Scholar]
- Kharin, V.V.; Flato, G.M.; Zhang, X.; Gillett, N.P.; Zwiers, F.; Anderson, K.J. Risks from Climate Extremes Change Differently from 1.5 °C to 2.0 °C Depending on Rarity. Earth’s Future 2018, 6, 704–715. [Google Scholar] [CrossRef]
Figure 1.
The probability density function (PDF, top) and cumulative distribution function (CDF, bottom) for annual warm temperature extremes (TXx) for the grid box containing Beijing, China at different global warming levels, based on Multi-model median. The PDFs and CDFs at the present-day climate (black curves) and 1.5 °C (green), 2 °C (blue), 3 °C (orange), and 4 °C (red) global warming levels are displayed. The vertical solid lines show the 20-year RV. Horizontal dashed lines indicate the expected CDFs (return periods) at different warming levels for a current 1-in-20-year warm extreme ().

Figure 2.
Multi-model median changes in the 20-year return value (RV) for annual warm and cold temperature extremes at different global warming levels (= 1.5 °C, 2 °C, 3 °C, and 4 °C) relative to the present-day level.
Figure 2.
Multi-model median changes in the 20-year return value (RV) for annual warm and cold temperature extremes at different global warming levels (= 1.5 °C, 2 °C, 3 °C, and 4 °C) relative to the present-day level.

Figure 3.
Multi-model median changes in the 20-year RV for annual 5-day precipitation extremes at four global warming levels (= 1.5 °C, 2 °C, 3 °C, and 4 °C) relative to the present-day level.
Figure 3.
Multi-model median changes in the 20-year RV for annual 5-day precipitation extremes at four global warming levels (= 1.5 °C, 2 °C, 3 °C, and 4 °C) relative to the present-day level.

Figure 4.
Multi-model median risk ratios (RRs) for warm (TXx) and cold (TNn) extremes at four global warming levels (= 1.5 °C, 2 °C, 3 °C, and 4 °C). The extremes are seen to be TXx and TNn accumulations that exceed current 20-year RVs.
Figure 4.
Multi-model median risk ratios (RRs) for warm (TXx) and cold (TNn) extremes at four global warming levels (= 1.5 °C, 2 °C, 3 °C, and 4 °C). The extremes are seen to be TXx and TNn accumulations that exceed current 20-year RVs.

Figure 5.
Multi-model median RRs for precipitation extremes at four global warming levels (= 1.5 °C, 2 °C, 3 °C, and 4 °C). The extremes are observed to be Rx5day accumulations that exceed current 20-year RVs.
Figure 5.
Multi-model median RRs for precipitation extremes at four global warming levels (= 1.5 °C, 2 °C, 3 °C, and 4 °C). The extremes are observed to be Rx5day accumulations that exceed current 20-year RVs.

Figure 6.
Regional average RRs for warm extremes (TXx), cold extremes (TNn), and heavy precipitation extremes (Rx5day) over EA for different event probabilities (1.5 °C, 2 °C, 3 °C, and 4 °C global warming) relative to event probabilities in the present-day climate at four global warming levels (= 1.5 °C, 2 °C, 3 °C, and 4 °C). The lines and shades indicate multi-model medians and interquartile ranges, respectively. Concerning results of the subregions, refer to Figure S11.


Table 1.
Definitions of extreme temperature and precipitation indices.
| Name | Definition (Unit) |
|---|---|
| TXx | Annual maximum daily maximum temperature (°C) |
| TNn | Annual minimum daily minimum temperature (°C) |
| Rx5day | Annual maximum consecutive 5-day precipitation (mm) |
© 2019 by the authors. Licensee MDPI, Basel, Switzerland. This article is an open access article distributed under the terms and conditions of the Creative Commons Attribution (CC BY) license (http://creativecommons.org/licenses/by/4.0/).
Share and Cite
MDPI and ACS Style
Zhang, J.; Wang, F. Changes in the Risk of Extreme Climate Events over East Asia at Different Global Warming Levels. Water 2019, 11, 2535. https://doi.org/10.3390/w11122535
AMA Style
Zhang J, Wang F. Changes in the Risk of Extreme Climate Events over East Asia at Different Global Warming Levels. Water. 2019; 11(12):2535. https://doi.org/10.3390/w11122535
Chicago/Turabian StyleZhang, Jintao, and Fang Wang. 2019. "Changes in the Risk of Extreme Climate Events over East Asia at Different Global Warming Levels" Water 11, no. 12: 2535. https://doi.org/10.3390/w11122535
Note that from the first issue of 2016, this journal uses article numbers instead of page numbers. See further details here.