Article

Effect of Urban Stormwater Road Runoff of Different Land Use Types on an Urban River in Shenzhen, China

1
State Key Laboratory of Simulation and Regulation of Water Cycle in River Basin, China Institute of Water Resources and Hydropower Research, Beijing 100038, China
2
College of Hydrology and Water Resources, Hohai University, Nanjing 210098, China
3
Department of Water Environment, China Institute of Water Resources and Hydropower Research, Beijing 100038, China
4
China Construction Water & Environment Co., Ltd, Shenzhen 518000, China
*
Authors to whom correspondence should be addressed.
Water 2019, 11(12), 2545; https://doi.org/10.3390/w11122545
Submission received: 8 November 2019 / Revised: 26 November 2019 / Accepted: 27 November 2019 / Published: 2 December 2019
(This article belongs to the Special Issue Rainwater Management in Urban Areas)

Abstract

:
Urban storm runoff is a major source of pollutants in receiving water bodies. To assess the impact of urban stormwater runoff on an urban river, the runoff process of total suspended solids (TSS), chemical oxygen demand (COD), ammonium (NH4), and total phosphorus (TP) were investigated on road surfaces classified as arterial road (AR), residential area (RA), and industrial area (IA) in the Pingshan River (PSR) watershed in Shenzhen, China. Event mean concentration (EMC) was calculated to analyze the water quality of road runoff, and the dimensionless M(V) cumulative curves were used to estimate the course of decreasing concentration of runoff pollutants during each rainfall event. Multicriteria decision making methods (PROMETHEE-GAIA) were used to identify the linkage between runoff pollutants, land use types, and rainfall intensity. The EMCs of COD and TP in runoff exceeded the class IV level of the water quality standard for surface water (China). RA was a major potential source for NH4, COD, and TP in the river. Controlling the first flush is critical to decrease the effect of road runoff on receiving water bodies, as most runoff pollutants in AR, RA, and IA had a first flush effect during heavy rainfall. The specific management measure for runoff pollution varied with land use type. Reducing road TSS concentrations was effective for controlling runoff pollution in AR and RA because NH4, TP, and COD attached to particulate matter. In IA, the collection and reuse of stormwater in the initial rainfall period were effective for reducing the effect of soluble pollutants in runoff on receiving water bodies. This study provides new information for managing urban road stormwater runoff in different land use types.

1. Introduction

The increasing impervious surface cover (ISC) accompanying urbanization has led to change in watershed hydrology [1,2,3] and to the increase of stormwater runoff and reduction of evapotranspiration and infiltration [4,5], which cause large urban road runoff to flow into rivers during rainfall events [1]. Increased ISC has been shown to be closely related to the increased concentrations of urban stream-water nitrogen (N), phosphorus (P), and dissolved oxygen carbon (DOC) because most of these pollutants can be directly transported into urban rivers with surface runoff [1,2,3,6,7]. Thus, surface runoff is one of the major factors influencing water quality in urban rivers [3]. The higher the ISC, the higher the pollutant export rates to rivers as a result of the increased runoff [1,8].
N, P, DOC, and heavy metals have been identified as the major pollutants in urban surface runoff [3,6,8,9,10,11,12]. Some studies have indicated that urban stormwater runoff pollutant loads for TSS, chemical oxygen demand (COD), N, and P usually exceeded the Class V level of the water quality standard for surface water in China (WQS, GB3838-2002) [13]. Land use type (such as residential areas (RA), arterial roads (AR), and industrial areas (IA)) and traffic intensity in the study areas are the key factors influencing the pollution degree [1,14,15,16,17]. In general, the highest TSS and heavy metal concentrations at the surface usually appear in AR because of the high traffic volume [15,18,19,20,21]. RA and IA have relatively higher N, P, and organic matter concentrations because of the various litter types in domestic and industrial wastes [6,21,22]. High-density residential areas usually produce more polluted runoff than low-density residential areas [14,23]. Moreover, the first flush effect and seasonal variation of rainfall intensity are important factors that affect the surface pollutant runoff processes [14,17]. The runoff after the first flush is often regarded as the most polluted portion of the urban stormwater runoff [13,14]. In general, the first flush effect assumes that a certain amount of pollutants (e.g., 40% to 80%) is carried within a certain volume of runoff (e.g., 20% to 30%) [14,24]. However, only some runoff events show first flush behavior, which is dependent on rain intensity, duration, the length of the dry period before rain, and the character of the catchment area [13,14,25]. Study of the first flush effect of pollutant load on receiving water bodies would help us to better understand the nutrient delivery from surface runoff and develop appropriate water management strategies in different land use areas.
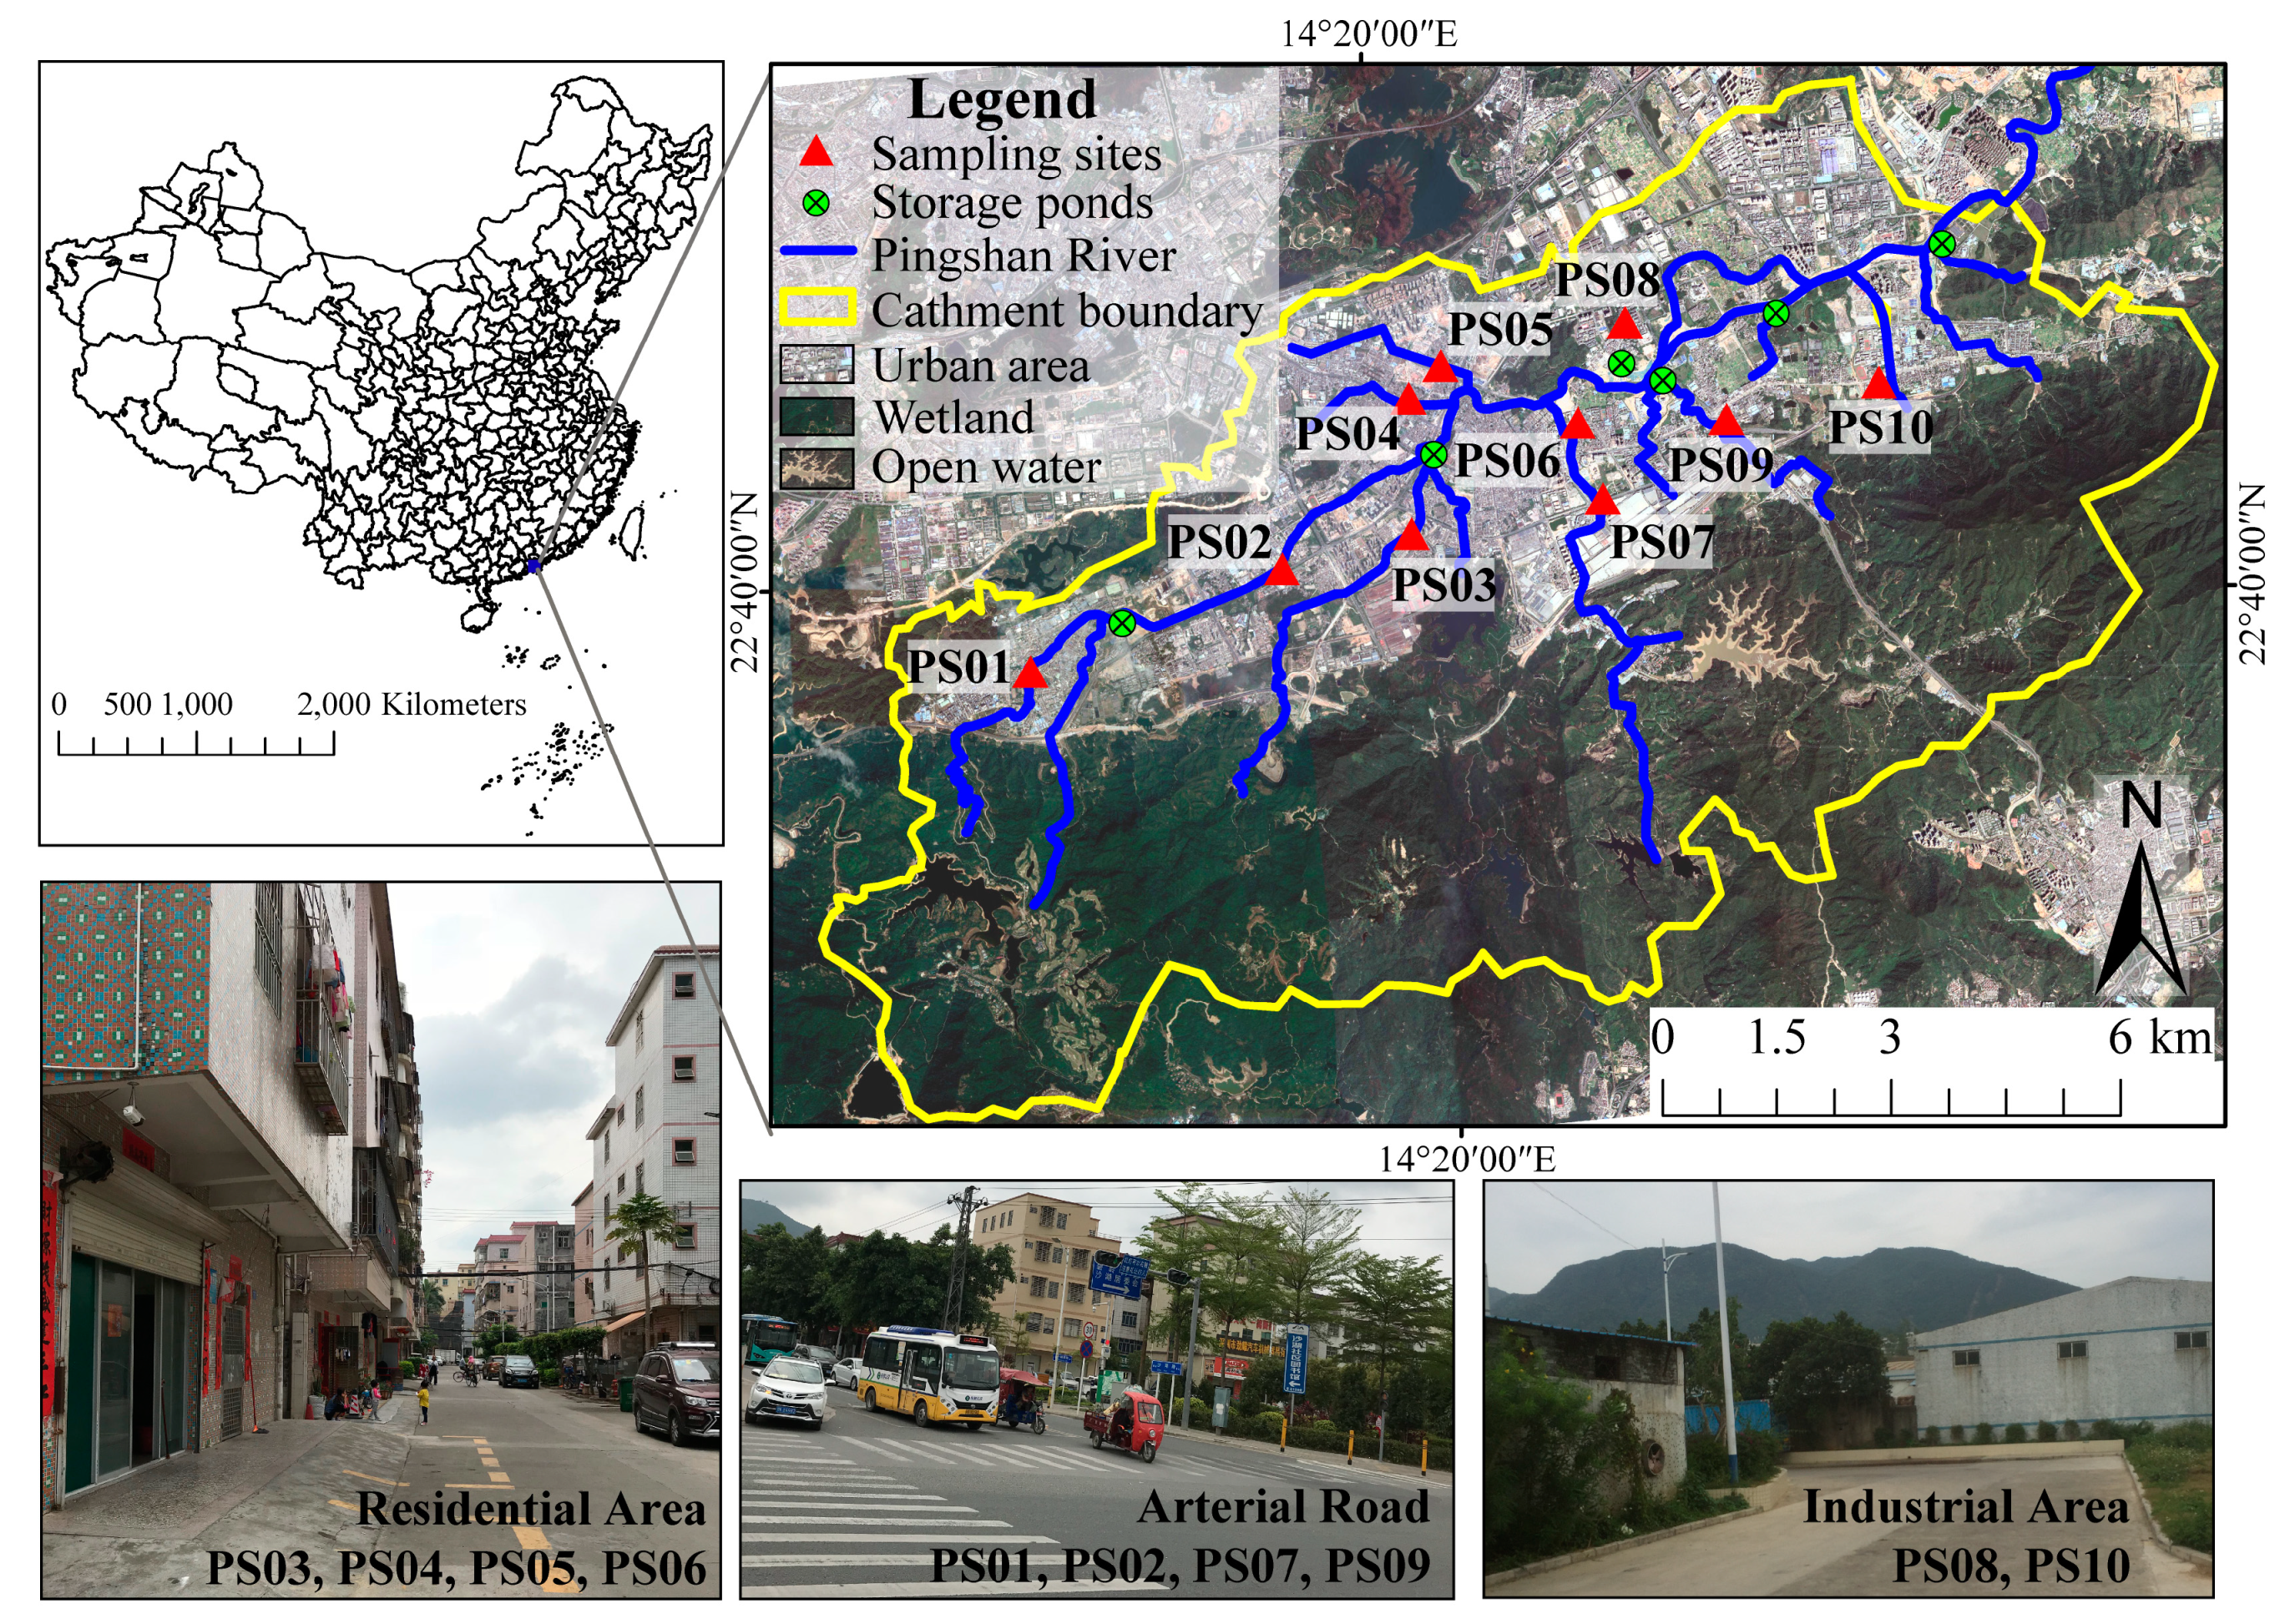
Pingshan River (PSR) is a typical rain-source urban river in Shenzhen, which is the fastest growing city in the last 40 years in China [11]. With the increase of ISC in urbanization, urban stormwater runoff has exceeded agricultural source pollution and become the main source of pollutants in the PSR watershed [26]. Thus, study of urban runoff pollution in the PSR watershed plays an important role in water quality management and ecological protection of PSR. This study aimed to demonstrate the variations of pollutants in surface road runoff and the related influencing factors, based on an investigation during five rainfall events. The first flush effect was assessed based on the pollutant dynamics in areas with different land use types (RA, AR, and IA). The results can be used as a reference for more effective municipal water management and prevention of surface runoff pollution in urban areas.

2. Materials and Methods

2.1. Study Area and Sample Collection

The PSR is a typical rain-source urban river located at Pingshan district in Shenzhen. This river has high volumes of precipitation runoff because runoff and flood peak volumes are closely linked to precipitation [4,12]. Organic pollution is the main pollution type in the PSR, and ammonium (NH4) and total phosphorus (TP) are the dominant pollutants in the river [12,27,28]. Land use type in the PSR watershed has changed rapidly with urbanization, which has led to the increase of ISC (residential and industrial land) [26,29,30]. Between 1990 and 2000, the areas sensitive to urban non-point source pollution were expanding in the PSR watershed, the average road runoff in these areas increased by 1.9%, and the loads of N and P increased from 483.2 t and 29.2 t to 498.4 t and 36.3 t per year, respectively [26]. Thus, with the development of urbanization, urban road runoff has been recognized as a major source of pollutants in the PSR watershed under the effect of various anthropogenic activities [16].

2.2. Sampling and Physicochemical Analyses

Five rainfall events were investigated in April (14 April 2018 and 15 April 2018) and August (10 August 2018, 11 August 2018, and 12 August 2018) in 2018 (Table 1). According to the dominant pollutant components in the PSR, we examined the concentration of TSS, DOC, NH4, and TP in runoff. Three types of urban land use (classified as AR, RA, and IA roads) were determined as potential sources of these pollutants. The ten sampling sites from three land-use types were collected during the first rainfall to identify the effect of land use on runoff pollutants (Table 2). According the result of the UPGMA clustering, PS02, PS04, and PS08 were chosen as the representative sites for each land type, and samples from these sites were collected from five rainfall events (including the first rainfall event) to explore the effect of rainfall intensities on pollutant concentrations (Figure 1). Samples were collected manually from the concrete road surfaces close to road drain pipes. Sampling commenced from the beginning of each runoff event and stopped at the end of runoff or after 1 h had elapsed, because the flush peak can usually be observed within 1 h of the start of runoff. Sampling was conducted at approximately 2–5 min intervals before the first 40 min until the peak flow was reached and 10 min intervals after 40 min. Samples were collected in four 200 mL acid washed polyethylene bottles in each sampling site for subsequent analyses. The runoff loads of pollutants were considered to be influenced by different factors; thus, effects of the following factors were examined in our study. Antecedent dry days (ADD), PM2.5 and PM10 in air during ADD, traffic volume, population, and pedestrian volume were considered to be related to pollutant deposition, whereas rainfall type, rainfall duration, and rainfall intensity were considered to be related to pollutant diffusion. These data are presented in Table 1 and Table 2 for each event.
The samples were transported to the laboratory for analysis, and analytical methods were performed using techniques according to Standard Method [31]. The TSS contents were measured by filtration, drying at 103–105 °C and weighing. The COD was measured following the open reflux method using dichromate for oxidation. The NH4 content was measured by the indophenol colorimetric method, and TP was measured by the persulfate digestion and ascorbic acid method.

2.3. Sampling Data Analysis

The use of an event mean concentration (EMC) is appropriate for evaluating the effect of runoff on the receiving water body because the pollutant concentration often varies by several orders of magnitude during a runoff event [32]. EMC represents a flow weighted average concentration, computed as the total pollutant load divided by the total runoff volume, for an event of duration tr [33]. A definition of the first flush is the initial period of stormwater runoff during the concentration of pollutants is substantially higher than those observed during the latter stages of the storm event [33]. The dimensionless normalized mass and flow volumes are taken from the urban stormwater runoff as follows, where (1) represents the EMC and (2) represents the first flush phenomenon:
EMC = M V = 0 t r C t Q t d t 0 t r Q t d t   C t Q t Δ t   Q t Δ t
M F F n = 0 t r C t Q t d t / M 0 t r Q t d t / V
where EMC is the event mean concentration (mg/L); MFFn is the first flush rate of runoff pollutants, which represents the first n% runoff that contains the ratio of the cumulative pollutant load ratio and cumulative runoff ratio; M is the mass of pollutant over entire event duration (g); V is the total volume of flow over entire event duration (m3); t is the time (min); Ct is the time variable concentration (mg/L); Qt is the time variable flow (m3/min); and ∆t is the discrete time interval (min).
The dimensionless M(V) cumulative curves of runoff pollutants were used to analyze the first flush phenomenon in rainfall events [25,33,34,35,36]:
M F F ( X ) = X b
where b is the first flush coefficient, and MFFn was calculated as the total load of pollutant transported by the first n% of runoff.
We applied Equations (2) and (3) using the functions for the nonlinear regressions shown in Figure 2 to estimate the course of decreasing concentration of pollutants in runoff during each rainfall event. A 45° line, when b = 1, indicates that pollutants are uniformly distributed throughout the runoff events. First flush occurs when b > 1, while a first flush fails to occur when b < 1. Different researchers have different criteria for the load threshold over which the first flush is considered significant. Some researchers defined the phenomenon in terms of the pollution load in the first 20%, 25%, and 30% of the event volume, which could be called 20/40, 25/50, 30/60 and 30/80, respectively [14,24,37,38,39].

2.4. Statistical Analyses

Initial data handling such as scatter plots of the temporal data, box plots and other descriptive statistical analyses were performed using OriginLab 9.0 software (OriginLab Corporation, Northampton, MA, USA). Hierarchical cluster analysis (HCA) was performed to identify similar groups of runoff pollutants depending on the origin and concentration. The HCA was performed on the four variables in three land use types during two rainfall patterns, using a distance cluster between 0 and 25. The data were standardized before clustering in HCA. The data were first standardized to Z core (with a mean of 0 and a standard variation of 1) and then classified with Ward’s method. The distance measure was the Squared Euclidean distance. A distance criterion between two variables defined how closely they were associated within the group, and the smaller the clustering distance, the higher the similarity of the data points [9,10,40]. HCA by means of hierarchical dendrograms was performed by using SPSS 24.0 (IBA SPSS Statistics, Armonk, NY, USA) applied to the runoff data for different land use types. To describe the relationships of pollutants for each pair of samples, R software (Lucent Technologies, Murray Hill, NJ, USA) was used to perform the unweighted pair group method with arithmetic mean (UPGMA) clustering. Pearson’s correlation analyses were performed to assess the relationships between variables with SPSS software.
Multivariate data analysis techniques were used to identify the linkage between runoff pollutants, land use types, and rainfall types. In this study, multicriteria decision making methods (MCDM), namely PROMETHEE-GAIA, were selected for the data analysis [20,41]. PROMETHEE-GAIA has been increasingly employed to handle multivariate data in environmental data analysis [20,42]. PROMETHEE, a non-parametric ranking analysis procedure, was used to rank the pollutant contents of the samples at each site. GAIA is a visualization software, which displays PROMETHEE results as simple principal component analysis biplots. These methods have a high capability for ranking and pattern recognition even with a small amount of data.

3. Results

3.1. Stormwater Urban Runoff Quality from Different Land Use Types

The EMCs obtained in this study are presented in Table 3. According to the water quality standard for surface water in China (WQS, GB3838-2002), the average value of COD (45.38, 110.43, and 61.10 mg/L) and TP (0.44, 0.56, and 45.38 mg/L) in AR, RA, and IA, respectively, exceeded the Class IV values of WQS (Table 3). The TSS content in AR (148.7 mg/L) and RA (208.9 mg/L) was about threefold that in IA (56.61 mg/L). The concentrations of COD and NH4 were higher in RA than those in AR and IA.
The runoff pollutants showed clear spatial variation, which coincided with the result of the UPGMA clustering (Figure 3a). The RA samples (PS04, PS05, PS06, and PS03) comprised the first cluster, AR samples (PS01, PS02, and PS09) comprised the second cluster, and IA samples (PS08 and PS10) formed the third cluster. The HCA was performed on the four pollutants in road runoff, using a distance cluster between 0 and 25 (Figure 3b). Two clusters were identified. The first cluster contained NH4 and TP, and the second cluster consisted of COD and TSS (Figure 3b). Pearson correlation analyses showed populations, pedestrian volume, and traffic volume had positive correlations with NH4 and TP; however, these factors were not closely associated with COD and TSS (Table 4).

3.2. First Flush Load of Urban Surface Runoff

The first flush effect of the entire quality parameters was studied by plotting the cumulative pollutant mass scatters against the cumulative runoff volume as shown in Figure 4. Most of the TSS, COD, NH4, and TP cumulative mass curves for the study areas were above the 45° line during rainfall in August, suggesting a first flush effect (Figure 4c–e); however, no first flush was recorded during rainfall in April (Figure 4a,b). There was a strong first flush phenomenon in some cases, which was identified by the fact that 80% of the pollutant mass was transported in the first 30% of the runoff volume. However, this was extremely rare and was found in only 5% of the events (Table 5). Almost all of runoff pollutants in the three land use types during rainfall in August showed a first flush phenomenon, when the first flush effect was defined by at least 20% (40%) of the pollutant mass being transported in the first 25% (40%) of the volume (Table 5). In AR, the relative strength of the first flush of pollutants decreased in the order TSS > COD > NH4 > TP, whereas the sequence in RA was COD > NH4 > TSS > TP, and that of IA was NH4 > COD > TP > TSS (Table 5). Pearson correlation results showed that PM2.5 and PM10 were strongly associated with COD (MFF30) in AR and IA and were also closely associated with TP in AR and RA. ADD did not show a close correlation with MFF30 of pollutants, except for TSS in RA (Table 6).

3.3. Effect Factors on Pollutant Loads

The PROMETHEE-GAIA analysis was undertaken considering samples for all kinds of rainfall intensities and land use types. Figure 5a showed the principal component biplot obtained from the GAIA analysis. The total data variance of 74.7% explained by the GAIA biplot indicates that the majority of the information had been included in the analysis (Figure 5). TSS, COD, NH4, and TP all showed positive loading on PC1. Almost all of the heavy rain samples were located in the positive direction of PC2, and light rain samples were located in the negative direction of PC2. The RA samples were clustered in the positive direction of PC1; AR samples were scattered in the negative direction of PC1, and IA samples were scattered in the center of this graph (Figure 5a). Notably, the decision-making axis π vector points towards the AR and RA, which confirms the significance of these land use types in the pollutant build-up process. Table 7 showed outcomes of the PROMETHEE analysis. Fourteen out of eighteen most polluted objects were collected from the heavy rainfall events, and twenty out of twenty-seven least polluted objects were collected from the light rainfall events. In addition, nine out of eighteen most polluted objects from RA, and thirteen out of twenty-seven least polluted objects from IA (Table 7).
In order to thoroughly investigate the similarity among all the data points in GAIA biplot (Figure 5a), the same data set was analyzed using HCA. The resulting dendrogram using Ward linkage and Euclidean distance is shown in Figure 5b. Four clusters were identified. The first cluster featured all the data points related to TSS and COD in IA and AR, and the second cluster consisted of NH4 and TP in three land use types during two rainfall types. Moreover, TSS and COD in RA during heavy rainfall events constitute the third cluster, and TSS and COD in RA during light rainfall events constitute the fourth cluster.
Figure 6 provides box plots for the comparison of runoff pollutant concentrations for the different rainfall densities (heavy rain and light rain). The higher TSS concentrations found in RA during heavy rain with a large fluctuation range (Figure 6a). However, the fluctuation range of COD concentrations in heavy rain was narrow, especially in AR and IA. There were more outliers of COD and NH4 in RA (Figure 6b,c). Compared with AR, the fluctuation range of NH4 concentrations in RA and IA were wide, with high mean values of pollutants in heavy rain (Figure 6c). Compared with light rain, mean values of TP concentrations during heavy rain were higher in all land use types, and there was a wide fluctuation range of TP concentrations in AR and RA (Figure 6d).
The results of Pearson’s correlation analyses among pollutants are shown in Table 6. In both AR and RA, TSS was positively associated with COD and NH4 (p < 0.01). TSS was positively related with TP in RA, whereas it was negatively linked to TP in AR (p < 0.05, Figure 7). Moreover, TSS was not significantly associated with COD, NH4, or TP in IA (p > 0.05). COD was positively associated with NH4 and TP in RA and IA; however, it was not strongly related with NH4 in AR (Table 8).

4. Discussion

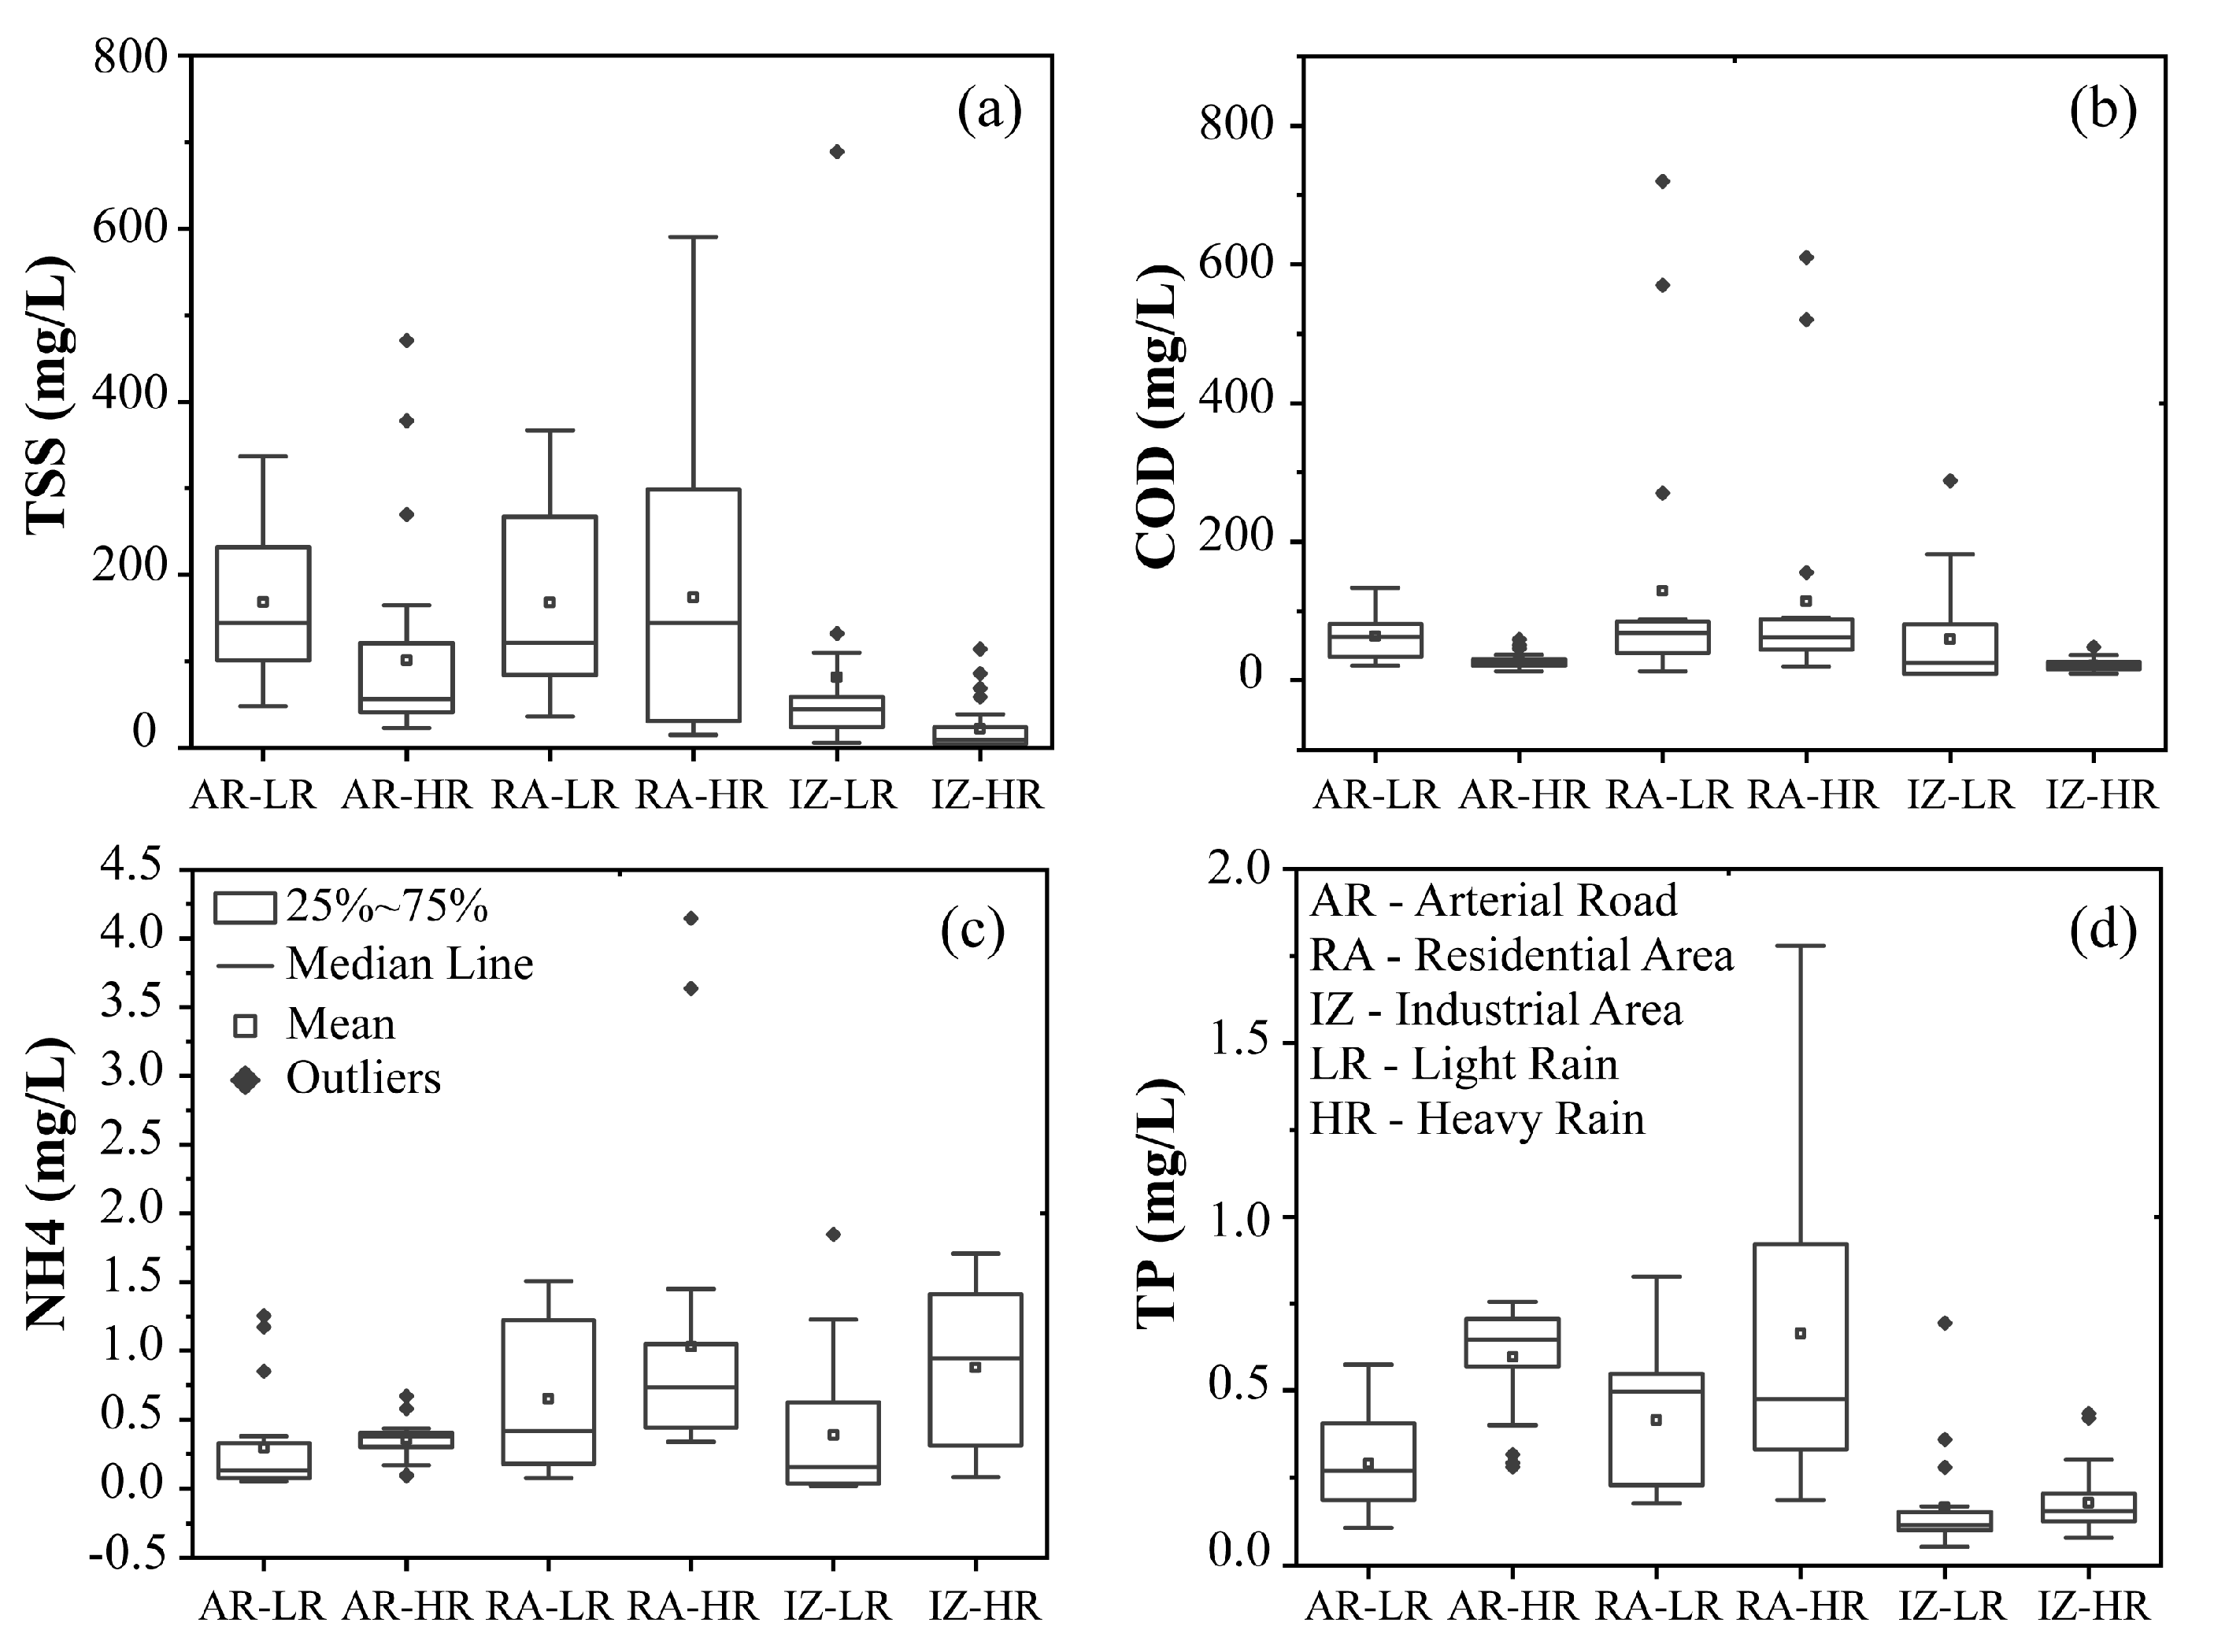
This study found that the EMCs of COD and TP in study areas were high, and exceeded the class IV values of WQS for COD and TP (GB3838-2002, Table 3). Moreover, the average event mean concentration of COD in RA (110.43 mg/L) was about threefold that of the class IV level of WQS. RA was the main source of COD in runoff, which was consistent with results of other studies [13,23]. DOC was found to be a major pollutant in urban road runoff, which could lead to the decrease of the dissolved oxygen in water bodies as a result of microbial oxidation [16]. Pollutant concentrations in road runoff varied with land use; the EMCs of TSS, COD, NH4, and TP were higher in RA than in AR and IA during rainfall events, especially during the event with a long antecedent dry weather period (Table 3). These findings agree with earlier studies that revealed that RA and IA roads were dominant sources of N and P in road runoff [5,6,15,21,43], and AR were the dominant sources of TSS [21,44,45]. Automobile catalytic converters operate less effectively during the first 1–2 min. after ignition, and thus vehicles may deposit more N and TSS on residential roads as they depart from residences than when they are later cruising on arterial roads [
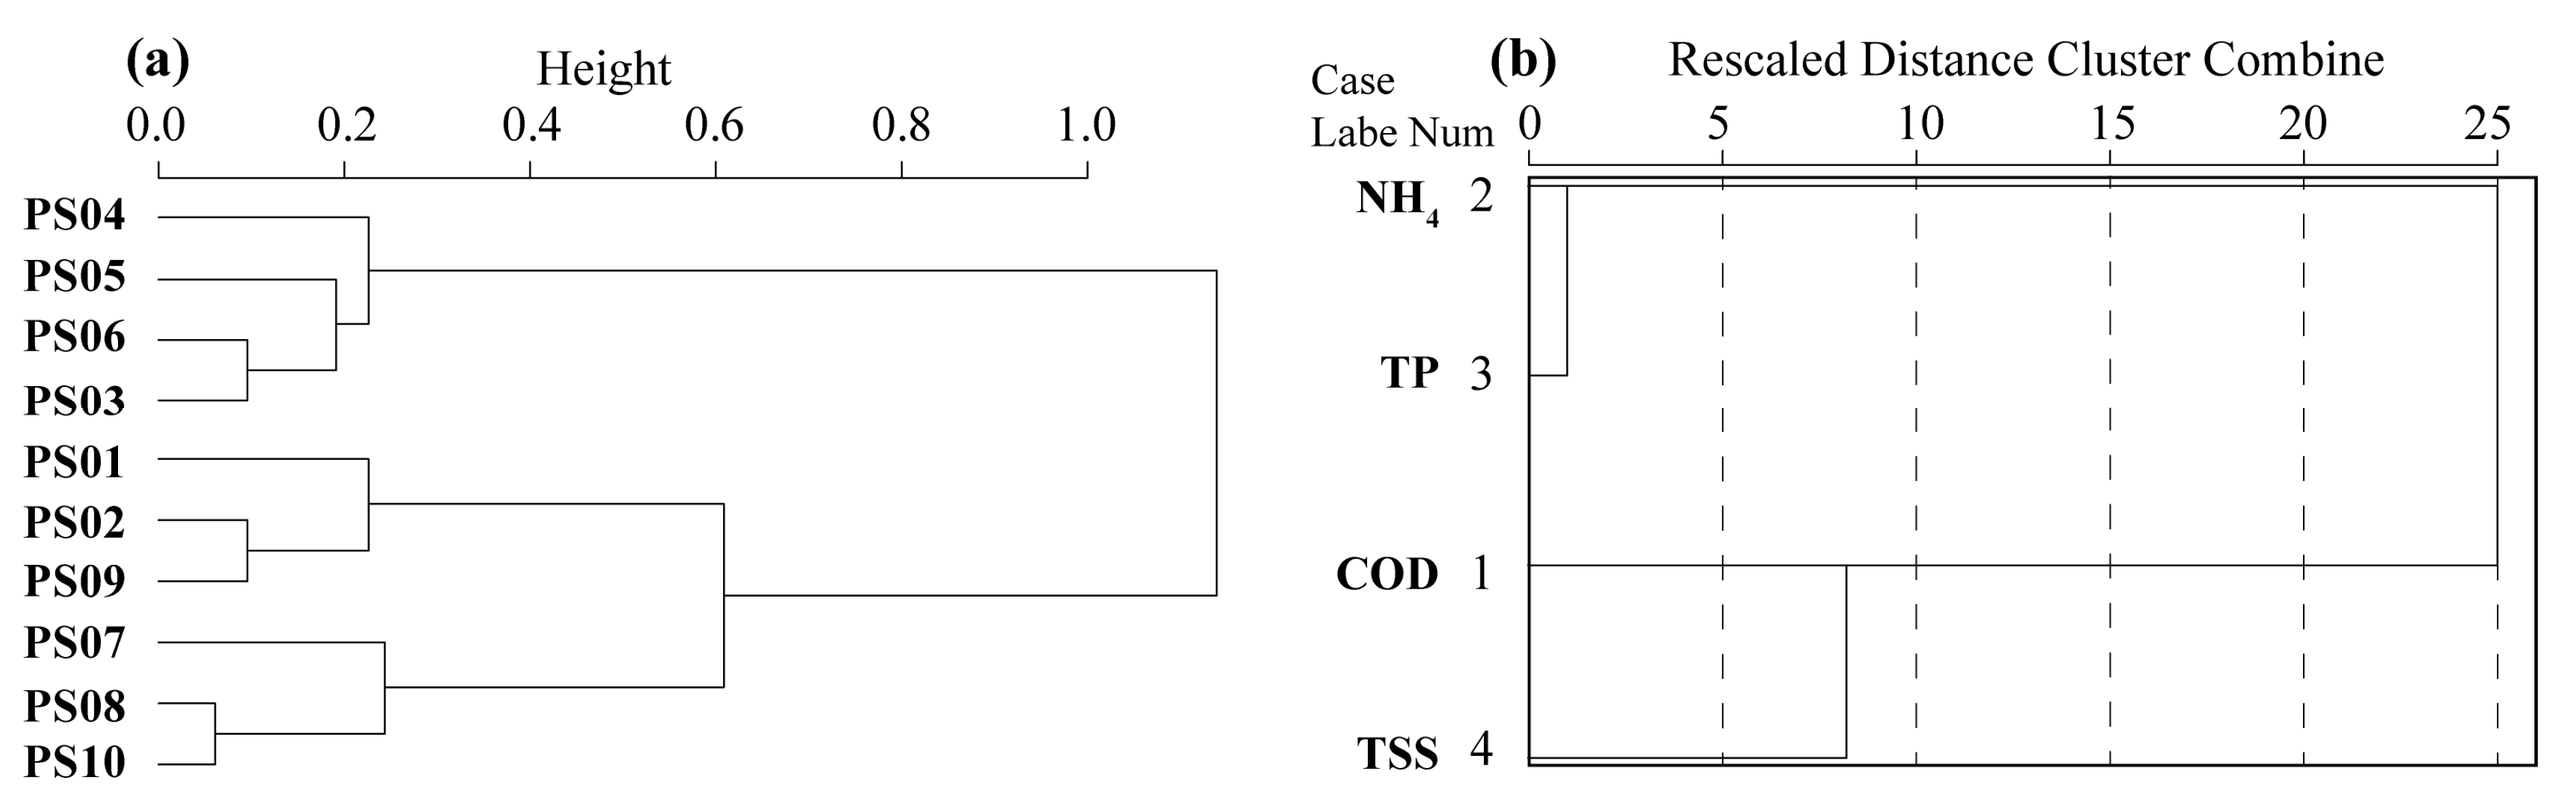
6]. In addition, the HCA of pollutants with low distance criterion (<5) revealed a close relationship between NH4 and TP (Figure 3a), suggesting NH4 and TP are from the same source(s) such as bird droppings, insect frass, litter deposits, leachate of domestic waste, fertilizers, and particulate matter from atmospheric deposition [15,21]. The EMCs of TSS in AR and RA observed in this study were higher than the EMC of TSS (100 mg/L) in urban runoff reported in the nationwide urban runoff program (NURP) of the USA [44], whereas they were lower than the EMC (300 mg/L) reported for asphalt roads [45]. Moreover, the seasonal rainfall density in Shenzhen could explain the higher TSS concentrations observed in April than in August (Table 3). High frequency and intensity of rainfall during August could thoroughly wash the road surface, which caused fewer particles to be retained on the road surface. In contrast, long antecedent dry days and light rainfall density caused more particulate matter to be retained on the road surface during April [23]. Populations, pedestrian volume, and traffic volume were the important factors influencing the concentration of NH4 and TP in runoff (Table 4). In general, high-density residential areas usually create more polluted urban runoff when compared with low-density residential areas, industrial areas, and undeveloped urban watersheds [14,23], because they have more varied and complex sources of N, P, and COD including litter deposition and domestic waste [15,21]. Urban road runoff was an important source of pollutants in PSR because most of this runoff could flow directly into the river. Compared with the other two land uses, RA is a potential source for elevated concentrations of these pollutants in PSR.
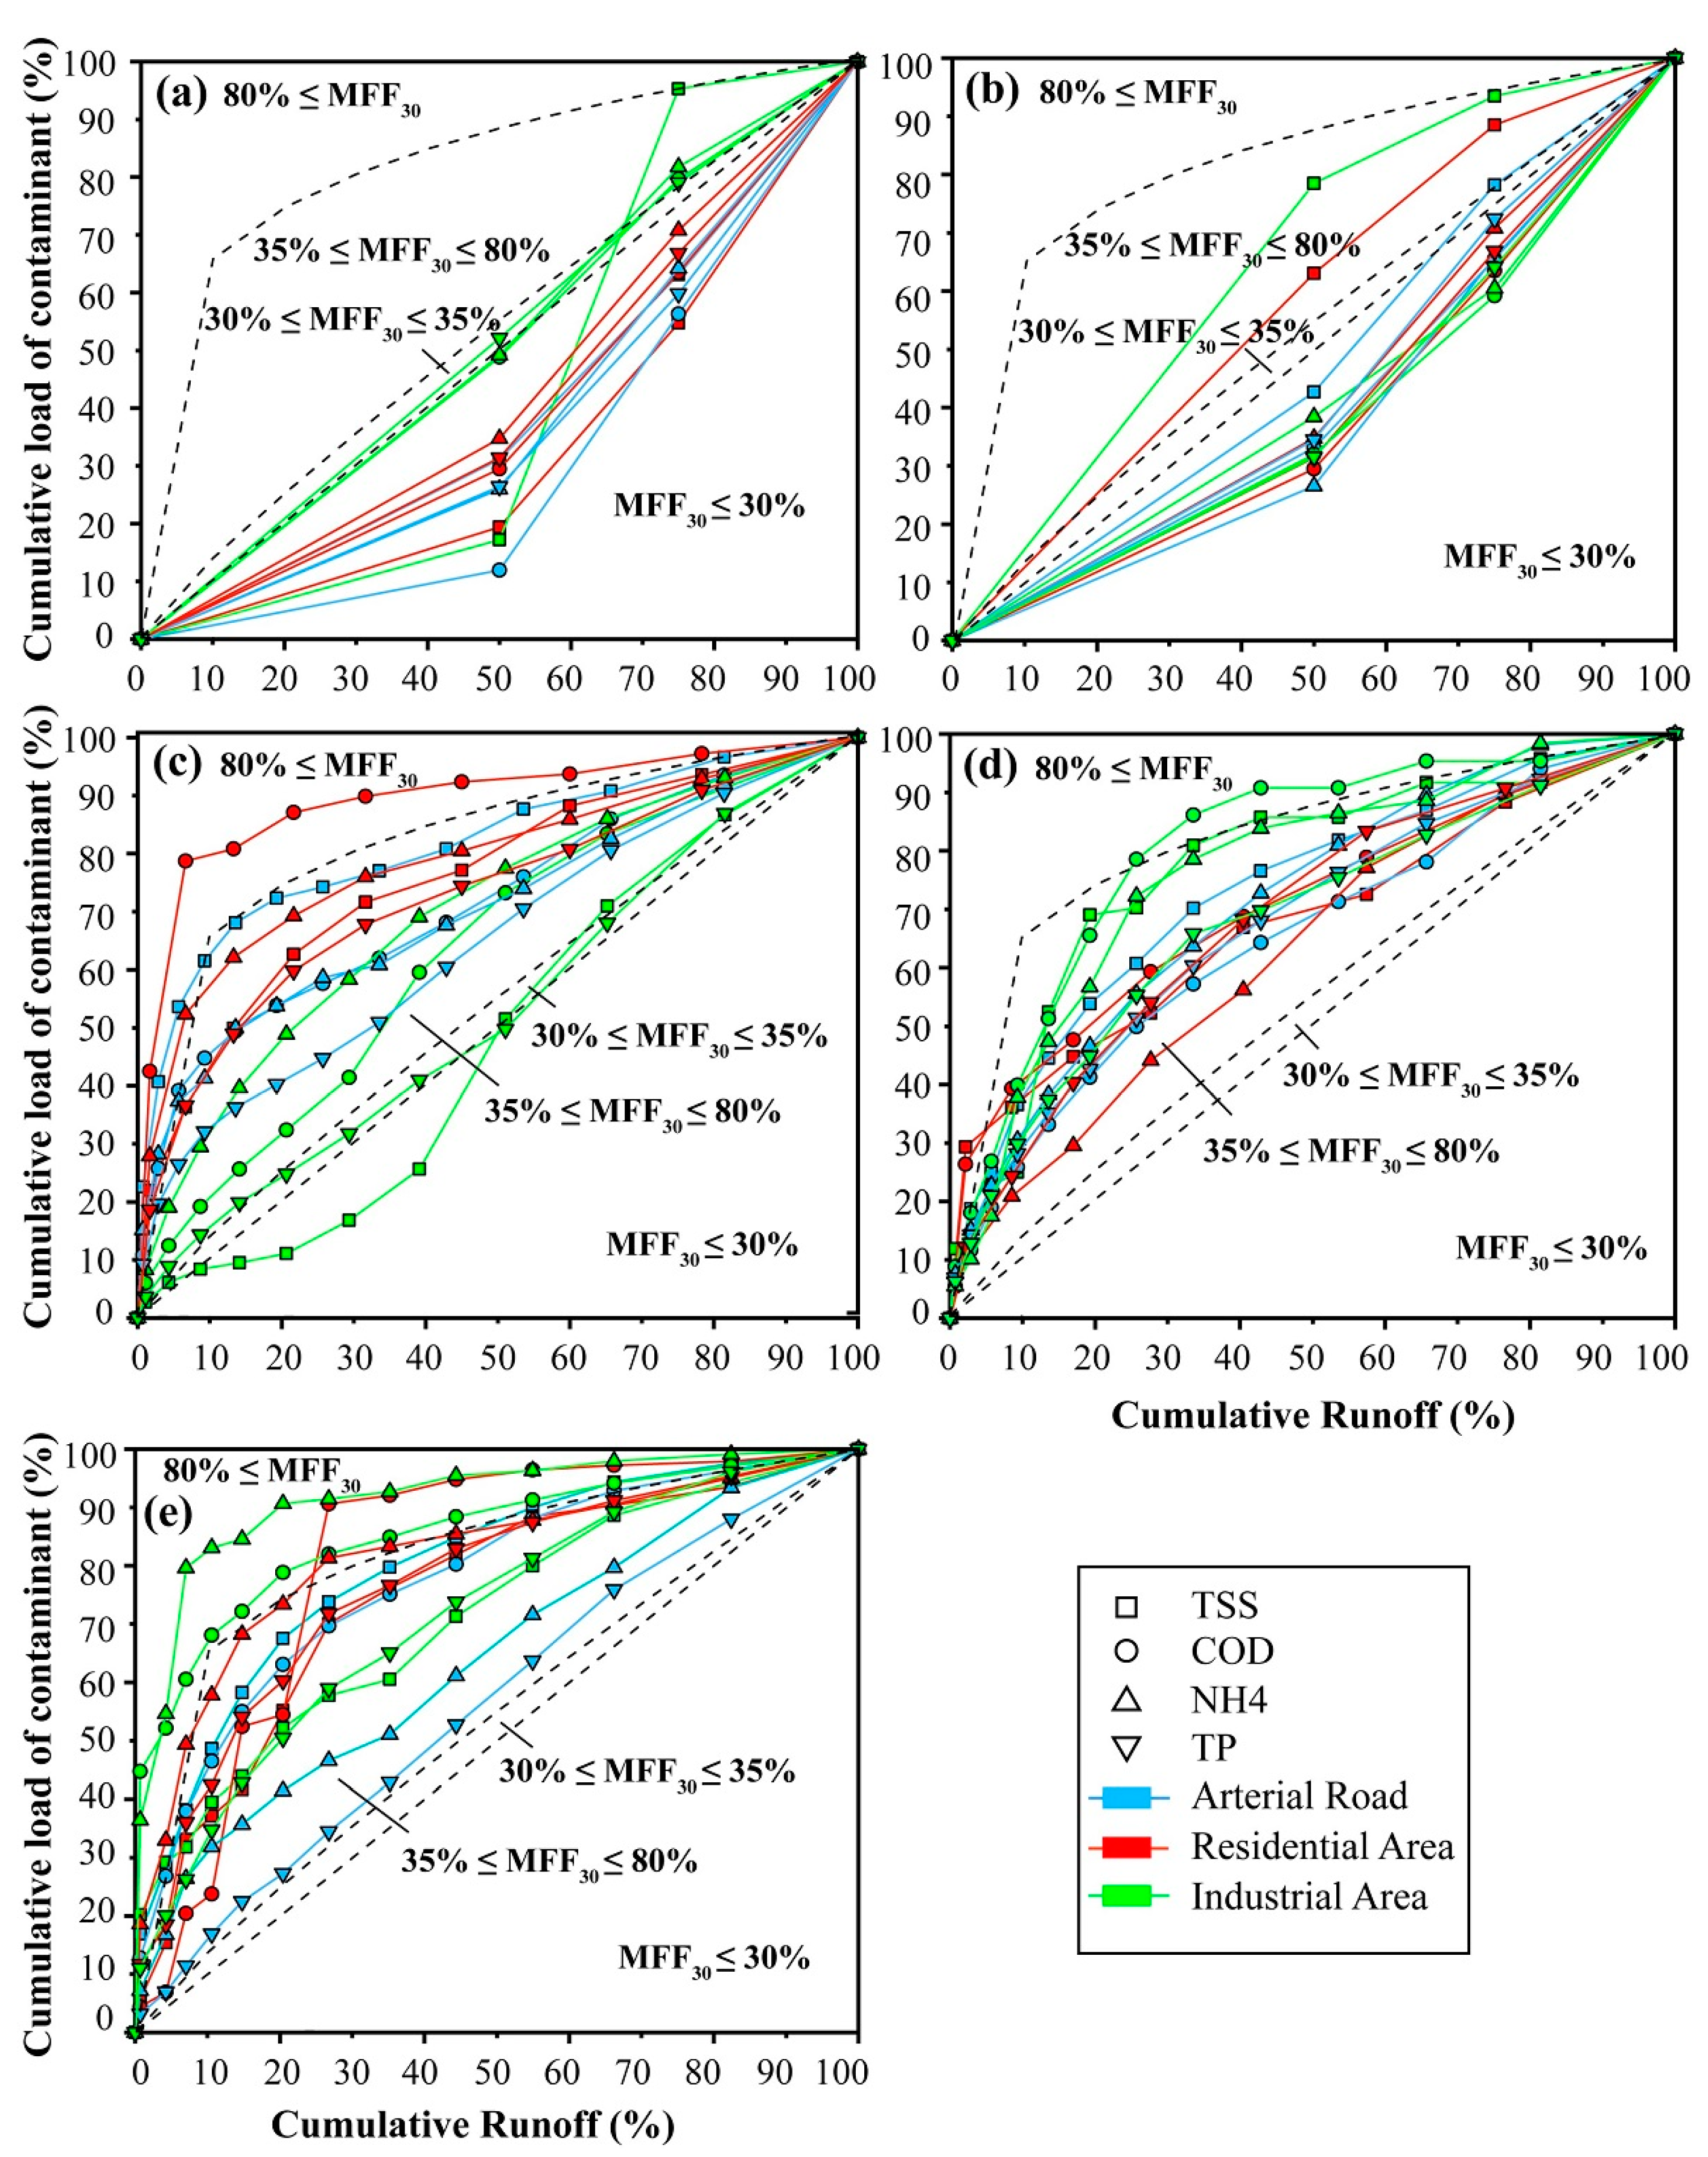
In the present study, we proposed defining the first flush by the fact that at least 80% of the pollutant mass is transported in the first 30% of the volume. This first flush, named the 30/80 first flush, also corresponds to values of b below 0.185; the lower the value of b, the stronger the first flush effect [25]. Dimensionless M(V) curves suggesting the distribution of pollutant mass vs. storm water discharge volume are used to compare pollutant discharges from different rainfall events and have been applied in many studies focusing on the first flush of pollutants [1,33,46]. In our study, COD showed a strong first flush in RA and IA, which has previously been shown to represent urban runoff characteristics in many studies [13,23]. There was a difference in the response tendencies of pollutants to rain flushes between different land uses (Figure 5), and the result showed the same order of COD > TSS > TP > NH4 in RA in Korea [23], whereas it was different to the order of TSS > COD > TN found for RA in Iran [13]. The first flush phenomenon for COD in the PSR watershed was more perceptible than that of other pollutants. The first flush is usually influenced by many factors, such as pollutant types, catchment, and rainfall-runoff characteristics [13,35]. In our study, all pollutants tended to be washed off in heavy rain, while first flush occurred weakly during light rain (Figure 4), suggesting that rainfall intensity was an important factor influencing the first flush effect [23]. The close relationship between particulate matter in air (PM2.5 and PM10) and the MFF30 of pollutants (COD and TP) confirmed that the dry deposition could affect TP in runoff. Some studies also confirmed that N and P in road runoff originated mainly from atmospheric deposits [8,15,21,42,47]. Thus, the control of atmospheric deposition is a non-negligible factor in managing P loads in road runoff in this investigation area. Some studies have indicated that ADD is the crucial factor influencing the TSS, NH4, TP, and DOC concentrations in road runoff [15], whereas other studies suggested that there was no relationship between initial N and ADD in RA [6]. ADD had strong effect on MFF30 of TSS in RA, and a weak effect on that in AR and IA. In addition, ADD also had a weak effect on MFF30 of COD, NH4, and TP in RA (Table 6). Daily road sweeping is one of the important reasons for the lack of effect of ADD on TSS and pollutants [15].
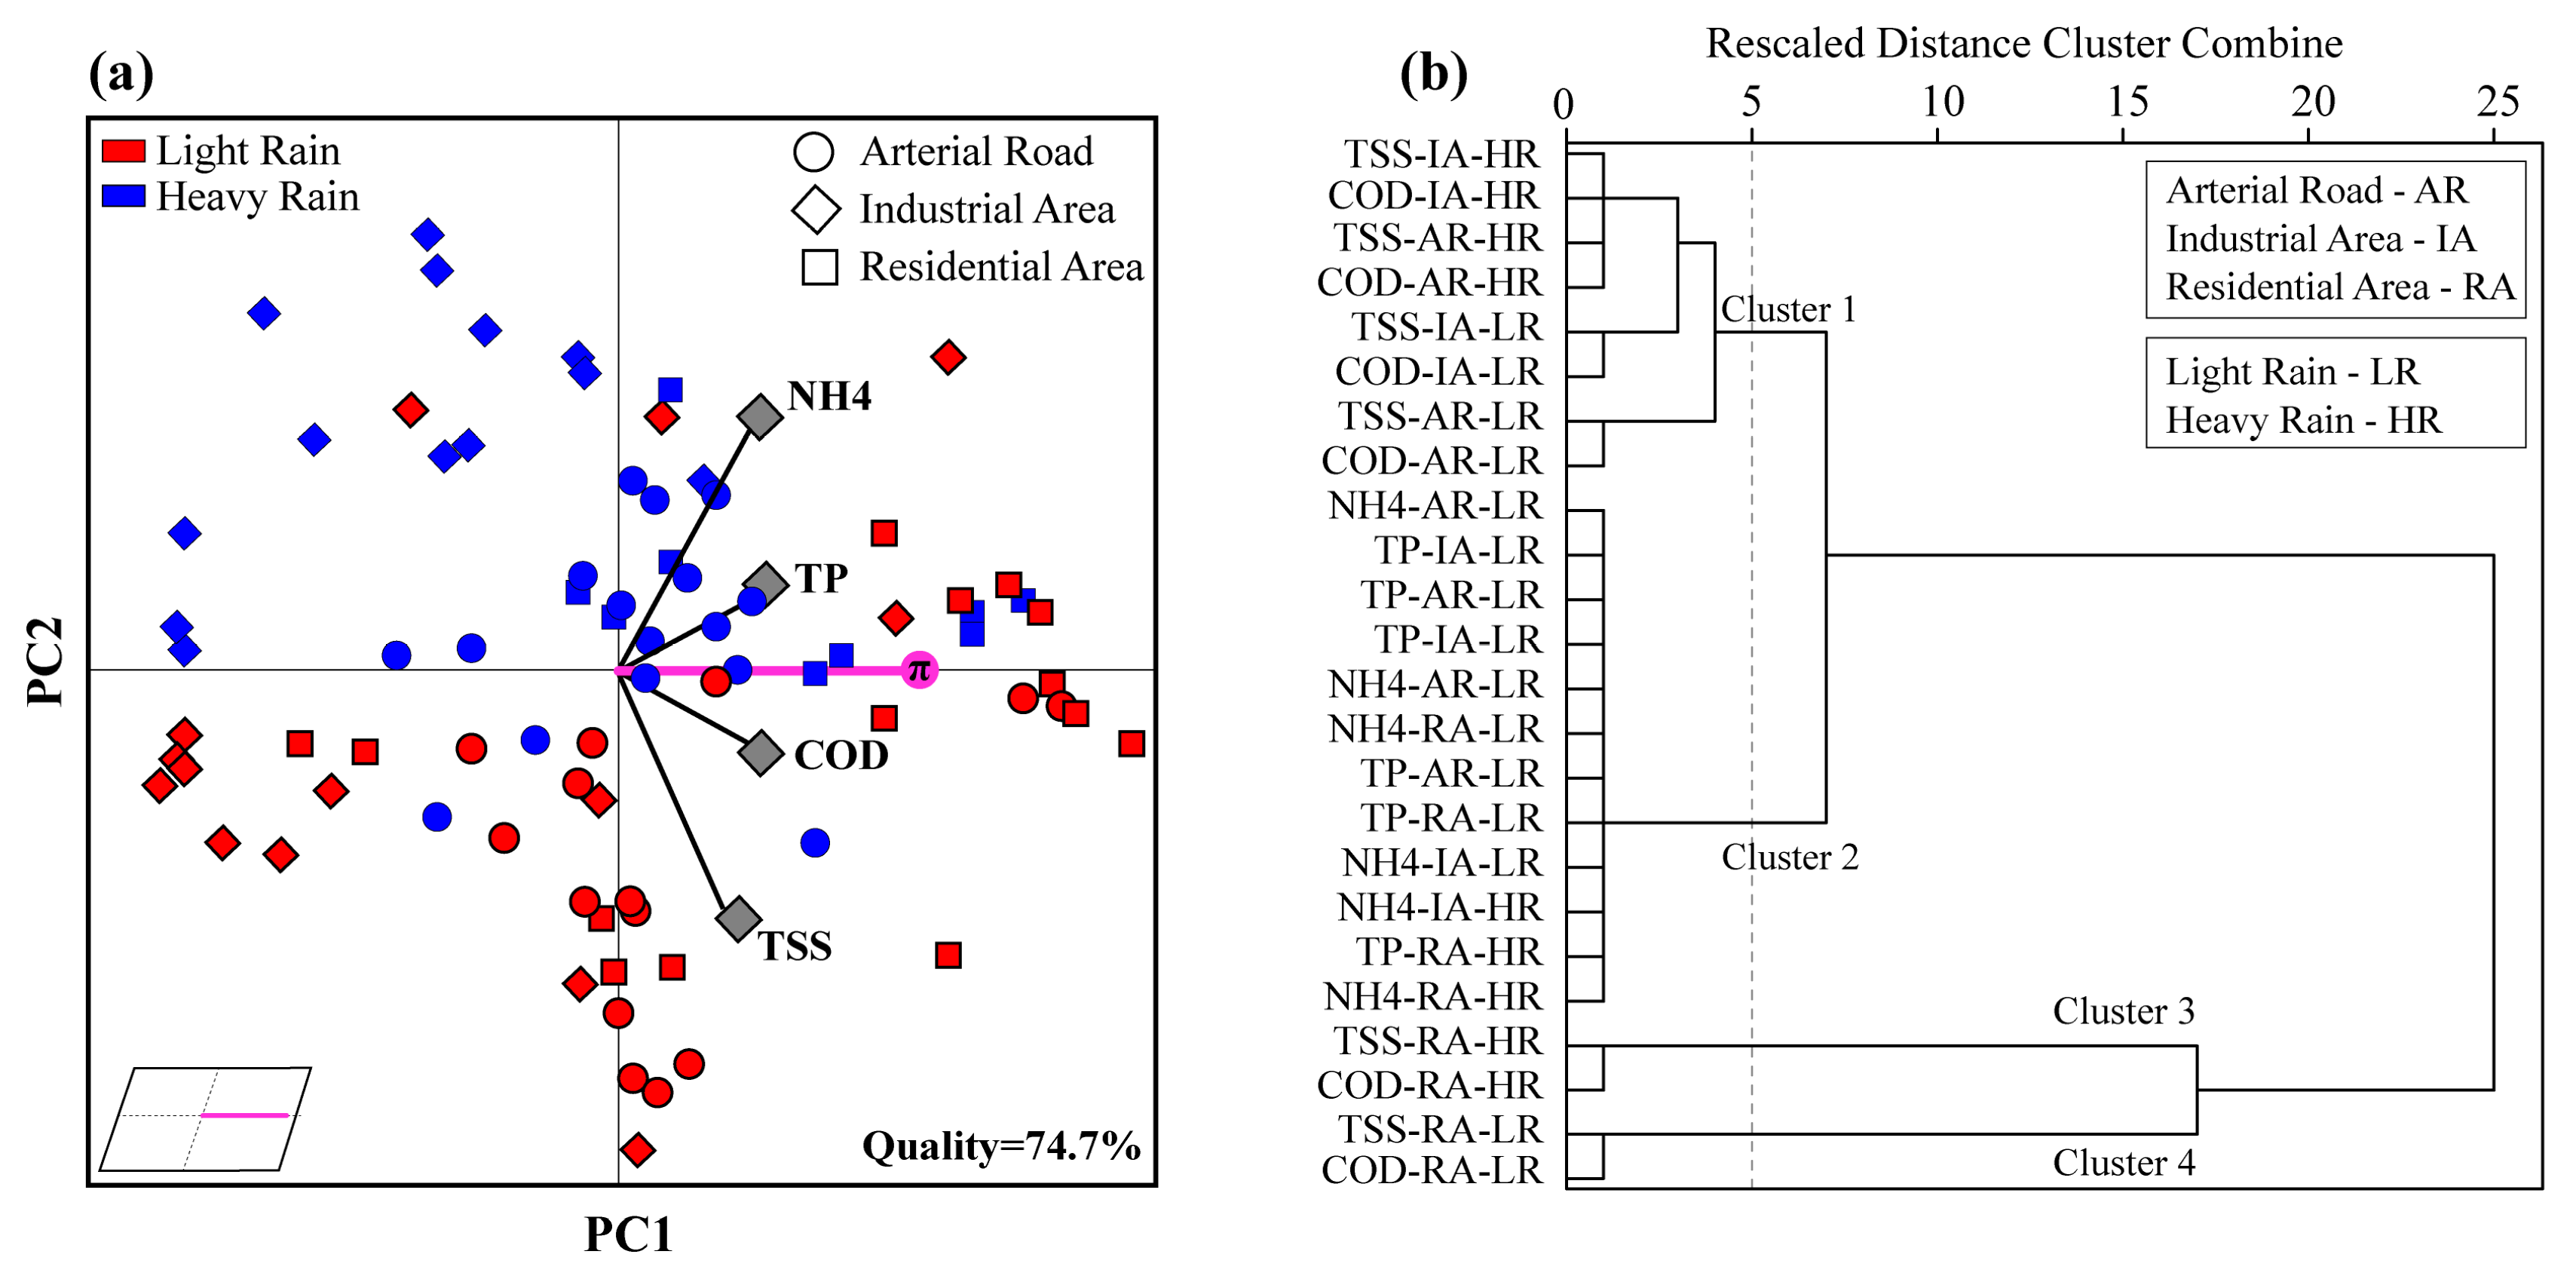
Rainfall pattern is a major factor affecting the wash-off process of pollutants [16,35]. In our study, AR and RA were the main areas for pollutant build-up, and COD, NH4, and TP in these areas can be easily washed-off during heavy rainfall events (Figure 5 and Table 7). Some studies have revealed that the magnitude of pollutant loading is positively and strongly correlated with the rainfall intensity [13,24,35] because pollutants could be sufficiently washed-off by high intensity rainfall. In addition, with the development of urbanization, even low density rainfall would produce road runoff and hence pollutant loading [16]. Moreover, high density of traffic volumes during light rainfall events could increase the accumulation of pollutants in road runoff [9,10,14]. Most of the pollution loads were primarily derived from road surface wash-off, as well as the accumulation of vehicular exhaust during light rainfall. There were strong linear dependences between TSS and pollutants, indicating that these pollutants attached to road particulate matter. It could be hypothesized that an appreciable proportion of pollutants such as DOC, N, and P originated from litter, atmospheric particulate deposition, and road dust [15,21], and these pollutants could be easily washed-off during heavy rainfall [23]. Thus, TSS was the dominant explanatory variable for these parameters and a suitable predictor for these pollutants in the PSR watershed. In addition, COD, NH4, and TP were primarily present in the dissolved form in IA because these parameters were not correlated with TSS (Table 8). In general, most IA mixed with RA, which caused pollutants in these areas to be more complex and various [26], and soluble pollutants could be leached easily from IA and RA litter [48]. There is no question that the urban environment is adversely affected by a variety of anthropogenic activities, which introduce numerous pollutants with various physicochemical forms to the environment, and pose a considerable threat to the receiving rivers [16].
We suggest that controlling the first flush is a critical measure in reducing the urban stormwater pollution in the PSR watershed. Based on different land uses, multiple management actions could be used to address or prevent excessive runoff pollutants in the study area. The best management action in the AR and RA is to build the structural stormwater improvement measures such as detention basins or sediment traps, which could effective in removing these TSS. The effective management action in the IA is to collect and reuse initial stormwater, because structural stormwater improvement measures could be effective in removing TSS but not the soluble pollutants.

5. Conclusions

Urban surface runoff is one of the crucial factors affecting water quality in urban rivers. In this study, we examined the variations in runoff pollutants and the related influencing factors in Pingshan River (PSR) watershed, a typical area covering different land-use types in Shenzhen, China, during five rainfall events. The result showed that the concentrations of pollutants (DOC, TP, and NH4) were high in urban road runoff especially in residential area, and rainfall intensity was the important factor affecting wash-off of these pollutants. Controlling the first flush is a critical measure to reduce the effect of runoff pollution on PSR during heavy rainfall because most pollutants showed a strong first flush phenomenon in arterial road, industrial area, and residential area during high intensity rainfall events. Moreover, in the arterial road and residential area, the control of TSS is the effective measure for decreasing the effect of runoff pollutants on PSR because NH4, TP, and COD mainly attach to particulate matter. In residential area, due to pollutants mainly dissolved in stormwater, the collection and reuse of road runoff during the initial rainfall period were effective measures for reducing the effect of these soluble pollutants on PSR. This study provides a reference for the government to formulate effective management measures for pollutants in urban stormwater runoff within different land use types.

Author Contributions

Y.L., X.Q., and M.Z., did the analyses and prepared the manuscript; X.Q., W.P., and M.Z. designed the study. Y.L., C.W., Y.Y., and L.D., performed the field work and laboratory analysis; C.W., Y.C., and C.G., gave suggestions during the whole work.

Funding

This work was jointly supported by the Shenzhen Project for the comprehensive management of the Two River Basin (Longgang and Pingshan Rivers) and the Shenzhen Project for comprehensive renovation and water quality improvement of the main stream of the Pingshan River (CSCEC-PSH-2017-01).

Acknowledgments

We appreciate the anonymous reviewers for their valuable comments and efforts to improve this manuscript.

Conflicts of Interest

The authors declare no conflict of interest.

References

  1. Gold, A.C.; Thompson, S.P.; Piehler, M.F. The effects of urbanization and retention-based stormwater management on coastal plain stream nutrient export. Water. Resour. Res. 2019, 55, 7027–7046. [Google Scholar] [CrossRef]
  2. Walsh, C.J.; Roy, A.H.; Feminella, J.W.; Cottingham, P.D.; Groffman, P.M.; Morgan, R.P. The urban stream syndrome: Current knowledge and the search for a cure. J. N. Am. Benthol. Soc. 2005, 24, 706–723. [Google Scholar] [CrossRef]
  3. Ren, Y.; Wang, X.; Ouyang, Z.; Zhegn, H.; Duan, X.; Miao, H. Stormwater runoff quality from different surfaces in an urban catchment in Beijing, China. Water. Environ. Res. 2008, 80, 719–724. [Google Scholar] [CrossRef]
  4. Liu, Z.; Wang, Y.; Li, Z.; Peng, J. Impervious surface impact on water quality in the process of rapid urbanization in Shenzhen, China. Environ. Earth. Sci. 2013, 68, 2365–2373. [Google Scholar] [CrossRef]
  5. Miguntanna, N.P.; Goonetilleke, A.; Egodowatta, P.; Kokot, S. Understanding nutrient build-up on urban road surfaces. J. Environ. Sci 2010, 22, 806–812. [Google Scholar] [CrossRef]
  6. Davidson, E.A.; Savage, K.E.; Bettez, N.D.; Marino, R.; Howarth, R.W. Nitrogen in runoff from residential roads in a coastal area. Water. Air. Soil. Poll. 2010, 210, 3–13. [Google Scholar] [CrossRef]
  7. Deletic, A.; Orr, D.W. Pollution buildup on road surfaces. J. Environ. Eng. Sci. 2005, 131, 49–59. [Google Scholar] [CrossRef]
  8. Duncan, J.M.; Welty, C.; Kemper, J.T.; Groffman, P.M.; Band, L.E. Dynamics of nitrate concentration-discharge patterns in an urban watershed. Water Resour. Res. 2017, 53, 7349–7365. [Google Scholar] [CrossRef]
  9. Shajib, M.T.I.; Hansen, H.C.B.; Liang, T.; Holm, P.E. Metals in surface specific urban runoff in Beijing. Environ. Pollut. 2019, 248, 584–598. [Google Scholar] [CrossRef]
  10. Chen, X.; Xia, X.; Zhao, Y.; Zhang, P. Heavy metal concentrations in roadside soils and correlation with urban traffic in Beijing, China. J. Hazard. Mater. 2010, 181, 640–646. [Google Scholar] [CrossRef]
  11. Chen, Y.; Zhang, Z.; Du, S.; Shi, P.; Tao, F.; Doyle, M. Water quality changes in the world’s first special economic zone, Shenzhen, China. Water Resour. Res. 2011, 47. [Google Scholar] [CrossRef]
  12. Wu, Y.; Niu, C.; Chen, J.; Su, H.; Che, D. Study on Spatial and temporal evolution of water quality in pingshan river. Pearl River 2019, 40, 63–69. (In Chinese) [Google Scholar] [CrossRef]
  13. Taebi, A.; Droste, R.L. First flush pollution load of urban stormwater runoff. J. Environ. Eng. Sci. 2004, 3, 301–309. [Google Scholar] [CrossRef]
  14. Czemiel Berndtsson, J. Storm water quality of first flush urban runoff in relation to different traffic characteristics. Urban Water J. 2013, 11, 284–296. [Google Scholar] [CrossRef]
  15. Kojima, K.; Sano, S.; Kurisu, F.; Furumai, H. Estimation of source contribution to nitrate loading in road runoff using stable isotope analysis. Urban Water J. 2016, 14, 337–342. [Google Scholar] [CrossRef]
  16. Goonetilleke, A.; Thomas, E.; Ginn, S.; Gilbert, D. Understanding the role of land use in urban stormwater quality management. J. Environ. Manag. 2005, 74, 31–42. [Google Scholar] [CrossRef]
  17. Wu, J.; Ren, Y.; Wang, X.; Wang, X.; Chen, L.; Liu, G. Nitrogen and phosphorus associating with different size suspended solids in roof and road runoff in Beijing, China. Environ. Sci. Pollut. Res. Int. 2015, 22, 15788–15795. [Google Scholar] [CrossRef]
  18. Wei, Q.; Zhu, G.; Wu, P.; Cui, L.; Zhang, K.; Zhou, J.; Zhang, W. Distributions of typical contaminant species in urban short-term storm runoff and their fates during rain events: A case of Xiamen City. J. Environ. Sci. 2010, 22, 533–539. [Google Scholar] [CrossRef]
  19. Khanal, R.; Furumai, H.; Nakajima, F.; Yoshimura, C. Impact of holding time on toxicity change of urban road dust during runoff process. Sci. Total. Environ. 2019, 668, 1267–1276. [Google Scholar] [CrossRef]
  20. Herngren, L.; Goonetilleke, A.; Ayoko, G.A. Understanding heavy metal and suspended solids relationships in urban stormwater using simulated rainfall. J. Environ. Manage. 2005, 78, 149–158. [Google Scholar] [CrossRef]
  21. Gilbert, J.K.; Clausen, J.C. Stormwater runoff quality and quantity from asphalt, paver, and crushed stone driveways in Connecticut. Water Res. 2006, 40, 826–832. [Google Scholar] [CrossRef] [PubMed]
  22. Carpenter, S.R.; Caraco, N.E.; Correll, D.L.; Howarth, R.W.; Sharpley, A.N.; Smith, V.H. Nonpoint pollution of surface waters with phosphorus and nitrogen. Ecol. Appl. 1998, 8, 559–568. [Google Scholar] [CrossRef]
  23. Lee, J.H.; Bang, K.W. Characterization of urban stormwater runoff. Water Res. 2000, 34, 1773–1780. [Google Scholar] [CrossRef]
  24. Deletic, A. The first flush load of urban surface runoff. Water Res. 1998, 32, 2462–2470. [Google Scholar] [CrossRef]
  25. Bertrand-Krajewshi, J.L.; Chebbo, G.; Saget, A. Distribution of pollutant mass vs volume in stormwater discharges and the first flush phenomenon. Water Res. 1998, 32, 2341–2356. [Google Scholar] [CrossRef]
  26. Li, Y.; Ma, X. Impacts of land-use change on non-point source pollution load in Pingshan River Watershed in Shenzhen City. Water Resour. Prot. 2012, 28, 42–45. [Google Scholar] [CrossRef]
  27. Lin, G.; Huang, X. Water quality assessment and variation trend analysis for Pingshan River of Shenzhen in recent years. Environ. Dev. 2015, 27, 32–36. [Google Scholar] [CrossRef]
  28. Ministry of Envionmental Protection. Shenzhen Pingshan River, Pingshan River Basin Water Environment Comprehensive Improvement Program; South China Institute of Environmental Science. Ministry of Envionmental Protection: Guangzhou, China, 2008.
  29. Li, Q.; Yu, Y.; Jiang, X.; Guan, Y. Multifactor-based environmental risk assessment for sustainable land-use planning in Shenzhen, China. Sci. Total. Environ. 2019, 657, 1051–1063. [Google Scholar] [CrossRef]
  30. Liu, Z.; Yang, H. The impacts of spatiotemporal landscape changes on water quality in Shenzhen, China. Int. J. Environ. Res. Public Health. 2018, 15, 1038. [Google Scholar] [CrossRef]
  31. Association, A.P.H.; Association, A.W.W.; Federation, W.E. Standard Method for the Examination of Water and Wastewater; American Public Health Association: Washington, DC, USA, 1992. [Google Scholar]
  32. Shinya, M.; Tsuruho, K.; Konishi, T.; Ishikawa, M. Evaluation of factors influencing diffusion of pollutant loads in urban highway runoff. Water Sci. Technol. 2003, 47, 227–232. [Google Scholar] [CrossRef]
  33. Leea, J.H.; Bang, K.W.; Ketchum, L.H.; Choed, J.S.; Yue, M.J. First flush analysis of urban storm runoff. Sci. Total Environ. 2002, 293, 163–175. [Google Scholar] [CrossRef]
  34. Li, C.; Liu, M.; Hu, Y.; Xu, Y.; Sun, F.; Chen, T. Analysis of first flush in rainfall runoff in Shenyang urban city. Acta Ecologica Sinica 2013, 33, 5952–5961. [Google Scholar] [CrossRef]
  35. Li, L.Q.; Yin, C.Q.; He, Q.C.; Kong, L.L. First flush of storm runoff pollution from an urban catchment in China. J. Environ. Sci. 2007, 19, 295–299. [Google Scholar] [CrossRef]
  36. Chow, M.F.; Yusop, Z.; Mohamed, M. Quality and first flush analysis of stormwater runoff from a tropical commercial catchment. Water Sci. Technol. 2011, 63, 1211–1216. [Google Scholar] [CrossRef] [PubMed]
  37. Vorreiter, L.; Hickey, C. Incidence of the first flush phenomenon in Catchments of the Sydney Region. In Water Down Under 94: Surface Hydrology and Water Resources Papers; Preprints of Papers; Institution of Engineers: Barton, Australia, 1994; pp. 359–364. [Google Scholar]
  38. Mrowiec, M.; Kamizela, T.; Kowalczyk, M. Occurrence of first flush phenomenon in drainage system of Częstochowa. Environ. Prot. Eng. 2009, 35, 73–80. [Google Scholar]
  39. Di Modugno, M.; Gioia, A.; Gorgoglione, A.; Iacobellis, V.; la Forgia, G.; Piccinni, A.; Ranieri, E. Build-Up/Wash-Off monitoring and assessment for sustainable management of first flush in an urban area. Sustainability 2015, 7, 5050–5070. [Google Scholar] [CrossRef] [Green Version]
  40. Gorgoglione, A.; Gioia, A.; Iacobellis, V. A framework for assessing modeling performance and effects of rainfall-catchment-drainage characteristics on nutrient urban runoff in poorly gauged watersheds. Sustainability 2019, 11, 4933. [Google Scholar] [CrossRef] [Green Version]
  41. Brans, J.P.; Mareschal, B. Promethee Methods. In Multiple Criteria Decision Analysis: State of the Art Surveys; Springer: New York, NY, USA, 2005; pp. 163–186. [Google Scholar]
  42. Herngren, L.; Goonetilleke, A.; Ayoko, G.A. Analysis of heavy metals in road-deposit sediments. Analytica. Chimica. Acta 2006, 571, 270–278. [Google Scholar] [CrossRef] [Green Version]
  43. Rushton, B.T. Low-impact parking lot design reduces runoff and pollutant loads. Water Res. Plan. Manag. 2001, 127, 172–179. [Google Scholar] [CrossRef]
  44. US Environmental Protection Agency. Results of the nationwide urban runoff program. In Water Planning Division NTIS Accession; Water Planning Division, US Environmental Protection Agency: Washington, DC, USA, 1983; Volume I-final report. [Google Scholar]
  45. Bannerman, R.T.; Owens, D.W.; Dodds, R.B.; Homewer, N.J. Sources of pollutants in wisconsin stormwater. Water Sci. Technol. 1993, 28, 241–259. [Google Scholar] [CrossRef]
  46. Chen, Y.; Wang, Z.; Wu, Y.; Wu, J.; Yang, W. Impacts of rainfall characteristics and occurrence of pollutant on effluent characteristics of road runoff pollution. J. Environ. Sci. 2017, 38, 2828–2835. [Google Scholar] [CrossRef]
  47. Wang, H.; Pang, S.; Wang, X.; Fan, Y. Dry and wet deposition of atmospheric nitrogen in small catchments. J. Environ. Sci.-China. 2018, 39, 5365–5374. [Google Scholar] [CrossRef]
  48. Goonetilleke, A.; Egodawatta, P.; Kitchen, B. Evaluation of pollutant build-up and wash-off from selected land uses at the Port of Brisbane, Australia. Mar. Pollut. Bull. 2009, 58, 213–221. [Google Scholar] [CrossRef] [PubMed] [Green Version]
Figure 1. Overview map of the Pingshan River watershed and sampling site locations. Sites PS02, PS04, and PS08 were the representative sampling sites for the arterial road, residential area, and industrial area, respectively.
Water 11 02545 g001
Figure 2. Zone of the cumulative mass and volume curves depending on the coefficient: (a) strong distinctive first flush (0 < b < 0.185, 80% ≤ MFF30), (b) moderate first flush (0.185 < b < 0.862, 35% ≤ MFF30 ≤ 80%), (c) weak distinctive first flush (0.862 < b < 1, 30% ≤ MFF30 ≤ 35%), and (d) first flush fails to occur (1 < b, MFF30 ≤ 30%).
Water 11 02545 g002
Figure 3. (a) UPGMA clustering of samples sites and (b) hierarchical dendrogram for four elements obtained by Ward’s method.
Water 11 02545 g003
Figure 4. Cumulative curves of pollutants during the five rainfall events of (a) 14 April 2018, (b) 15 April 2018, (c) 10 August 2018, (d) 11 August 2018, and (e) 12 August 2018.
Water 11 02545 g004
Figure 5. (a) GAIA analysis of the five rainfall events in the three land use types and (b) hierarchical dendrogram for two rainfall types and three land use types obtained by Ward’s method.
Water 11 02545 g005
Figure 6. Boxplot of (a) TSS, (b) COD, (c) NH4, and (d) TP with rainfall characteristics in the three land use types.
Water 11 02545 g006
Figure 7. Linear correlation analyses between COD vs. TSS, NH4 vs. TSS, and TP vs. TSS in the three different land use types.
Water 11 02545 g007
Table 1. Characteristics of the rainfall events.
Rainfall Date14 April 201815 April 201810 August 201811 August 201812 August 2018
Rainfall typeslight rainlight rainheavy rainheavy rainlight rain
Rainfall (mm)6.607.8015.9021.758.67
Rainfall duration (h)2.503.003.503.003.00
Rainfall intensity (mm/h)2.602.604.547.252.89
Antecedent dry day (ADD) (day)70.5220.440.31
Particulate matter in air during ADD (PM2.5)21171378
Particulate matter in air during ADD (PM10)3624221315
Table 2. Characteristics of the sampling sites.
Land Use TypeSampling SitesRoad CharacteristicsRunoff CoefficientTraffic Volume (pcu/h)Population (per/area)Pedestrian Volume (per/day)
Arterial road (AR)PS01concrete0.796160<500200
PS02concrete0.796850<10050
PS07concrete0.796256<500100
PS09concrete0.796160<10050
Residential area (RA)PS03concrete0.796<102456352
PS04concrete0.796<101400500
PS05concrete0.796<101400500
PS06concrete0.796<103418359
Industrial Area (IA)PS08concrete0.796<10517517
PS10concrete0.796<101000318
Table 3. EMC values of runoff pollutants in different land use types.
DateArterial RoadResidential AreaIndustrial Area
TSSCODNH4TPTSSCODNH4TPTSSCODNH4TP
14 April 2018302.1071.561.160.52300.6481.541.330.5335.80155.400.960.34
15 April 201895.2027.280.330.22121.3081.541.330.53142.7070.490.250.16
10 August 2018160.5426.310.340.54299159.441.651.0640.0924.141.440.21
11 August 2018103.6128.420.370.65180.8976.550.520.3422.6021.640.410.15
12 August 2018162.9273.350.100.26142.69153.080.300.3641.8533.830.210.10
Average values148.7045.380.460.44208.90110.431.030.5656.6161.100.650.19
RSD (%)45.5848.7478.6838.2536.6933.9750.5246.4576.9782.3272.9142.19
Class IV level of WQS/301.50.3/301.50.3/301.50.3
Note: RSD—Relative standard deviation; Class IV level of WQS—Class IV level of water quality standard for surface water in China (GB3838-2002).
Table 4. Pearson correlations between runoff pollutants and populations, pedestrian volume, and traffic flow volume.
ParametersPopulations (per)Pedestrian Volume (per/day)Traffic Volume (pcu/h)
COD−0.0670.239−0.171
NH40.771**0.893**0.809**
TP0.734*0.722*0.829**
TSS0.3730.3240.459
** indicates p < 0.01 and * indicates p < 0.05. Populations refers to the total population of each sampling area.
Table 5. Judgement of the first flush effect.
First Flush RateRainfall DateArterial RoadResidential AreaIndustrial Area
TSSCODNH4TPTSSCODNH4TPTSSCODNH4TP
MFF20(%)14 April 20186.680.744.444.582.255.918.706.869.1319.0819.4622.10
15 April 201814.007.714.678.5434.585.918.676.8557.207.8721.896.88
10 August 201868.2953.4554.1644.2957.2580.1964.8220.8519.0935.4445.2227.02
11 August 201850.2840.3146.3143.3752.6754.3737.2743.1751.9947.5940.7243.79
12 August 201860.4857.1141.7028.6143.4044.9065.1754.4653.3175.9482.0348.63
MFF25 (%)14 April 20189.741.496.887.043.828.7812.269.9813.2024.1024.5327.30
15 April 201818.5111.017.2012.0940.218.8012.2010.061.9211.3429.669.99
10 August 201872.6658.5858.6849.1062.3083.5169.1726.0422.9541.0151.2031.80
11 August 201856.2546.1052.3049.1056.6758.7842.7249.0358.2350.7246.9249.79
12 August 201866.2162.8053.9033.7549.5352.9170.3268.3357.6379.0085.6854.11
MFF30 (%)14 April 201813.242.649.8410.005.8912.1216.2413.5617.8329.1629.6632.44
15 April 201823.2314.7510.2416.0645.4912.1216.2413.5666.0615.2938.0213.55
10 August 201876.4563.1462.6653.4166.7586.3272.9431.2226.6846.2156.6636.34
11 August 201861.6651.4557.7854.3360.1562.6547.7554.4063.8759.2652.6955.29
12 August 201870.7067.8651.6738.6455.1760.5274.8265.8361.4281.5988.7959.05
Table 6. Pearson correlations between the MFF30 of pollutants and ADD, PM2.5, and PM10.
ParametersArterial Road (MFF30)Residential Area (MFF30)Industrial Area (MFF30)
TSSCODNH4TPTSSCODNH4TPTSSCODNH4TP
ADD0.400.700.300.500.87*0.450.480.580.600.700.700.70
PM2.50.600.80*0.700.90*0.80*0.74*0.750.94*0.400.85*0.700.80
PM100.600.80*0.700.90*0.86*0.660.660.85*0.400.85*0.700.80
* indicates p < 0.05.
Table 7. PROMETHEE ranking.
SampleNetRanking OrderSampleNetRanking Order
HR-RA-30 min0.8071LR-AR-15 min−0.05224
HR-RA-10 min0.6232HR-AR-60 min−0.06225
HR-RA-5 min0.4443LR-RA-15 min−0.07626
HR-RA-15 min0.4244LR-AR-50 min–0.09127
LR-RA-5 min0.3635LR-RA-60 min−0.11428
LR-RA-10 min0.2576LR-AR-60 min−0.16229
LR-RA-20 min0.2547LR-IA-5 min−0.22030
HR-AR-20 min0.1938HR-IA-10 min−0.22531
HR-AR-5 min0.1929HR-IA-5 min−0.24032
HR-AR-40 min0.17910HR-AR-10 min−0.37633
HR-RA-20 min0.16711HR-IA-50 min−0.48434
HR-IA-20 min0.13412LR-IA-15 min−0.54035
HR-AR-15 min0.09313LR-RA-50 min−0.61336
HR-AR-50 min0.06614LR-RA-40 min−0.63637
HR-AR-30 min0.05915HR-IA-60 min−0.72838
HR- IA-30 min0.05616HR-IA-40 min−0.73439
HR- IA-15 min0.04617LR-IA-10 min−0.78240
LR-AR-5 min0.02918LR-IA-30 min−0.78241
LR-AR-30 min−0.01719LR-IA-20 min−0.83042
LR-AR-40 min−0.02520LR-IA-40 min−0.83743
LR-AR-10 min−0.02921LR-IA-50 min−0.84344
LR-RA-30 min−0.03722LR-IA-60 min−0.88145
LR-AR-20 min−0.04023
HR: Heavy Rain; LR: Light Rain; RA: Residential Area; AR: Arterial Road; IA: Industrial Area.
Table 8. Pearson correlation between the concentrations of DOC, NH4, TP, and TSS in runoff from the three different land use types.
ParametersArterial RoadResidential AreaIndustrial Area
CODNH4TPCODNH4TPCODNH4TP
TSS0.52 **0.38 **−0.25 **0.45 **0.71 **0.76 **0.16−0.070.04
COD −0.09−0.53 ** 0.47 **0.52 ** 0.37 **0.70 **
NH4 0.43 ** 0.87 ** 0.50 **
** indicates p < 0.01.

