What Do Plants Leave after Summer on the Ground?—The Effect of Afforested Plants in Arid Environments
by
 ,
,
César Dionisio Jiménez-Rodríguez
1,2,* ,
,
Miriam Coenders-Gerrits
1,
Stefan Uhlenbrook
3 and
Jochen Wenninger
4 1
Department of Water Management, Water Resources Section, Delft University of Technology, 2600 GA Delft, The Netherlands
2
Escuela de Ingeniería Forestal, Tecnológico de Costa Rica, P.O. Box 159-7050, Cartago 30101, Costa Rica
3
UNESCO World Water Assessment Programme, Via dei Ceraioli, 45, 06134 Perugia, PG, Italy
4
Water Science and Engineering Department, IHE Delft, 2611 AX Delft, The Netherlands
*
Author to whom correspondence should be addressed.
Water 2019, 11(12), 2559; https://doi.org/10.3390/w11122559
Submission received: 15 October 2019
/
Revised: 29 November 2019
/
Accepted: 30 November 2019
/
Published: 4 December 2019
(This article belongs to the Special Issue Use of Water Stable Isotopes in Hydrological Process)
Abstract
:The implementation of afforestation programs in arid environments in northern China had modified the natural vegetation patterns. This increases the evaporation flux; however, the influence of these new covers on the soil water conditions is poorly understood. This work aims to describe the effect of Willow bushes (Salix psammophila C. Wang and Chang Y. Yang) and Willow trees (Salix matsudana Koidz.) on the soil water conditions after the summer. Two experimental plots located in the Hailiutu catchment (Shaanxi province, northwest China), and covered with plants of each species, were monitored during Autumn in 2010. The monitoring included the soil moisture, fine root distribution and transpiration fluxes that provided information about water availability, access and use by the plants. Meanwhile, the monitoring of stable water isotopes collected from precipitation, soil water, groundwater and xylem water linked the water paths. The presence of Willow trees and Willow bushes reduce the effect of soil evaporation after summer, increasing the soil moisture respect to bare soil conditions. Also, the presence of soil water with stable water isotope signatures close to groundwater reflect the hydraulic lift process. This is an indication of soil water redistribution carried out by both plant species.
1. Introduction
Continental arid environments are characterized by excessive heat and variable precipitation distributed all over the year, with a tendency to peak during summer months [1,2,3]. These conditions favoured the presence of a discontinuous vegetation cover characterized by banded and spotted shapes, large size variability and specialized plant species [3,4,5]. The northern arid lands in China are an example of this type of environment, where the landscape is shaped by eolic erosion due to the high erodability of this soil type and the scarce ground cover protection [6,7,8,9,10]. Consequently, desertification in this region registered a strong growth of barren areas before 1999 [11]. However, after 2005 the plant cover experienced a positive change, reducing the areas affected by desertification thanks to the rehabilitation and afforestation programs established in the region [11,12]. The current implementation of afforestation and agricultural programs modified the landscape cover with additional crop areas. These afforestation practices trigger a series of impacts to the environment due to the inadequate selection of plant species [13,14]. This increment in vegetation cover reduces the local surface temperature [15] and affects the local evaporation flux due to the increment of plant transpiration which depends mostly on groundwater [16,17,18].
The evaporation (E) of arid environments is mainly composed of soil evaporation () and a small proportion of intercepted water by plant surfaces () and transpiration () [19,20,21]. The low precipitation rates underline the importance of soil water and groundwater availability for the plants. Rainfall interception decreases the water infiltration rates of vegetated areas in respect to bare soil conditions in arid and semi-arid regions [22,23]. This is the result of the quick evaporation of the intercepted water on the leaves, branches and stem of the plants [19,21]. The relevance of interception increases considering the precipitation characteristics of the arid and semi–arid regions where the low volume, high intensity, lower and irregular frequency hinder the plant water acquisition [5]. Due to the scarce water resources in these regions the plants are adapted to quickly respond to environmental triggers such as the irregular rains [24]. Thus increases the soil water acquisition by the plants and consequently its transpiration momentarily [25,26].
The plant root system provides anchorage for the plant and an effective water extraction system [27] which is powered by the plant transpiration [28]. This system absorbs the water close to the meristematic region of the root, transporting it through the xylem towards the leaves and using it during photosynthesis [28,29,30]. However, the presence of young roots in soil layers does not mean effective absorption of water from those zones [31]. Instead, some species are able to absorb water through suberized roots under soft drought or winter conditions [28,30]. As a consequence, the identification of plant water sources is a difficult task that requires the use of tracers.
Determination of water sources for the plants has been successfully done with the stable water isotopes oxygen (O) and hydrogen (H) [18,27,32,33,34,35,36,37,38,39,40]. The specific isotopic signatures of soil water is the result of a fractionation process that modifies the isotope composition [41,42], allowing to trace the water paths within the ecosystem [43]. The isotope signature of the absorbed water is not modified by plant uptake until the water reaches the photosynthetic tissues [27,31]. Here, the leaf tissues will become enriched by the escape of lighter isotopes [44]. Although the roots do not modify the soil water during uptake, the isotope signature of xylem water is affected by mixing processes when different water sources are used by the same plant. Barbeta et al. [41] briefly describe a series of analysis tools used for the determination of water sources used by plants. Some of these methods are the Bayesian isotope mixing models such as SIAR [45,46] and MixSIAR [47] or standard linear mixing models such as IsoSource [48,49]. The IsoSource model provides all the feasible combination of water source contributions keeping the mass balance principle. It uses only the isotope signature of the water sources and the xylem water as the final mixture. SIAR and MixSIR models require more complex data sets. These models require the isotope signatures of the sources and mixtures as well as their standard deviations and an enrichment factor. As a result, the models provide the statistical uncertainties and the optimal solution for the analyzed mixture. The IsoSource tool has been used to study sand dunes bushes, corn and cotton plantations, woody species and estuarine vegetation to determine the water sources of those covers [33,34,36,37,39,40]. Thus can provide information of the origin of water within the plant and if this water can be redistributed on the soil profile.
The implementation of afforestation programs in arid environments modify the distribution patterns of local vegetation, influencing the ratio between transpiration and evaporation () [50]. These changes together with the usual omission of interception of precipitation [19,21,51], the irregular rains [5] and the large capacity to transpire soil water by arid plants [52]; exert a lot of pressure on the scarce water resources of arid environments. This has been the case with the introduction of Willow trees (Salix matsudana) and Willow bushes (Salix psammophila) in afforestation programs in the Hailiutu catchment [16,17,18]. The transpiration of these species increased the demand on the groundwater resource, however its influence on the soil water conditions are poorly understood. This work aims to describe the effect of Willow trees and Willow bushes on the soil water conditions after the summer. The monitoring included the soil moisture, fine root distribution and transpiration fluxes that provided information about water availability, access and use by the plants. Meanwhile the monitoring of stable water isotopes collected from precipitation, soil water, groundwater and xylem water linked the water fluxes. This information provided an indication of the vegetation influence on the soil water conditions beneath the covers.
2. Materials and Methods
2.1. Study Site
The study site is located within the Hailiutu catchment (area: 2645 km2) in Yulin County; Shaanxi province; Northwest China (Figure 1). This catchment is part of the Maowusu semi-desert, which is characterized by undulating sand dunes over and dominated by a xeric scrubland. The nearest meteorological stations (Dong Shen: 39.833° N–109.983° E; Yanchi: 37.800° N–107.383° E; and Yulin: 38.233° N–109.700° E) described a semi-arid continental climate with a mean annual precipitation of 386.1 mm year−1 and a mean annual temperature of 8.6 °C (seasonal range: −17.4 °C to 27.1 °C) based on 12 years of meteorological records (period: 2000–2011). The soil type is classified as Calcaric Arenosols (ARc) with a high concentration of basic cations (Ca2+, Mg2+, K+ and Na+) and a pH value over 8.0; with an excessive drainage due to its sandy texture [53]. The study site is composed of two experimental plots (see Appendix A Figure A1) located at 300 m from each other. The first plot is dominated by Willow bushes (Salix psammophila C. Wang & Chang Y. Yang) and has an area of 625 m2 (2 5 m × 2 5 m). The second plot covers 81 m2 (9 m × 9 m) and contains mainly individuals of Willow trees (Salix matsudana Koidz.) and Poplar trees (Populus simonii Carr.). In both plots soil water, groundwater, plant parameters and soil variables were measured between September and October 2010.
2.2. Hydrologic Data
Meteorological data was retrieved from the stations Dong Shen (1459 m a.s.l.), Yanchi (1356 m a.s.l.) and Yulin (1058 m a.s.l.). The climatic data was downloaded from the National Oceanic and Atmospheric Administration (NOAA) [54]. This data set contains daily values of total precipitation (mm day−1) and daily means for temperature (°C), dewpoint (°C), wind speed (m s−1) and atmospheric pressure (mbar). Due the lack of solar radiation measurements in the selected study period, this variable was estimated according to Allen et al. [55] for missing data. Once all data were determined, the reference evaporation () in mm day−1 was calculated with the FAO Penman–Monteith equation:
where net radiation () and soil heat flux (G) are expressed in MJ m−2 day−1. The vapour pressure deficit of the air () is based on the saturation vapor pressure () and actual vapor pressure () both measured in KPa. is the slope of the vapour-pressure relationship (kPa °C−1), is the psychrometric constant (0.054 kPa °C), is the air density (1.225 kg m−3) and is the specific heat of the air (1.013 ×10⁻³ MJ kg−1 °C−1). The wind speed (m s−1) at 2 m height () was used to determine the aerodynamic resistance () and surface resistance (). For daily time steps the soil heat flux is considered to equal 0 MJ m−2 day−1 due the small daily differences [55].
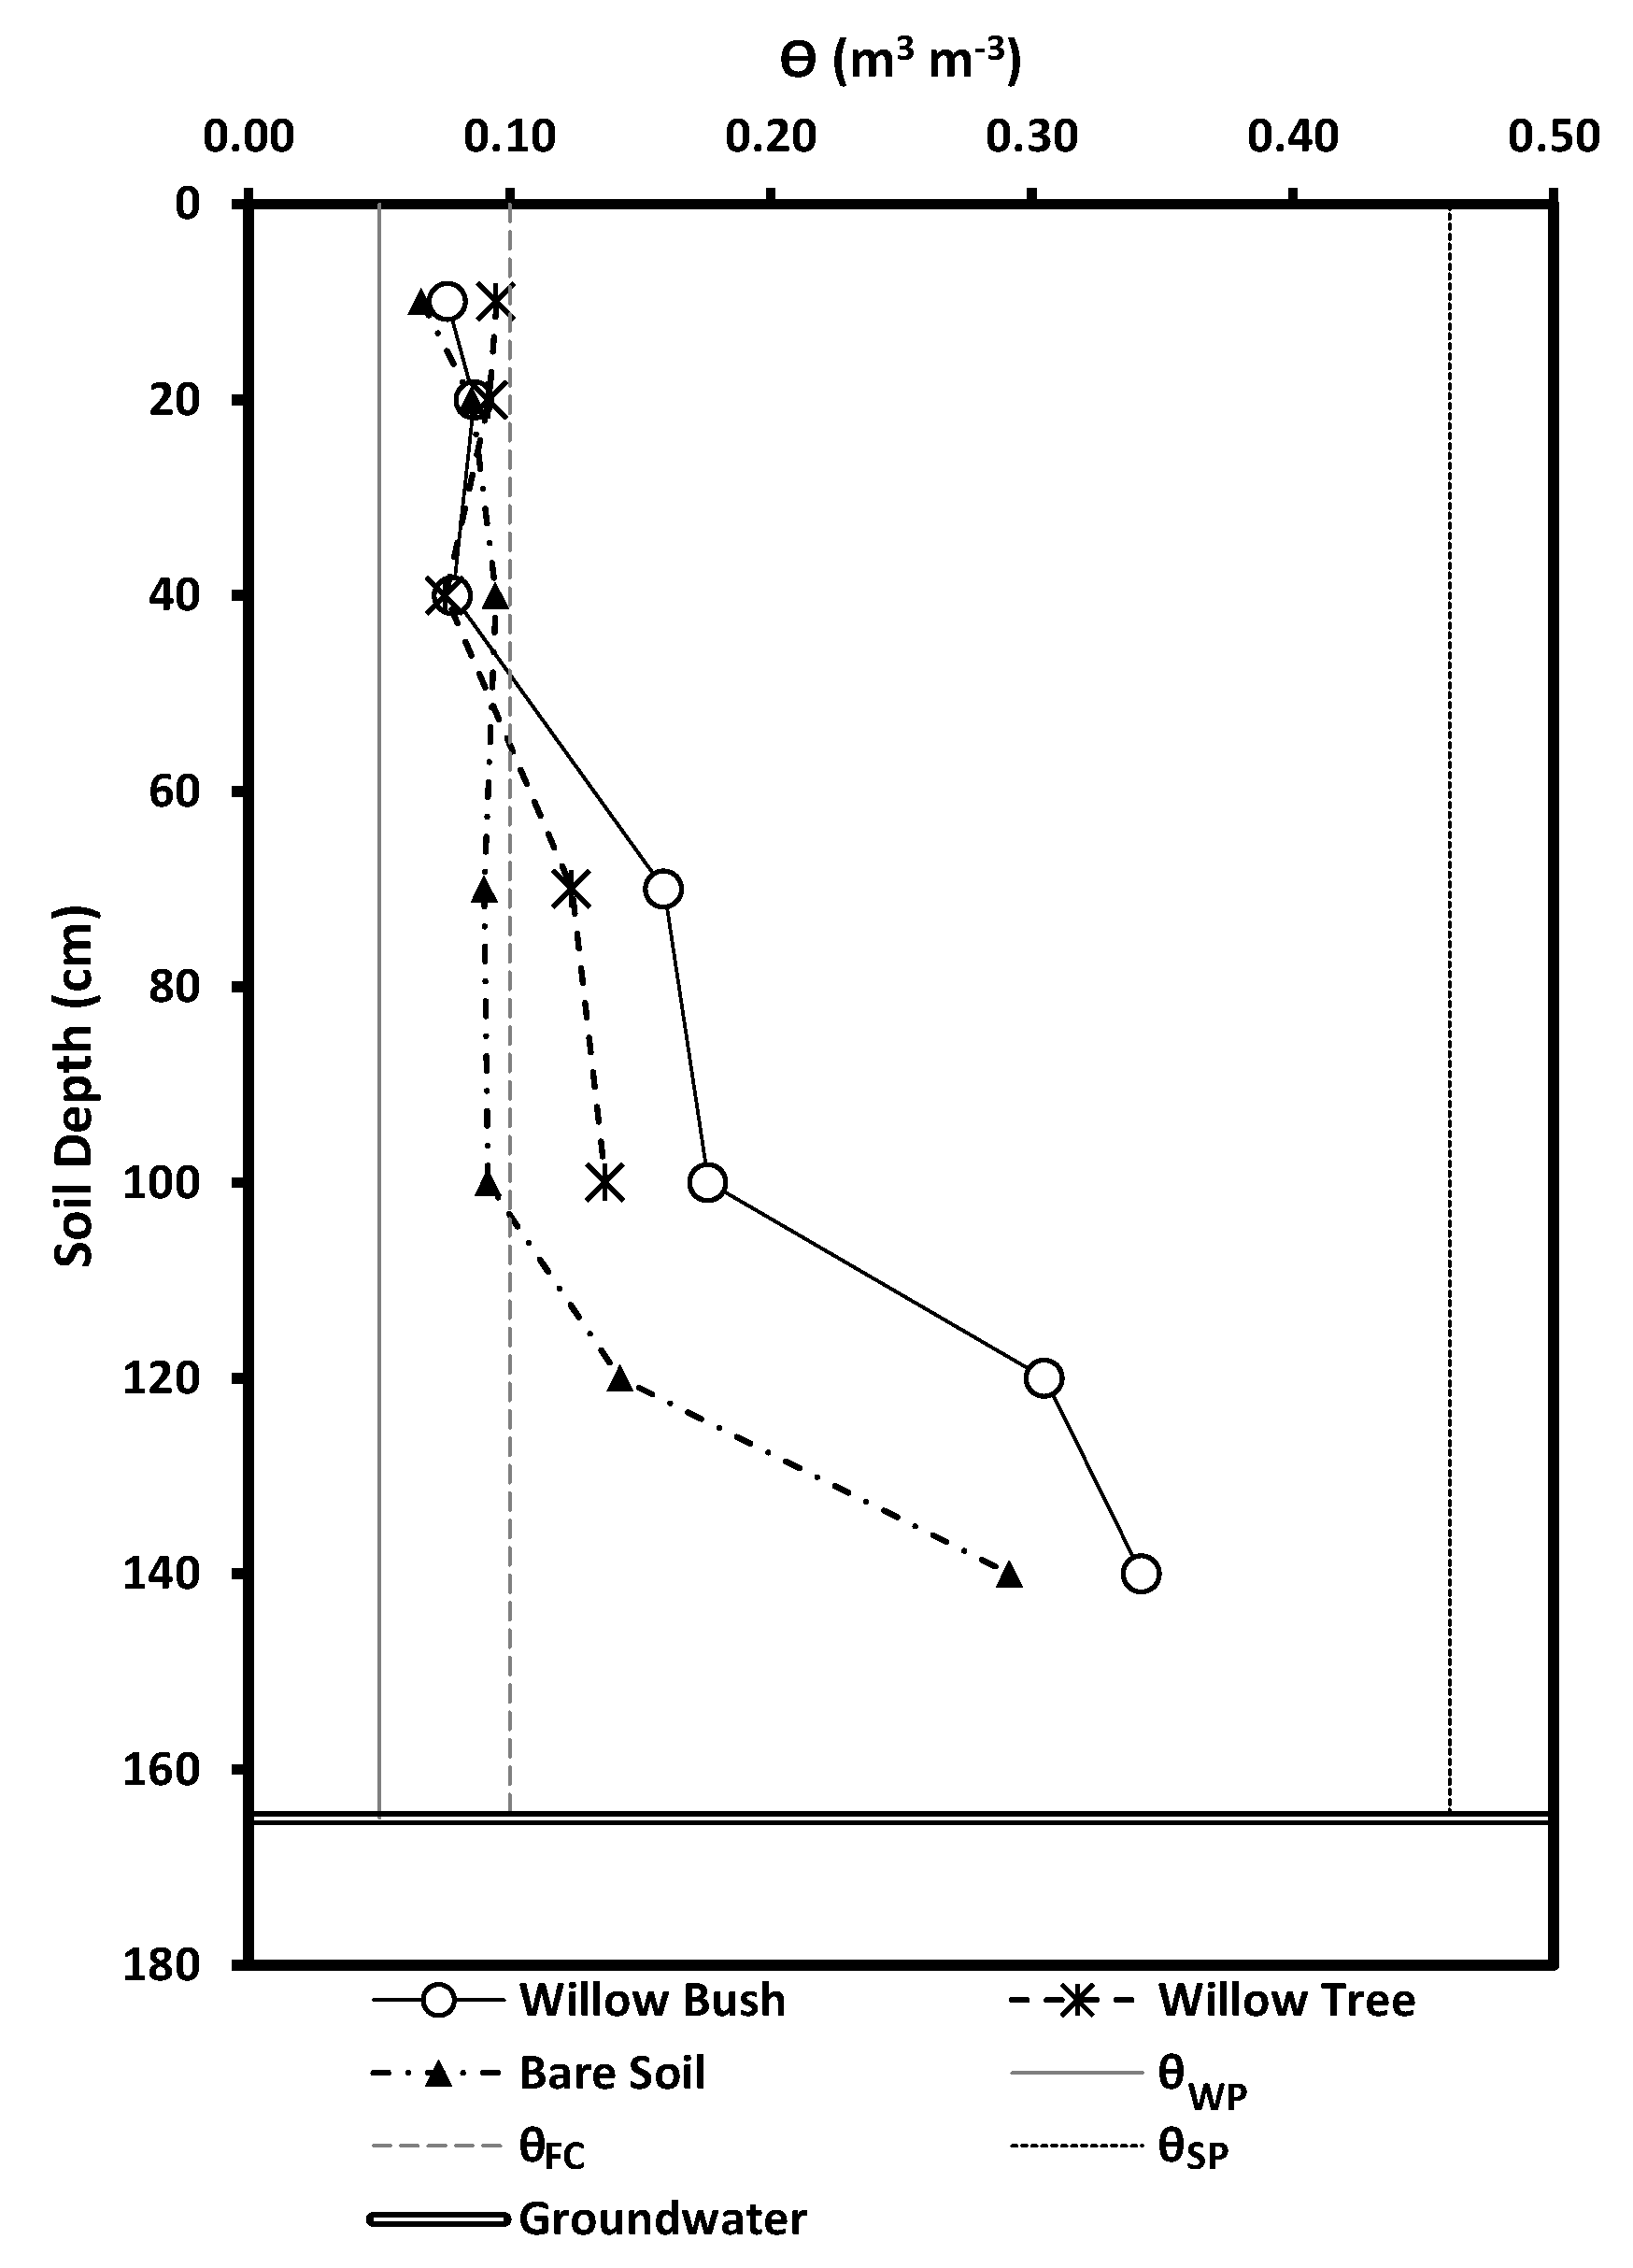
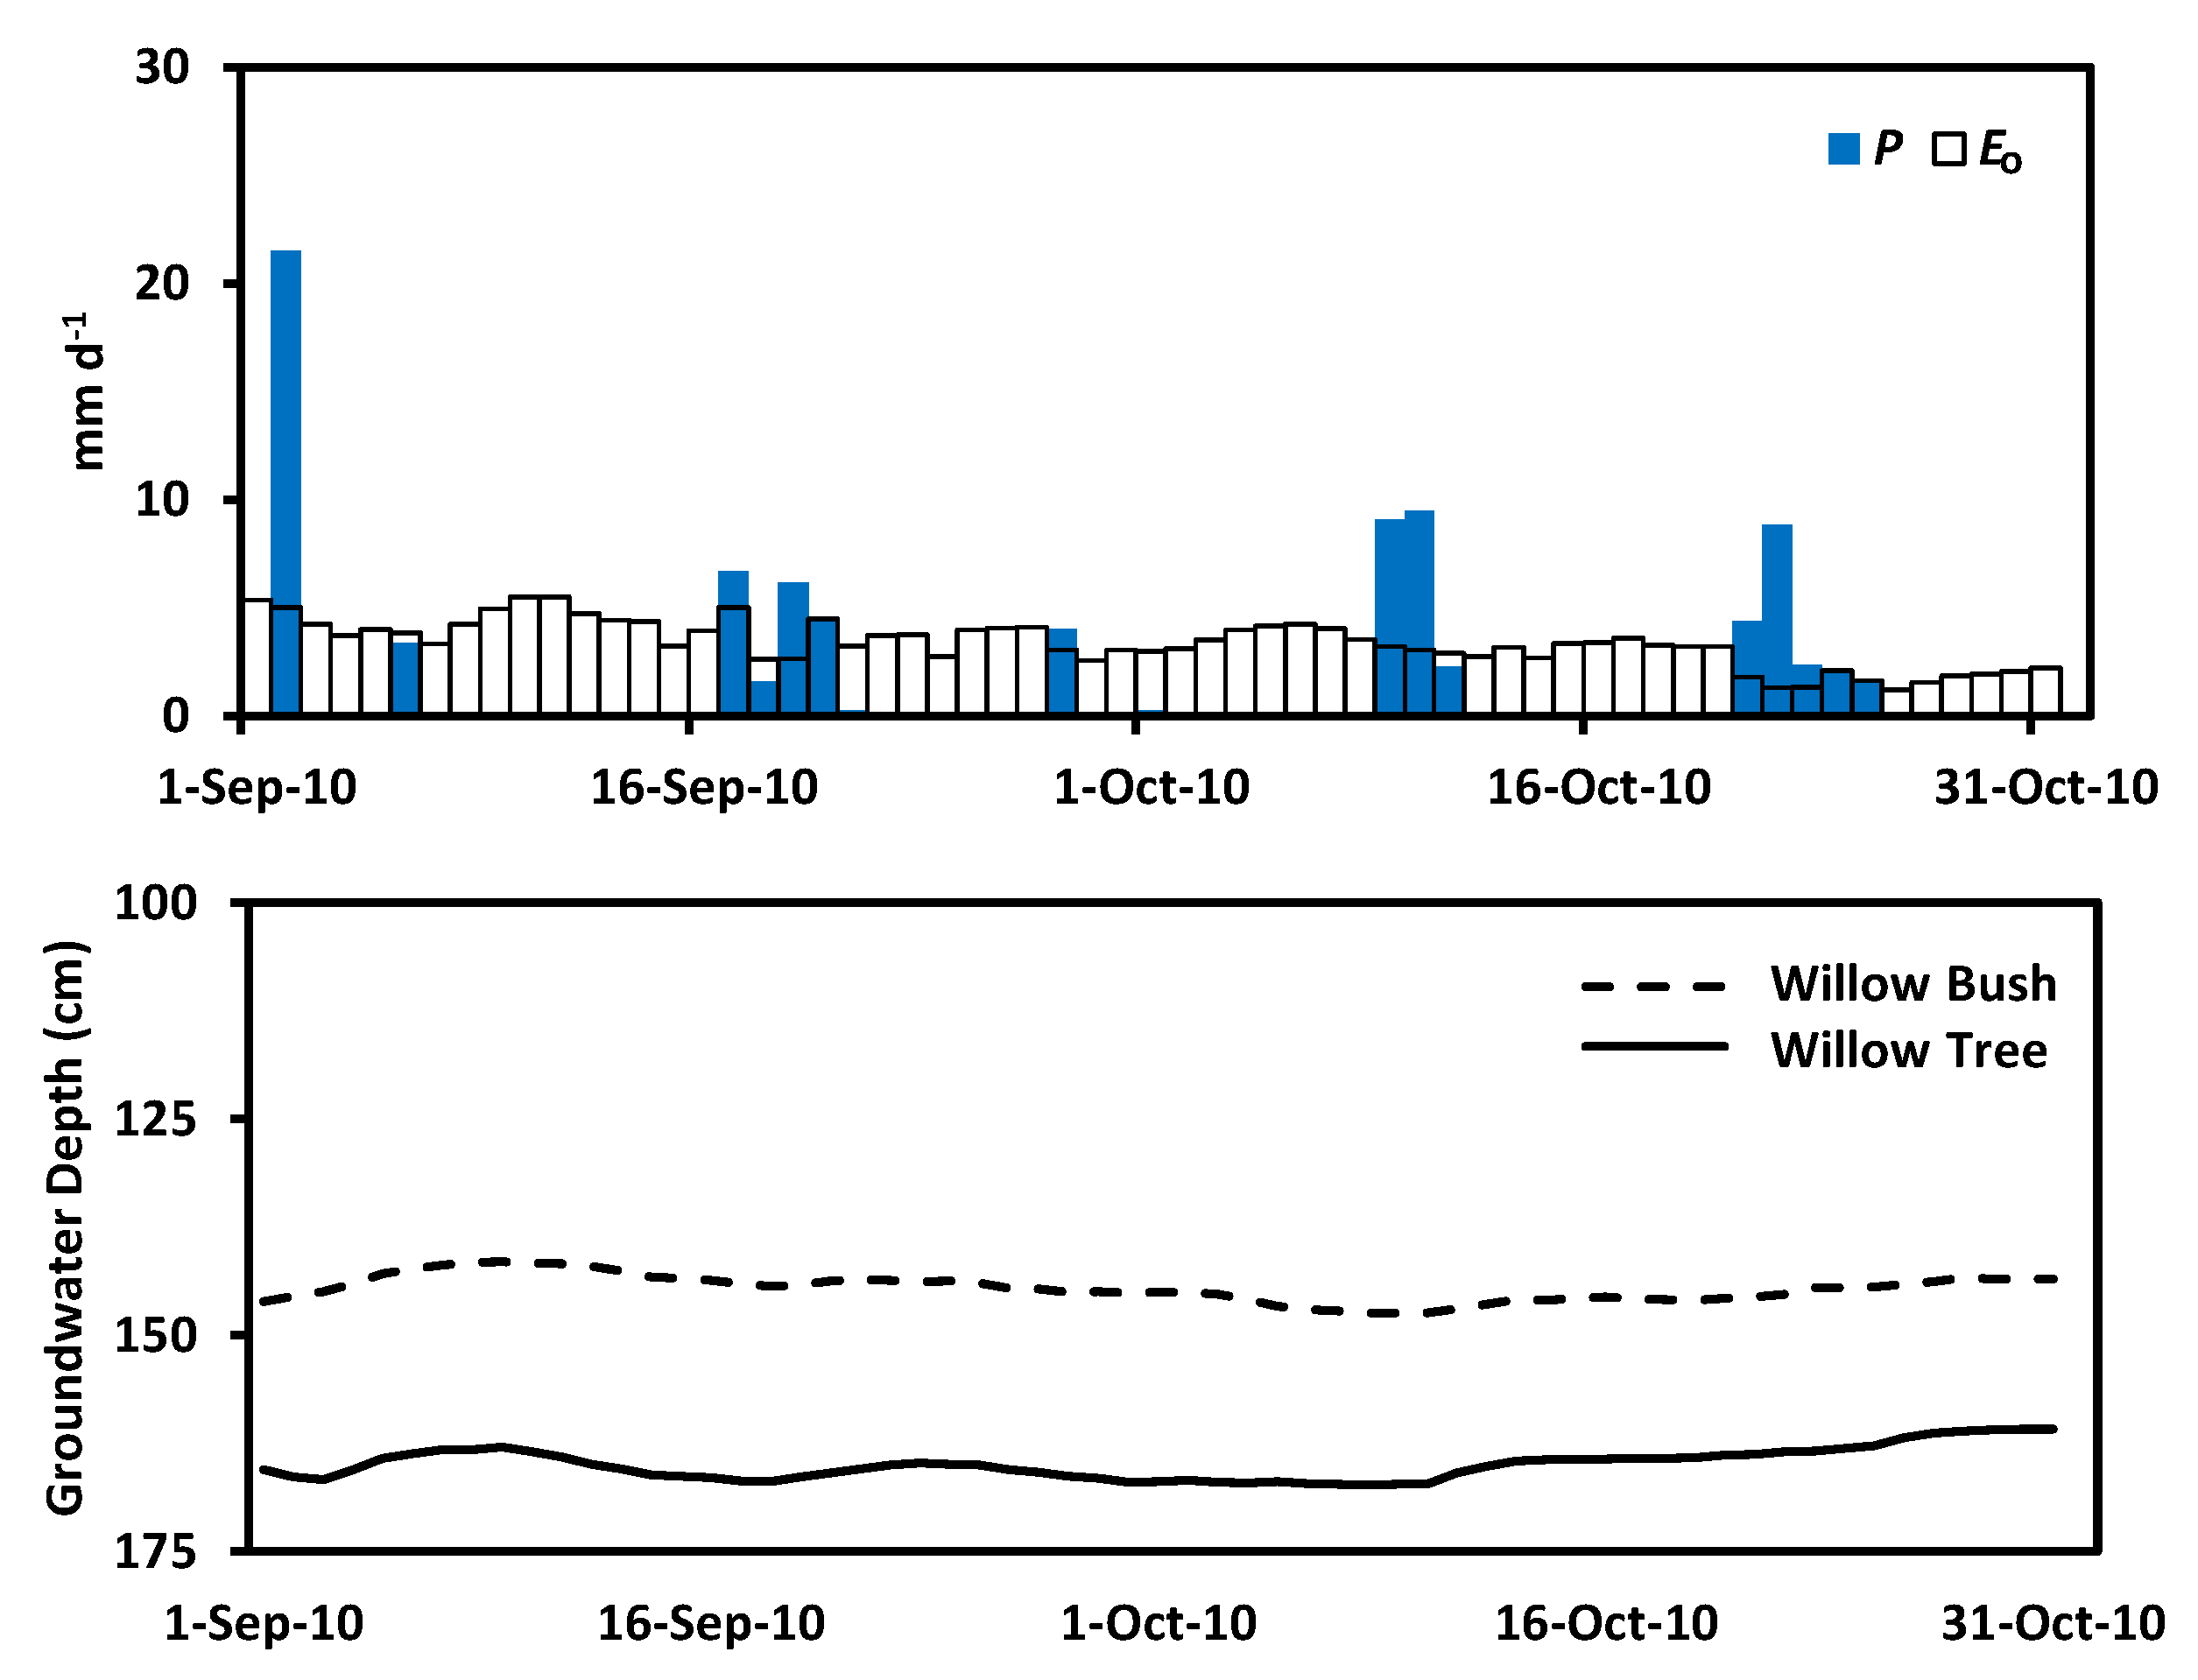
Soil moisture (, m3 m−3) and groundwater level (h, m) measurements were carried out to describe the soil water dynamics in both sites. Soil moisture measurements were carried out sporadically along the study period. The reference values of soil moisture in sandy soils for permanent wilting point (), field capacity () and saturation point () were 0.05 m3 m−3, 0.1 m3 m−3 and 0.46 m3 m−3, respectively [56]. Soil moisture was monitored with a Mini-TRASE sensor (type: 6050X3K1B) and the probes were located at 10 cm, 20 cm, 40 cm, 70 cm and 100 cm depth beneath each species. On the Willow bush plot two more depths were monitored: 120 cm and 140 cm. Considering the presence of bare soil areas within the plots, the soil moisture was also monitored at the same depths as Willow bush. The groundwater monitoring wells were constructed with a manual soil auger thanks to the shallow groundwater level and sandy texture of the soil. The groundwater level was measured on a daily basis from the ground surface as the reference point with a Mini-Diver (type: DI 501) in each plot. Groundwater depth from the surface in both plots oscillates between 136 cm to 164 cm beneath the Willow bush plot and between 150 cm to 172 cm beneath Willow tree plot period between 21 August 2010 to 20 April 2011).
2.3. Water Sampling
Water samples were collected after each rainy day to determine the isotopic signature of the precipitation, groundwater, soil water and xylem water throughout the monitoring period. Soil water samples were taken with a Macro Rhizon SMS Eijkelkamp (length: 9 cm, diameter: 4.5 mm, porous diameter: 0.15 μm, part number: 19.21.SA) soil moisture sampler in both plots. The samples were collected at nine depths (10 cm, 20 cm, 40 cm, 70 cm, 90 cm, 110 cm, 140 cm, 150 cm and 160 cm), while the groundwater sampling depended on the water head elevation during the samplings. Xylem water was collected from an incision done at the twig of each tree; removing the bark, phloem and cambium to prevent the collection of fractionated sap water. The incision location was far from the meristematic region, avoiding the fractionation linked to photosynthesis. Rain water was collected during the events to prevent fractionation by evaporation on an event basis. Each sample was sealed hermetically in 1.5 mL vials and transported to The Netherlands for their analysis. The isotopic composition was determined with a LGR Liquid Water Isotope Analyzer (type: DLT-100) with a precision of < 0.3‰ for 18O/16O and < 1.0‰ for 2H/1H and expressed in respect to the Vienna Standard Mean Ocean Water (VSMOW). The isotopic signature of each sample was expressed in respect to the VSMOW through the following equation [57]:
where (‰) is the relative isotope composition of 18O and 2H, and are the ratios of heavy to light isotopes (18O/16O or 2H/1H) of the sample and standard water, respectively.
2.4. Plant Parameters
For each plot the plant densities (plants ha−1), canopy heights (m) and leaf area index (LAI, m2 m−2) were measured to describe the stand conditions. Transpired water () was monitored in the Willow shrubs establishing four ring gauges (type: Dynagage Energy Balance sensor, model: SGA3-WS and SGA5-WS) in an individual of Willow bush at 35 cm height; while five probes (type: Thermal Dissipation Probes, model: TDP-50) were installed in an individual of Willow at 1.3 m height. Each probe recorded the data at 10 minute intervals and those were summarized in an hourly and daily time step. Total mobilized water as transpiration was calculated with the product between the sapwood area and flow velocity. Considering the physiognomic differences between both plant species, the sapwood area was estimated accordingly with the plant type. Willow bush is a bush up to 4 m tall with numerous branchlets per plant [58], where most of the xylem within the branchlets is able to transport water. As a consequence, the sapwood area was measured through the average diameter of the measured branchlets. Willow tree is able to grow up to 10 m height with a symmetrical crown with a sole stem [59]. It has a clear differentiation between sapwood and hardwood, allowing to measure directly the sapwood from a tree wood ring obtained from the measured tree. The wood ring area was measured from inked water transported by capillary rise within the active sapwood sections. Sapwood area (A) for the Willow tree was 274.6 cm2 and the average area for Willow bush was 5.1 cm2. Transpiration flow for each plant was obtained though the empirical equation developed by Granier [60]:
where is the transpiration (g h−1), is the vertical temperature difference (°C) measured within the plants, is the maximum temperature difference with zero (°C), A is the cross section area (cm2) and is the water density (g cm−3).
The fine root system was described through the total root biomass (TRB, kg m−3) and the root length density (RLD, cm cm−3). The survey involved the collection of 80 samples of soil per species with an auger of 300 cm3 within a radius of 4.0 m. The sampling procedure was based on eight equidistant points from the stem towards the canopy edge, extracting 10 samples per point until a depth of 150 cm was reached. The samples were sieved to separate the soil from the roots, photographed on a scaled paper and dried up following the procedure proposed by Cornelissen et al. [61] to determine the root length density (RLD, cm cm−3). The total root biomass was determined by weighing the dry cleaned roots with a digital balance. The total root length (cm) was determined by processing the root images with the use of the GIS free source software (www.gvsig.org). The total root length density was obtained dividing the total root length (cm) by the core volumes (cm3) [62].
2.5. Data Analysis
Plant differences were determined using an Analysis of Covariance (ANCOVA) with a p of 0.05. Statistical differences were determined with a Tukey HSD analysis. A Pearson correlation analysis was applied to evaluate the influence of meteorological conditions on plant transpiration. All the statistical analyses are based on normal distributions, so the normality, variance homogeneity and presence of outliers were tested. The plant water source of transpiration was determined using the software IsoSource [48]. This model provides the relative contributions of soil water sources to sap flow in both species, based on the isotopic mass balance principle. Consequently, the isotopic soil water contribution analysis followed the “a posteriori aggregation” method proposed by Phillips et al. [48]. This method allows the aggregation of sources with similar isotopic signatures based on specific characteristics showed by the sources, reducing the number of contributing factors.
3. Results
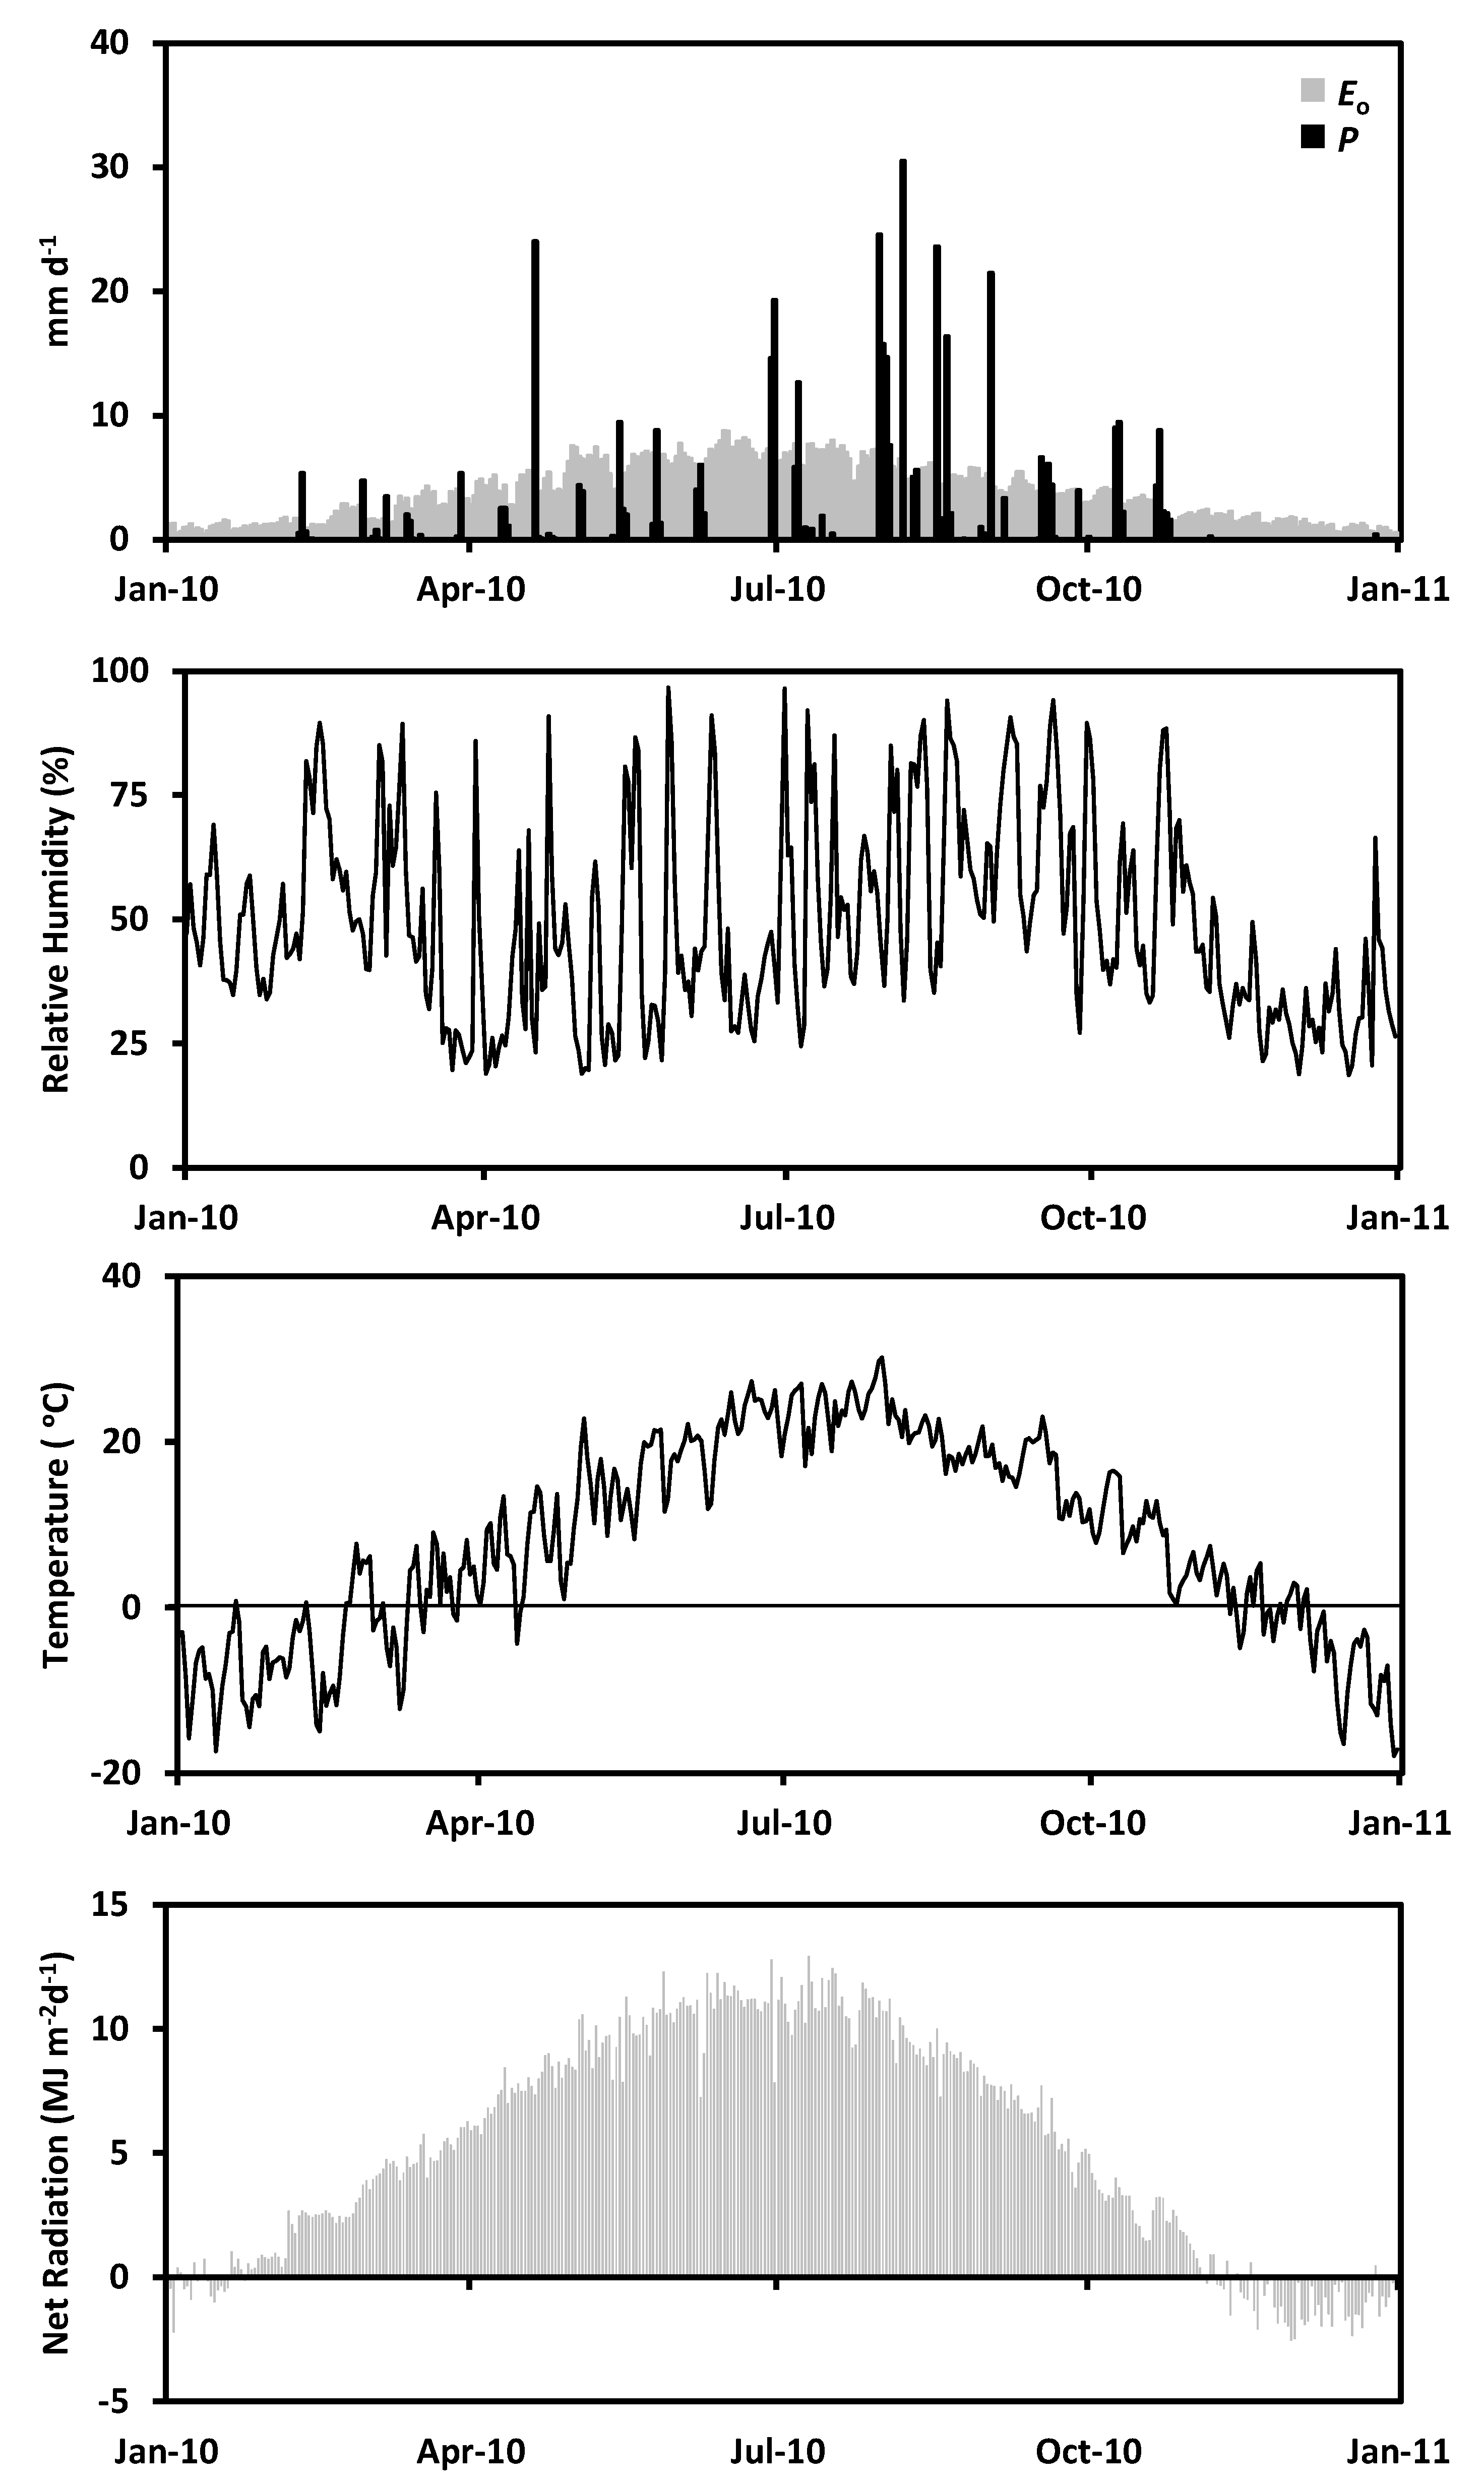
Total precipitation in 2010 was 401.0 mm year−1 at the experimental site, registering a slightly wet condition in respect to the regional average of 386.1 mm year−1. However, this amount of precipitation does not supply the reference evaporation () of 1339.1 mm year−1 at this site as a consequence of the irregular rain events (Figure 2). The 938.1 mm year−1 difference between precipitation and reference evaporation support the Arid Steppe classification due to its annual water deficit [3,5,63,64]. September and October 2010 registered 48.2 mm month−1 and 40.5 mm month−1 of precipitation accounting for 12.0% and 10.1% of the annual amount, respectively (see Appendix B Figure A2). The water availability experienced during the study period allowed the presence of soil moisture above the permanent wilting point () for sandy soils (0.05 m3 m−3) while the field capacity () was exceeded only in the deepest layers in both plots (Figure 3). Additionally, soil moisture increases with depth in Willow bush and Willow tree stands, keeping higher values than under bare soil conditions. Soil moisture under both plant species has larger values in respect to bare soil condition until a depth of 100 cm (ANCOVA, F = 37.91, p = 0.0000). Average soil moisture shows the following order: Willow bush (: 0.11 m−1 m−3) > Willow tree (: 0.10 m3 m−3) > Bare Soil (: 0.08 m3 m−3).
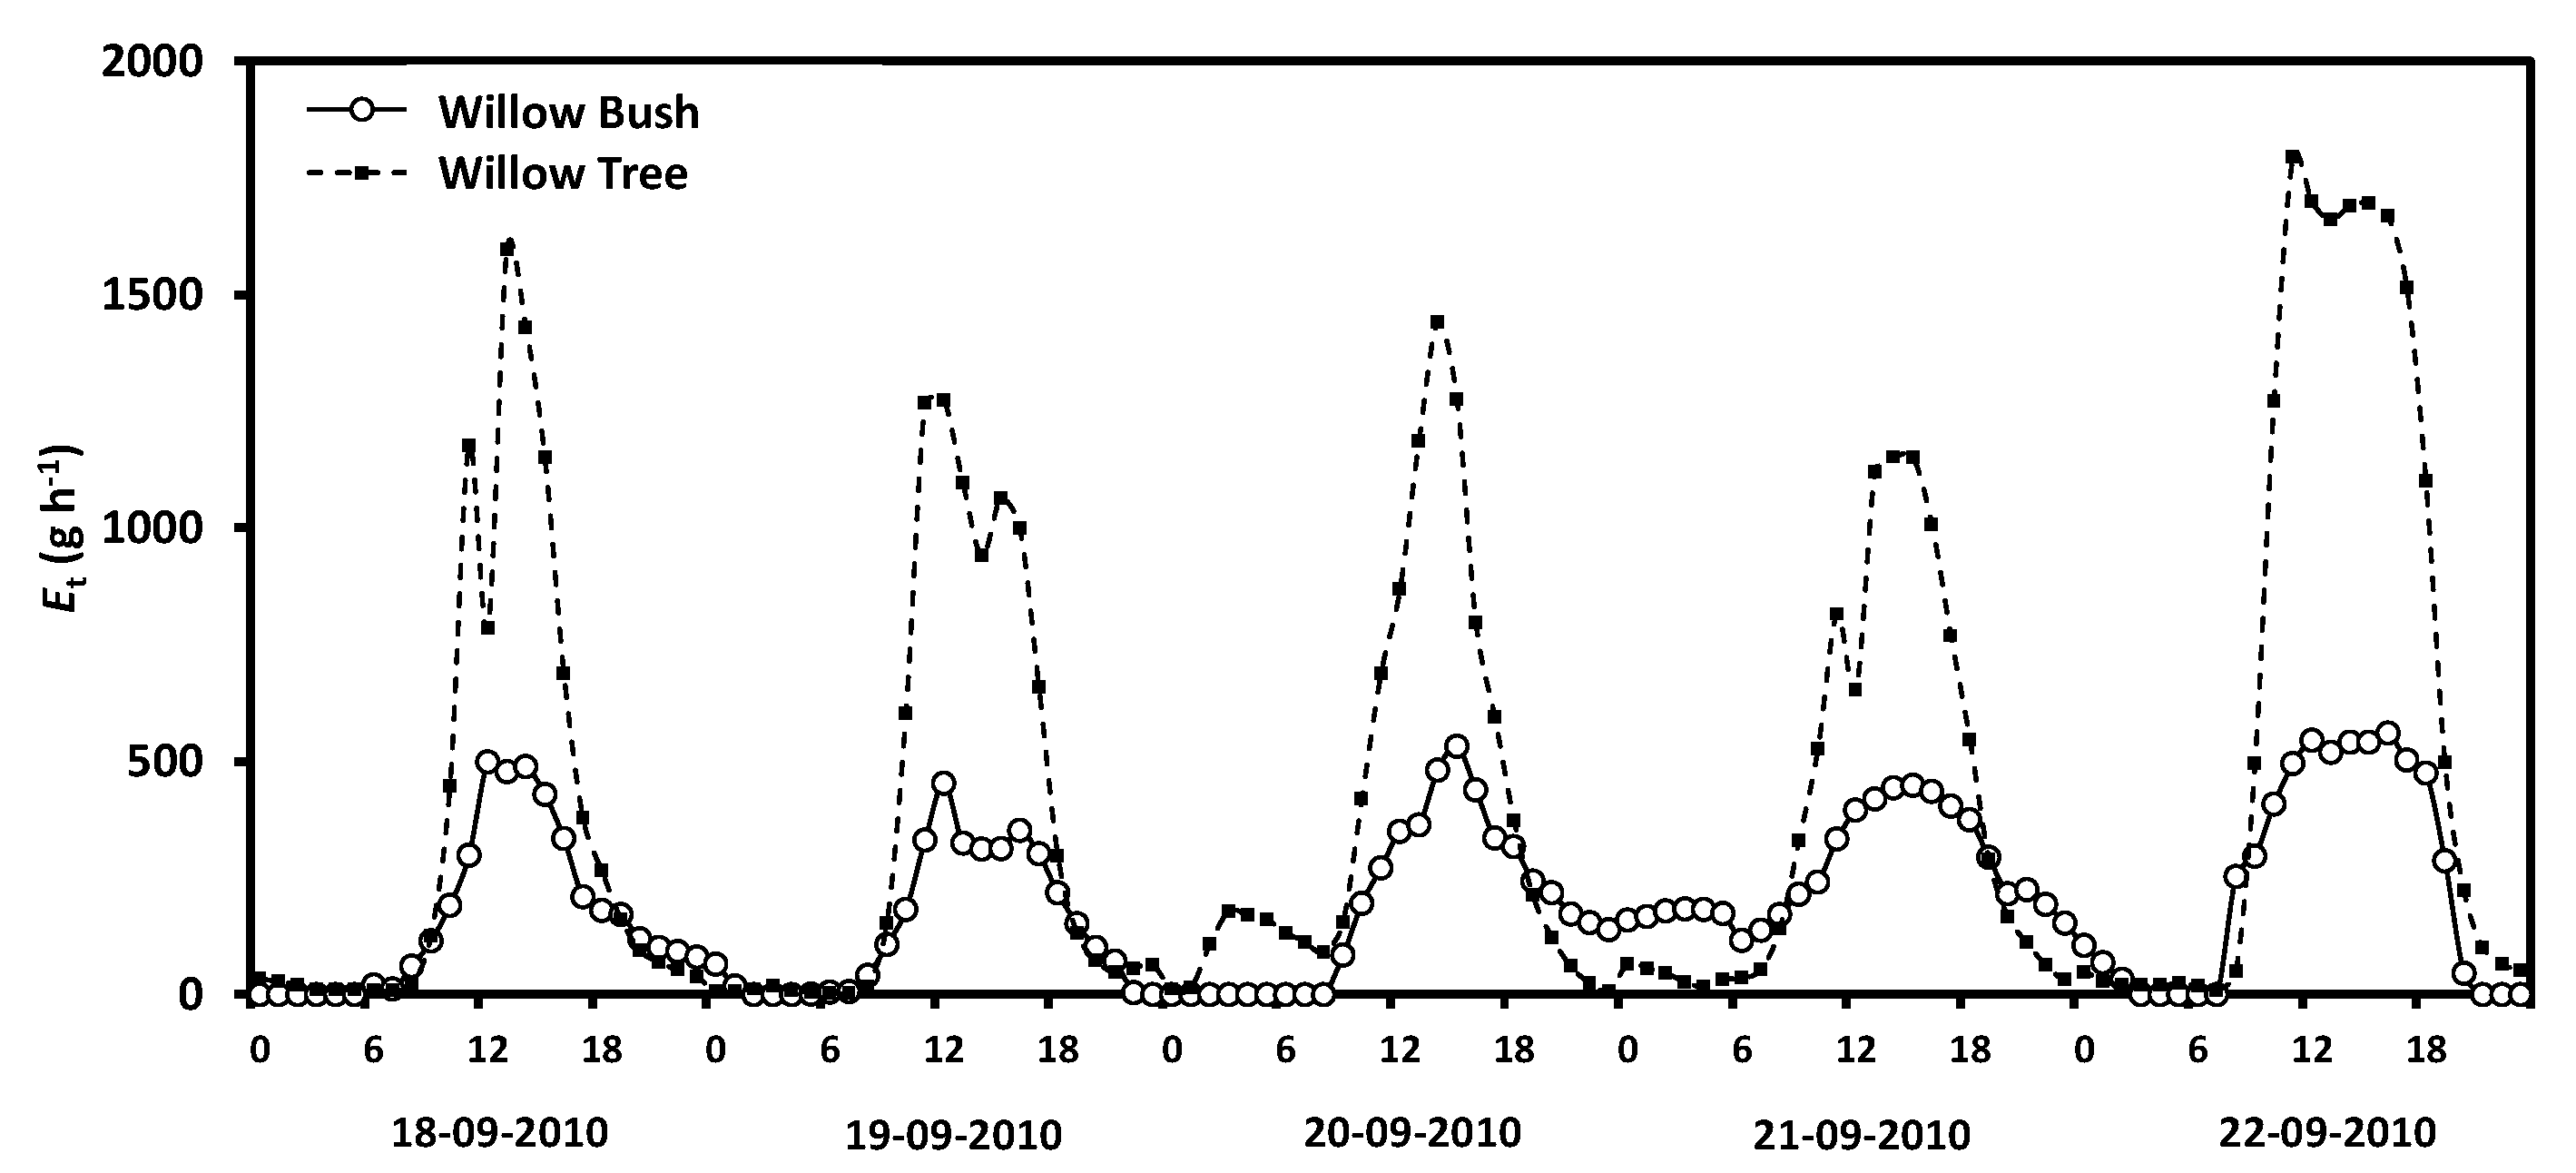
Hourly transpiration differs in amount and timing between species. Figure 4 shows the differences along five days where the sap flux for Willow tree is remarkably higher than Willow bush. Willow tree shows a larger capacity to transpire water with peak fluxes averaging 1549.1 g h−1; whereas Willow bush peaks do not exceed 500 g h−1 on average. Daily transpiration rates in both species depict a significant decreasing trend (ANCOVA, F = 36.09; n = 87, p = 0.0000) and a statistical difference between total daily rates (ANCOVA, F = 63.05, n = 87, p = 0.0000), where Willow bush transport an average of 4.57 kg day−1 being three times smaller than Willow tree fluxes (12.82 kg day−1). In addition, as transpiration is a physiological response to environmental climatic parameters the Pearson correlation analysis (p < 0.001) shows a significant positive correlation with temperature (r = 0.47) and net radiation (r = 0.35); while wind speed (r = 0.05) and relative humidity (r = −0.27) are not significant.
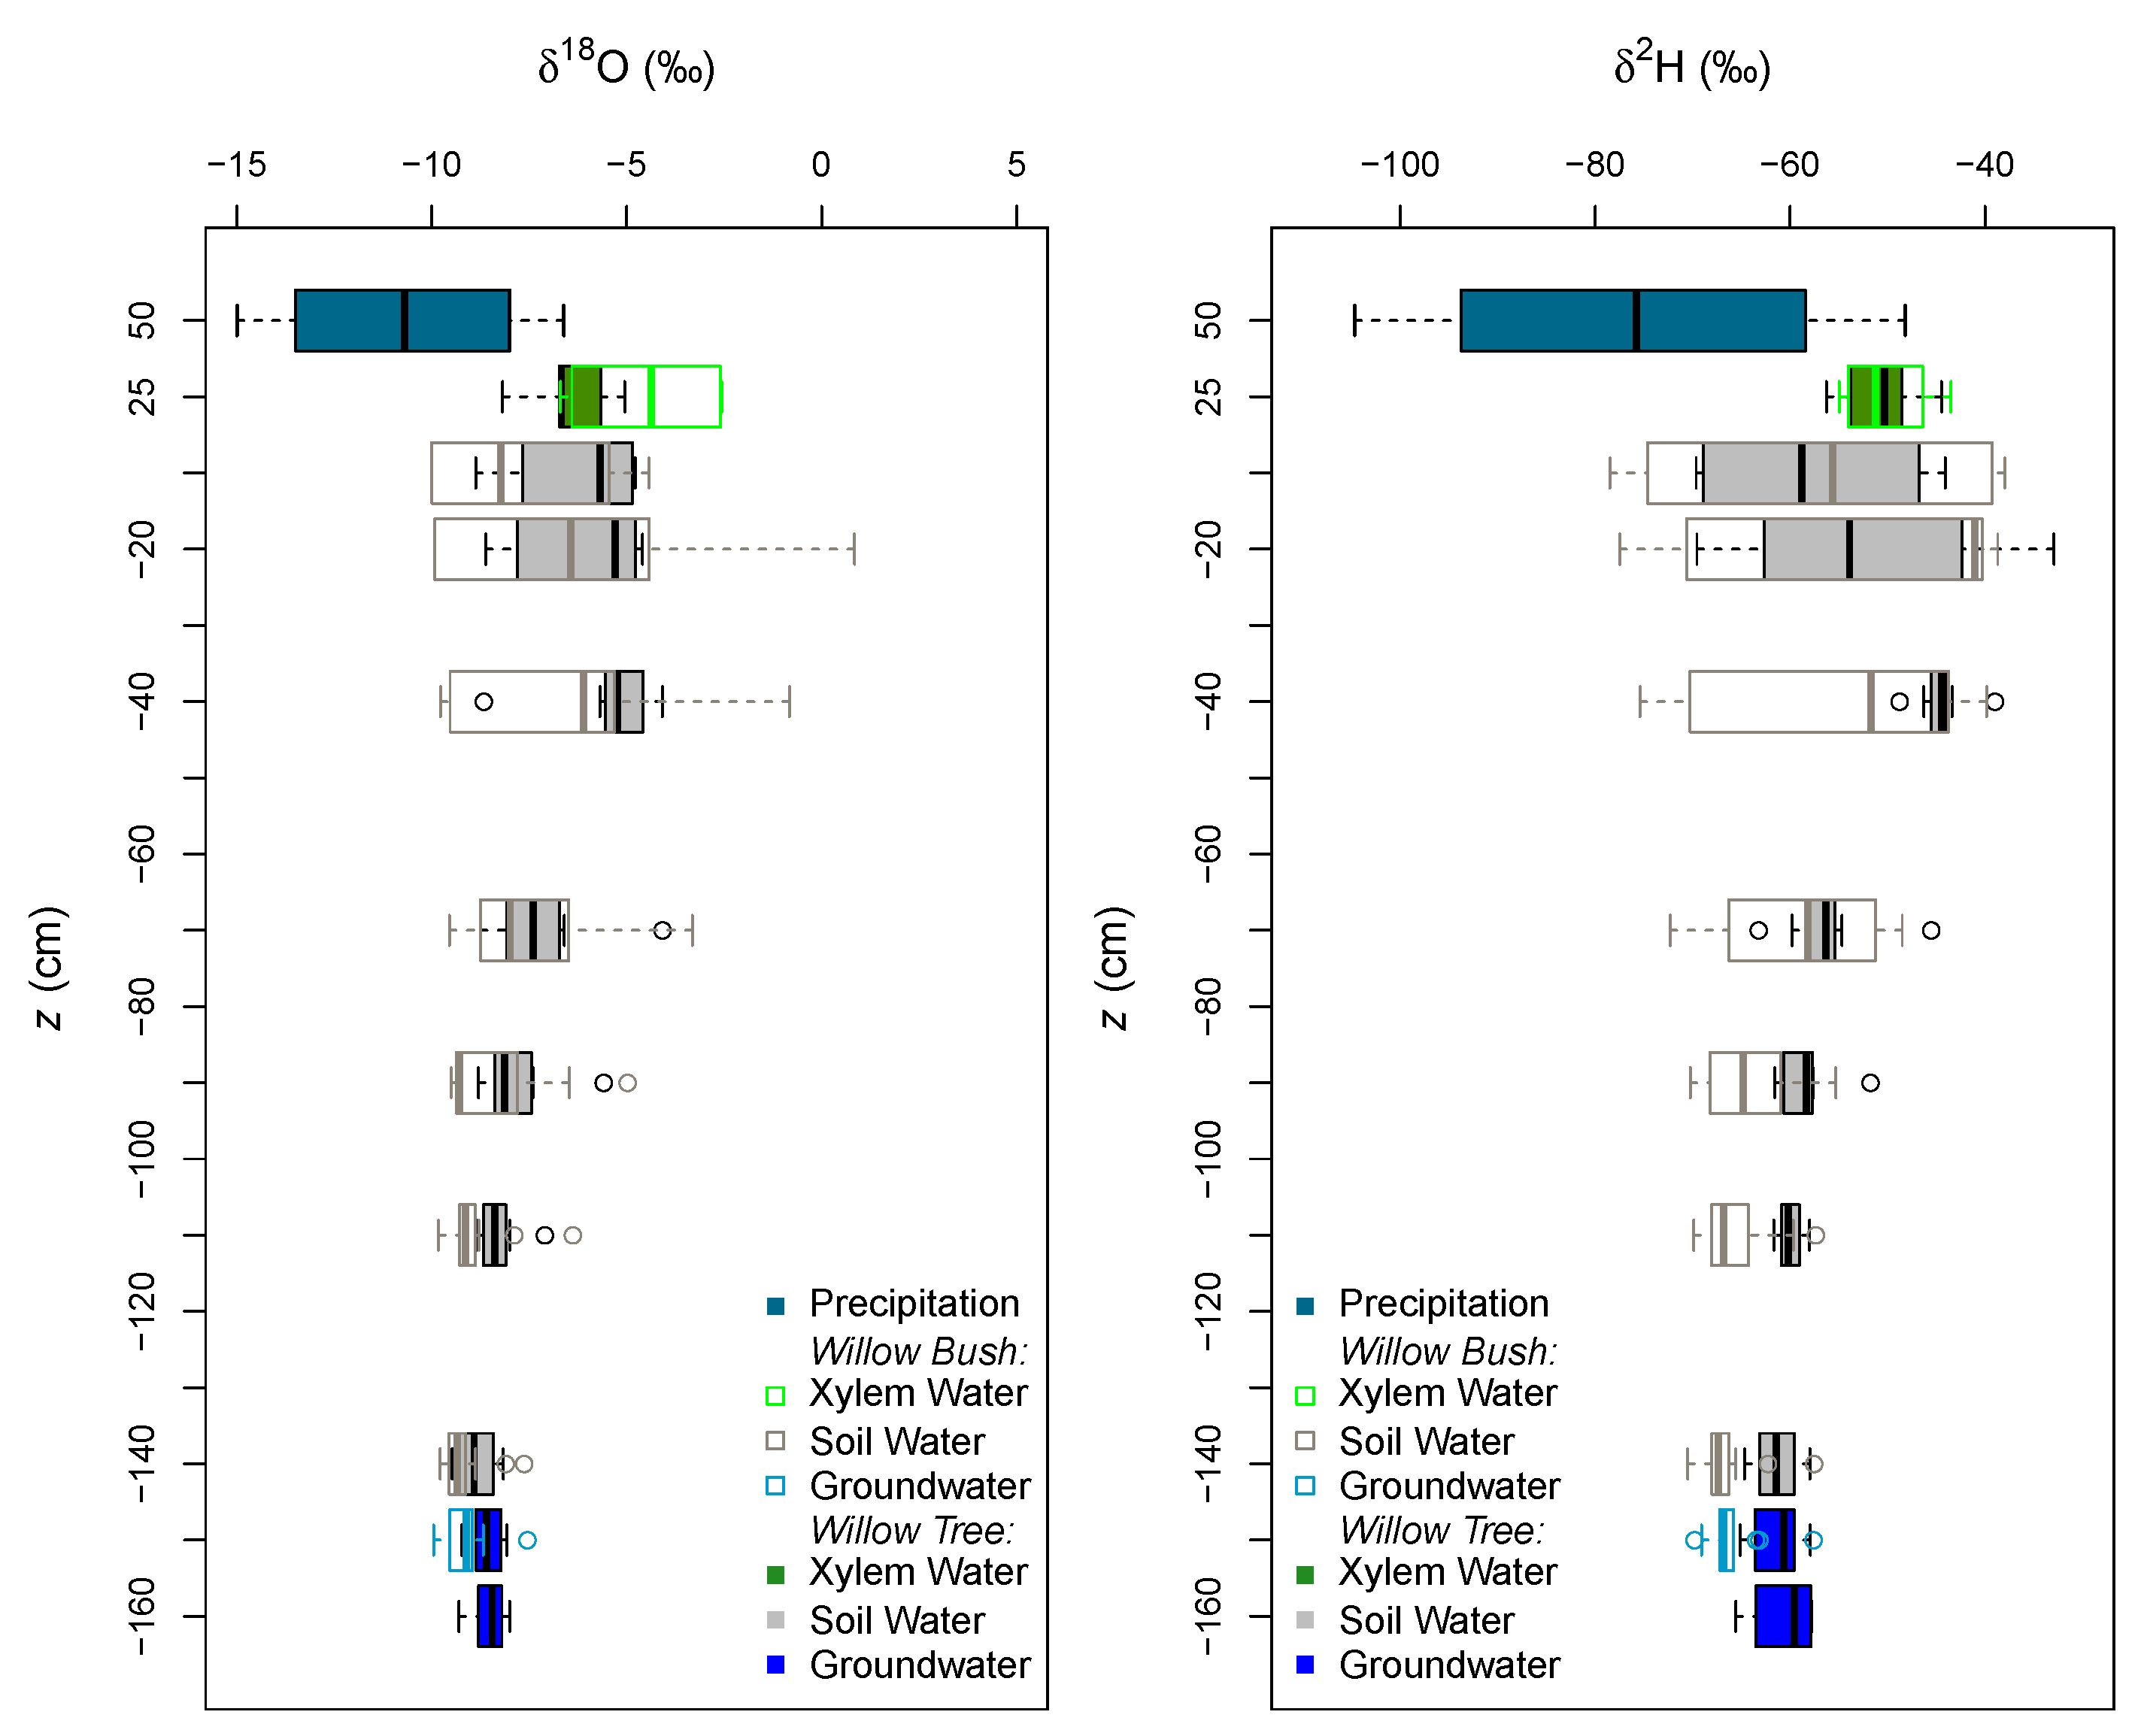
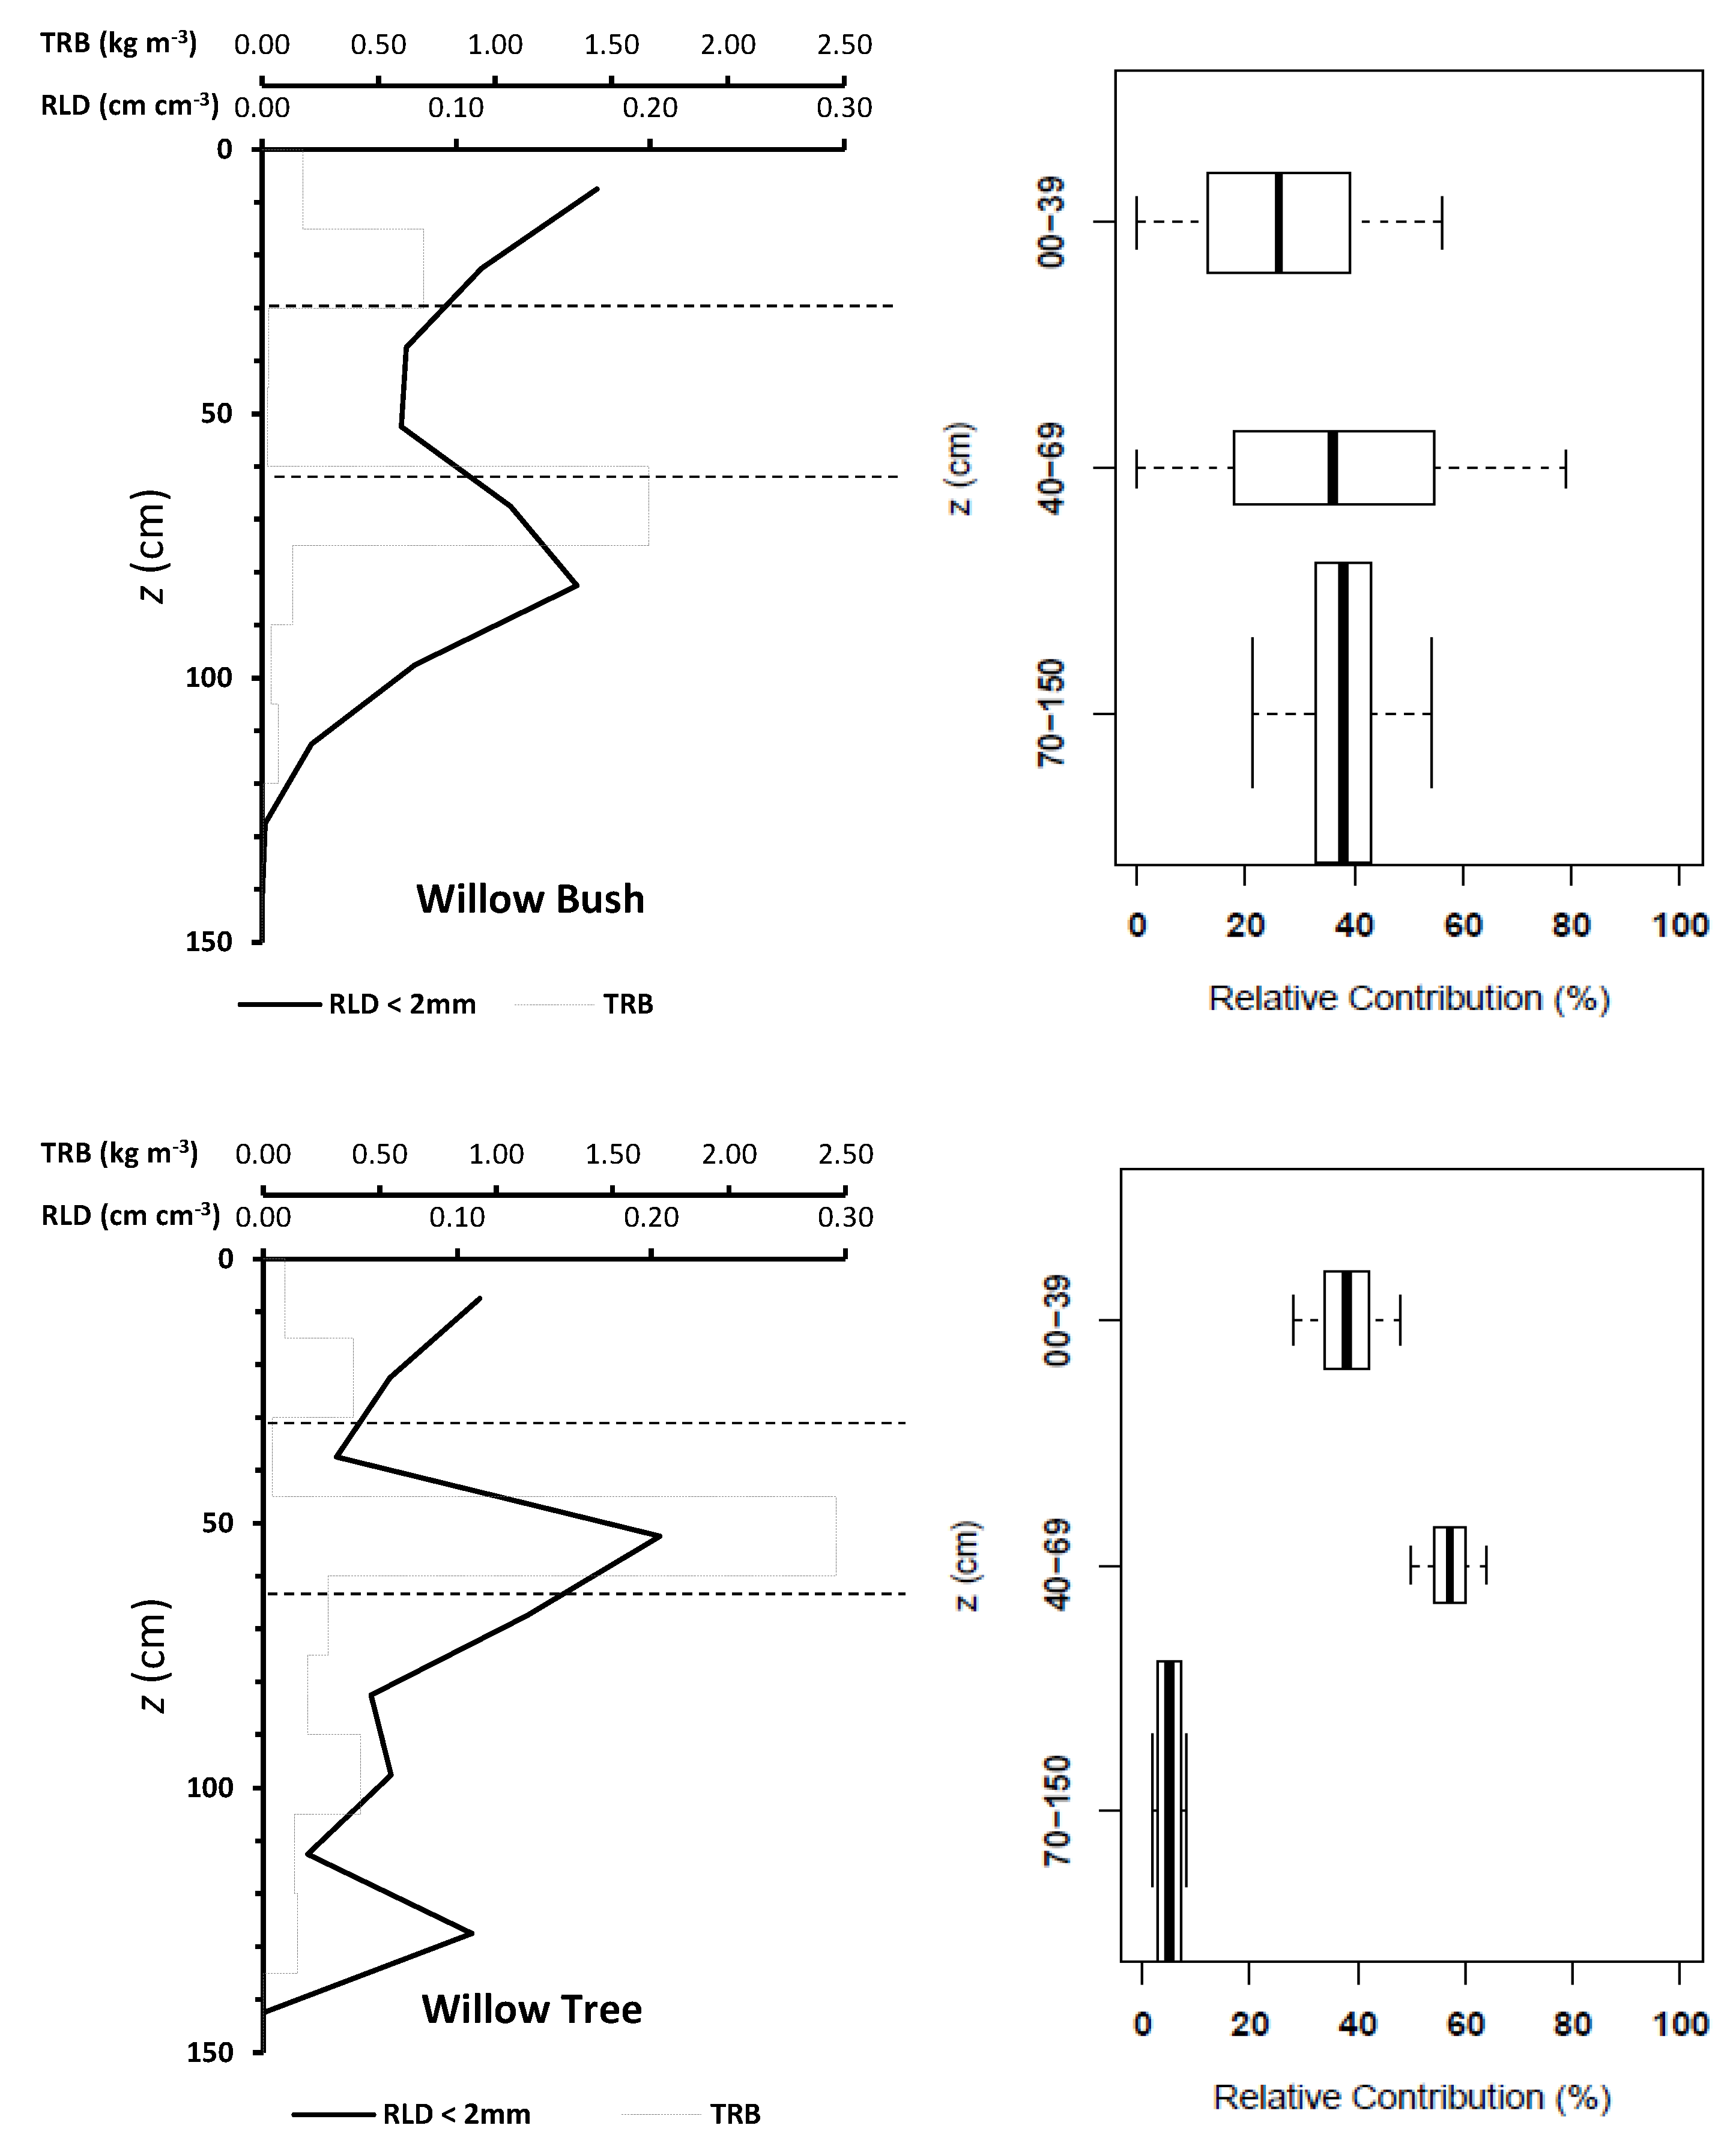
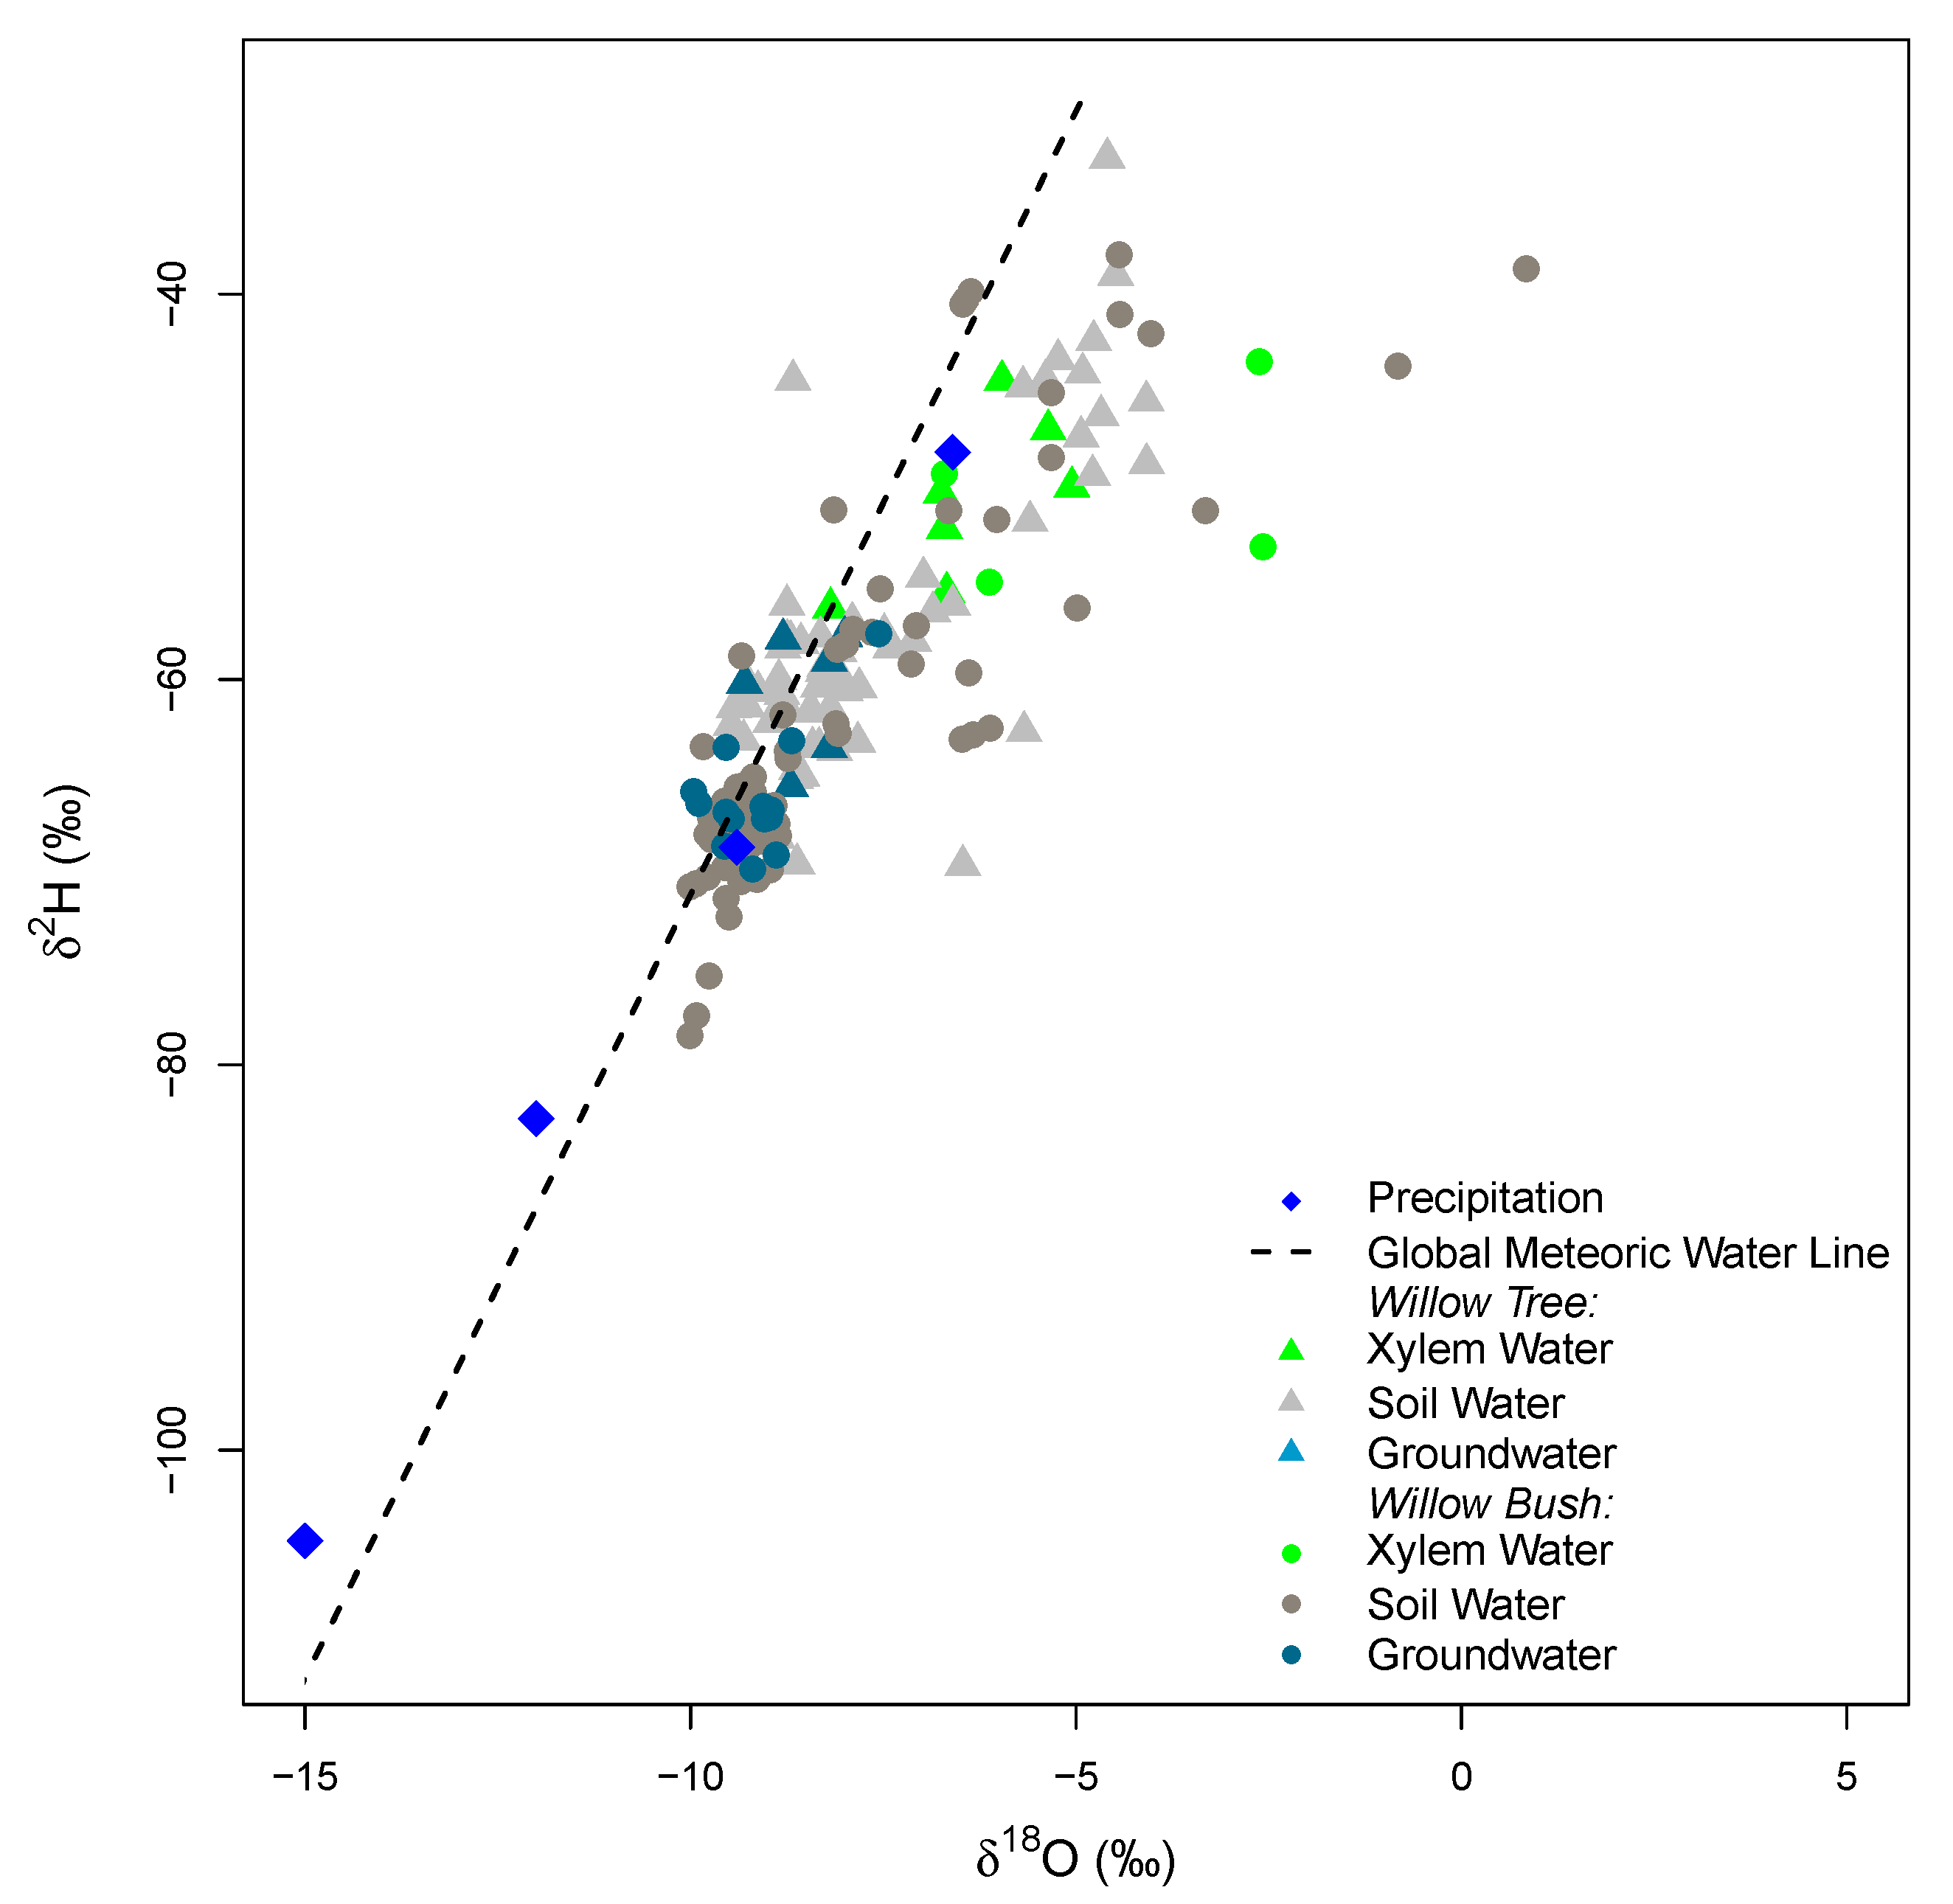
Rain during the study period has a wide range of isotope signatures (see Appendix C Figure A3). The evaporation front is identifiable at 40 cm depth for Willow and at 20 cm for Willow bush in both isotopes (Figure 5). The isotope signature of groundwater samples (Willow Bush: O: −9.2‰, H: −66.1‰ and Willow Tree: O: −8.59‰, H: −60.66‰) lie close to the rain water signature, depicting the effect of local groundwater recharge having a similar signature to local rains. Sap water signature in both species seems to contain fractionated and non-fractionated water. However, both stable isotopes do not show statistical differences between species (p > 0.05) as a consequence of the wide variation in isotope signatures. After a preliminary run of the IsoSource the soil water contribution to xylem water from deeper soil layers show a similar proportion in both species. It showed that only the 40 cm and 10 cm soil layers provide a strong contribution in Willow and Willow bush, respectively. Therefore “a posteriori aggregation” [48] was performed, grouping the soil layers according to their similarities between isotopic signatures, evaporation front presence and proximity within the soil profile. The grouping was settled as: 0–30 cm, 30–60 cm, >60 cm; including in the last soil layer the groundwater due its isotopic similarity with the deeper soil waters. The IsoSource output shows all the possible solutions to match the sap water mixture of H and O (Figure 6). The Willow tree stand shows a well-defined proportion of soil water contributions among the three water sources. The deep water source (>60 cm) contributes, with a proportion lower than 0.08, to the sap water mixture, while the upper soil layers (<30 cm) provides between 0.28 and 0.48 of the mixed water and the intermediate soil layers (30–60 cm) own the higher contribution values from 0.50 to 0.64. The clear differentiation between soil water sources in Willow is not visible for Willow bush. This species shows overlapping contributions of the water sources mainly for the superficial soil layers (0–60 cm), showing the deepest water source a contribution ranging from 0.21 to 0.54 (Figure 6).
Plant densities differ between stands, where the Willow bush stand has the higher plant density (900 trees ha−1) with an average height of 2.6 ± 0.6 m. In contrast, the Willow tree stand has a plant density three times smaller (300 trees ha−1) but with higher trees (3.5 ± 0.5 m). However, the LAI is affected by the leaf size and canopy diameter of the individual plants, where Willow bush register a leaf area index of 0.39 m2 m−2 which is twice smaller than Willow tree (0.68 m2 m−2). Underground stand characteristics also differ between species. Willow trees fix a larger root biomass beneath the 45 cm depth than Willow bush shrubs. Moreover, the root length density distribution shows a bimodal accumulation in Willow bush: at the soil surface (0–30 cm) and at mid depth (55–70 cm). Oppositely, Willow tree has three sections with high RLD values. The first two sections follow the Willow bush pattern, with an additional accumulation bellow 105 cm. The fine root distribution in both species expressed as RLD, provide them a good system for soil water acquisition for the superficial soil layers (Figure 6).
4. Discussion
The main differences in plant size, fine root distribution and water uptake capacity between Willow tree and Willow bush underline the importance of selecting plant species with low water requirements in respect to their biomass for afforestation programs. Willow tree is capable to withdraw up to 12.8 kg day−1 of water, extracting more than 90% from soil layers above 60 cm depth. This species is capable to make use of the superficial soil water during the autumn period, even if the groundwater level is shallow. Conversely, Willow bush show lower transpiration rates not higher than 5.0 kg day−1 extracted uniformly from the whole soil profile including the groundwater. This extraction pattern shown by Willow bush depicts a more efficient root system acquiring water from different soil water sources due their fine root distribution. During this period, both species extract more than 50% of the water from the upper soil layers, taking advantage of the sporadic autumn rains and residual soil moisture. These results are congruent with the behavior of Willow bush during the growing season (May–July), where Willow bush uses water from both sources—soil and groundwater [18]. On the other hand, the soil water dependency during autumn of Willow trees differ in their summer behavior as documented by Yin et al. [17]. During summer, Willow trees have access to soil and groundwater to maintain their water consumption.
Shallow groundwater levels prevent desiccation processes in scarce rainfall environments, providing a vast water source for adapted plants that use the water economically [65]. Even if both species do not differ in the root amount, their vertical distribution shows different root spots. Willow bush root distribution displays two zones, supporting the hierarchy theory proposed by Schwinning and Sala [66]. The Willow bush can withdraw water from rains as stemflow, while the deeper roots can obtained from a constant source (groundwater in this case). The fine root distribution beneath the Willow tree exemplifies woody patches capacity to use rain water in a short time response [67], as well as the hierarchy theory of Schwinning and Sala [66]. The fine root distribution of Willow tree with three dense regions with RLD higher than 0.1 cm cm−3 allow them to use different soil water source depending on soil water availability.
The isotopic values of groundwater are similar to local rain water (see Appendix C Figure A3), depicting a local groundwater recharge documented for the Hailiutu catchment [18]. This is the consequence of the high capacity to infiltrate water by the sandy soils [21]. Consequently, infiltrated water will be available for longer periods because soil water evaporation at soil depths between 10–30 cm can take several weeks in arid environments [24]. The shallow groundwater recharge occurred during the previous growing season due to the high rainfall intensities (>5 mm day−1) between July and September. This phenomenon has also been documented by Li et al. [68] in Taihang (China), reporting a daily groundwater recharge with rains ranging from 3.2 mm day−1 to 3.8 mm day−1. This recharge capacity has been registered in the provinces of Shangxi and Inner Mongolia, gattering from 9% to 12% of the long term annual precipitation [22].
Conversely to groundwater, the isotopic composition of the soil water in the unsaturated zone is affected by the interaction between vegetation cover and soil evaporation (see Appendix C Figure A3). Soil evaporation affects the isotopic signature of soil water in the unsaturated zone providing particular signatures at different soil layers [69,70,71,72]. Meanwhile the plant cover type reduces the soil evaporation, where lower in the top soil layer (0–10 cm) were registered for Willow bushes in comparison to Willow trees. Conversely, the high under Willow bush in respect to Willow tree reflects capacity to fix more root biomass below 40 cm depth. This enhanced the infiltration capacity by the presence of a low plant cover with a large alive root system [73,74].
However, the stable isotope signatures of soil water beneath the plant cover differs considerably. Beneath Willow trees, both isotopes depict the theoretical evaporation front. This as a consequence of the evaporation process in the superficial soil layers, enabling the generation of heavy isotope enrichment [67,68,69,75,76] (see Figure 5). On the other hand, beneath Willow bush only the O profile shows the theoretical evaporation front. The homogeneity of H beneath Willow bush indicates a recent redistribution of groundwater along the soil profile, which can be linked to hydraulic lift processes carried out by this bush.
Lower evaporation rates during the study period depict a lower water need for both species, that is visible in the diminution of sap flow rates. Solar radiation and air temperature are the limiting factors for transpiration as it was showed by the pvalues. The diminution of solar radiation and air temperature in the region are the clear indication of the arrival of autumn [3], which reduces the available energy for the plants to carry out the photosynthesis. Also, the access to the groundwater reservoir allowed the plants to prevent dehydration, reducing the effect of wind speed and relative humidity as triggers of the transpiration process as it happens during summer with both species [17,62]. This reduction in water needs affects the water uptake of Willow tree, which registered a lower contribution of deep soil water sources while the water uptake by superficial roots is more constant. On the other hand, Willow bush shows a high dynamic root system which extracts water from all the available sources indifferently from the upper soil layers and a strong contribution of the deep sources. This contribution is linked to the root distribution, keeping a high root length density in comparison to the Willow tree. The groundwater dependency of Willow bush [18] implies a permanent deep water extraction during summer and autumn, extracting more deep water than Willow trees during the autumn season.
Despite the few rains, water used of both plant species does not reduce the soil water storage on the soil layers above 100 cm. This can be linked to the presence of hydraulic lift, where the root system prevents the soil water depletion on upper soil layers thanks to the redistribution of deeper soil water (in this case, groundwater). The hydraulic lift allows the formation of water pools along the soil profile in water scarce environments [77,78]. This process requires the movement of soil water by the potential difference between roots and the soil [77,78,79,80], allowing the diffusion of water through the roots cell membranes. The hydraulic lift had been identified in different plant species such as Prosopis tamarugo, Artemisia tridentata, Acer saccharum and Madicago sativa [77].
The hydraulic lifted water has an isotope signature close to the groundwater. It is relocated during night periods [81] and once it is on the superficial soil layers evaporation will happen affecting the isotope signature of soil water [82]. This water relocation is maintained by Willow trees, which despite the larger transpiration rates the soil water is not shortened. Liste and White [78] mention a Willow as a tree with the water redistribution capacity, providing evidence related to the potential of Willow to use groundwater through this process. Other tree species such as Eucalyptus kochii has the capacity to redistribute groundwater [79] or use it as an strategy of competition in saline conditions like Juniperus phoenicea and Pistacia lentiscus [83].
The replacement of bare soil areas with different plant covers none adapted to arid environments, speed up the water use in those regions. Water needs of plants such as the Willow tree (Salix matsudana) are high and require a constant water supply [17,59]. On the other hand, the use of plants adapted to arid environments such as the Willow bush (Salix psammophila) [58] ensure the success of the afforestation programs without risking the scarce water resources. The plant water use during summer months is the largest of the year, as a consequence of the long light hours in temperate regions [3]. During this time of the year the newly afforested zones extract more water from the soil and groundwater reservoirs. However, the diminution of solar radiation and temperature during autumn reduces the water demand by all the plants. These plants can redistribute part of the groundwater to the upper soil layers, making it available for the periods with no rains. Also, these plants have the capacity to reduce soil evaporation thanks to the shadow effect of their canopy.
5. Conclusions
The presence of Willow trees (Salix matsudana) and Willow bushes (Salix psammophila) reduced the effect of soil evaporation after summer, allowing a larger soil moisture beneath both species than bare soil conditions. Also, the plant cover allowed the soil moisture below 60 cm depth to be larger than the field capacity for sandy soils. This augment in soil water can be linked to water redistribution thanks to the presence of fine roots along the soil profile and the hydraulic lift carried out by the plants. This process redistributes groundwater on the spots with larger fine root allocation, enabling the plants to allocate it at night and using it later during day time. Willow trees uses more water for transpiration than willow bushes, this difference in water consumption allowed the Willow bushes to kept a higher soil moisture after summer (: 0.11 m3 m−3) followed by Willow trees (: 0.10 m3 m−3) and bare soil (: 0.08 m3 m−3). The larger transpiration rates of Willow trees respect to Willow bushes do not match with the water source of the xylem water as it is showed by the IsoSource model. This is linked with the hydraulic lift capacity of Willow tree, redistributing groundwater that is quickly affected by evaporation processes. Fine root distribution along the soil profile allowed the water redistribution and later absorption by both plants. This is supported by both species preferences to withdraw water from the upper soil layers. The water use by Willow bush does not show a strong differentiation among water sources. This species is capable of extract soil and ground water with different proportions according to water availability. On the other hand, Willow tree is able to extract soil water and groundwater with specific proportions. The species selection for afforestation programs has to be carried out carefully to not endanger the scarce water resources in arid regions. Thus considering that species such as Willow trees use more water than Willow bushes, despite the diminution in solar radiation and air temperature during autumn.
Author Contributions
Project administration, J.W.; conceptualization, J.W. and S.U.; methodology, J.W., S.U. and C.D.J.-R.; formal analysis, C.D.J.-R., M.C.-G. and J.W.; isotope measurements, J.W. and C.D.J.-R.; data curation, C.D.J.-R.; writing—original draft preparation, C.D.J.-R. with inputs from all co-authors; writing—review and editing, C.D.J.-R. with inputs from all co-authors; funding acquisition, J.W., S.U., M.C.-G. and C.D.J.-R.
Funding
This study was supported by the Dutch government’s Asia Facility for China project Partnership for education and research in water and ecosystem interactions, the Groundwater Circulation and Rational Development in the Ordos Plateau project (1212010634204), Groundwater monitoring in the Ordos Basin, the National Natural Sciences Foundation of China (4103752), Shaanxi Science and Technology Research and Development Program (2011KJXX56), Honor Power Foundation. We also received support from Ministerio de Ciencia, Tecnología y Telecomunicaciones (PINN-MICITT, contract: PED-032-2015-1) and The Netherlands Organization for Scientific Research (NWO, grant: 863.15.022).
Acknowledgments
Special thanks to NUFFIC program through a NFP-Fellowship. Also, to L. Yin and J. Huang by their collaboration in the field. The authors thank the reviewers for the comments and suggestions that improved the manuscript.
Conflicts of Interest
The authors declare no conflict of interest.
Appendix A
Figure A1.
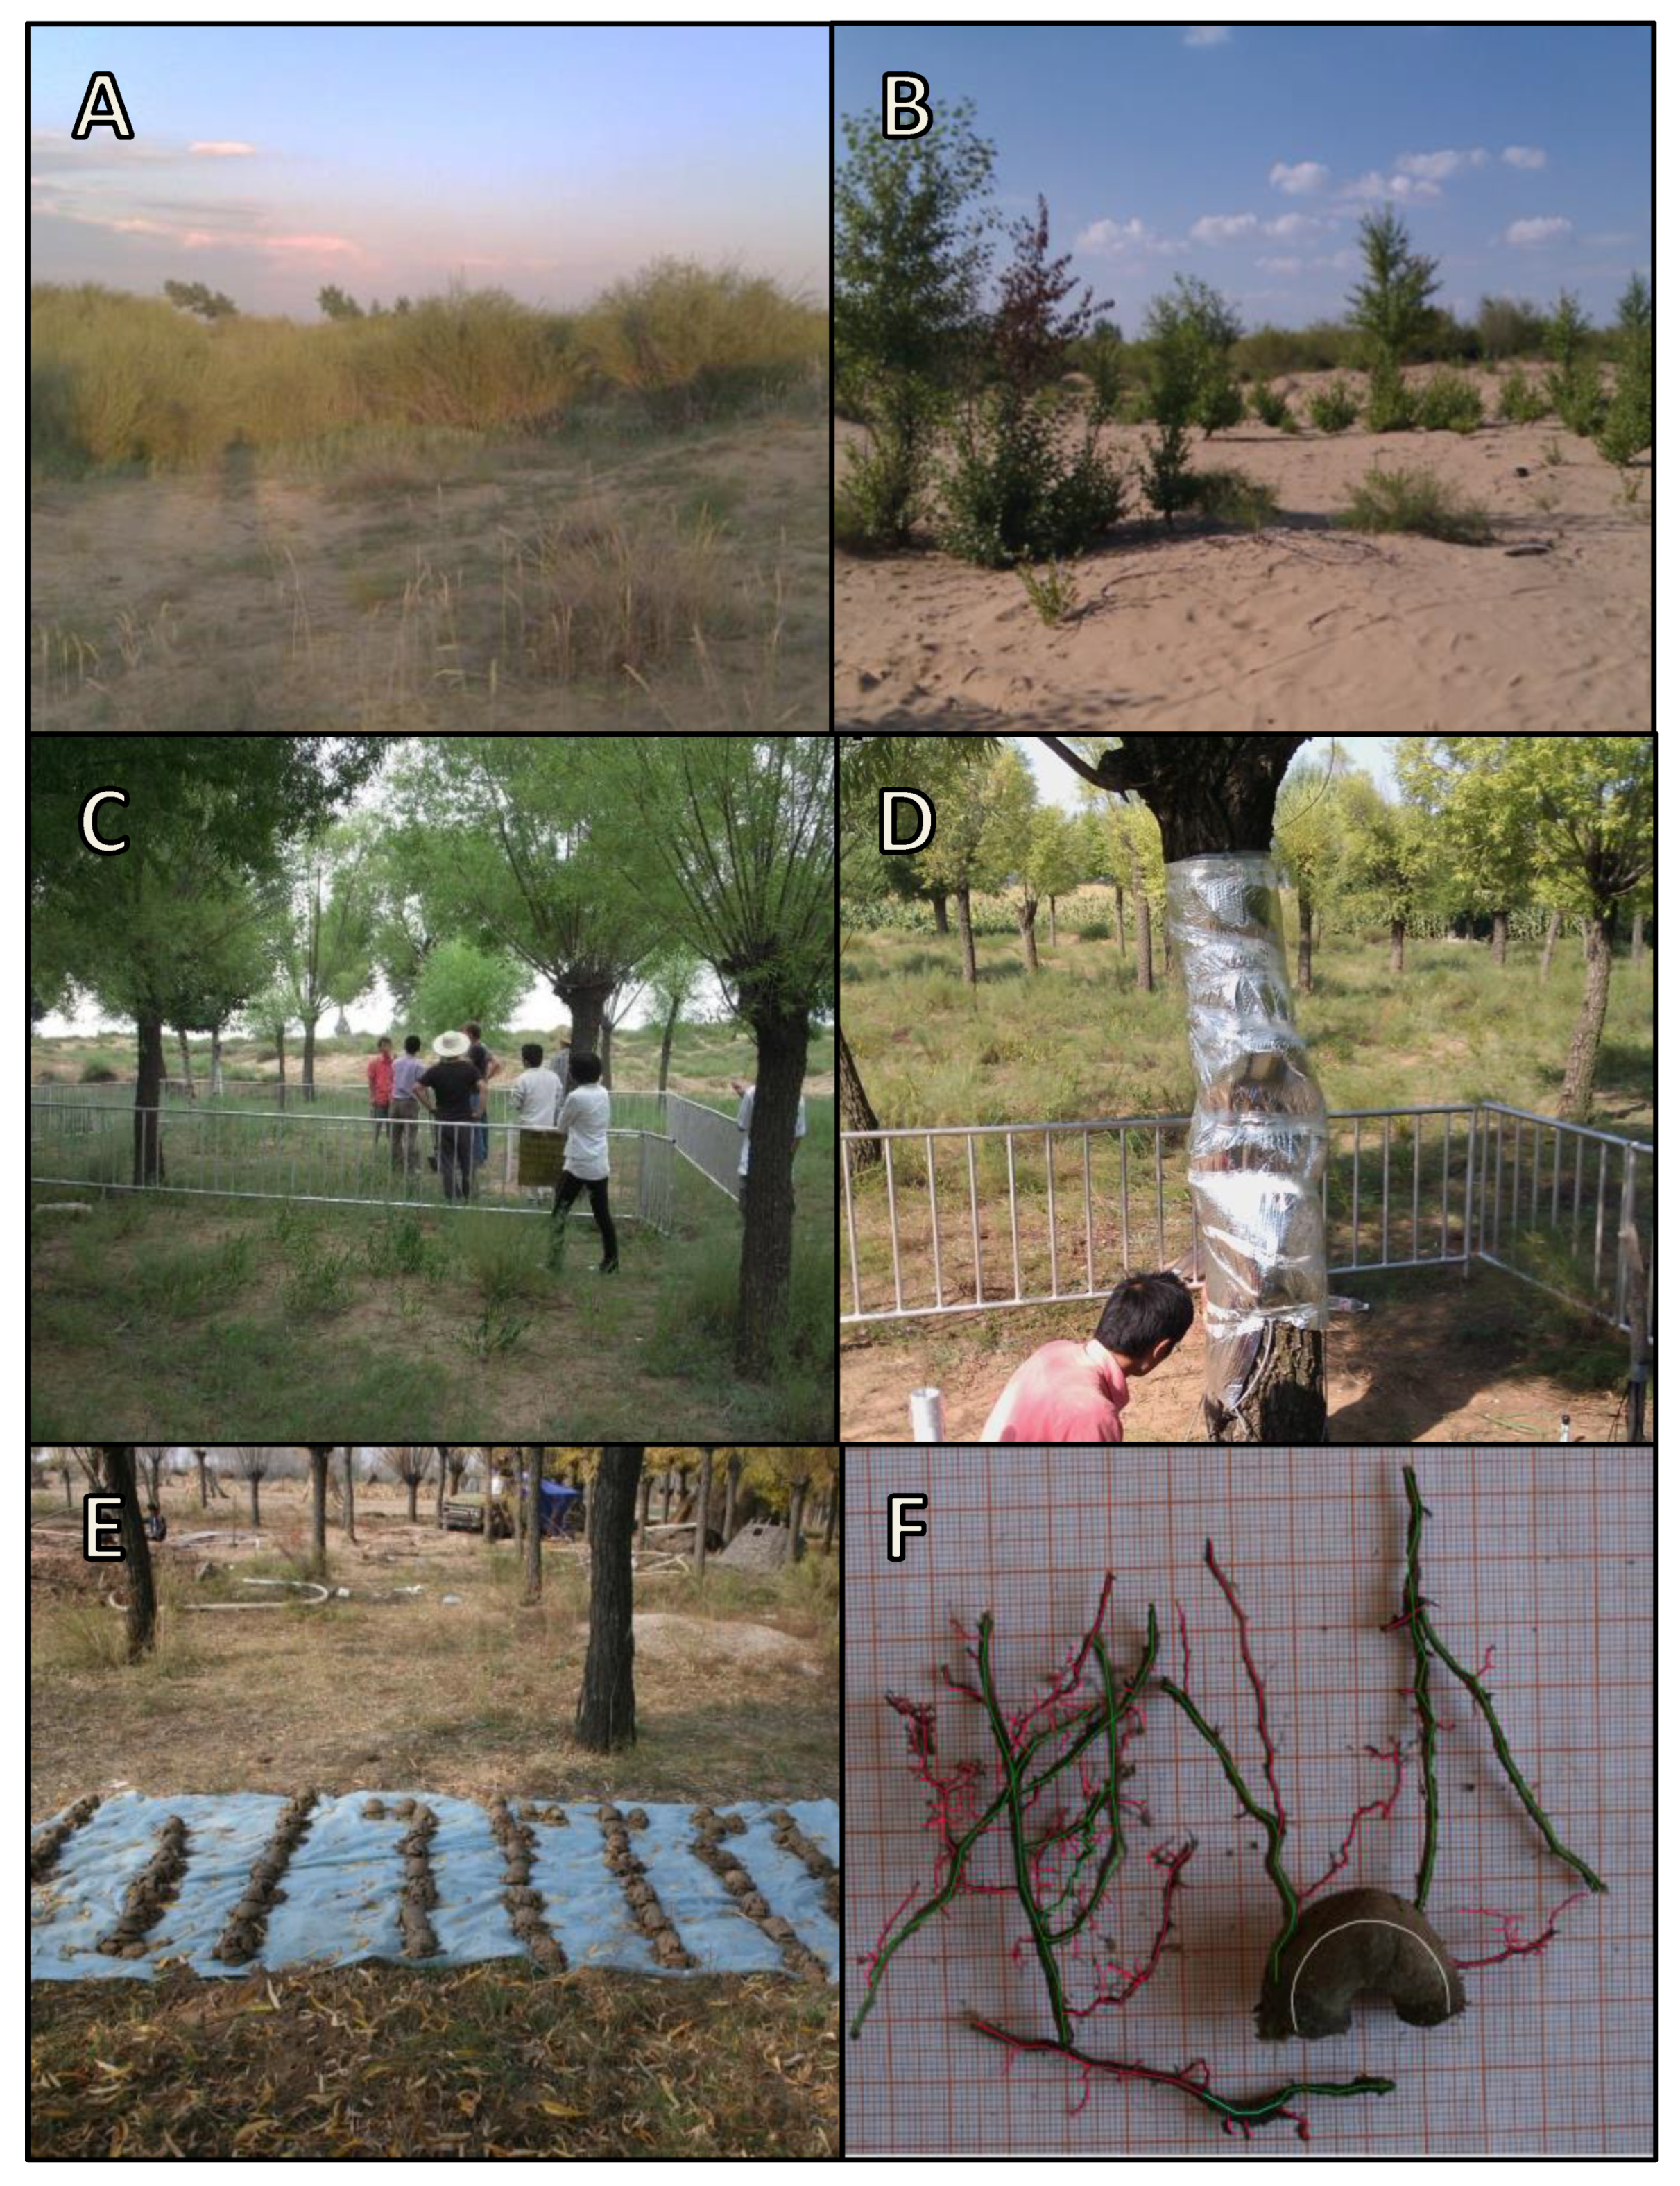
Photographs of the experimental sites and different sampling procedures carried out in Yulin County; Shaanxi province–China. Picture (A): panoramic view of the bush lands dominated by Willow bushes. Picture (B): bare soil conditions close to the experimental plots. Picture (C): experimental plot with Willow trees. Picture (D): Thermal dissipation probe installed in a Willow tree. Picture (E): Root sampling within Willow Tree Plot. Picture (F): print screen of the fine root measuring procedure.
Figure A1.
Photographs of the experimental sites and different sampling procedures carried out in Yulin County; Shaanxi province–China. Picture (A): panoramic view of the bush lands dominated by Willow bushes. Picture (B): bare soil conditions close to the experimental plots. Picture (C): experimental plot with Willow trees. Picture (D): Thermal dissipation probe installed in a Willow tree. Picture (E): Root sampling within Willow Tree Plot. Picture (F): print screen of the fine root measuring procedure.

Appendix B
Figure A2.
Daily measurements of precipitation, evaporation and groundwater depth during the monitoring period.
Figure A2.
Daily measurements of precipitation, evaporation and groundwater depth during the monitoring period.

Appendix C
Figure A3.
Dual isotope plot of H and O for the water samples analyzed in the study.

References
- Abd El-Ghani, M.M.; Huerta-Martínez, F.M.; Hongyan, L.; Qureshi, R. Arid Deserts of the World: Origin, Distribution, and Features. In Plant Responses to Hyperarid Desert Environments; Springer International Publishing: Cham, Switzerland, 2017; pp. 1–7. [Google Scholar] [CrossRef]
- Salem, B. Arid Zone Forestry: A Guide for Field Technicians; Number 20; Food and Agriculture Organization (FAO): Rome, Italy, 1989. [Google Scholar]
- Bonan, G. Ecological Climatology: Concepts and Applications; Cambridge University Press: Cambridge, UK, 2002. [Google Scholar]
- Aguiar, M.R.; Sala, O.E. Patch structure, dynamics and implications for the functioning of arid ecosystems. Trends Ecol. Evol. 1999, 14, 273–277. [Google Scholar] [CrossRef]
- Wainwright, J.; Mulligan, M.; Thornes, J. Plants and water in drylands. In Eco-Hydrology: Plants and Water in Terrestrial and Aquatic Environments; Baird, A., Wilby, R., Eds.; Routledge: Abingdon, UK, 1999; pp. 78–126. [Google Scholar]
- FAO. Guidelines for Soil Description; Food and Agriculture Organization (FAO): Rome, Italy, 2006. [Google Scholar]
- Huggett, R. Fundamentals of Geomorphology, 2nd ed.; Routledge Fundamentals of Physical Geography: Abingdon, UK, 2007. [Google Scholar]
- Summerfield, M. Global Geomorphology; Longman: Harlow, UK, 1991. [Google Scholar]
- Yang, X.; Zhang, K.; Jia, B.; Ci, L. Desertification assessment in China: An overview. J. Arid. Environ. 2005, 63, 517–531. [Google Scholar] [CrossRef]
- Young, A. Agroforestry for Soil Conservation; CAB International: Wallingford, UK, 1989. [Google Scholar]
- Han, K.S.; Park, Y.Y.; Yeom, J.M. Detection of change in vegetation in the surrounding Desert areas of Northwest China and Mongolia with multi-temporal satellite images. Asia-Pac. J. Atmos. Sci. 2015, 51, 173–181. [Google Scholar] [CrossRef]
- Song, X.; Wang, T.; Xue, X.; Yan, C.; Li, S. Monitoring and analysis of aeolian desertification dynamics from 1975 to 2010 in the Heihe River Basin, northwestern China. Environ. Earth Sci. 2015, 74, 3123–3133. [Google Scholar] [CrossRef]
- Cao, S.; Tian, T.; Chen, L.; Dong, X.; Yu, X.; Wang, G. Damage Caused to the Environment by Reforestation Policies in Arid and Semi-Arid Areas of China. AMBIO 2010, 39, 279–283. [Google Scholar] [CrossRef]
- Cao, S.; Chen, L.; Shankman, D.; Wang, C.; Wang, X.; Zhang, H. Excessive reliance on afforestation in China’s arid and semi-arid regions: Lessons in ecological restoration. Earth-Sci. Rev. 2011, 104, 240–245. [Google Scholar] [CrossRef]
- Peng, S.S.; Piao, S.; Zeng, Z.; Ciais, P.; Zhou, L.; Li, L.Z.X.; Myneni, R.B.; Yin, Y.; Zeng, H. Afforestation in China cools local land surface temperature. Proc. Natl. Acad. Sci. USA 2014, 111, 2915–2919. [Google Scholar] [CrossRef] [Green Version]
- Yang, Z.; Zhou, Y.; Wenninger, J.; Uhlenbrook, S. The causes of flow regime shifts in the semi-arid Hailiutu River, Northwest China. Hydrol. Earth Syst. Sci. 2012, 16, 87–103. [Google Scholar] [CrossRef] [Green Version]
- Yin, L.; Zhou, Y.; Huang, J.; Wenninger, J.; Hou, G.; Zhang, E.; Wang, X.; Dong, J.; Zhang, J.; Uhlenbrook, S. Dynamics of willow tree (Salix matsudana) water use and its response to environmental factors in the semi-arid Hailiutu River catchment, Northwest China. Environ. Earth Sci. 2014, 71, 4997–5006. [Google Scholar] [CrossRef]
- Zhou, Y.; Wenninger, J.; Yang, Z.; Yin, L.; Huang, J.; Hou, L.; Wang, X.; Zhang, D.; Uhlenbrook, S. Groundwater–surface water interactions, vegetation dependencies and implications for water resources management in the semi-arid Hailiutu River catchment, China—A synthesis. Hydrol. Earth Syst. Sci. 2013, 17, 2435–2447. [Google Scholar] [CrossRef] [Green Version]
- Roberts, J. Plants and water in forests and woodlands. In Eco-Hydrology: Plants and Water in Terrestrial and Aquatic Environments; Routledge: Abingdon, UK, 1999; pp. 181–236. [Google Scholar]
- Savenije, H.H.G. The importance of interception and why we should delete the term evapotranspiration from our vocabulary. Hydrol. Process. 2004, 18, 1507–1511. [Google Scholar] [CrossRef]
- Yaseef, N.R.; Yakir, D.; Rotenberg, E.; Schiller, G.; Cohen, S. Ecohydrology of a semi-arid forest: Partitioning among water balance components and its implications for predicted precipitation changes. Ecohydrology 2009, 3, 143–154. [Google Scholar] [CrossRef]
- Scanlon, B.R.; Keese, K.E.; Flint, A.L.; Flint, L.E.; Gaye, C.B.; Edmunds, W.M.; Simmers, I. Global synthesis of groundwater recharge in semiarid and arid regions. Hydrol. Process. 2006, 20, 3335–3370. [Google Scholar] [CrossRef]
- Zhang, Y.F.; Wang, X.P.; Hu, R.; Pan, Y.X.; Paradeloc, M. Rainfall partitioning into throughfall, stemflow and interception loss by two xerophytic shrubs within a rain-fed re-vegetated desert ecosystem, northwestern China. J. Hydrol. 2015, 527, 1084–1095. [Google Scholar] [CrossRef]
- Noy-Meir, I. Desert Ecosystems: Environment and Producers. Annu. Rev. Ecol. Syst. 1973, 4, 25–51. [Google Scholar] [CrossRef]
- Chesson, P.; Gebauer, R.L.E.; Schwinning, S.; Huntly, N.; Wiegand, K.; Ernest, M.S.K.; Sher, A.; Novoplansky, A.; Weltzin, J.F. Resource pulses, species interactions, and diversity maintenance in arid and semi-arid environments. Oecologia 2004, 141, 236–253. [Google Scholar] [CrossRef]
- Ivans, S.; Hipps, L.; Leffler, A.J.; Ivans, C.Y. Response of Water Vapor and CO2 Fluxes in Semiarid Lands to Seasonal and Intermittent Precipitation Pulses. J. Hydrometeorol. 2006, 7, 995–1010. [Google Scholar] [CrossRef]
- Ogle, K.; Wolpert, R.L.; Reynolds, J.F. Reconstructing plant root area and water uptake profiles. Ecology 2004, 85, 1967–1978. [Google Scholar] [CrossRef]
- Hopkins, W.G.; Hüner, N.P. Introduction to Plant Physiology; Wiley: Hoboken, NJ, USA, 2008. [Google Scholar]
- Cardon, Z.G.; Whitbeck, J.L. The Rhizosphere. An Ecological Perspective; Elsevier Academic Press: Amsterdam, The Nertherlands, 2007. [Google Scholar]
- Curl, E.; Truelove, B. The Rhizosphere; Springer: New York, NY, USA, 1986. [Google Scholar]
- Dawson, T.E.; Mambelli, S.; Plamboeck, A.H.; Templer, P.H.; Tu, K.P. Stable Isotopes in Plant Ecology. Annu. Rev. Ecol. Syst. 2002, 33, 507–559. [Google Scholar] [CrossRef]
- Evaristo, J.; McDonnell, J.J.; Clemens, J. Plant source water apportionment using stable isotopes: A comparison of simple linear, two-compartment mixing model approaches. Hydrol. Process. 2017, 31, 3750–3758. [Google Scholar] [CrossRef]
- Jia, Z.; Zhu, Y.; Liu, L. Different Water Use Strategies of Juvenile and Adult Caragana intermedia Plantations in the Gonghe Basin, Tibet Plateau. PLoS ONE 2012, 7, e45902. [Google Scholar] [CrossRef] [PubMed] [Green Version]
- Nie, Y.P.; Chen, H.S.; Wang, K.l.; Tan, W.; Deng, P.Y.; Yang, J. Seasonal water use patterns of woody species growing on the continuous dolostone outcrops and nearby thin soils in subtropical China. Plant Soil 2011, 341, 399–412. [Google Scholar] [CrossRef]
- Palacio, S.; Montserrat-Martí, G.; Ferrio, J.P. Water use segregation among plants with contrasting root depth and distribution along gypsum hills. J. Veg. Sci. 2017, 28, 1107–1117. [Google Scholar] [CrossRef]
- Rossatto, D.R.; da Silveira Lobo Sternberg, L.; Franco, A.C. The partitioning of water uptake between growth forms in a Neotropical savanna: Do herbs exploit a third water source niche? Plant Biol. 2012, 15, 84–92. [Google Scholar] [CrossRef] [PubMed]
- Swaffer, B.A.; Holland, K.L.; Doody, T.M.; Li, C.; Hutson, J. Water use strategies of two co-occurring tree species in a semi–arid karst environment. Hydrol. Process. 2013, 28, 2003–2017. [Google Scholar] [CrossRef]
- Voltas, J.; Lucabaugh, D.; Chambel, M.R.; Ferrio, J.P. Intraspecific variation in the use of water sources by the circum-Mediterranean conifer Pinus halepensis. New Phytol. 2015, 208, 1031–1041. [Google Scholar] [CrossRef] [PubMed] [Green Version]
- Wang, P.; Song, X.; Han, D.; Zhang, Y.; Liu, X. A study of root water uptake of crops indicated by hydrogen and oxygen stable isotopes: A case in Shanxi Province, China. Agric. Water Manag. 2010, 97, 475–482. [Google Scholar] [CrossRef]
- Wei, L.; Lockington, D.A.; Poh, S.C.; Gasparon, M.; Lovelock, C.E. Water use patterns of estuarine vegetation in a tidal creek system. Oecologia 2013, 172, 485–494. [Google Scholar] [CrossRef]
- Barbeta, A.; Ogée, J.; Peñuelas, J. Stable-Isotope Techniques to Investigate Sources of Plant Water. In Advances in Plant Ecophysiology Techniques; Sánchez-Moreiras, A.M., Reigosa, M.J., Eds.; Springer International Publishing: Cham, Switzerland, 2018; pp. 439–456. [Google Scholar] [CrossRef]
- Geyh, M. Groundwater. Saturated and unsaturated zone. In Environmental Isotopes in the Hydrological Cycle: Principles and Applications; Mook, W., Ed.; UNESCO: Paris, France, 2000; Volume IV. [Google Scholar]
- Leibundgut, C.; Seibert, J. 2.09. Tracer Hydrology. In Treatise on Water Science; Wilderer, P., Ed.; Elsevier: Amsterdam, The Netherlands, 2011; pp. 215–236. [Google Scholar]
- Butt, S.; Ali, M.; Fazil, M.; Latif, Z. Seasonal variations in the isotopic composition of leaf and stem water from an arid region of Southeast Asia. Hydrol. Sci. J. 2010, 55, 844–848. [Google Scholar] [CrossRef] [Green Version]
- Parnell, A.C.; Inger, R.; Bearhop, S.; Jackson, A.L. Source partitioning using stable isotopes: Coping with too much variation. PLoS ONE 2010, 5, e9672. [Google Scholar] [CrossRef]
- Parnell, A.C.; Phillips, D.L.; Bearhop, S.; Semmens, B.X.; Ward, E.J.; Moore, J.W.; Jackson, A.L.; Grey, J.; Kelly, D.J.; Inger, R. Bayesian stable isotope mixing models. Environmetrics 2013, 24, 387–399. [Google Scholar] [CrossRef] [Green Version]
- Moore, J.W.; Semmens, B.X. Incorporating uncertainty and prior information into stable isotope mixing models. Ecol. Lett. 2008, 11, 470–480. [Google Scholar] [CrossRef] [PubMed]
- Phillips, D.L.; Newsome, S.D.; Gregg, J.W. Combining sources in stable isotope mixing models: Alternative methods. Oecologia 2005, 144, 520–527. [Google Scholar] [CrossRef] [PubMed]
- Phillips, D.L.; Gregg, J.W. Source partitioning using stable isotopes: Coping with too many sources. Oecologia 2003, 136, 261–269. [Google Scholar] [CrossRef] [PubMed]
- Zhu, J.; Sun, D.; Young, M.H.; Caldwell, T.G.; Pan, F. Shrub spatial organization and partitioning of evaporation and transpiration in arid environments. Ecohydrology 2015, 8, 1218–1228. [Google Scholar] [CrossRef]
- Walker, B.H.; Langridge, J.L. Modelling plant and soil water dynamics in semi-arid ecosystems with limited site data. Ecol. Model. 1996, 87, 153–167. [Google Scholar] [CrossRef]
- Schlesinger, W.H.; Fonteyn, P.J.; Marion, G.M. Soil moisture content and plant transpiration in the Chihuahuan Desert of New Mexico. J. Arid. Environ. 1987, 12, 119–126. [Google Scholar] [CrossRef]
- IIASA/FAO. Global Agro-Ecological Zones (GAEZ v3.0); IIASA: Laxenburg, Austria; FAO: Rome, Italy, 2012. [Google Scholar]
- NCDC. NNDC Climate Data Online. 2012. Available online: http://www7.ncdc.noaa.gov/CDO/cdoselect.cmd (accessed on 23 January 2012).
- Allen, R.G.; Pereira, L.S.; Raes, D.; Smith, M. Crop Evapotranspiration-Guidelines for Computing Crop Water Requirements–FAO Irrigation and Drainage Paper 56; FAO: Rome, Italy, 1998. [Google Scholar]
- Saxton, K.E.; Rawls, W.J. Soil water characteristic estimates by texture and organic matter for hydrologic solutions. Soil Sci. Soc. Am. J. 2006, 70, 1569–1578. [Google Scholar] [CrossRef] [Green Version]
- Craig, H. Standard for Reporting Concentrations of Deuterium and Oxygen-18 in Natural Waters. Science 1961, 133, 1833–1834. [Google Scholar] [CrossRef]
- Wang, Z.; Chang, Y. Salix Psammophila; Bulletin of Botanical Laboratory of North-Eastern Forestry Institute: Harbin, China, 1980; Volume 9. [Google Scholar]
- Gilman, E.; Watson, G. Salix Matsudana ‘Tortuosa’ Corkscrew Willow; Fact Sheet ST-577 Environmental Horticulture Department, Florida Cooperative Extension Service, Institute of Food and Agricultural Sciences, University of Florida: Gainesville, FL, USA, 1994. [Google Scholar]
- Granier, A. Une nouvelle méthode pour la mesure du flux de sève brute dans le tronc des arbres. Ann. Des Sci. For. 1985, 42, 193–200. [Google Scholar] [CrossRef]
- Cornelissen, J.; Lavorel, S.; Garnier, E.; Diaz, S.; Buchmann, N.; Gurvich, D.; Reich, P.; Ter Steege, H.; Morgan, H.; Van Der Heijden, M.; et al. A handbook of protocols for standardised and easy measurement of plant functional traits worldwide. Aust. J. Bot. 2003, 51, 335–380. [Google Scholar] [CrossRef] [Green Version]
- Huang, J.; Zhou, Y.; Yin, L.; Wenninger, J.; Zhang, J.; Hou, G.; Zhang, E.; Uhlenbrook, S. Climatic controls on sap flow dynamics and used water sources of Salix psammophila in a semi-arid environment in northwest China. Environ. Earth Sci. 2015, 73, 289–301. [Google Scholar] [CrossRef]
- Kottek, M.; Grieser, J.; Beck, C.; Rudolf, B.; Rubel, F. World map of the Köppen-Geiger climate classification updated. Meteorol. Z. 2006, 15, 259–263. [Google Scholar] [CrossRef]
- Peel, M.C.; Finlayson, B.L.; Mcmahon, T.A. Updated world map of the Köppen-Geiger climate classification. Hydrol. Earth Syst. Sci. Discuss. 2007, 4, 439–473. [Google Scholar] [CrossRef] [Green Version]
- Jiang, G.; He, W. Species- and habitat-variability of photosynthesis, transpiration and water use efficiency of different plant species in Maowusu Sand Area. Acta Bot. Sin. 1999, 41, 1114–1124. [Google Scholar]
- Schwinning, S.; Sala, O.E. Hierarchy of responses to resource pulses in arid and semi-arid ecosystems. Oecologia 2004, 141, 211–220. [Google Scholar] [CrossRef]
- Midwood, A.; Boutton, T.; Archer, S.; Watts, S. Water use by woody plants on contrasting soils in a savanna parkland: assessment with δ2H and δ18O. Plant Soil 1998, 205, 13–24. [Google Scholar] [CrossRef]
- Li, F.; Song, X.; Tang, C.; Liu, C.; Yu, J.; Zhang, W. Tracing infiltration and recharge using stable isotope in Taihang Mt., North China. Environ. Geol. 2007, 53, 687–696. [Google Scholar] [CrossRef]
- Barnes, C.J.; Allison, G. Tracing of water movement in the unsaturated zone using stable isotopes of hydrogen and oxygen. J. Hydrol. 1988, 100, 143–176. [Google Scholar] [CrossRef]
- Brunel, J.P.; Walker, G.R.; Kennett-Smith, A.K. Field validation of isotopic procedures for determining sources of water used by plants in a semi-arid environment. J. Hydrol. 1995, 167, 351–368. [Google Scholar] [CrossRef]
- Rothfuss, Y.; Biron, P.; Braud, I.; Canale, L.; Durand, J.L.; Gaudet, J.P.; Richard, P.; Vauclin, M.; Bariac, T. Partitioning evapotranspiration fluxes into soil evaporation and plant transpiration using water stable isotopes under controlled conditions. Hydrol. Process. 2010, 24, 3177–3194. [Google Scholar] [CrossRef]
- Schwinning, S.; Ehleringer, J.R. Water use trade-offs and optimal adaptations to pulse-driven arid ecosystems. J. Ecol. 2001, 89, 464–480. [Google Scholar] [CrossRef] [Green Version]
- Basche, A.D.; DeLonge, M.S. Comparing infiltration rates in soils managed with conventional and alternative farming methods: A meta-analysis. PLoS ONE 2019, 14, e0215702. [Google Scholar] [CrossRef] [PubMed] [Green Version]
- Fischer, C.; Tischer, J.; Roscher, C.; Eisenhauer, N.; Ravenek, J.; Gleixner, G.; Attinger, S.; Jensen, B.; de Kroon, H.; Mommer, L.; et al. Plant species diversity affects infiltration capacity in an experimental grassland through changes in soil properties. Plant Soil 2015, 397, 1–16. [Google Scholar] [CrossRef]
- Sutanto, S.J.; Wenninger, J.; Coenders-Gerrits, A.M.J.; Uhlenbrook, S. Partitioning of evaporation into transpiration, soil evaporation and interception: A comparison between isotope measurements and a HYDRUS-1D model. Hydrol. Earth Syst. Sci. 2012, 16, 2605–2616. [Google Scholar] [CrossRef] [Green Version]
- Wenninger, J.; Beza, D.T.; Uhlenbrook, S. Experimental investigations of water fluxes within the soil–vegetation–atmosphere system: Stable isotope mass-balance approach to partition evaporation and transpiration. Phys. Chem. Earth Parts A/B/C 2010, 35, 565–570. [Google Scholar] [CrossRef]
- Horton, J.L.; Hart, S.C. Hydraulic lift: A potentially important ecosystem process. Trends Ecol. Evol. 1998, 13, 232–235. [Google Scholar] [CrossRef]
- Liste, H.H.; White, J.C. Plant hydraulic lift of soil water—Implications for crop production and land restoration. Plant Soil 2008, 313, 1–17. [Google Scholar] [CrossRef]
- Brooksbank, K.; White, D.A.; Veneklaas, E.J.; Carter, J.L. Hydraulic redistribution in Eucalyptus kochii subsp. borealis with variable access to fresh groundwater. Trees 2011, 25, 735–744. [Google Scholar] [CrossRef]
- Niinemets, U. Responses of forest trees to single and multiple environmental stresses from seedlings to mature plants: Past stress history, stress interactions, tolerance and acclimation. For. Ecol. Manag. 2010, 260, 1623–1639. [Google Scholar] [CrossRef]
- Caldwell, M.M.; Dawson, T.E.; Richards, J.H. Hydraulic lift: Consequences of water efflux from the roots of plants. Oecologia 1998, 113, 151–161. [Google Scholar] [CrossRef] [PubMed]
- Dawson, T.E.; Pate, J.S. Seasonal water uptake and movement in root systems of Australian phraeatophytic plants of dimorphic root morphology: A stable isotope investigation. Oecologia 1996, 107, 13–20. [Google Scholar] [CrossRef] [PubMed]
- Armas, C.; Padilla, F.M.; Pugnaire, F.I.; Jackson, R.B. Hydraulic lift and tolerance to salinity of semiarid species: Consequences for species interactions. Oecologia 2010, 162, 11–21. [Google Scholar] [CrossRef] [PubMed]
Figure 1.
Geographical location of the experimental site and the meteorological stations Dong Shen, Yanchi and Yulin used during the study period in the Shaanxi province, China. The experimental design of both plots is shown on the bottom of the map.
Figure 1.
Geographical location of the experimental site and the meteorological stations Dong Shen, Yanchi and Yulin used during the study period in the Shaanxi province, China. The experimental design of both plots is shown on the bottom of the map.

Figure 2.
Meteorological conditions registered during 2010 at the research site based on the data of Dong Shen, Yanchi and Yulin meteorological stations.
Figure 2.
Meteorological conditions registered during 2010 at the research site based on the data of Dong Shen, Yanchi and Yulin meteorological stations.

Figure 3.
Soil moisture (m3 m−3) measured in both plots for Willow bush, Willow tree and bare soil conditions during the study period.
Figure 3.
Soil moisture (m3 m−3) measured in both plots for Willow bush, Willow tree and bare soil conditions during the study period.

Figure 4.
Hourly transpiration flow measured in Willow tree and Willow bush plants during the study period.
Figure 4.
Hourly transpiration flow measured in Willow tree and Willow bush plants during the study period.

Figure 5.
Isotopic profile of the stable water isotopes sampled in both stands during autumn 2010. Each boxplot describes the data set with the median (thick vertical line within the box), the first and third quartiles (edges of the box) and the minimum and maximum values (whiskers).
Figure 5.
Isotopic profile of the stable water isotopes sampled in both stands during autumn 2010. Each boxplot describes the data set with the median (thick vertical line within the box), the first and third quartiles (edges of the box) and the minimum and maximum values (whiskers).

Figure 6.
Root length density (RLD) and total root biomass (TRB) distribution along the soil profile and its relation with the relative contribution to sap water mixture of Willow tree and Willow bush based on H and O isotope signatures per group of soil depth. Each boxplot describes the the median (thick vertical line within the box), the first and third quartiles (edges of the box) and the minimum and maximum values (whiskers). The boxplot height is proportional to the soil depth range.

© 2019 by the authors. Licensee MDPI, Basel, Switzerland. This article is an open access article distributed under the terms and conditions of the Creative Commons Attribution (CC BY) license (http://creativecommons.org/licenses/by/4.0/).
Share and Cite
MDPI and ACS Style
Jiménez-Rodríguez, C.D.; Coenders-Gerrits, M.; Uhlenbrook, S.; Wenninger, J. What Do Plants Leave after Summer on the Ground?—The Effect of Afforested Plants in Arid Environments. Water 2019, 11, 2559. https://doi.org/10.3390/w11122559
AMA Style
Jiménez-Rodríguez CD, Coenders-Gerrits M, Uhlenbrook S, Wenninger J. What Do Plants Leave after Summer on the Ground?—The Effect of Afforested Plants in Arid Environments. Water. 2019; 11(12):2559. https://doi.org/10.3390/w11122559
Chicago/Turabian StyleJiménez-Rodríguez, César Dionisio, Miriam Coenders-Gerrits, Stefan Uhlenbrook, and Jochen Wenninger. 2019. "What Do Plants Leave after Summer on the Ground?—The Effect of Afforested Plants in Arid Environments" Water 11, no. 12: 2559. https://doi.org/10.3390/w11122559
Note that from the first issue of 2016, this journal uses article numbers instead of page numbers. See further details here.