Evaluation of Ecosystem Services in the Dongting Lake Wetland
by
 , ,
, ,
Li Ma
1, 
Ruoxiu Sun
1,
Ehsan Kazemi
2 ,
,
Danbo Pang
3,
Yi Zhang
4,
Qixiang Sun
5,
Jinxing Zhou
1,* and
Kebin Zhang
1,* 1
School of Soil and Water Conservation, Beijing Forestry University, Beijing 100083, China
2
Department of Civil and Structural Engineering, University of Sheffield, Sheffield S1 3JD, UK
3
Breeding Base for State Key Laboratory of Land Degradation and Ecological Restoration in Northwest China, Ningxia University, Yinchuan 750021, China
4
WHO Collaborating Center for Tropical Diseases, National Center for International Research on Tropical Diseases, Shanghai 200025, China
5
Institute of Forestry, Chinese Academy of Forestry, Beijing 100091, China
*
Authors to whom correspondence should be addressed.
Water 2019, 11(12), 2564; https://doi.org/10.3390/w11122564
Submission received: 8 October 2019
/
Revised: 27 November 2019
/
Accepted: 29 November 2019
/
Published: 5 December 2019
(This article belongs to the Special Issue Advances in Modelling and Prediction on the Impact of Human Activities and Extreme Events on Environments)
Abstract
:The Aeronautical Reconnaissance Coverage Geographic Information System (ArcGIS) 10.2 and Integrated Valuation of Ecosystem Services and Trade-offs (InVEST) model are used to comprehensively evaluate ecosystem services in the Dongting Lake Wetland, focusing on water yield, soil conservation, carbon storage, and snail control and schistosomiasis prevention. The spatial and temporal variations of these services, as well as their variations between different land use types in a period of 10 years from 2005 to 2015, are investigated, and the value of such services is then estimated and analyzed. The results of this study show various temporal and spatial trends in the ecosystem services, such as (1) the overall increase of all these services during the study period (although significant in some services, such as schistosomiasis patient reduction, by 86.8%; and, very slight in some others such as soil conservation, only by 0.02%); (2) different orders of the services values that are based on different land use types; and, (3) the temporal changes in the proportion of the values of different ecosystem services with respect to the total services value. Besides, it is concluded that the evaluation of ecosystem services of a certain wetland is heavily dependent on the characteristics of the area where the wetland is located, and the assessment indicators and methods should be selected based on such characteristics through the analysis of the results and a comparison with the findings of literature.
1. Introduction
Ecosystem service is the natural environmental condition and utility that the ecosystem and ecological process form and maintain [1,2]. The millennium ecosystem assessment (MEA) has found that 60% of global ecosystem services have deteriorated, with human activity being one of the main causes of this adverse change [3,4]. Wetlands, as important habitats of humans, only cover 1% of the earth’s surface, but they provide habitat for about 20% of all species worldwide [5,6]. Wetland ecosystem services are crucial for the survival of humans and a range of other animals, by supplying freshwater and aquatic products, flood control, climate regulation, biodiversity protection, etc. [7]. It has been estimated that lake wetland ecosystem services provide 23.2% of the total value of global ecosystem services [8].
Numerous scholars have assessed wetland ecosystems at different geographical locations and scales. For instance, Great Lakes Restoration Initiative Task Force systematically assessed the ecosystem services of the Great Lakes of North America in 2010, and showed that a number of management and engineering measures improved these services [9]. Wong et al. (2016) tested a new approach to evaluate water storage and local climate regulation of a green infrastructure project on the Yong ding River in Beijing, China, showing that the lakes and wetlands have increased local evapotranspiration on the Yongding Corridor by approximately 0.71 mm per day [10]. In another study, Bikash et al. (2015) pointed out that the economic values of the selective ecosystem services of the Koshi Tappu Wildlife Reserve, Nepal, equaled $16 million per year [11]. Around the world, several countries, including Canada and China, have evaluated their wetland ecosystem services, but no universal evaluation index system of lake wetland ecosystem services has been established, and there has also been no evaluation of the effects of wetland ecosystem services on human health [12,13,14,15,16,17].
There is a lack of regional validation of parameters in the use of evaluation models, with only a few evaluations on cultural or support services in wetland ecosystem services, which makes the selection of indicators one-sided. In this sense, it is necessary to further unify the methods, indicators, and other aspects of ecosystem services of different scales and landscape types. At present, numerous studies are available regarding the quantitative evaluation, model simulation, and scenario analysis of ecosystem services, while using different types of ArcGIS (Aeronautical Reconnaissance Coverage Geographic Information System)-based support tools to fully integrate geography, ecology, economics, etc. The number and types of models for ecosystem services assessment have dramatically increased over the past decade. IMAGE (Integrated Assessment of Global Environmental Change), SAORES (Spatial Assessment and Optimization Tool for Regional Ecosystem Services), ARIES (Artificial Intelligence for Ecosystem Services), Costing Nature, and LUCI (Land Utilization and Capability Indicator) are some examples. For instance, ARIES is a model built via an expert knowledge method, which might result in the one-sidedness of evaluation results due to experts’ knowledge reserve and subjective factors. The models IMAGE, Costing Nature, and LUCI are based on a global data set for ecosystem service evaluation [18,19]. The SAORES model evaluates ecosystem services in the context of ecological restoration and the management of the Loess Plateau in China, ignoring the accuracy verification and uncertainty analysis of service evaluation [20]. The InVEST (Integrated Valuation of Ecosystem Services and Trade-offs) model inputs the relevant data of the study area and reflects the impacts of ecosystem structure and function on service flow and value through the simplification of biophysical processes [21]. The multi-scale data input and the result output have made the InVEST model a comprehensive ecosystem service evaluation and balance model that is widely used in 20 countries and regions, for example in the assessment of freshwater ecosystem services in the Tualatin and Yamhill basins, the Chubute River valley in southern Argentina, the Beijing mountain forest, etc. [22,23,24,25].
With the rapid development of social economy and the expansion of global population, the demand for land is constantly increasing in order to survive and obtain economic benefits. Consequently, wetland resources are under unprecedented pressure and are decreasing at the global level [26,27]. The Dongting Lake Wetland is the largest lake that leads to the Yangtze River and the second largest freshwater lake in China. It provides favorable conditions for the breeding of snails and it is a severe epidemic area of schistosomiasis, seriously endangering the health of the local people. Schistosomiasis is a parasitic disease that affects both humans and animals and, globally, it is the second largest tropical parasitic disease after malaria [28,29]. It is endemic in about 78 countries in the tropical and subtropical regions of the world [30]. More than 95% of the Schistosomiasis in China are distributed in the Yangtze River basin tidal land, which seriously endangers wetland ecosystems. Oncomelania hupensis, which is a tropical freshwater snail, is the only intermediate host of Schistosoma japonicum and it can live in moist, shaded, and alternate land and water wetland environments. Thus, snail eradication is an effective measure for blocking the transmission of schistosomiasis [31,32]. At present, there are various technical systems for snail control, including drug snail control, agricultural engineering measures, and water conservancy projects. The impermanence of snail control effectiveness, the higher costs on capital, and the labor-intensity are substantial disadvantages between water conservancy projects and ecological environmental protection. The 65th World Health Assembly has passed Resolution WHA65.21, which proposes eliminating schistosomiasis, a neglected tropical disease, in low-transmission areas of the world. Previous research has shown that the Schistosomiasis Prevented Forestry Project is an important measure for the comprehensive control of schistosomiasis in China, with the advantages of long-term effects and prevention [33,34,35,36,37]. The project is based on the construction of forests for snail control and schistosomiasis prevention, which aims to change the environment for snail breeding, inhibit the growth and development of snails, isolate the source of infection, and control the epidemic of schistosomiasis [38].
Recently, China has built a total of 5189 km2 of snail control and schistosomiasis prevention forests, decreasing the snail density and infection rate of human by 89.8% and 51.0%, respectively [39]. The construction of these forests, which also provide a variety of other ecosystem services, such as carbon fixation, water and soil conservation, and biodiversity protection, has reached 1640 km2, in 2015, along the Dongting Lake Wetland beach. However, such ecosystem services, especially snail control and schistosomiasis prevention, have been paid less attention in previous studies on the Dongting Lake Wetland area (e.g., Mao et al., 2007, where some ecosystem services, such as agricultural and fishery productions, tourism and leisure, climate regulation, and flood storage were investigated [40]). On the other hand, most studies regarding the snail control and schistosomiasis prevention in the literature have mainly focused on this issue in terms of mechanism and construction technology [39,41]. This study focuses on the ecosystem services in the Dongting Lake area that resulted from the construction of disease prevention forests, including snail control and schistosomiasis prevention, water yield, soil conservation, and carbon storage; and, evaluates them in a period of 10 years between 2005 and 2015. For this purpose, ArcGIS 10.2 and InVEST models (with the aid of market value and shadow engineering methods for service value estimations) are applied to (1) study the temporal and spatial variations of these ecosystem services in the study area; (2) explore their variations between different land use types; and, (3) estimate their value in 2005, 2010, and 2015.
2. Study Area and Data
2.1. Study Area
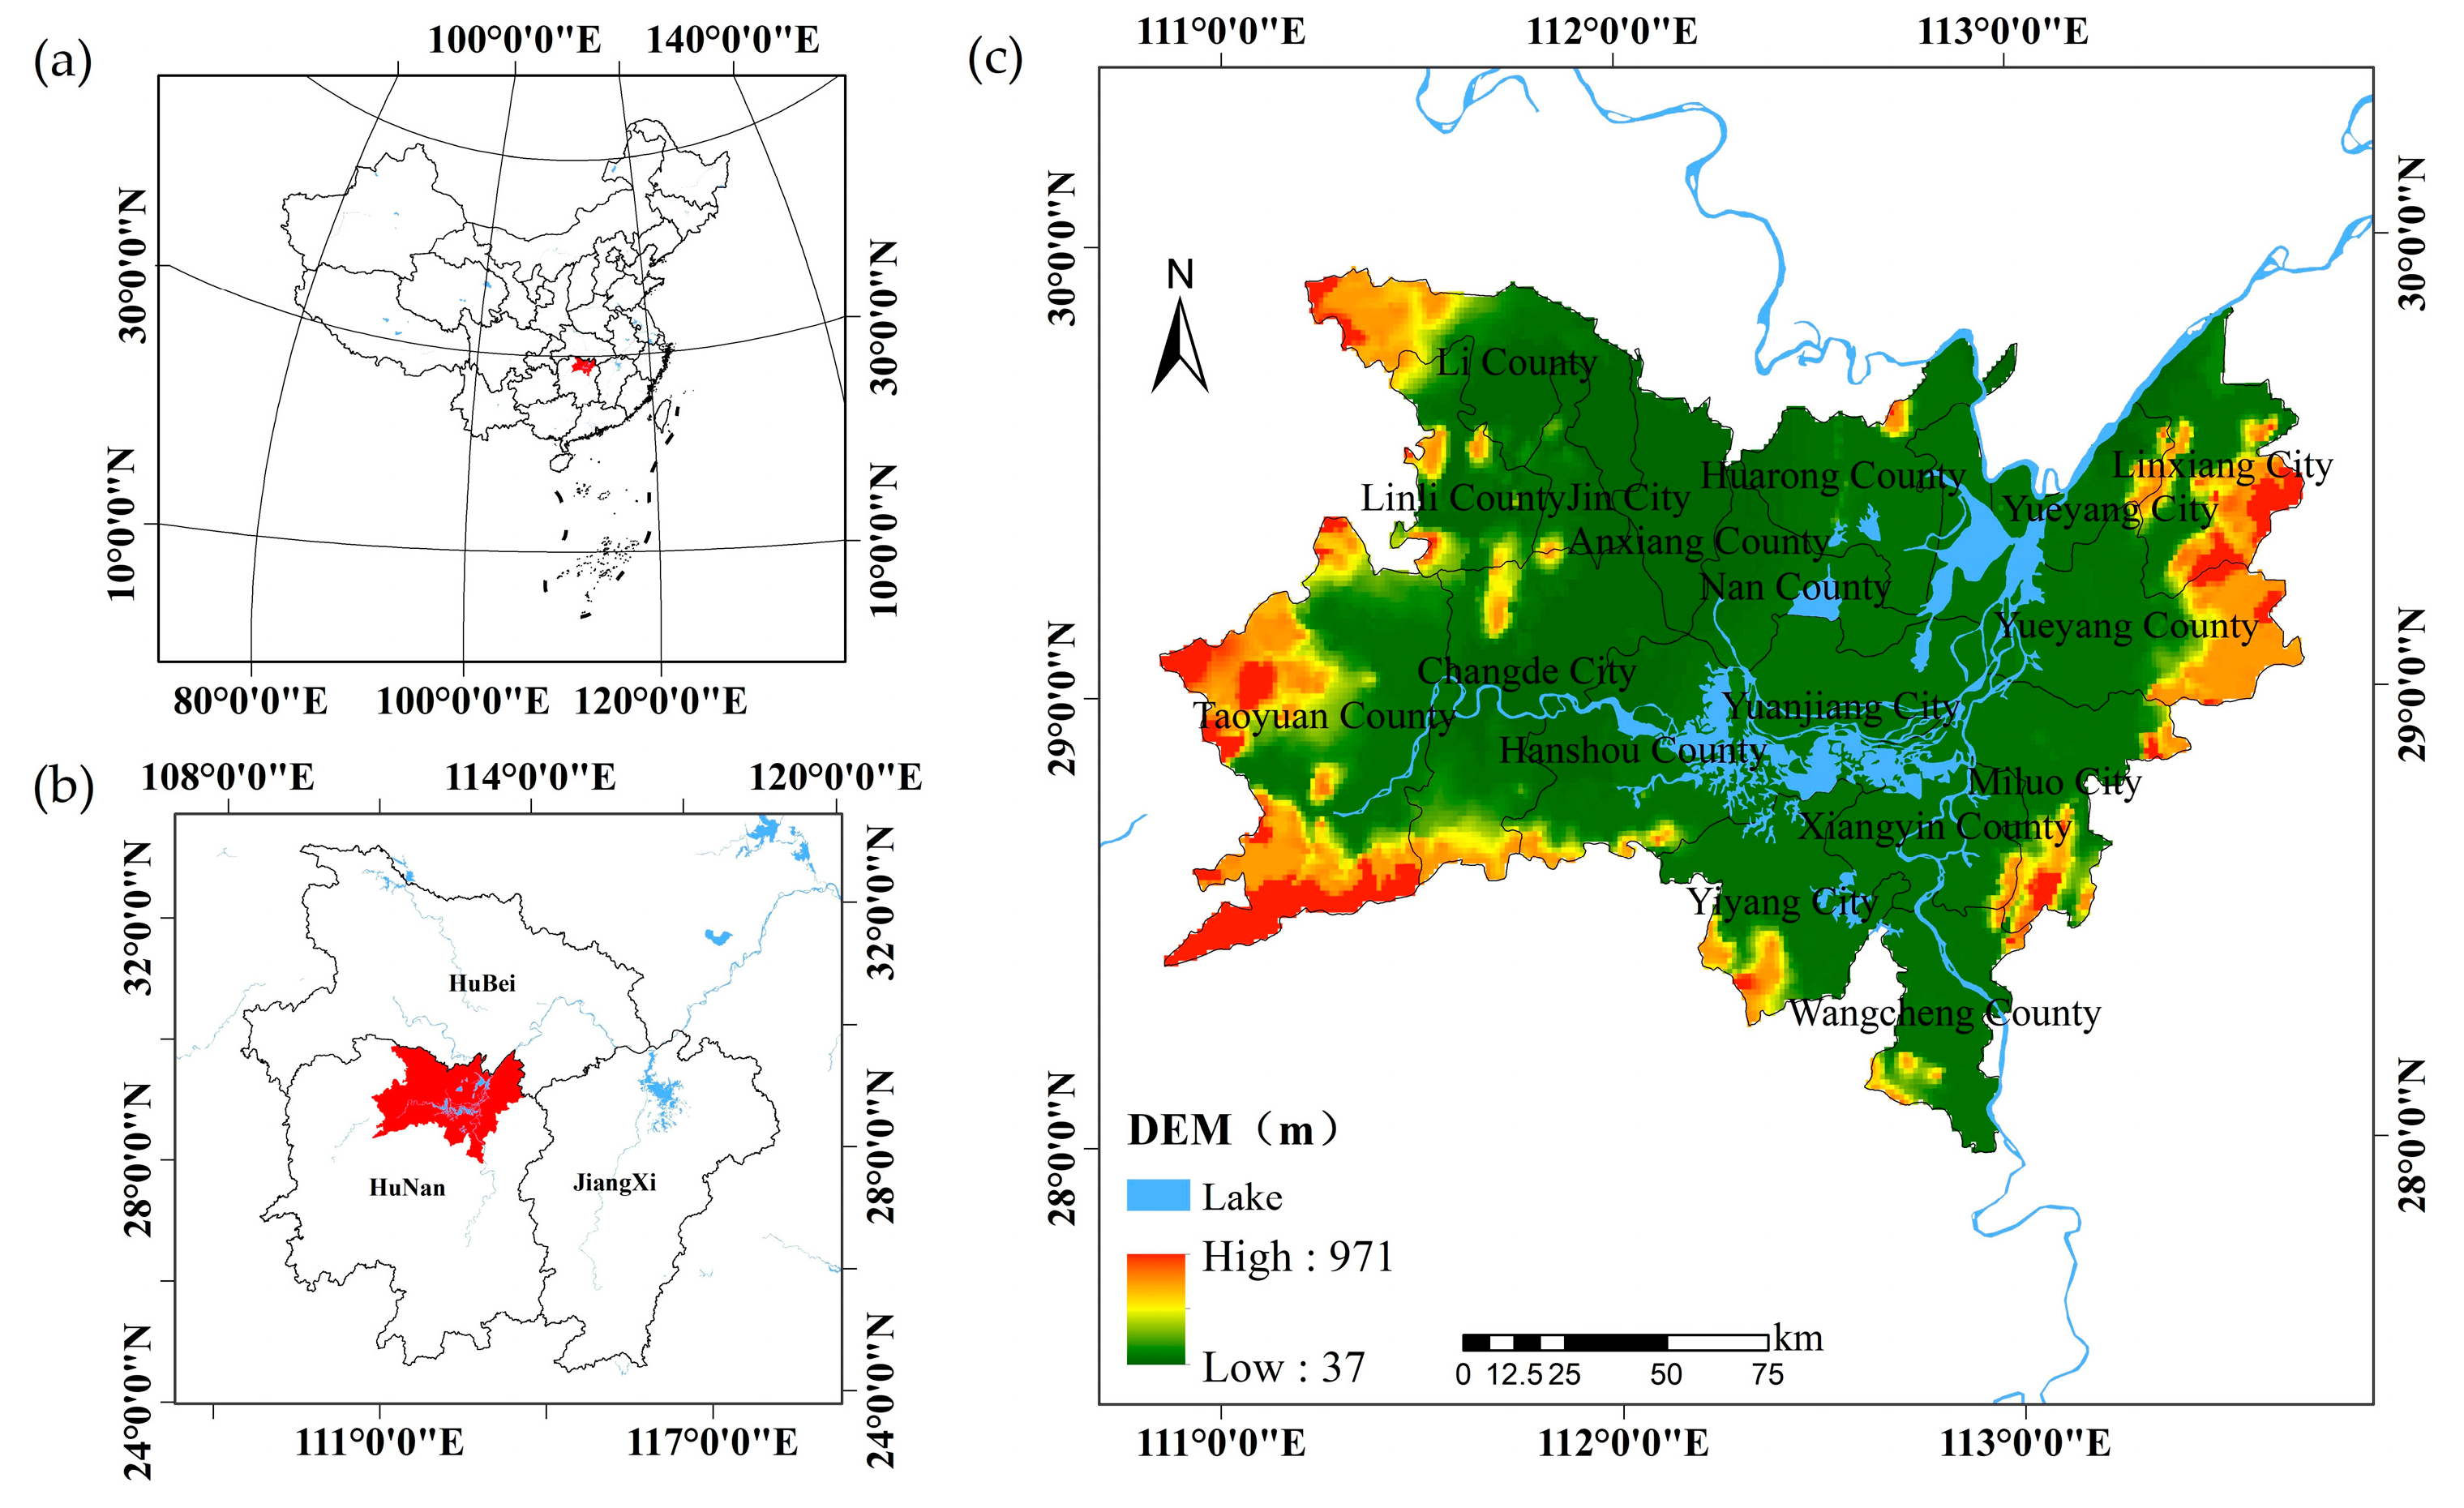
Dongting Lake is the second largest freshwater lake in China, which covers an area of 18,780 km2 and combines Xiangjiang, Zijiang, Yuanjiang, Lijiang, and other water-flooded lakes in the Yangtze River floods during the flood season. It is located between N 27°39′~30°25′ and E 111°19′~113°34′, with an average elevation of 33.5 m above sea level. Average annual temperature in the lake is 17.0 °C, with an average annual precipitation of 1100–1400 mm. The soil pH ranges between 7 and 8.4. From June to August, the area is generally flooded; the difference between the highest water level in the wet season and the lowest one in the dry season in winter can reach 8–10 m, which makes the Dongting Lake Wetland a schistosomiasis epidemic area [42]. Figure 1 shows the geographic position of this area, which includes 17 counties and cities, such as Yueyang City, and Xiangyin, Huarong, and Li Counties in Hunan Province, covering an area of 3.17 × 10⁶ km2, accounting for 16.5% of the area of the province.
By the end of 2010, the area of snail control and schistosomiasis prevention forests totaled 701.86 km2, while, in 2015, this area amounted to 1334.66 km2, which greatly inhibited snail numbers and decreased the number of schistosomiasis patients. The proportion of arable land in the Dongting Lake Wetland accounts for more than 45%, followed by woodland and water area. The proportions of residential, unutilized, and grassland areas are comparatively small and below 5%. From 2005 to 2015, arable land, woodland, grassland, and water area decreased at different degrees, i.e., by 1% (313.90 km2), 0.35% (111.09 km2), 0.15% (45.99 km2), and 0.72% (228.25 km2), respectively. In contrast, the proportions of residential and unutilized lands continued to increase by 1.34% (424.26 km2) and 0.88% (279.60 km2), respectively. Table 1 presents the land cover types and areas from 2005 to 2015.
2.2. Data Sources and Processing
The land use maps (at a spatial resolution of 30 × 30 m) of the Dongting Lake Wetland from 2000 to 2015 were downloaded from the Resource and Environment Data Cloud platform [43]. Precipitation data of the Wetland during this period were acquired from the National Meteorological Information Center [44]. ArcGIS 10.2 conducted Kriging interpolation in the study area and the surrounding areas on precipitation data from 59 meteorological and hydrological stations and, subsequently, grid maps with a resolution of 30 m were generated for the related years. The Digital Elevation Model (DEM) data were generated in ArcGIS 10.2 by means of interpolation, cutting, and filling digital elevation data of Global Digital Elevation Model Version 2 (GDEM V2), with a high resolution of 30 m, which was sourced from Geospatial Data Cloud [45]. Soil data, including soil texture, topsoil organic carbon, and fractions of topsoil sand, silt, and clay were obtained from the Soil Map of China based on the Harmonized World Soil Database (version 1.1, with a 1:1 million map scale), which was created by the Cold and Arid Regions Sciences Data Center in 2009 [46], and ArcGIS 10.2 was used to obtain the soil grid maps with a resolution of 30 m. The carbon density values for each land use were collected from Li et al. (2003) and Wang et al. (2010) [47,48] based on the principle of similarity within the natural environment of the Dongting Lake Wetland.
3. Methods
The data were firstly processed by using the ArcGIS 10.2 to develop an input for the analysis of the ecosystem services in this section, as discussed in the previous section. The InVEST model is then used, as described in Section 3.1, Section 3.2, and Section 3.3, to estimate water yield (the difference between precipitation and actual evapotranspiration), soil conservation, and carbon storage. Moreover, the Raster Calculator of ArcGIS 10.2 is applied to evaluate the snail control and schistosomiasis prevention, as presented in Section 3.4. Besides, the market value and shadow engineering methods were employed to calculate the values of the services.
3.1. Water Yield Model
The InVEST water yield module is an estimation method that is based on the water balance method, where the water yield of a grid unit refers to precipitation minus actual evapotranspiration, and the generated water yield data are the total amount and depth of water yield [49]. The module formula is as follows:
where and are the annual water yield and the actual evapotranspiration of the land cover type j in Grid x in mm; and, is the precipitation of Grid x in mm. The annual potential evaporation for the 87 meteorological stations in the Dongting Lake Wetland was estimated by the Penman–Monteith equation [50]. Subsequently, Kriging spatial interpolation was used to obtain a map of the annual average potential evapotranspiration of the Wetland. Besides, the market value method was employed to calculate the value of the water yield service.
3.2. Soil Conservation
The soil retention module, which was based on the Revised Universal Soil Loss Equation (RUSLE), was used to estimate the amount of soil erosion within the region. The formulas of the module are as follows:
where is the total potential soil loss (t) per pixel in the original land cover without the application of factors or from the RUSLE (i.e., equivalent to the soil loss for bare soil); is the estimated average soil loss (t) per pixel in the original land cover (t·km−2·yr−1); is the amount of soil retention (t); and, is the rainfall erosivity (MJ·mm/(km2·h·yr)), which is calculated while using the formula of Wischmeier according to the average monthly and annual precipitations in the Dongting Lake Wetland [51]; is the soil erodibility (t·km2·h/(km2·MJ·mm)) calculated while using the formula of Williams based on relevant soil data [52]; is the slope length gradient factor; is the cover management factor obtained by the FAO [53]; and, is the support practice factor that is available from the USDA Agriculture Handbook [54]. The value of soil conservation was estimated while using shadow engineering method.
3.3. Carbon Storage
The carbon module uses land use maps and the carbon density (i.e., above ground biomass, belowground biomass, soil, and dead biomass) of each land use type to estimate the amount of carbon that is currently stored in a landscape, as follows [55]:
where is the total carbon storage (t); and, , , , and are the carbon storage (t) in aboveground biomass, belowground biomass, soil, and dead biomass, respectively. The value of carbon storage was calculated while using the market value method.
3.4. Snail Control and Schistosomiasis Prevention
The purpose of constructing snail control and schistosomiasis prevention forests has been to reduce the density and area of snails and effectively prevent and control the spread of schistosomiasis. Therefore, in this study, the snail-control function is evaluated by the reduction of the snail area and the reduction in the number of schistosomiasis patients. The Raster Calculator of ArcGIS 10.2 is used to analyze the quality and value of snail control and disease prevention, while using the following equations:
where and denote the reduced areas that are colonized by the snail and the reduction number of schistosomiasis patients, respectively; and are the snail area (104 m2) and the number of schistosomiasis patients in 2010; and, and are those quantities in 2015.
The market value and the shadow engineering methods, and then were used to calculate the value of snail control and schistosomiasis prevention. The value of snail and disease prevention function () is computed as the following:
where is the cost of snail control (in CNY/m2) and is the annual treatment cost per patient.
Table 2 summarizes the sources used for the collection of parameters.
4. Results and Analysis
In this section, the results of the present study on the variations of different ecosystem services in the Dongting Lake Wetland and an analysis of their values are presented.
4.1. Temporal and Spatial Variations of the Ecosystem Services
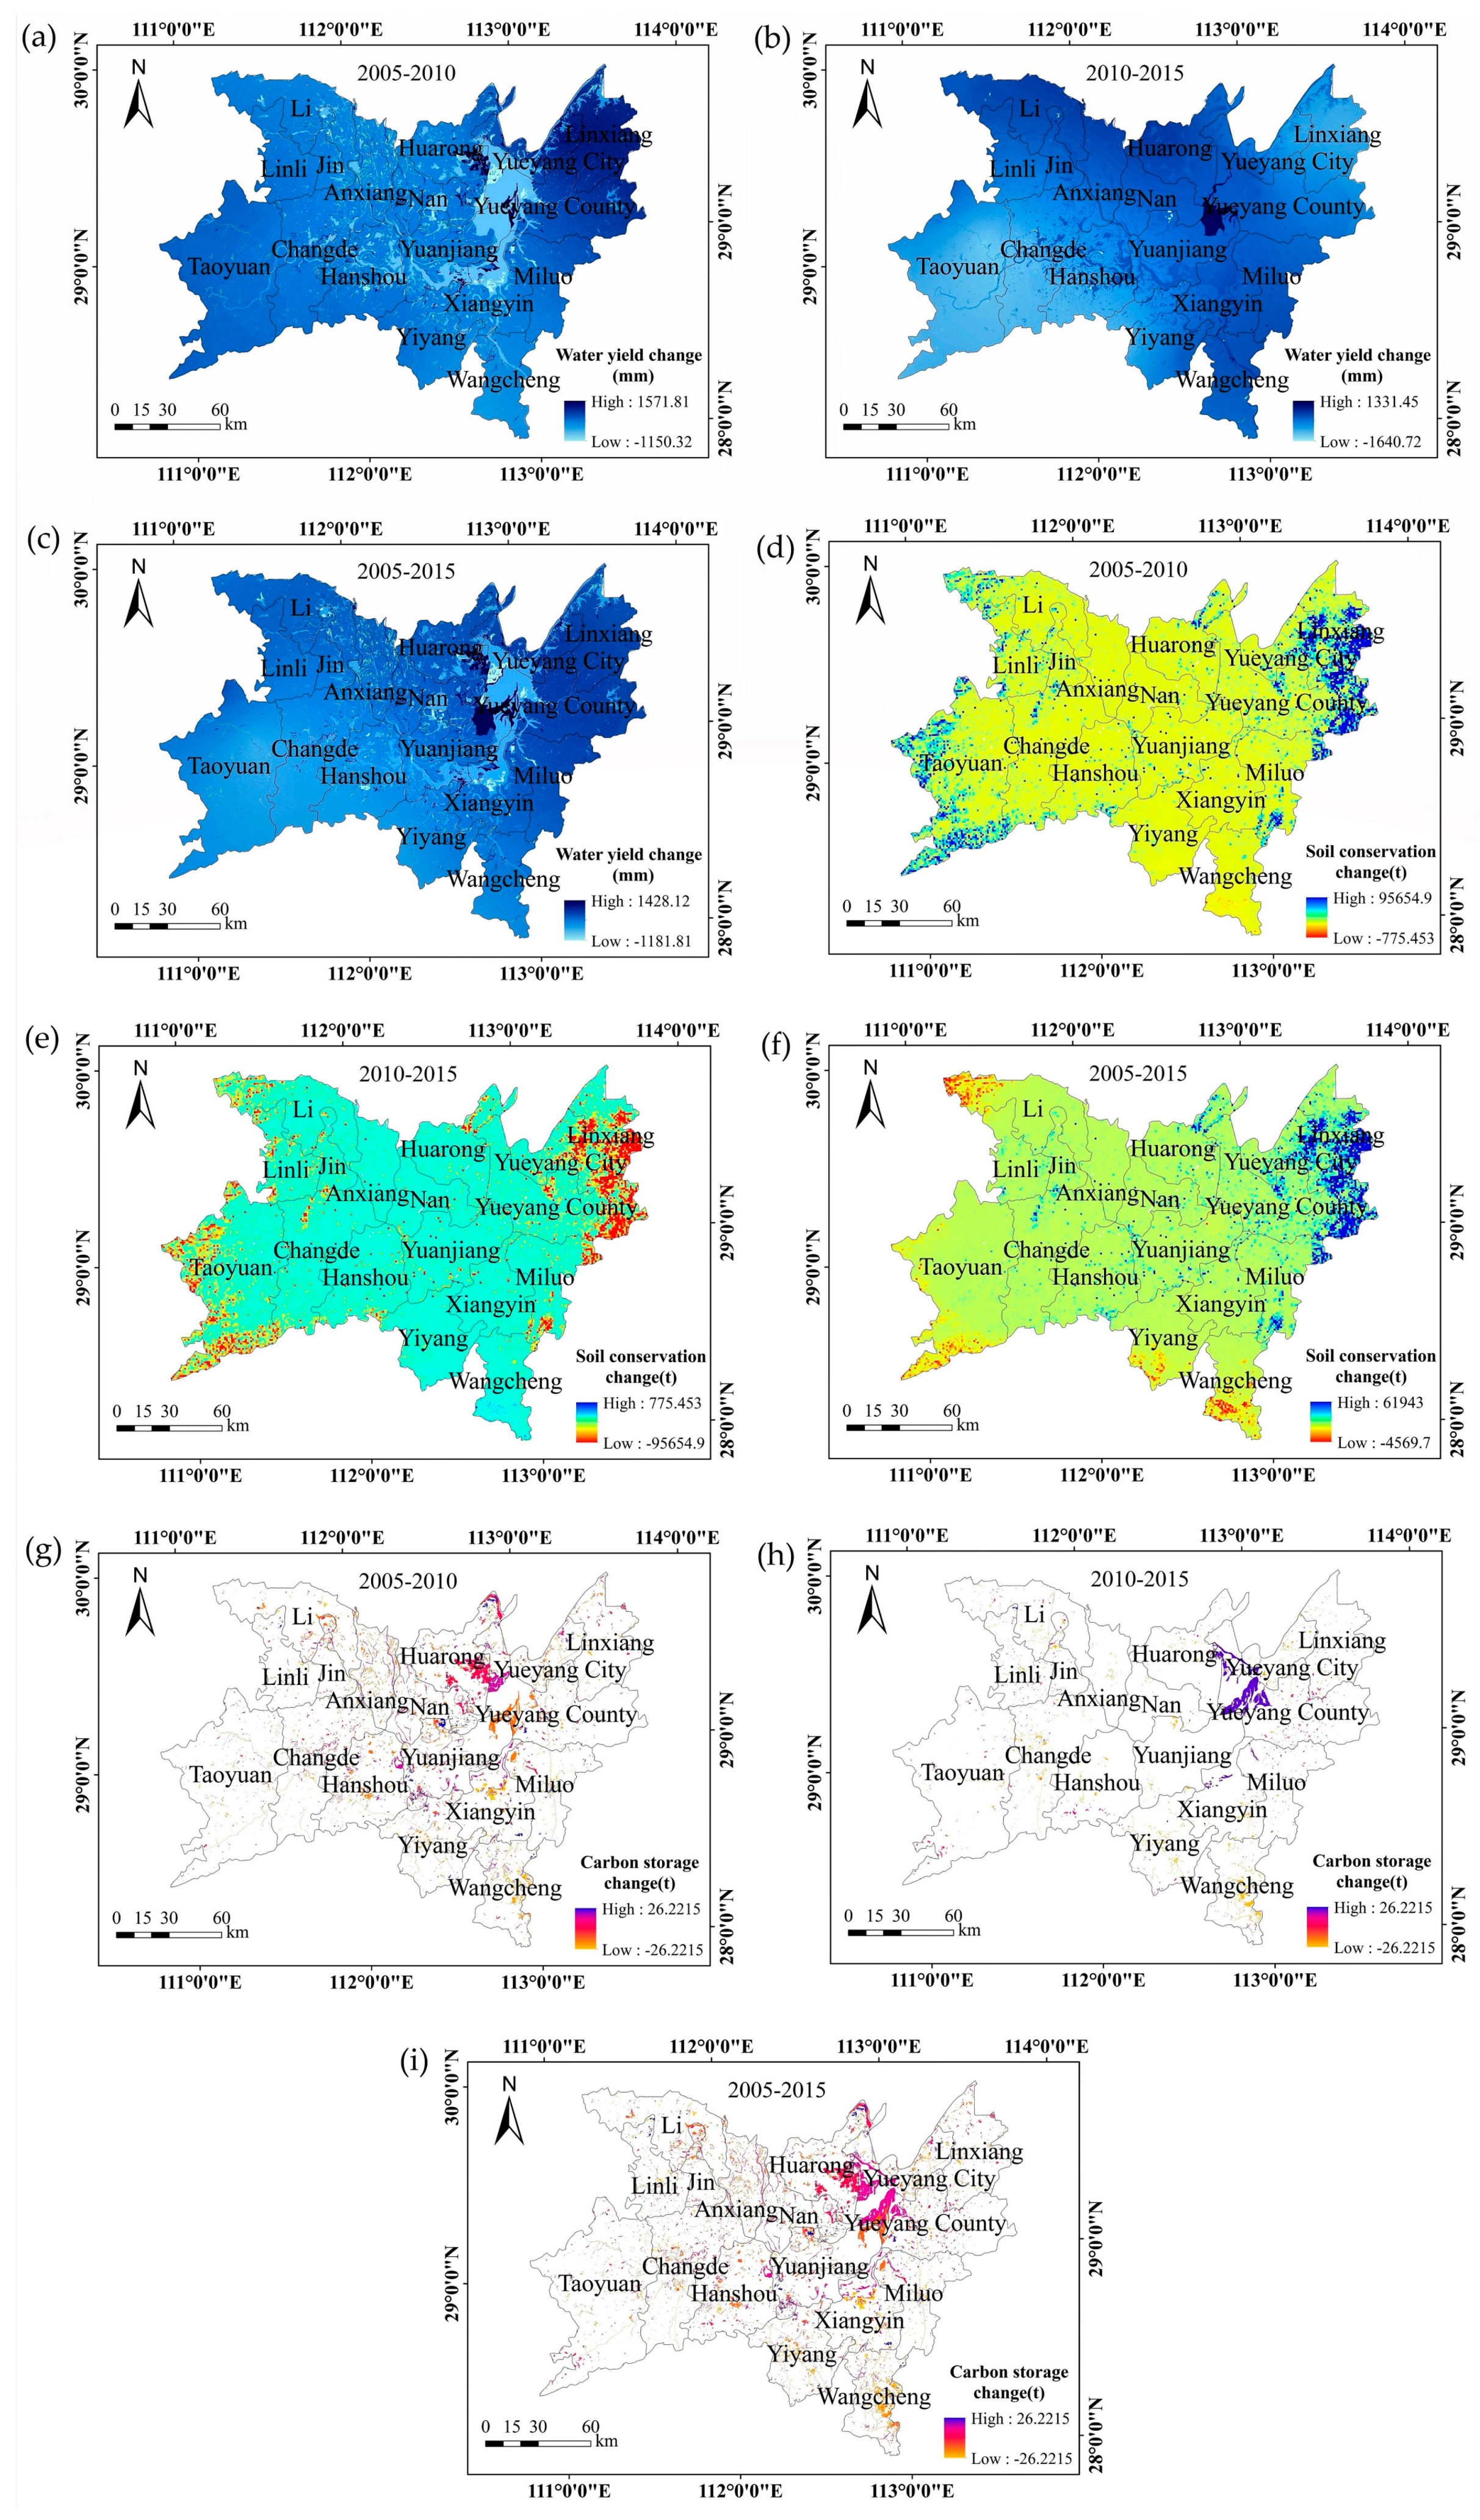
Figure 2 shows the results of the study on the temporal and spatial variations of the water yield, soil conservation, and carbon storage; and, Figure 3 and Figure 4 present those variations in the reduced snail area and the number of schistosomiasis patients, in the Dongting Lake Wetland, from 2005 to 2015.
4.1.1. Variations of Water Yield
Land use and climatic changes both influence water yield. In 2005, 2010, and 2015, water yield in the Dongting Lake Wetland was 236.91 × 10⁸ m3, 339.61 × 10⁸ m3, and 302.80 × 10⁸ m3, respectively. This shows that it increased from 2005 to 2010 by 43.3% and then decreased 10.8% between 2010 and 2015. The reason for these variations was that the amount of rainfall was higher than evapotranspiration between 2005 and 2010, while the latter became larger from 2010 to 2015. However, the net change from 2005 to 2015 was an increase of 65.89 × 10⁸ m3 (equivalent to 27.81%). Spatially, water yield during this period decreased in the southwest (Taoyuan and Hanshou Counties), with the largest reduction of 1313.0 m3/km2, while it increased in the northeast (Yueyang County, and Linxiang and Yueyang Cities), where the largest rise was 1586.8 m3/km2.
4.1.2. Variations of Soil Conservation
In 2005, soil conservation was equivalent to 1257.23 × 104 t, while, in 2010 and 2015, it accounted for 1931.06 × 104 t and 1257.44 × 104 t, respectively, i.e., a total increase of 0.21 × 10⁴ t equivalent to a growth of 0.02% from 2005 to 2015. However, the change was not uniform across the area, as in the northwest (Li County) and southwest (Taoyuan County) a decrease was observed with the largest value of 4569.7 t; while, in the northeast (Linxiang City, Yueyang County, and Yueyang City), the amount of conserved soil became larger (with a maximum change of 61,943 t). See Figure 2 for details.
A variety of factors, such as climate, topography, land use, and human activities, influence soil conservation. Among these, precipitation and rainfall erosivity, with temporal variations that were similar to the soil conservation (i.e., increase from 2005 to 2010 and then decrease from 2010 to 2015), were the most significant causes of the large variations in the amount of the conserved soil between 2005 and 2015.
4.1.3. Variations of Carbon Storage
In 2005, 2010, and 2015, the total carbon storage was 3.57 × 10⁸ t, 3.63 × 10⁸ t, and 3.56 × 10⁸ t, respectively. This shows a total decrease of 0.01 × 10⁸ t (i.e., 0.28%) from 2005 to 2015. Spatially, during this period, the carbon storage mainly changed in the northwest (Li County), northeast (Yueyang County), and southeast (Wangcheng County), with a maximum reduction of 26.2215 t; while, in the areas in the middle (Huarong county and Yuanjiang City), it increased with a maximum change of 26.2215 t (Figure 2). Temporal and spatial changes in the carbon storage were both associated with the changes in the land use. For example, higher variations in the carbon storage were observed in the regions with higher changes of land use.
4.1.4. Variation of Snail Control and Schistosomiasis Prevention
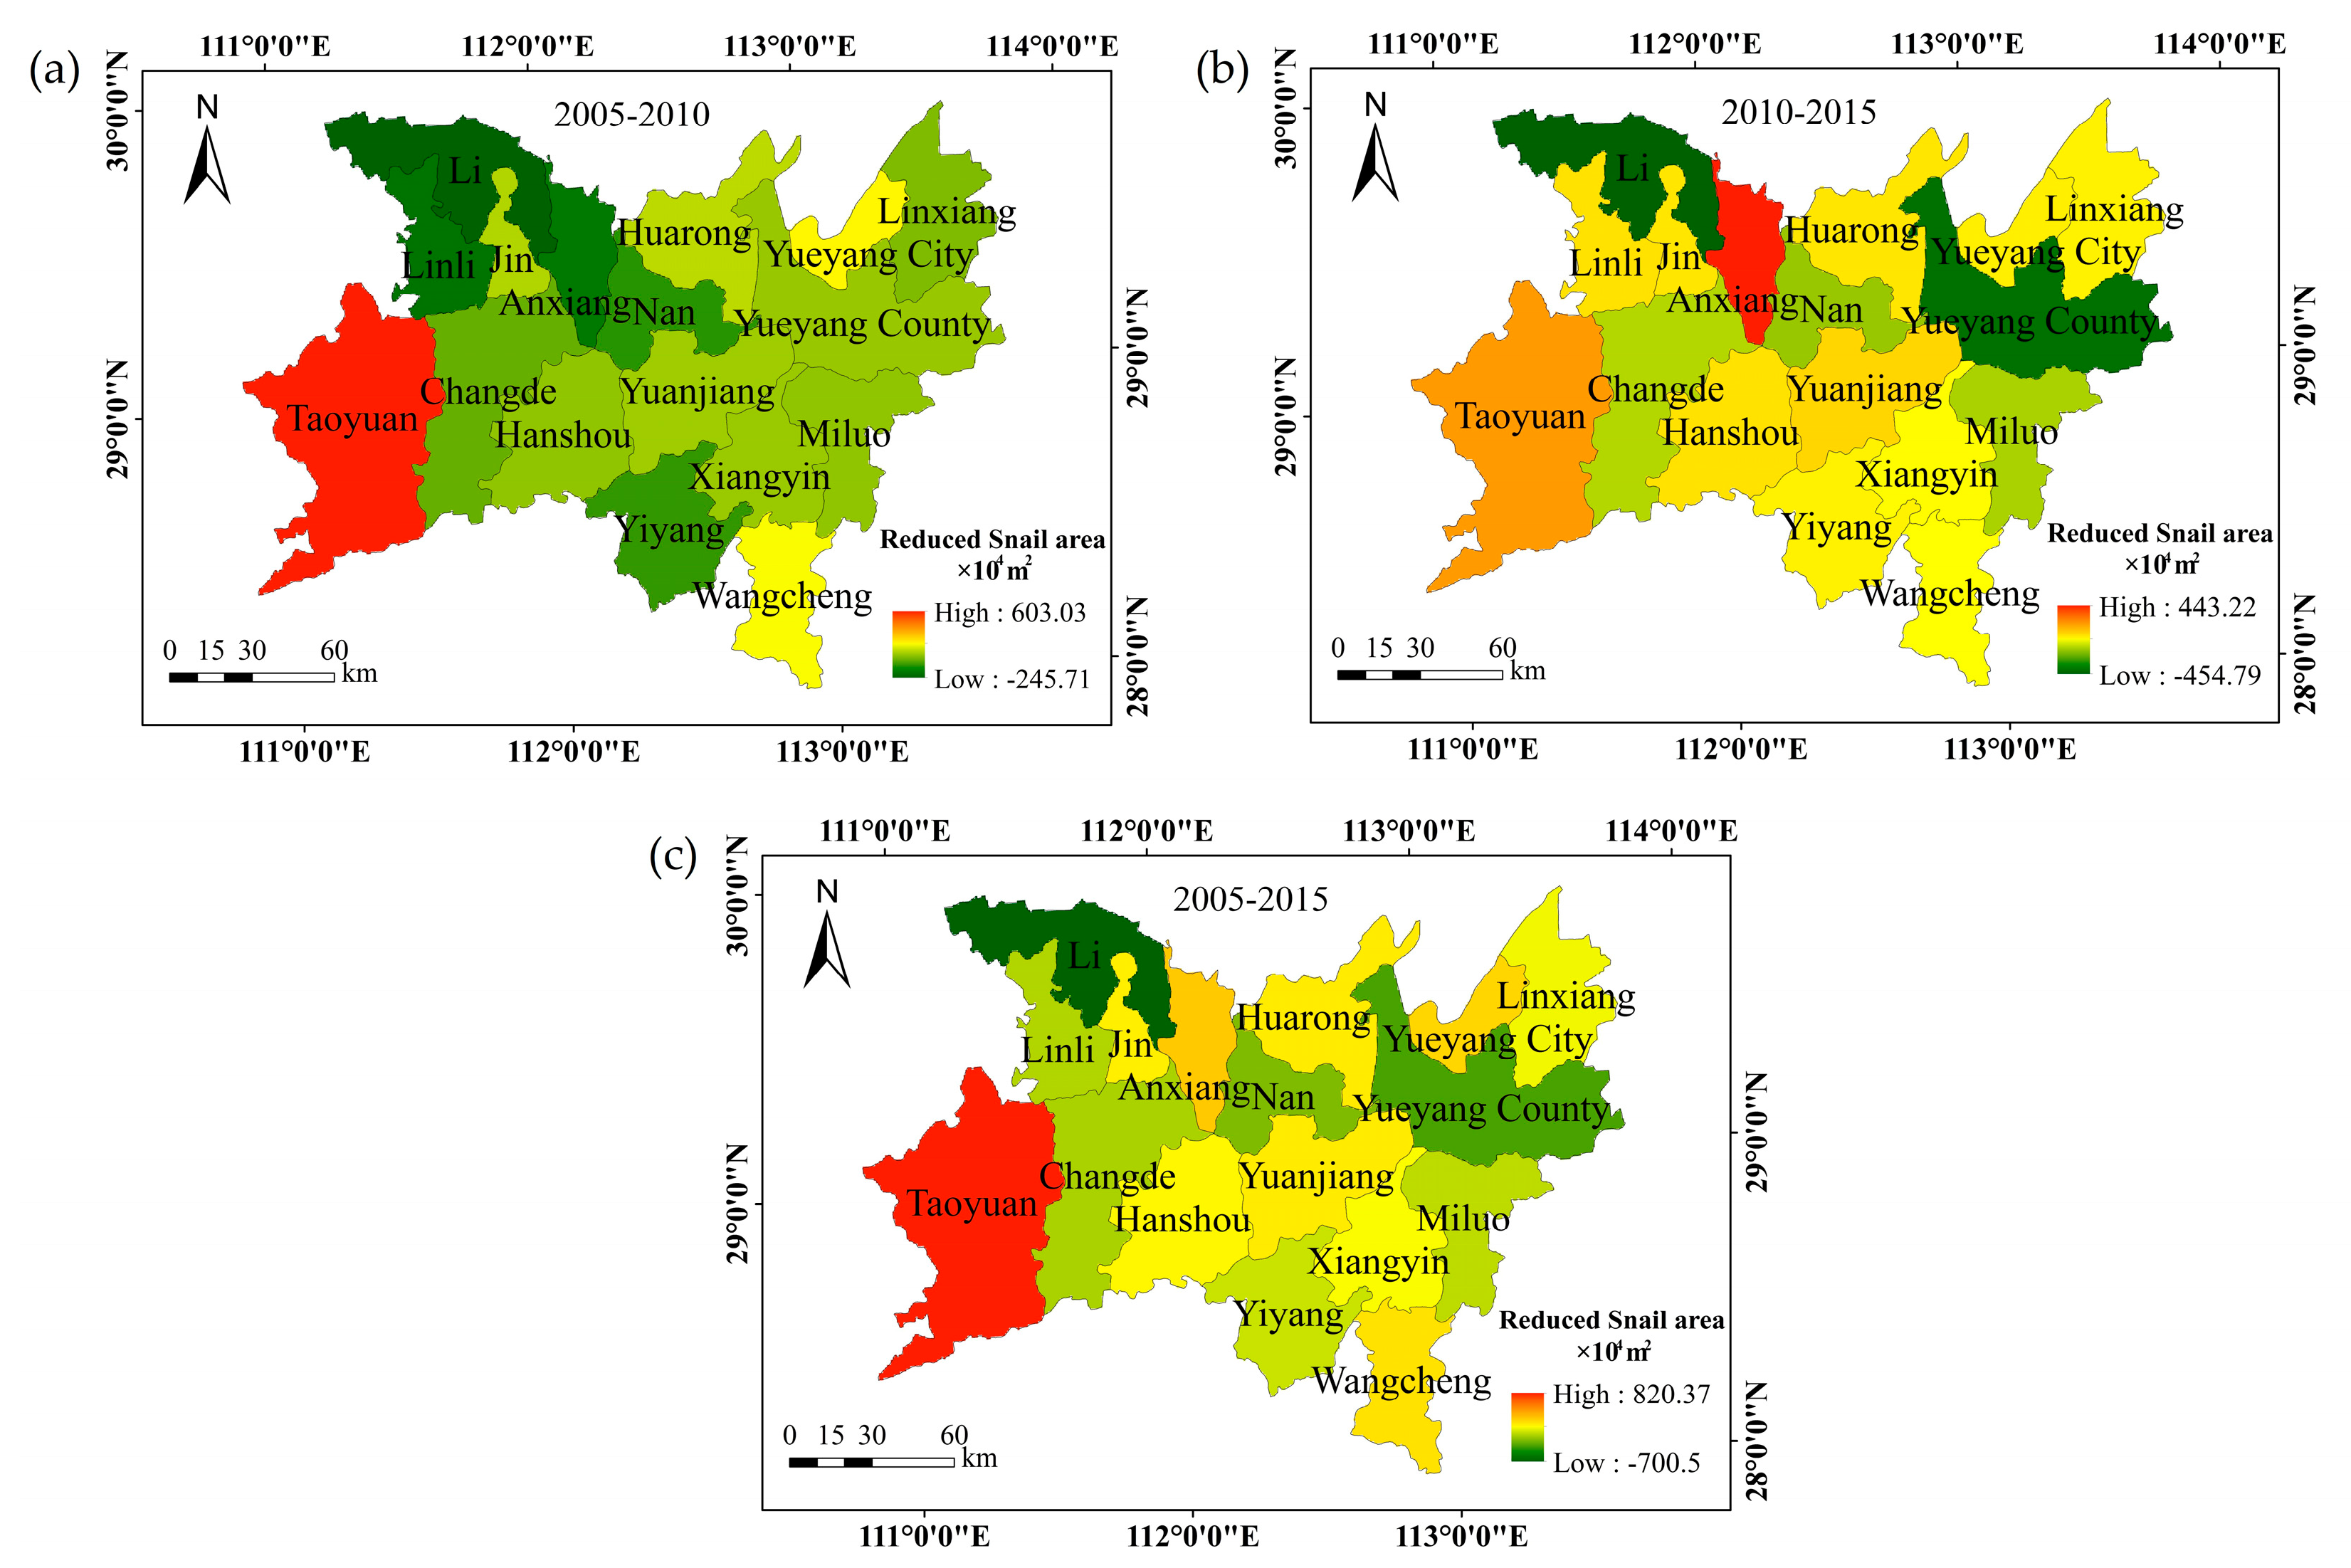
The construction of snail control and schistosomiasis prevention forests in the Dongting Lake Wetland has considerably changed the environmental conditions for snail breeding. Figure 3 shows the temporal and spatial reductions of snail areas in the study area between 2005 and 2015. In 2005, snails colonized 176,042.5 × 104 m2 of the area. Subsequently, from 2005 to 2015, 10 counties experienced a reduction, with the total amount of 326.01 × 10⁴ m2 (i.e., −0.19%), while an increase of snail area was observed in seven other counties. These variations were as follows. In Taoyuan, Anxiang, Wangcheng, Huarong, Hanshou, and Xiangyin Counties, as well as Yueyang, Yuanjiang, Jin, and Linxiang Cities, there was a reduction in the snail area with a maximum of 820.37 × 10⁴ m2 in Taoyuan County; while, in Nan, Yueyang, and Li Counties and Yiyang, Miluo, Linli, and Changde Cities, the area that was colonized by snails became greater with a maximum of 700.5 × 10⁴ m2 in Li City. The increase in the snail area in the latter, in spite of the presence of the constructed snail control and schistosomiasis prevention forests, was that these areas are located along the Oncomelania hupensis snail-ridden regions outside embankments of Yangtze river and Dongting Lake, where the infectious sources are various, large in number, and difficult to manage, thus a high risk of schistosomiasis still exists [57].
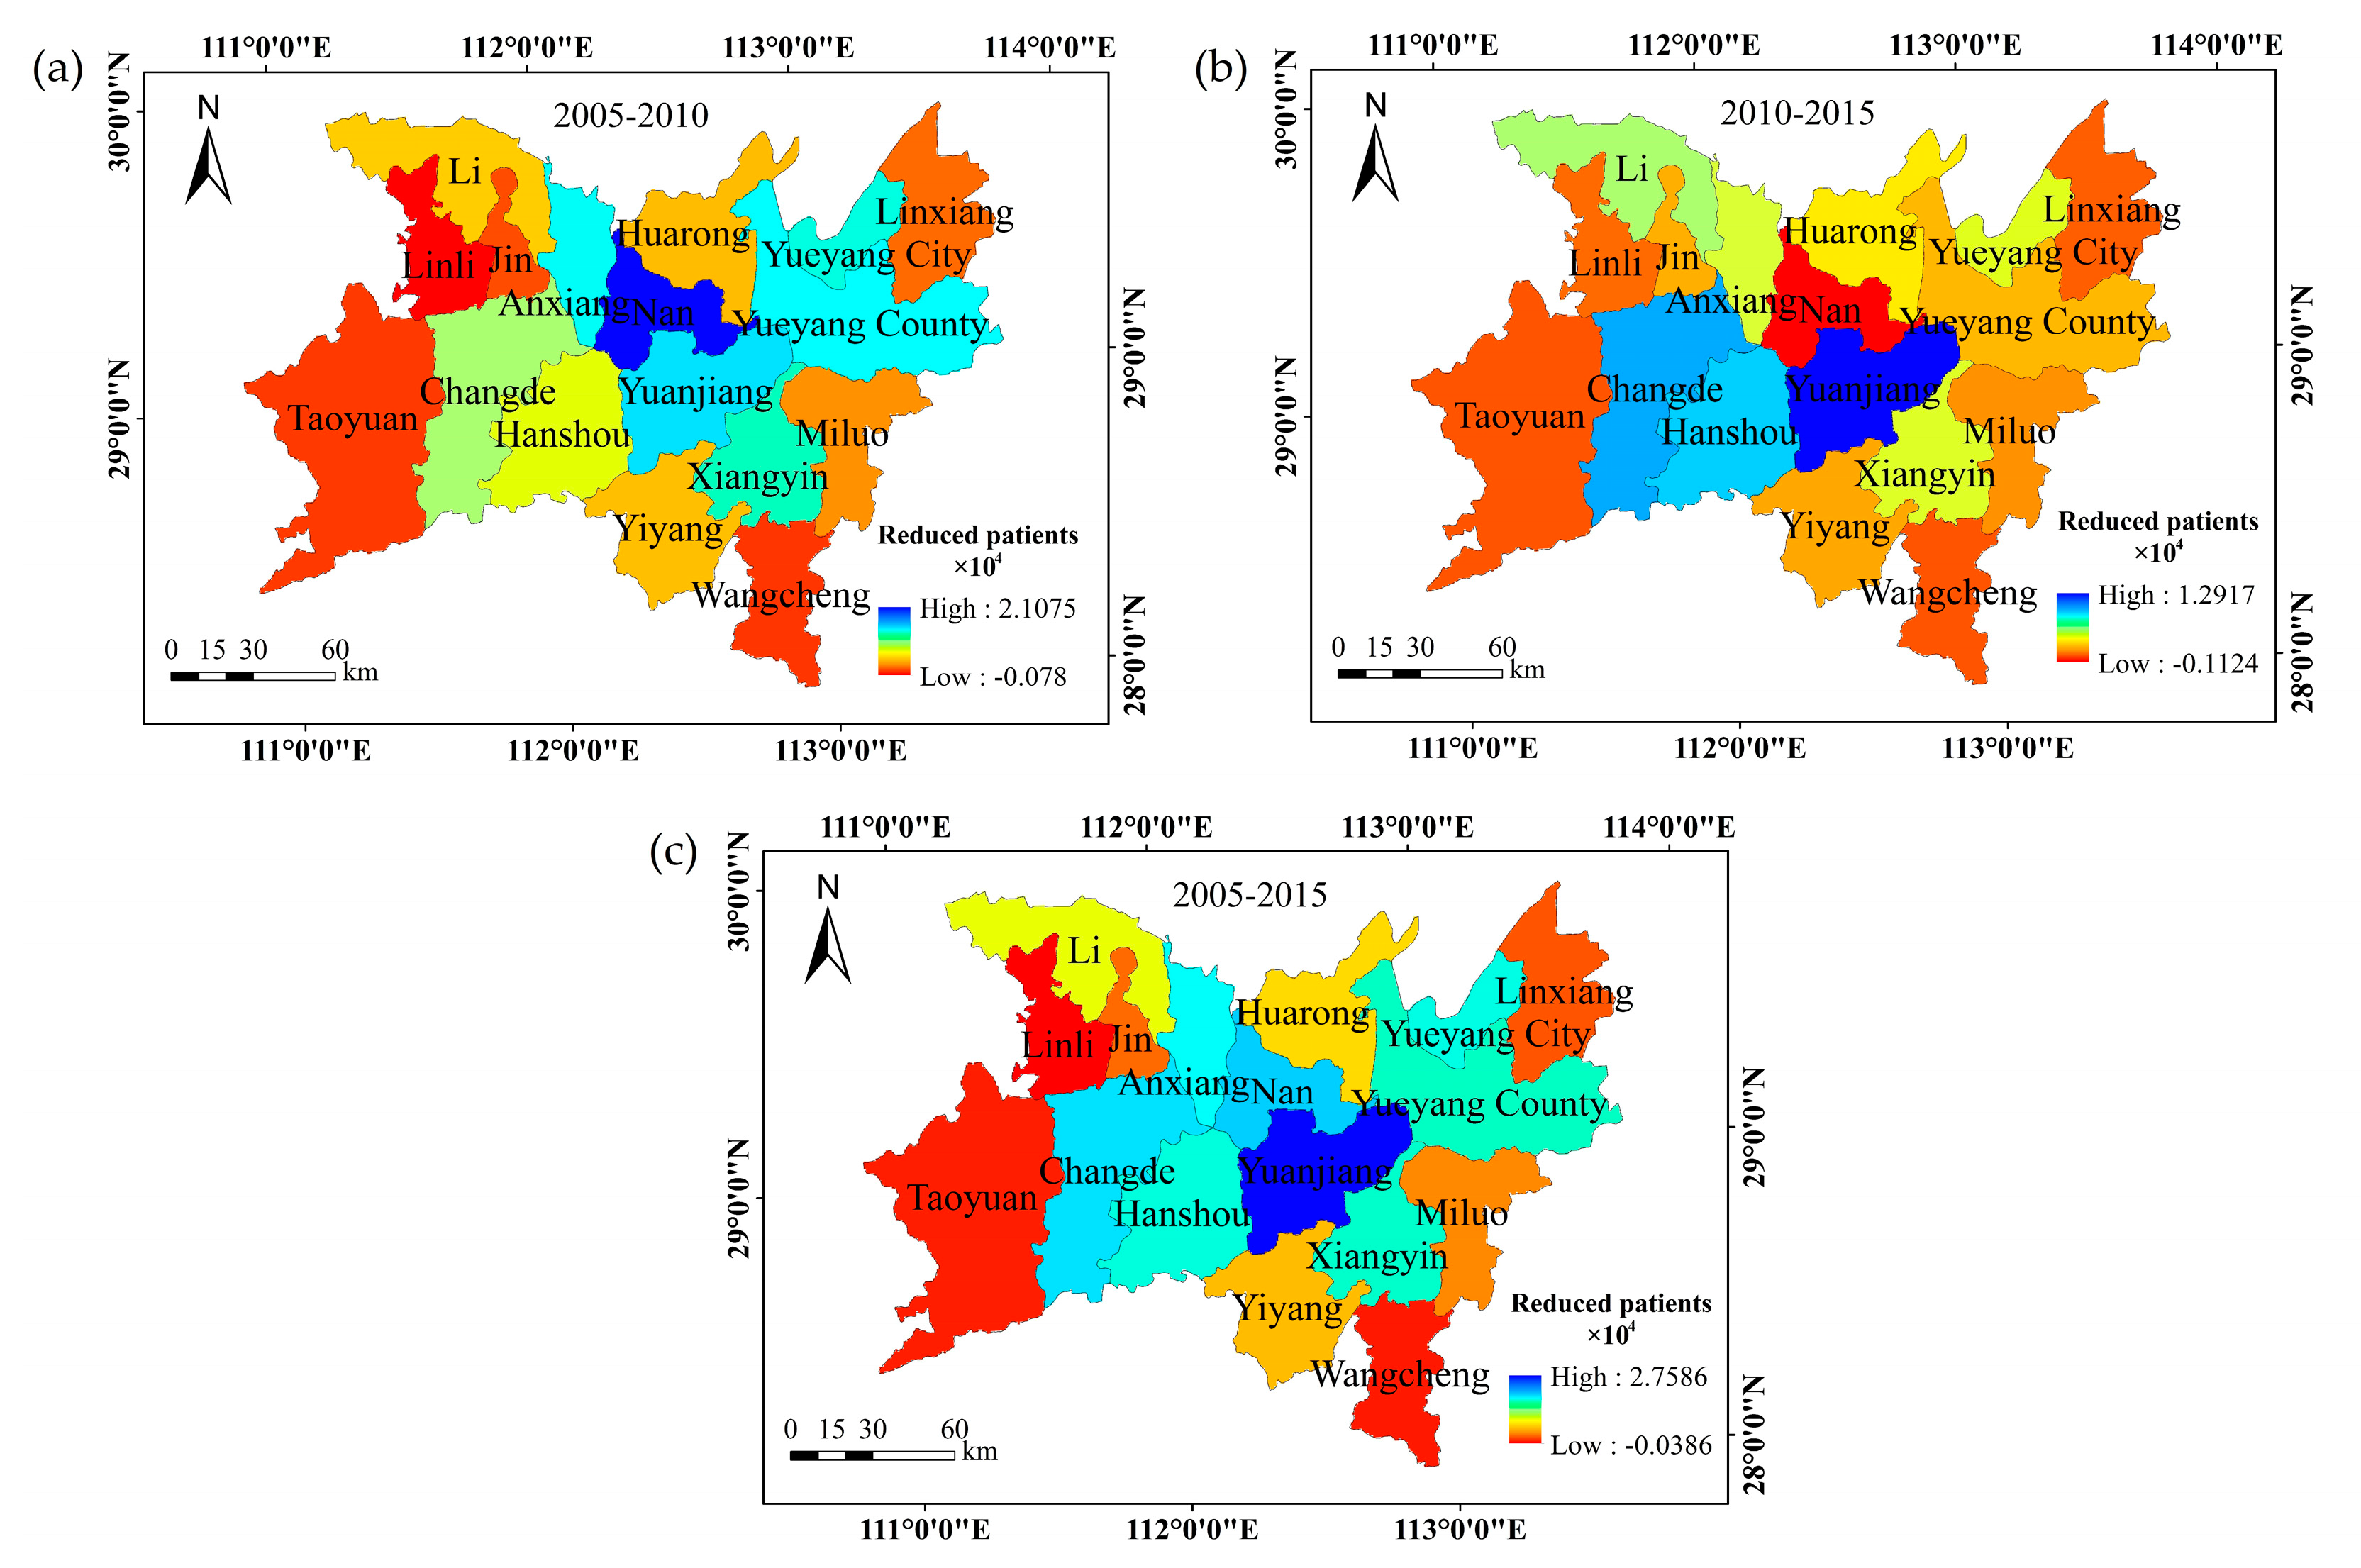
Except in Linli County, where the number of schistosomiasis patients increased from 2005 to 2015 (386 people), this number decreased in all other counties and cities of the study area. In 2005, the total number of schistosomiasis patients in the Dongting Lake Wetland area was 210,651, which then reduced by 182,829 (86.8%) from 2005 to 2015. The largest reduction was observed in Yuanjiang City with 27,586 patients, followed by Nan County, while the smallest decrease was found in Wangcheng County with 154 patients. The increase in the number of patients in Linli County was mainly due to the fact that, in this county, there is a large number of cattle and sheep, which increases the human and animal infection rate [58]. Figure 4 shows these temporal and spatial variations in the study area between 2005 and 2015.
4.2. Variations in Ecosystem Services between Different Land Use Types
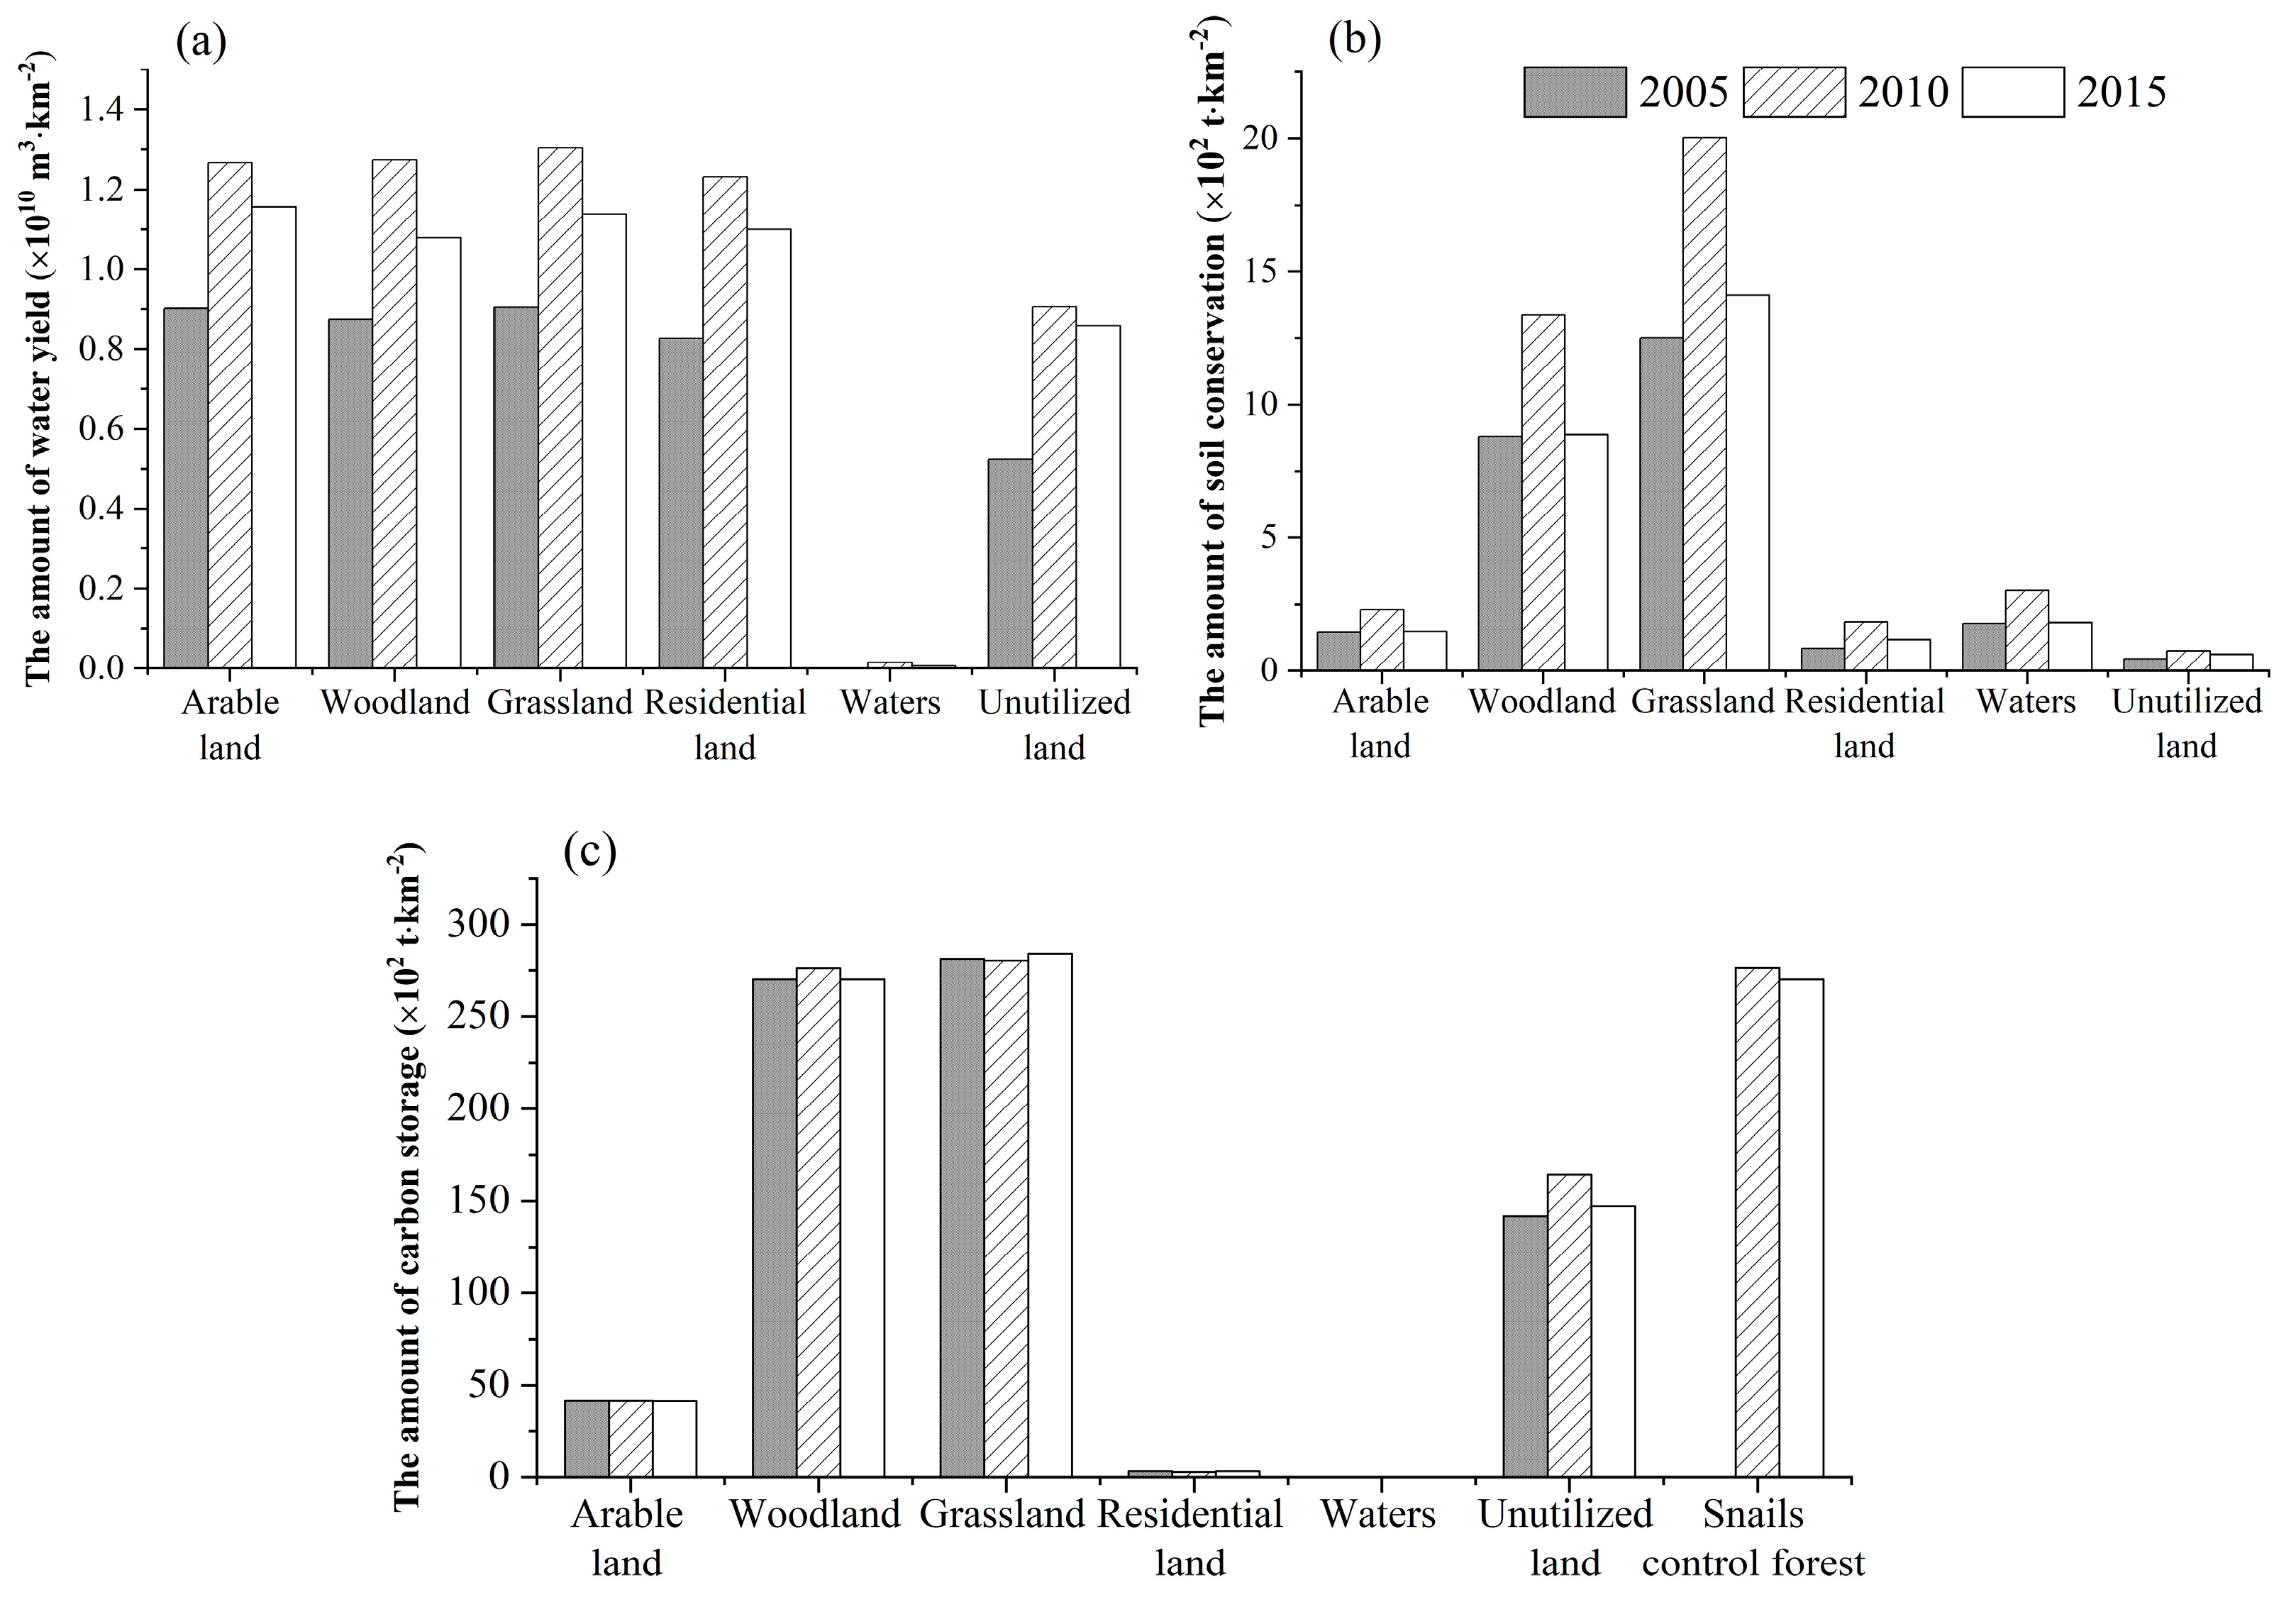
Different types of land use showed different changes in the water yield. The amount of water yield per km2 in unutilized, residential, arable, forest, and grassland areas had a growth of 63.83%, 32.86%, 28.19%, 23.25%, and 25.79%, respectively (Figure 5a). Moreover, it can be seen from this figure that the order of water yield per km2 in different land use types was as follows: woodland > arable land > grassland > residential land > unutilized land > water area.
The change in the total amount of conserved soil was different every five years. As shown in Section 4.1.2, it increased by 53.60% in the first five years of the study period, while it decreased by 34.88% in the second 5 years. Soil conservation per km2 of different land use types from 2005 to 2015 is shown in Figure 5b. Among them, the residential, unutilized and grassland areas experienced an increase of soil conservation per km2 by 38.74%, 37.40%, and 12.76%, respectively, while the others had a smaller increase. In summary, the soil conservation per km2 in different land use types between 2005 and 2015 followed this order: grassland > woodland > water area > arable land > residential land > unutilized land.
As shown in Section 4.1.3, from 2005 to 2010, the total amount of carbon storage increased by 1.68%, and then a decrease of 1.93% was observed from 2010 to 2015. Figure 5c presents the changes in the carbon storage capacity per km2 of different land use types for every five years during the study period. As can be seen, there has been an increase in unutilized land and grassland by 3.94% and 1.14%, respectively; and, a decrease of 4.87%, 0.15%, and 0.03%, respectively, in the residential, arable, and woodland areas. According to the study of Chen et al., (2012) [59] on the carbon storage in Dongting Lake area from 1979 to 2004, soil organic carbon was largely lost when grassland was converted into woodland due to the establishment of forests in the Wetland area. According to the present results, the order of the carbon storage was as follows: grassland > woodland > unutilized land > residential land > arable land.
4.3. Analysis of the Value of Ecosystem Services
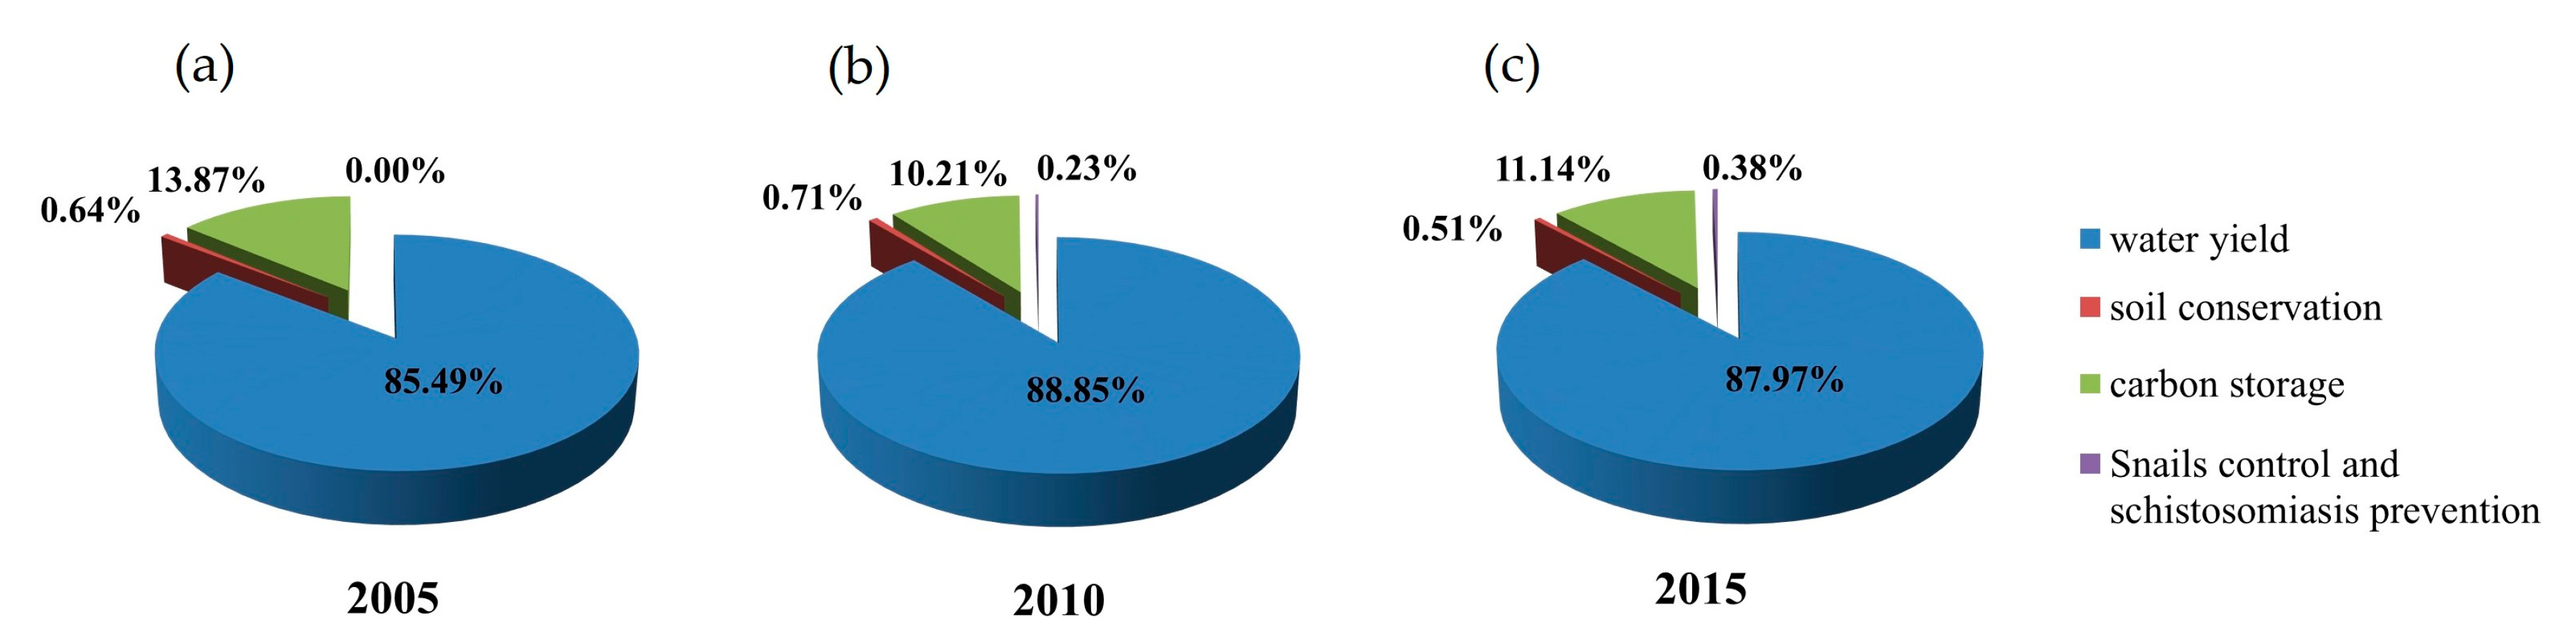
Figure 6 presents the results of the analysis that was carried out on the value of the ecosystem services in the Dongting Lake Wetland while using the market value and shadow engineering methods. The value of these services was estimated to be 1249.84 × 108 CNY in 2005, of which water yield, carbon storage, soil conservation, and snail control and schistosomiasis prevention accounted for 85.49%, 13.87%, 0.64%, and 0.00%, respectively. In 2010, this value increased to 1723.85 × 108 CNY, with the rise in the value of water yield, soil conservation and snail control, and schistosomiasis prevention by 3.36%, 0.07%, and 0.23%, respectively, and a reduction of 3.67% in carbon storage. In 2015, the overall ecosystem value reduced to 1552 × 108 CNY. This was associated with decreases of 0.88% and 0.20% in the water yield and soil conservation, respectively, and growth of 0.93% and 0.15% in the values of carbon storage and snail control and schistosomiasis prevention.
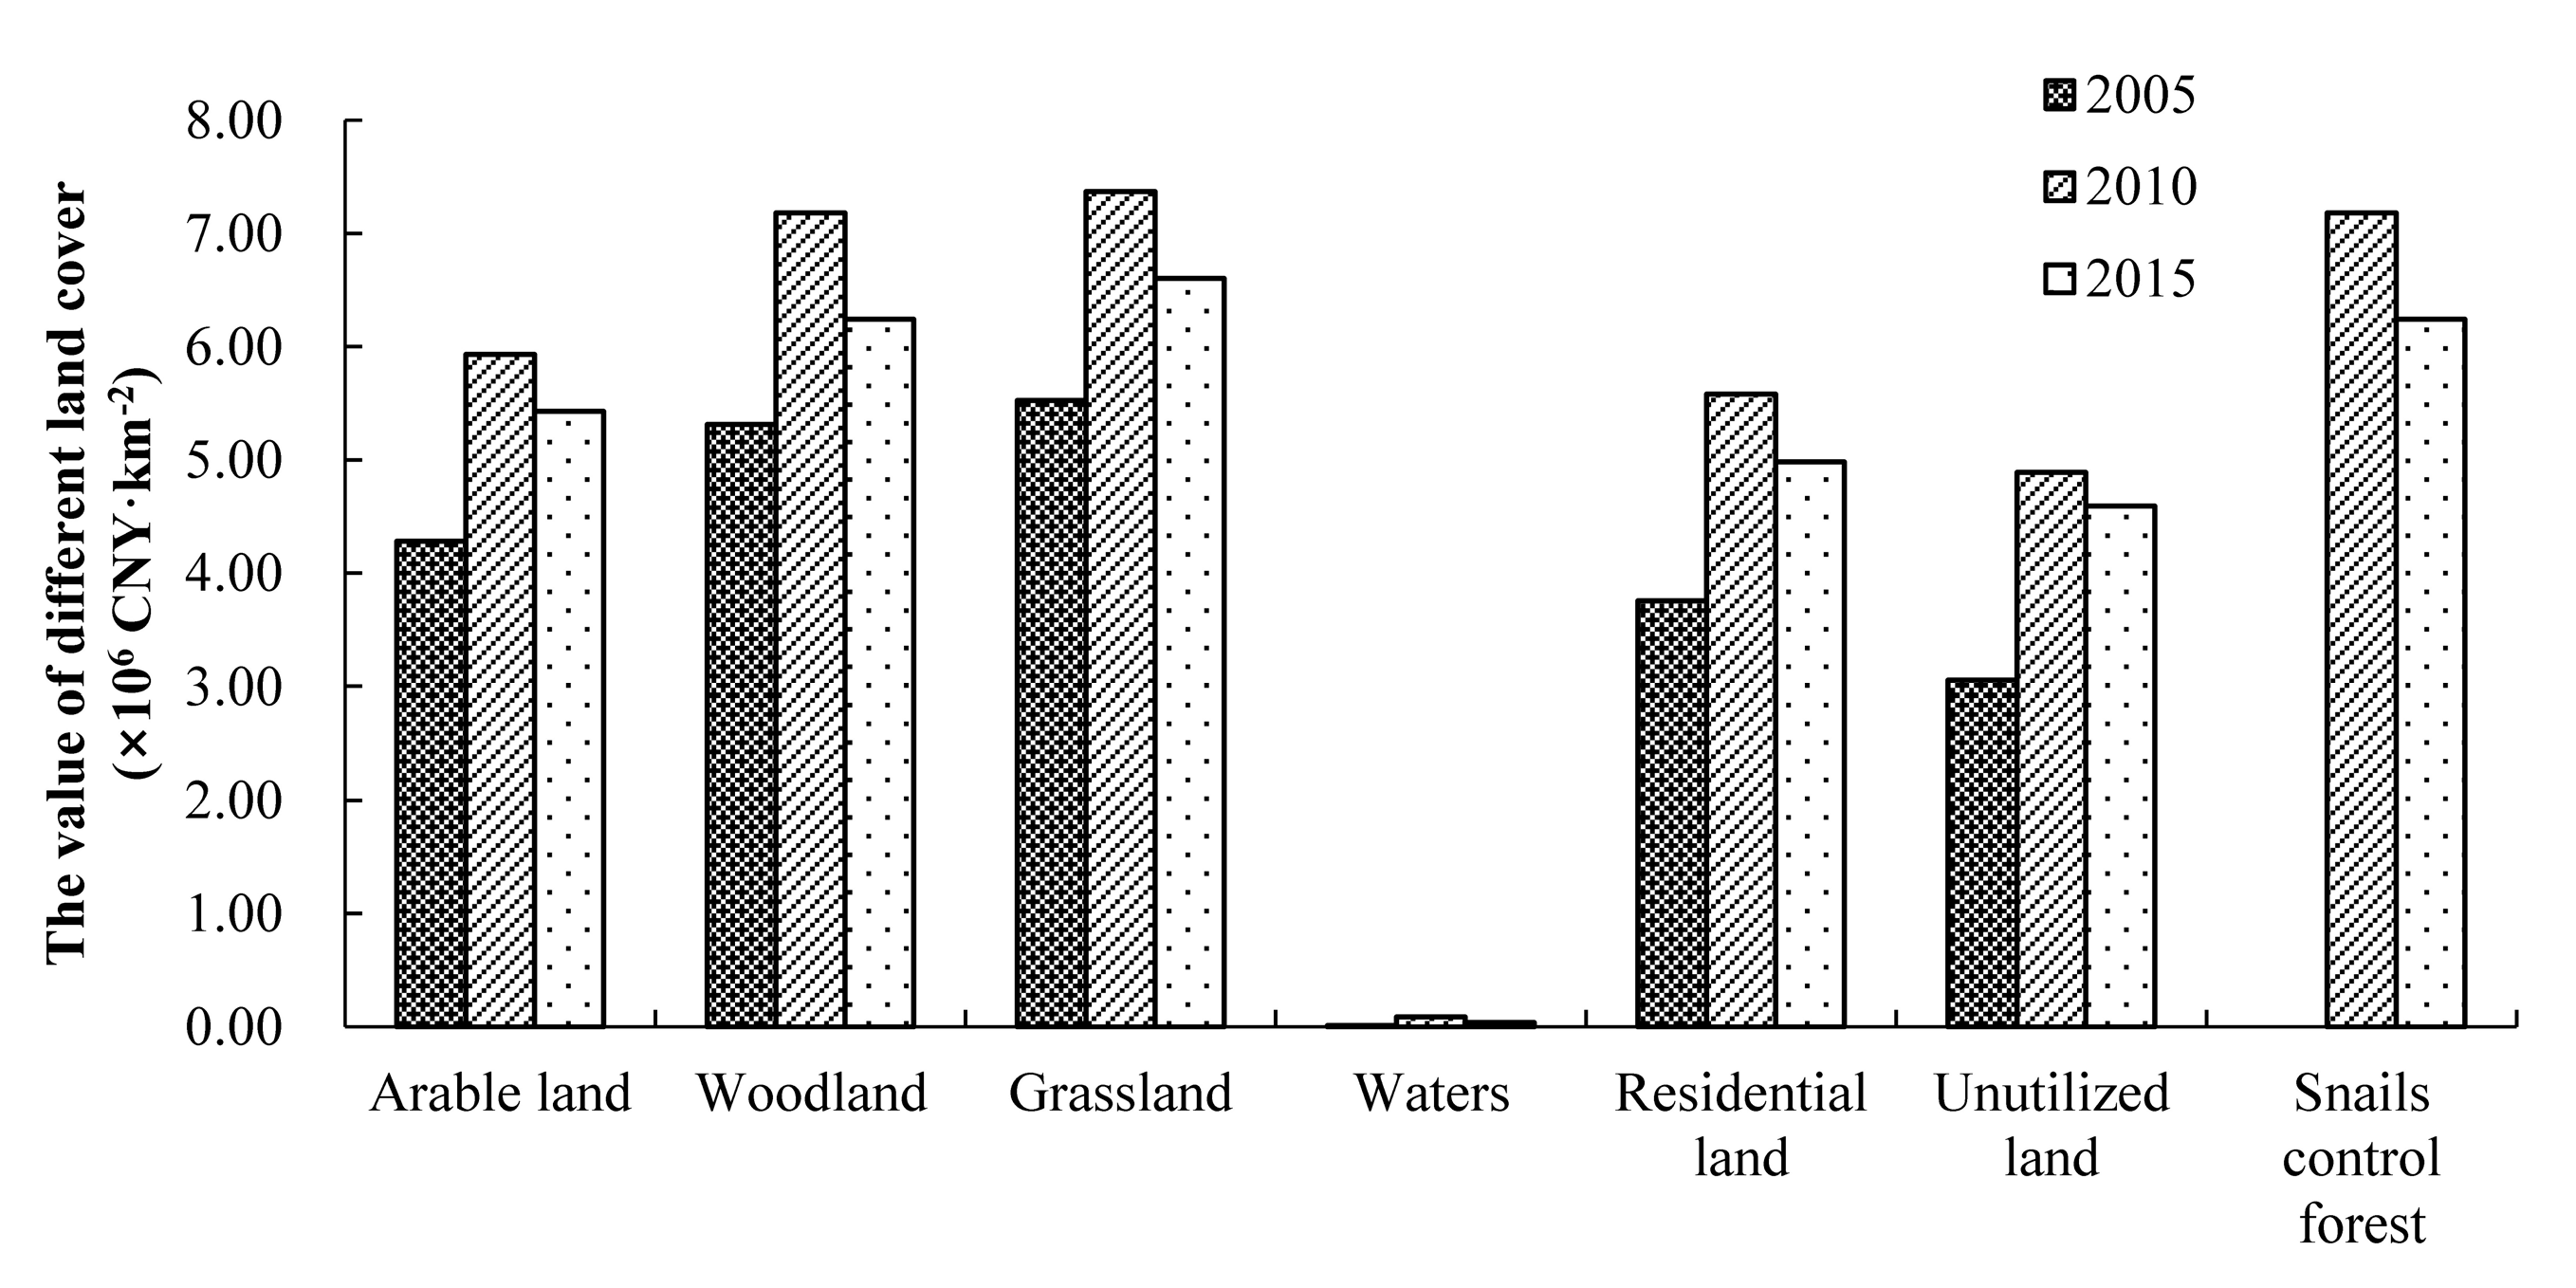
Besides, it was observed that the values of different land use types per km2 followed the order of snail control and schistosomiasis prevention forest > forest (non-snail control and schistosomiasis prevention) > arable land > residential land > unutilized land > water area. This can be seen in Figure 7, where the values per km2 of different land cover types are presented for years 2005, 2010, and 2015.
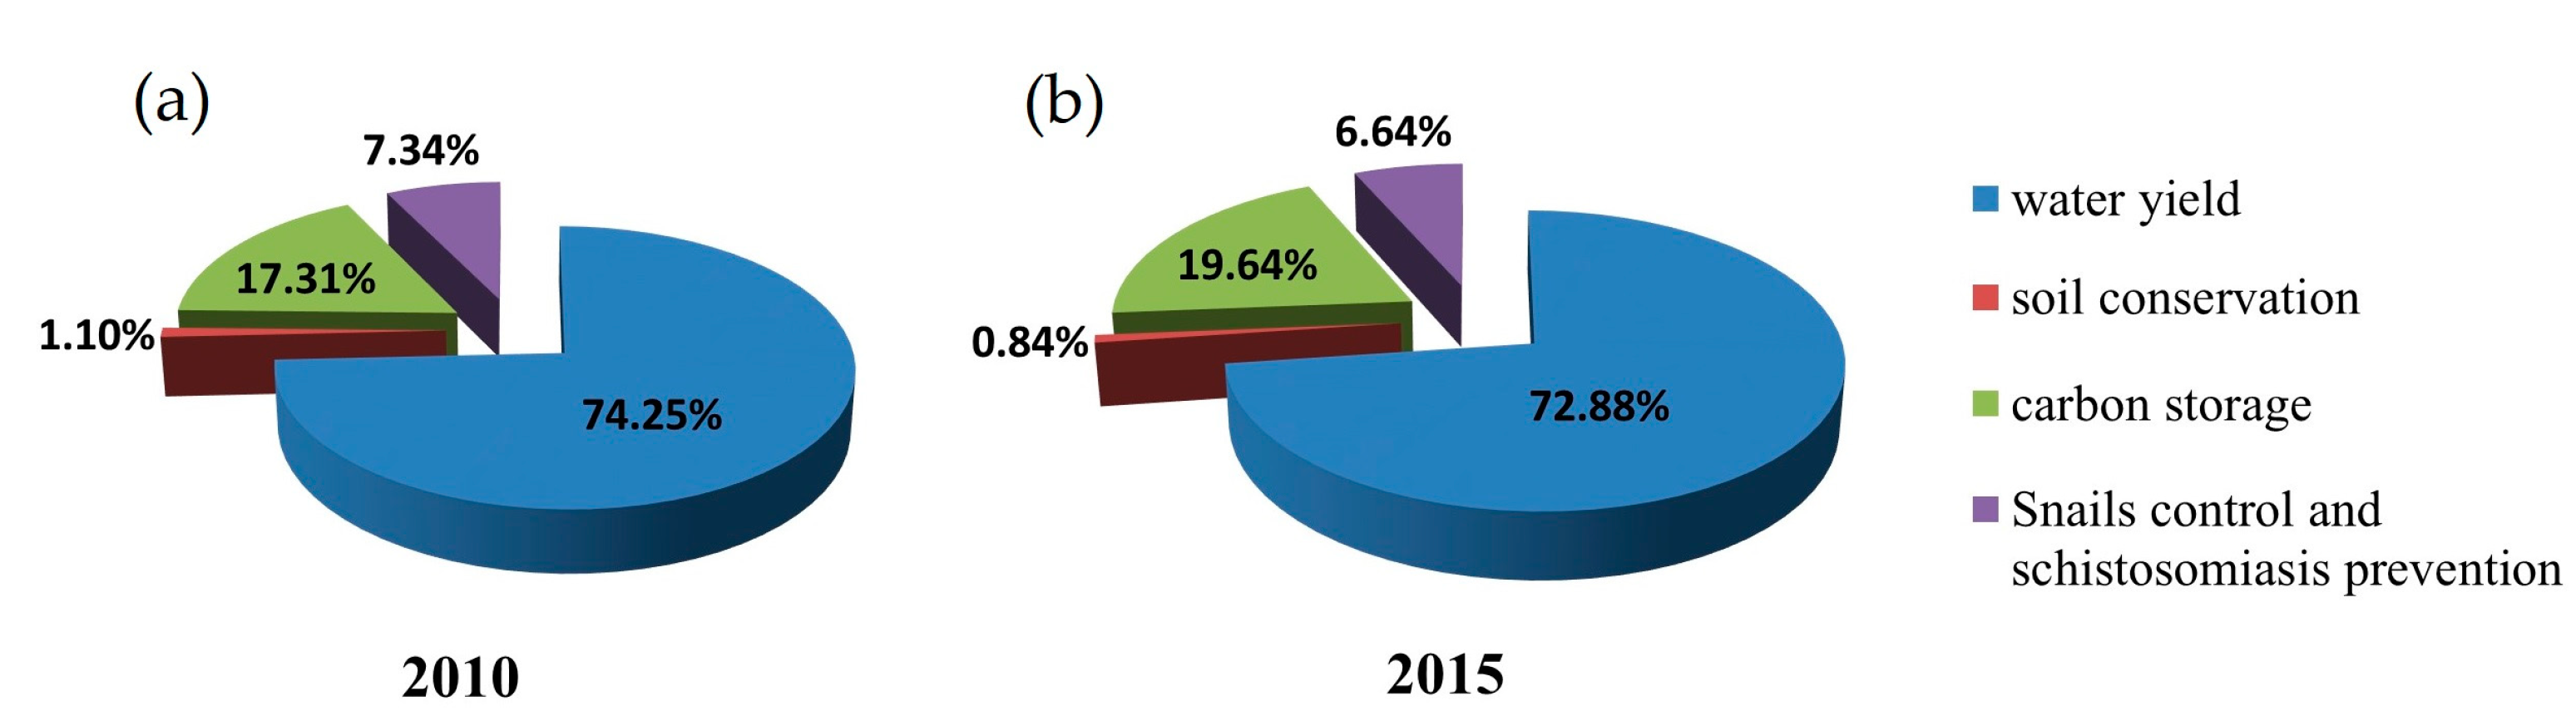
In 2010, the value of the ecosystem service of snail control and schistosomiasis prevention forests in the Dongting Lake Wetland area was 54.33 × 10⁸ CNY, which corresponded to the water yield, soil conservation, carbon storage, and snail control, and schistosomiasis prevention by 74.25%, 1.10%, 17.31%, and 7.34%, respectively. In 2015, this value reached 89.11 × 10⁸ CNY. Only the carbon storage value increased from 2010 to 2015 (by 2.33%), but the value of the other factors reduced, as seen in Figure 8.
5. Discussion
5.1. Factors Affecting the Ecosystem Services
Previous studies have found that land use change, precipitation, evapotranspiration, and rainfall erosivity are the main mechanisms that affect ecosystem services [60]. We have carried out a correlation analysis of the ecosystem services with evapotranspiration, precipitation, soil erodibility, and rainfall erosivity while using Statistical Product and Service Solutions (SPSS) to investigate the effects of such factors in the present study. Table 3 presents the result, where it can be seen that, from 2005 to 2015, the ecosystem services show different degrees of correlation with these factors. Specifically, all of the factors significantly positively influenced water yield, soil conservation, and carbon storage; and, the rainfall erosivity positively influenced the reduced snail area at a moderate degree.
5.2. Selection of Appropriate Evaluation Indexes and Methods
Wetlands provide a variety of ecosystem services. The evaluation indexes of wetland ecosystem services are different due to different characteristics of wetlands. For example, Schallenberg et al. (2013) conducted ecosystem services evaluation on eight lakes in New Zealand, with an area of over 100 km2 including water supply, fish supply, water purification, flood control, lakeside protection, climate regulation, and recreation, and discovered that they were in the trend of degradation [61]. Zhang et al. (2014) calculated the ecological service value of lakes and wetlands in China from three aspects of biodiversity, water quality, and economic indices. The results showed that the values of lake and marsh wetlands ecosystem services accounted for 54.64% of the total value of China’s natural grassland ecosystem services and 30.34% of the total value of forest ecosystem services, respectively [62]. Sun et al. (2017) compared the different results of food security and biodiversity between China’s Poyang Lake and Bangladesh’s Tanguar Haor wetlands and showed that the trends in food security and biodiversity are declining [63]. Wondie (2018) selected nine wetlands in the region of the Lake Tana (Ethiopia) and estimated the value of wetland ecosystem services in terms of supply, regulation, culture, and support services. They showed that the wetland utilization planning, investment intervention, public land ownership, and other policy decision-making supports are poor, thus resulting in a major challenge to the sustainable use of wetland resources [64]. Mao et al. (2007) estimated the value of the ecological services in the Dongting Lake Wetland to be 411.10 × 10⁸ CNY using the market value, shadow engineering, carbon tax, and alternative expenses methods, but without considering the effect of snail control and schistosomiasis prevention forests [40]. We observed that in 2015, this value was 1552 × 108 CNY, and the snail control and schistosomiasis prevention forests had the highest ecosystem service value among the different land use types. This is mainly due to the fact that such forests provide various benefits, such as water yield, soil conservation, and carbon storage. However, more importantly, they control and prevent schistosomiasis, which thereby reduces the cost of snail eradication and schistosomiasis treatment and decreases the income loss of schistosomiasis patients.
In summary, different assessment indicators are adopted for wetlands in different areas, and quite different results are often obtained. It can be concluded that there is no consensus on a singular best approach for the assessment of wetland ecosystem services, but the selection of appropriate assessment indicators and methods for a certain wetland is heavily dependent on the characteristics of the area where the wetland is located.
5.3. Limitation of the Present Study
Our study has some limitations, as follows. (1) This study only evaluated water yield, soil conservation, carbon storage, and snail control and schistosomiasis prevention functions in the evaluation of the ecosystem services of snail control and schistosomiasis prevention forests. However, other ecosystem services, such as the provision of wood and forest products, climate regulation, and air purification, which may have significant effects, were neglected. (2) The dynamic impact of afforestation years on the ecosystem services, such as the difference between an old-growth forest and a newly planted forest, was disregarded.
6. Conclusions
In this study, water yield, soil conservation, carbon storage, and snail control and schistosomiasis prevention were evaluated in the Dongting Lake Wetland area from 2005 to 2015. Their temporal and spatial changes were studied in detail, where different trends and variations were observed. Different land use types also showed various changes in these services. Subsequently, the value of the ecosystem services was estimated, and a total increase of 24.18% was observed over the 10-year period, where the water yield showed the highest value, which accounted for more than 70% of the total value of the four evaluated ecosystem services; while, the value of the snail control and schistosomiasis prevention was about 5% of it. Moreover, through a correlation analysis, it was shown that evapotranspiration, precipitation, soil erodibility, and rainfall erosivity significantly positively influenced some of the ecosystem services in the study area.
There is no singular best approach for the assessment of ecosystem services of wetlands, but the appropriate methods should be selected based on the characteristics of the area where the wetland is located. The potential improvements in the selection of evaluation index system and methods for a similar case to our study include considering the dynamic impact of afforestation years on the ecosystem services and taking the effect of other ecosystem services, such as the provision of wood and forest products, climate regulation, and air purification into account.
Author Contributions
Conceptualization: L.M., R.S., D.P.; methodology, software, validation and writing—original draft preparation: L.M.; writing—review, editing and revision: L.M., E.K., Y.Z., D.P., J.Z., K.Z.; funding acquisition: J.Z.; project administration: J.Z.; supervision: Q.S.
Funding
The National Science and Technology Support Program of China (grant No. 2015BAD07B07), and the National Natural Science Foundation of China (NSFC) (grant No. 41071334) supported this research.
Acknowledgments
We would like to thank Yilin Zhuang for her support and suggestions in the preparation of the manuscript.
Conflicts of Interest
Authors declare there is no conflict of interest.
References
- Ouyang, Z.Y.; Wang, X.K.; Miao, H. A primary study on Chinese terrestrial ecosystem services and their ecological-economic values. Acta Ecol. Sin. 1999, 19, 607–613. (In Chinese) [Google Scholar]
- Costanza, R.; D’Arge, R.; De Groot, R. The value of the world’s ecosystem services and natural capital. World Environ. 1997, 387, 253–260. (In Chinese) [Google Scholar] [CrossRef]
- Millennium Ecosystem Assessment (MEA). Ecosystems and Human Well-Being: Biodiversity Synthesis; Island Press: Washington, DC, USA, 2019. [Google Scholar]
- Li, W.H. Contemporary Ecological Study of China-Volume of Ecosystem Management; Science Press: Beijing, China, 2013. [Google Scholar]
- Wang, H.Q.; Zhang, C.H.; Zou, J.H. The game analysis of the protection of wetland resources. Ecol. Econ. 2011, 235, 174–178. (In Chinese) [Google Scholar]
- Dugan, P. Wetlands in Danger: A World Conservation Atlas; Oxford University Press: New York, NY, USA, 1993. [Google Scholar]
- Rudolf, S.G.; Wilson, M.A.; Boumans, R.J. A typology for the classification, description and valuation of ecosystem functions, goods and services. Ecol. Econ. 2002, 41, 393–408. [Google Scholar]
- Costanza, R.; de Groot, R.; Sutton, P.; Ploeg, S.; Anderson, S.J.; Kubiszewski, I.; Farber, S.; Turner, R.K. Changes in the global value of ecosystem services. Glob. Environ. Chang. 2014, 26, 152–158. [Google Scholar] [CrossRef]
- US Environmental Protection Agency. Great Lakes Restoration Initiative Task Force. In Great Lakes Restoration Initiative Action Plan II Measures Reporting Plan; 2017. Available online: https://www.glri.us/sites/default/files/glri-measures-reporting-plan-20170926-156pp.pdf (accessed on 12 October 2018).
- Wong, C.P.; Jiang, B.; Bohn, T.J. Lake and wetland ecosystem services measuring water storage and local climate regulation. Water Resour. Res. 2017, 53, 3197–3223. [Google Scholar] [CrossRef] [Green Version]
- Bikash, S.; Golam, R.; Nakul, C.; Sharma, B.; Rasul, G.; Chettri, N. The economic value of wetland ecosystem services: Evidence from the Koshi Tappu Wildlife Reserve, Nepal. Ecosyst. Serv. 2015, 12, 84–93. [Google Scholar]
- Simon, G.S.; John, B.; Kate, S. Farmer perceptions of wetlands and waterbodies: Using social metrics as an alternative to ecosystem service valuation. Ecol. Econ. 2016, 126, 58–69. [Google Scholar]
- Dearing, J.A.; Yang, X.; Dong, X. Extending the timescale and range of ecosystem services through paleoenvironmental analyses, exemplified in the lower Yangtze basin. Proc. Natl. Acad. Sci. USA 2012, 109, E1111–E1120. [Google Scholar] [CrossRef] [Green Version]
- Li, C.; Zheng, H.; Li, S. Impacts of conservation and human development policy across stakeholders and Scales. Proc. Natl. Acad. Sci. USA 2015, 112, 7396–7401. [Google Scholar] [CrossRef] [Green Version]
- Li, X.; Yu, X.; Jiang, L.; Li, W.; Liu, Y.; Hou, X. How important are the wetlands in the middle-lower Yangtze River region: An ecosystem service valuation approach. Ecosyst. Serv. 2014, 10, 54–60. [Google Scholar] [CrossRef]
- Xu, M.; Dong, X.; Yang, X. Using palaeolimnological data and historical records to assess long-term dynamics of ecosystem services in typical Yangtze shallow lakes (China). Sci. Total Environ. 2017, 584, 791–802. [Google Scholar] [CrossRef] [PubMed] [Green Version]
- Feng, J.G.; Ding, L.B.; Wang, J.S. Case-based evaluation of forest ecosystem service function in China. Chin. J. Appl. Ecol. 2016, 27, 1375–1382. (In Chinese) [Google Scholar]
- Li, T.; Lü, Y.H. A review on the progress of modeling techniques in ecosystem services. Acta Ecol. Sin. 2018, 38, 5287–5296. [Google Scholar]
- Silvestri, S.; Kershaw, F. Framing the Flow: Innovative Approaches to Understand, Protect and Value Ecosystem Services Across Linked Habitats; Environmental Policy Collection; UNEP World Conservation Monitoring Centre: Cambridge, UK, 2010; pp. 26–33. [Google Scholar]
- Hu, H.T.; Fu, B.J.; Lü, Y.H.; Zheng, Z.M. SAORES: A spatially explicit assessment and optimization tool for regional ecosystem services. Landsc. Ecol. 2015, 30, 547–560. [Google Scholar] [CrossRef] [Green Version]
- Sharp, R.; Tallis, H.T.; Ricketts, T.; Guerry, A.D.; Wood, S.A.; Chaplin-Kramer, R.; Nelson, E.; Ennaanay, D.; Wolny, S.; Olwero, N.; et al. InVEST Version 3.2.0 User’s Guide. The Natural Capital Project. The Nature Conservancy, and World Wildlife Fund; Stanford University: Stanford, CA, USA; University of Minnesota: Minnesota, MN, USA, 2016. [Google Scholar]
- Dai, E.F.; Wang, X.L.; Zhu, J.J.; Zhao, D.S. Methods, tools and research framework of ecosystem service trade-offs. Geogr. Res. 2016, 35, 1005–1016. (In Chinese) [Google Scholar]
- Hoyer, R.; Chang, H. Assessment of freshwater ecosystem services in the Tualatin and Yamhill basins under climate change and urbanization. Appl. Geogr. 2014, 53, 402–416. [Google Scholar] [CrossRef]
- Pessacg, N.; Flaherty, S.; Brandizi, L. Getting water right: A case study in water yield modelling based on precipitation data. Sci. Total Environ. 2015, 537, 225–234. [Google Scholar] [CrossRef]
- Yu, X.X.; Zhou, B.; Lü, X.Z.; Yang, Z.G. Evaluation of water conservation function in mountain forest areas of Beijing based on InVEST model. Sci. Silvae Sin. 2012, 48, 1–5. (In Chinese) [Google Scholar]
- Wilson, M.A.; Carpenter, S.R. Economic Valuation of Freshwater Ecosystem Services in the United States: 1971–1997. Ecol. Appl. 1999, 9, 772. [Google Scholar]
- William, J.M.; James, G.G. Wetlands, 5th ed.; John Wiley & Sons Inc.: Hoboken, NJ, USA, 2015. [Google Scholar]
- Wang, Y. Schistosomiasis epidemic in elation analysis between its prevention and control in China. Chin. Prim. Health Care 2010, 24, 69–72. (In Chinese) [Google Scholar]
- Zhou, X.N.; Bergquist, R.; Leonardo, L. Schistosomiasis japonica control and research needs. Adv. Parasitol. 2010, 72, 145–178. [Google Scholar] [PubMed]
- Steinmann, P.; Keiser, J.; Bos, R. Schistosomiasis and water resources development: Systematic review, meta-analysis, and estimates of people at risk. Lancet Infect. Dis. 2006, 6, 411–425. [Google Scholar] [CrossRef]
- Ma, L.; Yang, X. Ecosystem services of forests for snail control and schistosomiasis prevention in the Yangtze River Basin. J. Zhejiang A F Univ. 2019, 36, 133–140. (In Chinese) [Google Scholar]
- WHO. Resolution WHA 65.21. Elimination of schistosomiasis. In Proceedings of the Sixty-fifth World Health Assembly, Geneva, Switzerland, 21–26 May 2012. [Google Scholar]
- Zhang, L.J.; Shen, D.W. The evolution of schistosomiasis control strategy in China. J. Hubei Univ. Sci. Technol. 2013, 27, 457–460. (In Chinese) [Google Scholar]
- Yang, X.; Zhang, Y.; Sun, Q.X. SWOT analysis on snail control measures applied in the national schistosomiasis control programme in the People’s Republic of China. Infect. Dis. Poverty 2019, 8, 13. [Google Scholar] [CrossRef]
- Liu, Z.C.; He, H.B. Recent advances in control techniques on Oncomelania hupensis in lake and marshland regions. Chin. J. Vector Biol. Control 2015, 26, 537–540. (In Chinese) [Google Scholar]
- Guan, W.; Hong, Q.B. Research progress of control techniques on Oncomelania hupensis. Chin. J. Schist. Control 2017, 29, 246–251. (In Chinese) [Google Scholar]
- Shi, X.D. Research progress of ecological snail extermination technology. J. Trop. Dis. Parasitol. 2018, 16, 117–121. (In Chinese) [Google Scholar]
- Peng, Z.H.; Jiang, Z.H. China’s New Type of Forest Studies on the Snails Control and Schistosomiasis Prevention Forest; China Forestry Press: Beijing, China, 1995. (In Chinese) [Google Scholar]
- Yang, X.; Sun, Q.X. Discussion on strategy of development of forestry schistosomiasis control programs of China in new period. China. J. Schist. Control 2018, 30, 472. [Google Scholar]
- Mao, D.H.; Wu, F.; Li, J.B. Evaluation on Ecosystem Service Value of Dongting Lake Wetland and Ecological Restoration Counter measures. Wetl. Sci. Manag. 2007, 5, 39–44. (In Chinese) [Google Scholar]
- Tang, Y.X.; Wu, M. Effects of Lakeside Plantations on Schistosomiasisi Control. Wetl. Sci. Manag. 2006, 2, 8–13. [Google Scholar]
- Peng, Z.H. Mechanism of Forestry Schistosomiasis-Control Project on Snail Control and Schistosomiasis Prevention. Wetl. Sci. Manag. 2003, 9, 8–10. (In Chinese) [Google Scholar]
- Resource and Environment Data Cloud. Available online: http://www.resdc.cn (accessed on 2 July 2018).
- National Meteorological Information Center. Available online: http://data.cma.cn (accessed on 10 July 2018).
- Geospatial Data Cloud. Available online: http://www.gscloud.cn (accessed on 2 July 2018).
- Cold and Arid Regions Science Data Center at Lanzhou. Available online: http://westdc.westgis.ac.cn (accessed on 15 September 2018).
- Li, K.R.; Wang, S.Q.; Cao, M.K. Carbon storage of vegetation and soil in China. Sci. China 2003, 33, 72–80. (In Chinese) [Google Scholar] [CrossRef]
- Wang, Y.R.; Zhou, J.X.; Zhou, Z.X.; Sun, Q.X. Effects of Different Land Use Patterns under Converting Polders back into Wetlands on Soil Nutrient Pools in the Dongting Lake Region. Resour. Environ. Yangtze Basin 2010, 19, 634–639. (In Chinese) [Google Scholar]
- Tallis, H.T.; Ricketts, T.; Guerry, A.D.; Wood, S.A.; Sharp, R.; Nelson, E.; Ennaanay, D.; Wolny, S.; Olwero, N.; Vigerstol, K.; et al. InVEST 2.2.1 User’s Guide; The Natural Capital Project: Stanford, CA, USA, 2011. [Google Scholar]
- Allen, G.; Pereira, L.S.; Raes, D. Crop Evapotranspiration: Guidelines for Computing Crop Water Requirements; FAO: Rome, Italy, 1998. [Google Scholar]
- Wischmeier, W.H.; Smith, D.D. Rainfall energy and its relationship to soil loss. Trans. Am. Geophys. Union. 1958, 39, 285–291. [Google Scholar] [CrossRef]
- Williams, J.R.; Arnold, J.G. A system of erosion—Sediment yield models. Soil Technol. 1997, 11, 1143–1155. [Google Scholar] [CrossRef]
- Roose, E. Land Husbandry: Components and Strategy; FAO Soils Bulletin: Rome, Italy, 1996. [Google Scholar]
- Renard, K.G.; Foster, G.R.; Weesies, G.A. Predicting Soil Erosion by Water: A Guide to Conservation Planning with the Revised Universal Soil Loss Equation (RUSLE); USDA Agriculture Handbook: Washington, DC, USA, 1997; Volume 703, pp. 1–367. [Google Scholar]
- Jia, F.F. InVEST Model Based Ecosystem Services Evaluation with Case Study on Ganjiang River Basin. Ph.D. Thesis, China University of Geosciences, Beijing, China, 2014. (In Chinese). [Google Scholar]
- Tao, H.Y.; Xia, A.; Zhao, Y.M. Effect and cost-benefit of Oncomelania snail control by plowing and palnting in Jiaobei Beach of Zhengjiang City. Chin. J. Schist. Control 2012, 24, 576–578. (In Chinese) [Google Scholar]
- Hu, B.J.; Zhao, Z.Y.; Xia, M. Study on spatial—Temporal characteristics of Schistosoma japonicum infections among human in Hunan Province, 2004–2011. Chin. J. Schist. Control 2017, 29, 406–411. [Google Scholar]
- Wang, Y.M.; Wang, X.Y.; Su, P.C. Terrospective investigation on the schistosomiasis status in Linli County. J. Trop. Dis. Parasitol. 2016, 14, 204–207. (In Chinese) [Google Scholar]
- Chen, W.W.; Zhang, J.X. Change rules of soil carbon storage in Dongting lake region within 20 years and its influencing factors. J. Hunan Inst. Eng. 2012, 22, 88–94. (In Chinese) [Google Scholar]
- Wang, F.; Zhang, S.L.; Hou, H.P.; Yang, Y.J.; Gong, Y.L. Assessing the Changes of Ecosystem Services in the Nansi Lake Wetland, China. Water 2019, 11, 788. [Google Scholar] [CrossRef] [Green Version]
- Schallenberg, M.; Winton, D.; Verburg, P. Ecosystem services of lakes. In Ecosystem Services in New Zealand: Conditions and Trends; Manaaki Whenua Press: Lincoln, New Zealand, 2013; pp. 203–225. [Google Scholar]
- Zhang, Y.; Zhou, D.; Niu, Z. Valuation of lake and marsh wetlands ecosystem services in China. Chin. Geogr. Sci. 2014, 24, 269–278. [Google Scholar] [CrossRef] [Green Version]
- Sun, C.; Zhen, L.; Miah, M.G. Comparison of the ecosystem services provided by China’s Poyang Lake wetland and Bangladesh’s Tanguar Haor wetland. Ecosyst. Serv. 2017, 26, 411–421. [Google Scholar] [CrossRef]
- Wondie, A. Ecological conditions and ecosystem services of wetlands in the Lake Tana Area, Ethiopia. Ecohydrol. Hydrobiol. 2018, 18, 231–244. [Google Scholar] [CrossRef]
Figure 1.
Geographic location of the study region (a) in China; (b) in the vicinity of Hubei, Hunan and Jiangxi provinces; and (c) elevation map of the study area including Dongting lake.
Figure 1.
Geographic location of the study region (a) in China; (b) in the vicinity of Hubei, Hunan and Jiangxi provinces; and (c) elevation map of the study area including Dongting lake.

Figure 2.
Distribution of changes in the ecosystem services in the Dongting Lake Wetland from 2005 to 2015.
Figure 2.
Distribution of changes in the ecosystem services in the Dongting Lake Wetland from 2005 to 2015.

Figure 3.
Temporal and spatial variations of the reduced snail area from (a) 2005 to 2010; (b) 2010 to 2015; and (c) 2005 to 2015.
Figure 3.
Temporal and spatial variations of the reduced snail area from (a) 2005 to 2010; (b) 2010 to 2015; and (c) 2005 to 2015.

Figure 4.
Temporal and spatial variations of the reduction in the number of schistosomiasis patients from (a) 2005 to 2010; (b) 2010 to 2015; and (c) 2005 to 2015.
Figure 4.
Temporal and spatial variations of the reduction in the number of schistosomiasis patients from (a) 2005 to 2010; (b) 2010 to 2015; and (c) 2005 to 2015.

Figure 5.
Ecosystem services per km2 of different land cover types in the Dongting Lake Wetland from 2005 to 2015: the amounts of (a) water yield; (b) soil conservation; and (c) carbon storage.
Figure 5.
Ecosystem services per km2 of different land cover types in the Dongting Lake Wetland from 2005 to 2015: the amounts of (a) water yield; (b) soil conservation; and (c) carbon storage.

Figure 6.
Values of different ecosystem services of the Dongting Lake Wetland in (a) 2005; (b) 2010; and (c) 2015.
Figure 6.
Values of different ecosystem services of the Dongting Lake Wetland in (a) 2005; (b) 2010; and (c) 2015.

Figure 7.
Values per km2 of different land cover types.

Figure 8.
Values of different ecosystem services of snail control and schistosomiasis prevention forests in the Dongting Lake Wetland area in (a) 2010; and (b) 2015.
Figure 8.
Values of different ecosystem services of snail control and schistosomiasis prevention forests in the Dongting Lake Wetland area in (a) 2010; and (b) 2015.


Table 1.
Land cover types of the Dongting Lake Wetland between 2005 and 2015 (×102 km2).
| Land Use Type | Area | |||
|---|---|---|---|---|
| 2005 | 2010 | 2015 | Change Area | |
| Arable land | 147.69 | 146.02 | 144.55 | −3.14 |
| Woodland | 102.29 | 101.93 | 101.18 | −1.11 |
| Grassland | 3.34 | 2.93 | 2.88 | −0.46 |
| Waters | 48.27 | 48.32 | 45.99 | −2.28 |
| Residential land | 8.99 | 11.01 | 13.24 | 4.24 |
| Unutilized land | 6.85 | 7.25 | 9.64 | 2.80 |
Table 2.
Parameter collection methods.
| The Parameter Name | Content or Price | The Data Source |
|---|---|---|
| Water market transaction price | 4.51 CNY/t (0.64 USD/t) | Circular on issues relating to the standards for the collection of water resources charges of the People’s Republic of China |
| The cost of digging up a unit of soil | 63.44 CNY/m3 (9.01 USD/m3) | The water conservancy construction project budget quota of the ministry of water resources of the People’s Republic of China |
| Carbon price | 48.52 CNY/t (6.89 USD/t) | A Report by Forest Trends’ Ecosystem Market |
| The price of medicine to kill snails | 0.27 CNY/m2 (0.04 USD/m2) | Chinese journal of schistosomiasis control [56] |
| Per capita annual cost of treatment | 3230.7 CNY/yr (458.89 USD/yr) | National Bureau of Statistics |
| The area of the snail control and schistosomiasis prevention forest | — | State forestry administration |
| The snail area and the number of schistosomiasis patients | — | National Bureau of Statistics |
Table 3.
Correlation analysis of ecosystem services and various influencing factors during 2005–2015.
Table 3.
Correlation analysis of ecosystem services and various influencing factors during 2005–2015.
| Ecosystem Services | Influencing Factors | |||
|---|---|---|---|---|
| Evapotranspiration | Precipitation | Soil Erodibility | Rainfall Erosivity | |
| Water yield | 0.931 ** | 0.969 ** | 0.895 ** | 0.954 ** |
| Soil conservation | 0.803 ** | 0.840 ** | 0.841 ** | 0.847 ** |
| Carbon storage | 0.835 ** | 0.828 ** | 0.851 ** | 0.811 ** |
| Reduced snail area | 0.089 | 0.322 | 0.296 | 0.347 ** |
| Reduced patient | −0.008 | −0.05 | −0.023 | −0.073 |
Asterisks indicate significant differences at ** p < 0.01.
© 2019 by the authors. Licensee MDPI, Basel, Switzerland. This article is an open access article distributed under the terms and conditions of the Creative Commons Attribution (CC BY) license (http://creativecommons.org/licenses/by/4.0/).
Share and Cite
MDPI and ACS Style
Ma, L.; Sun, R.; Kazemi, E.; Pang, D.; Zhang, Y.; Sun, Q.; Zhou, J.; Zhang, K. Evaluation of Ecosystem Services in the Dongting Lake Wetland. Water 2019, 11, 2564. https://doi.org/10.3390/w11122564
AMA Style
Ma L, Sun R, Kazemi E, Pang D, Zhang Y, Sun Q, Zhou J, Zhang K. Evaluation of Ecosystem Services in the Dongting Lake Wetland. Water. 2019; 11(12):2564. https://doi.org/10.3390/w11122564
Chicago/Turabian StyleMa, Li, Ruoxiu Sun, Ehsan Kazemi, Danbo Pang, Yi Zhang, Qixiang Sun, Jinxing Zhou, and Kebin Zhang. 2019. "Evaluation of Ecosystem Services in the Dongting Lake Wetland" Water 11, no. 12: 2564. https://doi.org/10.3390/w11122564
Note that from the first issue of 2016, this journal uses article numbers instead of page numbers. See further details here.