Industrially Finished Calves: A Water Footprint-Profitability Paradox


Department of Agricultural Economics, University of the Free State, Bloemfontein 9301, South Africa
*
Author to whom correspondence should be addressed.
Water 2019, 11(12), 2565; https://doi.org/10.3390/w11122565
Submission received: 4 October 2019
/
Revised: 26 November 2019
/
Accepted: 28 November 2019
/
Published: 5 December 2019
(This article belongs to the Special Issue Novel Approaches in Water Productivity)
Abstract
:The feed conversion rate is one of the most important determinants of the water footprint (WF) of beef and is known to vary between different cattle breeds. The objective of this study was to estimate the WF of industrially finished calves of seven different cattle breeds on two different feeding regimes: normal pre-determined feeding period (NPFP) and profit-maximising feeding period (PMFP). Data were collected by finishing 35 calves of each of the seven breeds in a feedlot. Green, blue and grey WFs were estimated for the different feeding regimes, and a feedlot simulation provided the effect of the different feeding regimes on the water footprint, financial margin and the water footprint per rand of margin. The results indicated that the water footprint differed notably between breeds on the same feeding regime, as well as between the feeding regimes. While the PMFP had a 1% higher water footprint per year in a typical feedlot than the NPFP, the financial margin was 33% more, resulting in a 24% decrease in the water footprint per South African rand of margin. The contributions of green, blue and grey water to the total WF were 91.5%, 2.5% and 6%, respectively, irrespective of breed or feeding regime.
1. Introduction
The feedlot sector plays an important role in the beef value chain of many countries. According to Deblitz [1], the global importance of feedlots is increasing, with countries like Argentina and Brazil now following in the footsteps of countries like the USA, Canada, Australia and South Africa. In South Africa, approximately 65% to 75% of all cattle are being marketed through feedlots [2], while the approximate figures for Argentina and Australia are 50% and 33%, respectively [1]. In the case of the USA and Canada, almost all produce beef stems from the feedlot sector [1].
Beef is often criticised by researchers as the animal product with the highest total water footprint (WF). However, there are substantial differences between grazing, mixed and industrial production systems in terms of the WF of a kilogram of beef. The global weighted average ranges between 10,244 L/kg for industrial systems (of which feedlots form part), 15,712 L/kg for mixed systems and 21,829 L/kg for grazing systems [3]. Gerbens-Leenes, Mekonnen and Hoekstra [4] set out to determine which factors influence the WFs of production systems. They found that, although the fractions of concentrates in the feed increased from grazing to industrial systems, the industrial systems used 3.7 times less feed than the grazing systems to produce the same amount of beef, which suggests that the feed conversion ratio (FCR) of an industrial system is better [4]. The combined effect of the increase in concentrate fractions and the decrease in the amount of feed causes the green WF to decrease from grazing to industrial systems, while the blue and grey WFs increase. Mekonnen and Hoekstra [5], Hoekstra [6], Mekonnen and Hoekstra [3], Ridoutt, Sanguansri, Freer and Harper [7], Gerbens-Leenes et al. [4] and Bosire, Ogutu, Said, Krol, De Leeuw and Hoekstra [8] all agreed that the largest part of the WF of beef was contributed by the feed that the animal consumes, and that the FCR was an important factor in the determination of the WF of beef.
Given the importance of the FCR as a determinant of the WF of beef, and the fact that it differs between cattle breeds [9,10,11,12], one method of reducing the WF of beef might be to determine and select the breed type with the lowest FCR. Although various authors have investigated and estimated the WF of beef and made recommendations regarding the importance of feed composition and FCR between the different production systems, very little attention has been given to different breed types [3,4,5,6,7,8,13,14,15]. The results of these aforementioned studies provided estimates of mostly country-level data but did not account for different value chain links, animal traits and production decisions. These results could therefore not be used to formulate policy recommendations regarding the WF of beef production.
Although the possible reduction of the WF through breed selection may contribute to the environmental stewardship of beef production, the economic side should also be sustained. In order to maximise economic returns, the aim of cattle feedlots is to achieve the highest possible weight increase during the shortest period. This is achieved by feeding the weaned calves balanced rations containing energy, proteins, minerals and vitamins, while also administering certain drugs for optimal health and growth hormones (The use of growth hormones is prohibited in certain countries and is therefore not a standard practice in terms of the global feedlot sector.) to further increase weight gain [16]. The profitability of feedlots, however, is usually unstable due to fluctuations in various factors, such as production costs, product prices and the differences in the growth rates of the animals [17]. As a result, Oosthuizen and Maré [17] developed a model to estimate the profit-maximising feeding period (PMFP) for seven different beef cattle breeds. The PMFP model estimates the optimal feeding period, in terms of a given price scenario, to maximise the profit or minimise the loss for the different cattle breeds in a feedlot. The results indicated that the PMFP differed between 15 and 27 weeks, depending on the breed, while the normal pre-determined feeding period (NPFP) for all breeds was 19 weeks in the past [17].
In terms of feedlot finishing, there are two proposed optimisation issues. The one is the WF that should be reduced, and the other is the economic returns that should be sustained. In terms of the WF, it has been proven that the FCR and thus the WF of breeds differ, which suggests that a breed with a lower FCR and thus WF can be selected. In terms of economic returns, the work by Oosthuizen and Maré [17] suggested that the economic returns could be optimised by the PMFP instead of the NPFP. However, the possible effect that either one of the two mentioned strategies may have on the other is arguable.
The objective of this article was therefore to calculate the differences in WF per kilogram of weight gain of feedlot-finished calves from different cattle breeds for the normal pre-determined feeding period (NPFP), as well as the profit-maximising feeding period (PMFP), to estimate the influence of the different feeding periods on the WF of one value chain link, the feedlot. The PMFP and WF of each breed should differ since the feed intake, growth curve and FCR of each breed differ. The influence of the different feeding regimes on the WF was then tested in a feedlot simulation to estimate the differences in the WF, gross financial margin and the WF per South African rand of gross margin (WF/R margin) for a typical feedlot over a period of one year (The US dollar/South African rand exchange rate was $1/R14.71 at the time of the study.). The gross margin is equal to total revenue minus direct allocated costs and represents the economic value created by the feedlot. The WF per rand of margin thus represents the WF of economic value creation.
2. Materials and Methods
The study was conducted through an actual feeding experiment in which 35 calves each of seven breeds were fed in the Liebenbergstroom feedlot owned by the Sernick Group. The final selection in terms of breed types, as well as breeds, is presented in Table 1. It is interesting to note that, although some of the breeds belong to the same species, they are different in terms of breed type and frame size. These differences caused the maturity and other biological factors to differ between the breeds and finally to influence production figures, which had an effect on the WF, as well as on the economic contribution of each breed. The selected breeds were a mix of imported breeds, such as the Angus, Limousin and Simmentaler, an indigenous breed, the Afrikaner, as well as a breed developed in South Africa, the Bonsmara. Although all the selected breeds are not globally renowned, the study set out to indicate that differences did occur between cattle breeds, and not to play off the selected breeds against one another.
The feedlot is situated close to the town of Edenville in the Free State province of South Africa, and at the time had a standing capacity of 8000 cattle. The drinking water for the cattle was supplied from a dam, fed by run-off rainwater, as well as underground water sourced from boreholes, while the feedstuff to make up the feed rations was either produced on the farm (grass hay) or bought from various suppliers.
2.1. Feedlot Data for the Different Breeds
In order to generate the data, five calves of each breed from seven different cattle producers (seven breeds, 49 breeders and 245 calves in total) were collected in a 150 km radius around the feedlot in order to minimise the climate, grazing and adjustment effects. All the animals were treated homogeneously in terms of vaccinations, growth stimulants in the form of hormone implants, and handling. Each breed was fed separately in its pen on three different feed rations, namely starter, grower and finisher. The calves were fed from weighed 50 kg feed bags and, at the end of each day, the remaining feed was cleaned from the troughs and weighed in order to determine the daily feed intake. All the animals were weighed once a week on the same day and at the same time in order to calculate the average daily gain (ADG) and the FCR for each respective breed. In addition, water meters were used to measure the water flow to the water troughs in the pens. The water used for cleaning the troughs was subtracted from the total flow, and the remainder, which included drinking water and evaporation, was used as the amount of drinking water.
The normal pre-determined feeding period (NPFP) used by Liebenbergstroom feedlot is 19 weeks [18]. Weaned calves thus were fed for 19 weeks before being slaughtered, irrespective of the breed of the animal. In order to determine the feeding period at which each respective breed will maximise economic returns, the profit-maximising feeding period (PMFP) was estimated with production economic principles [17]. According to production economics theory, profit is maximised (loss is minimised) at the stage in production when the value of the marginal product (VMP) is equal to the marginal factor cost (MFC) [19]. In order to estimate the PMFP, the VMP was taken as the weekly growth (in kg live weight) of the animal multiplied by the dressing percentage and carcass price, while the MFC was equal to the total variable cost of the feedlot expressed as a price per kilogram of feed.
The growth and feed intake data are presented in Table 2 for the NPFP and PMFP, respectively. (Descriptive statistics of the data are presented in Appendix A, Table A1.). All animals were fed for one feeding period, with the duration of the feeding period depending on whether the NPFP or PMFP practice was used. Since data collection occurred during a single feeding period, and all animals were fed during the same period, it was not necessary to take interseason variability into account. The PMFP was based on a carcass price of R35.00/kg and dressing percentages of 59%, 57%, 60%, 60%, 59%, 62% and 63% for the Brahman, Afrikaner, Bonsmara, Simbra, Angus, Simmentaler and Limousin, respectively, to estimate the VMP. A feed price of R2.55/kg, R2.80/kg and R2.90/kg for Weeks 1 to 5, 6 to 14, and 15 to 30, respectively, was used as the MFC. The reason for the different feed prices is due to the fact that the animals received three different feed rations, known as a starter, grower and finisher, of which the feedstuff and thus price differed.
Although the ADG and FCR of the different breeds were quite close to each other, the PMFP varied substantially between breeds. The data indicated that the Afrikaner should only be fed for a maximum period of 15 weeks (given the specified price scenario), while the Simmentaler took 27 weeks to reach its PMFP. The total amount of feed consumed by each of the respective breeds differed between the breeds in terms of the NPFP, but even more so in terms of the PMFP. The Simmentaler, for example, consumed more than double the amount that the Afrikaner did, but the PMFP was also almost double that of the Afrikaner. The amount of live weight gained by the Simmentaler was also more than double that of the Afrikaner. The higher feed consumption figures for the Simmentaler were thus justified by the high output in terms of growth. The daily drinking and service water usage of the feedlot was measured at an average of 42 L per animal per day, of which the service water was equal to two litres per animal per day.
2.2. Procedure to Determine the Water Footprint of Feedlot-Finished Calves
Various studies using mainly two different approaches, namely the water footprint analysis (WFA) and the life cycle analysis (LCA), have been conducted in the past to assess the WF of beef. The studies based on the WFA approach that focused on beef (or meat including beef) include those by Mekonnen and Hoekstra [3], Gerbens-Leenes et al. [4], Bosire et al. [8] and Pearce [14], while the LCA-based studies that focused on the blue WF of beef (and other meat) include studies by Ridoutt et al. [7], Zonderland-Thomassen et al. [20] and Harding et al. [15].
The conclusion drawn from the literature on the two approaches is that the water stress index (WSI) incorporates the availability of fresh water in a certain region into the LCA, while the WFA sums the total water use for a product, process or country. When the WF of beef for two different geographical locations, with different freshwater availability (WSI) but the same WF (cubic metre (m3)/tonne) for produced feed, is estimated using the WFA and LCA approaches, the WFA will result in the same WF for both regions, while the LCA will estimate a higher blue WF in the region with the higher WSI. In the event where two different production systems in the same geographical location are compared on their WF, the WSI will be the same for both the production systems and will thus not influence the WF of the two production systems.
When the WFs of the same product or process from different geographical locations are compared, the LCA approach should be used. Even though this approach does not include the green and grey WFs and the incorporation of the WSI makes it difficult to distinguish whether the difference in the blue WF between two regions is due to a difference in water use or water scarcity, the approach does suggest the more suitable region for more sustainable production practices. In the event where the products or processes are based in the same geographical location, the WFA approach should be used, as the inclusion of green, blue and grey WFs provides a better distinction between the water use of the products/processes. However, this does not imply that the WFA approach cannot be used to compare different regions, or that the LCA approach cannot be used to compare products from the same region. Since this study was based in one geographical area, the WFA approach was chosen as it reports on a more comprehensive total WF since the green and grey WFs were included.
The WF of feedlot-finished calves is based on three main components of water use, namely the drinking water of the animal, the water embedded in the feed that the animal consumes and the water used for cleaning (service water) [21]. Mekonnen and Hoekstra’s [3,5] calculation frameworks were followed to determine the total WF of feedlot-finished calves, and a distinction was made between the blue WF (consumption of water from surface and groundwater), green WF (evapotranspiration (ET) of rainwater) and grey WF (the volume of freshwater to assimilate the pollution load).
According to Mekonnen and Hoekstra [3], the WF of an animal, in terms of a year (m3/y/animal) or over the lifetime of the animal (m3/animal), is expressed as:
where WFfeed, WFdrink and WFservice represent the total WF related to the feed, drinking water and service water, respectively.
WFAnimal = WFfeed + WFdrink + WFservice,
The same formula was used in this study, but some differences must be considered. The first difference is that the WF in this study was not calculated per animal throughout its lifetime, or per animal per year, but rather per kilogram of live weight added over the period that the animal was fed. This was done as the feeding period is shorter than a year, and because feedlot finishing is only a process step in the lifetime of the animal. The WF per kilogram live weight of the feedlot-finished calves can then be expressed as:
where WFfeed, WFdrink and WFservice represent the WF of the entire feeding group of a specific breed over the feeding period, while WFWCalves and WFFCalves comprise the total live weight of the purchased weaned calves and sold feedlot-finished calves, respectively.
WFkg FFCalf = (WFfeed + WFdrink + WFservice)/(WFWCalves − WFFCalves),
The second difference is that no water was added during the mixing of the feed, and therefore the WFfeed differs slightly from that of [3] and is expressed as:
where Feed[p] represents the total amount of feed ingredient p consumed by the feeding group of a specific breed throughout the feeding period, and WFprod[p] represents the WF of feed ingredient p.
Mekonnen and Hoekstra’s [22] WF data for South Africa were used for all the different feed ingredients in the feed rations, as the feed ingredients stem from wholesalers, and the specific origin of the feed cannot be traced. However, the WF for the grass hay was not available. The grass used in the feeding rations was cut and baled on non-fertilised rain-fed grasslands on the farm, and the WF was estimated using monthly evapotranspiration (ET) data from earth observation/satellite imagery (The ET data were made available from the “Wide-scale Modelling of Water and Water Availability with Earth Observation/Satellite Imagery” project co-funded by the Water Research Commission (WRC) (Project no. K5/2401//4) and the DAFF. The project is being carried out by Stellenbosch University, in partnership with eLEAF®, the Agricultural Research Council (ARC), GeoTerra Image®, and independent consultants.) The ET, according to the satellite imagery data, was 703.87 mm/annum, which calculates to 1.92 mm/day. The grass fields had a total dry matter (DM) production of 3.5 tons/ha/year. The green WF of the grass hay can then be calculated as:
where ET represents the annual evapotranspiration in millimetres and DM the annual dry matter production in tons. The green WF then amounts to 2011 m3/ton DM.
WFGreen = (ET × 10)/DM,
2.3. Assumptions of Feedlot Simulation
The outcomes of the research were tested in a feedlot simulation to determine what the effect of the different feeding regimes would be on a feedlot. The majority of feedlots cannot choose which breed type they would like to finish, as they have to purchase the calves that are on offer in the market.
According to Serfontein [18], the Liebenbergstroom feedlot has a standing capacity of 8000 cattle at any given time. The majority of the cattle in the feedlot stem from the breeds used in this study, and the average composition is Afrikaner 5%, Brahman 8%, Angus 15%, Bonsmara 35%, Simbra 13%, Simmentaler 12% and Limousin 12%.
The feed, growth performance and price data used for the feedlot simulation were the same as the data used for the other analysis in the study. An important factor in the feedlot simulation was the number of cycles of the different breeds that could be fed in one year. If the NPFP was followed, all breeds were fed for 19 weeks, and cycles/year for all the breeds were then 2.74. In the event of the PMFP, however, the breeds were fed for different durations, and the cycles/year would vary between 1.93 and 3.47.
3. Results
The total WF per animal for the different breeds, as well as the WF per kilogram of weight gained in the feedlot, are presented in Table 3 (Appendix A contains the same table (Table A2), with some extra information that was omitted from Table 3.) for the NPFP and PMFP, respectively. There were large variations in the total WF per animal for each breed for the NPFP. The Bonsmara had the highest total WF of 1678 m3/animal, which was 22% more than that of the Afrikaner, which had the lowest total WF of 1306 m3/animal.
In terms of the PMFP, the differences between the breeds were even larger. The Afrikaner still had the lowest total WF/animal, at 1035 m3, but the Simmentaler now had the highest WF/animal, at 2414 m3, which was 64% more than the Afrikaner. The different feeding periods and extra weight gained during the PMFP should also be brought into consideration, however, and therefore the WF/kg weight gained should rather be used for the comparison.
A comparison of the WF/kg weight gained for the NPFP indicated that the Simbra had the lowest WF, at 5956 L/kg, while the Brahman had the highest, at 6602 L/kg, indicating that the latter had a 10% higher WF/kg live weight gained. In terms of the other breeds, the Limousin, Angus, Bonsmara, Simmentaler and Afrikaner gained 4%, 4%, 5%, 6% and 8% higher WFs/kg live weight, respectively, than the Simbra. A comparison of the different breeds in terms of the PMFP showed that both the breeds with the lowest and highest WF/kg live weight gained differed from the data for the NPFP. The PMFP resulted in the Brahman having the lowest WF/kg weight gain, at 6201 L, which was 5% less than the Angus, which had the highest WF/kg weight gained (6523 L). The WF/kg weight gained of the Afrikaner, Bonsmara, Simbra, Limousin and Simmentaler were 1%, 2%, 4%, 4% and 4% higher, respectively, than that of the Brahman.
The total WF/kg live weight gain of the PMFP for the Afrikaner and Brahman was 4% and 6%, respectively, less than for the NPFP, while it was more for all the other breeds. The results thus indicated that, while the total WF/kg live weight gain for the Afrikaner and Brahman was reduced by feeding them according to a profit-maximising objective, the other breeds had a higher total WF/kg weight gain when being fed for the same objective in the specific price scenario. In order to maximise the financial returns from feeding the animals, the WF/kg live weight gained by the Bonsmara, Simmentaler, Limousin, Angus and Simbra increased by 1%, 3%, 5%, 5% and 7%, respectively.
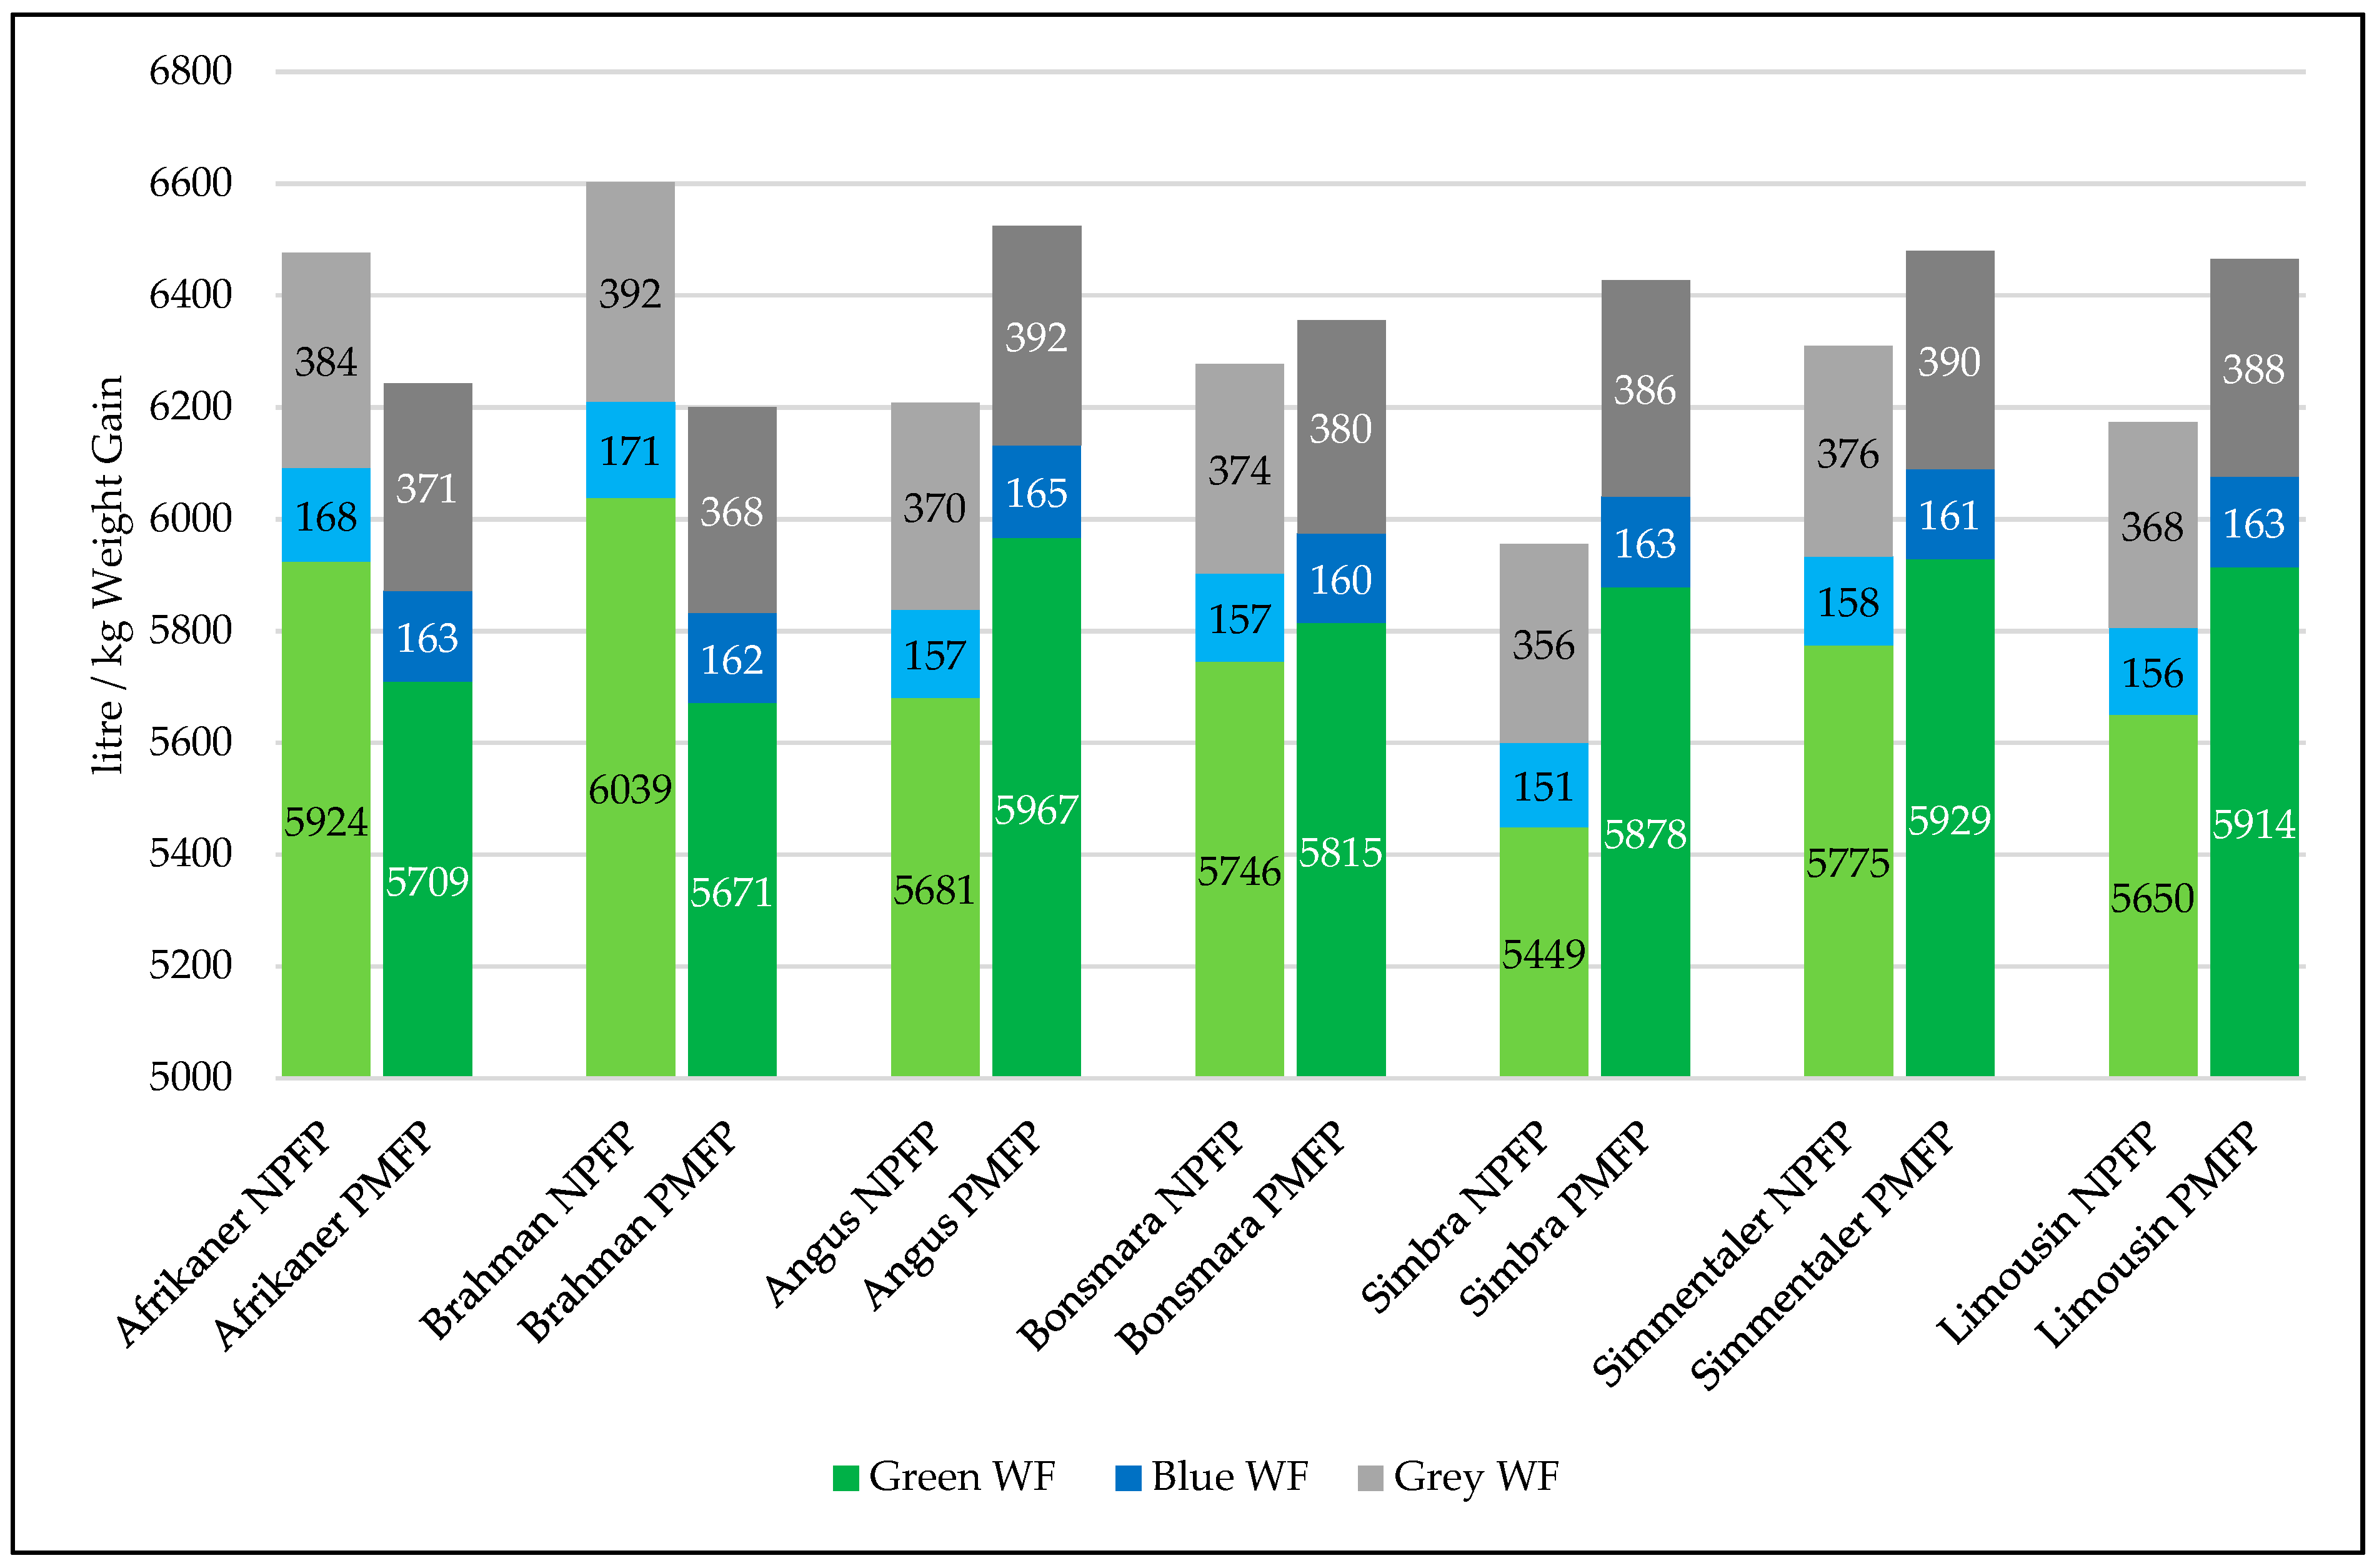
A graphical comparison of the different WF categories (green, blue and grey) for the different breeds and feeding regimes is presented in Figure 1. The graphical comparison made the differences in the total WF, as well as the different categories, between the feeding regimes for the same breed, as well as between breeds, very clear. Although it seems, according to Figure 1, that it was especially the green WF that varied between breeds and feeding regimes, while the blue and green WFs showed very little variation, this was not actually the case.
The proportional contributions of the green, blue and grey WFs to the total WF/kg live weight gain actually remained the same, irrespective of the breed and feeding regime. The contribution of the green, blue and grey WFs to the total WF/kg live weight gain was 91.5%, 2.5% and 6%, respectively, for all the columns in Figure 1. A certain percentage difference in the total WF/kg weight gain between two breeds, or between the two feeding regimes for the same breed, would thus result in the same percentage difference in either one of the respective WF categories.
The results of the feedlot simulation model, which showed the WF, margin and WF/R margin between the two feeding regimes in a typical feedlot like Liebenbergstroom for a year, are shown in Table 4. The largest differences between the two feeding regimes stemmed from the number of cycles of each breed that could be fed within a year. While all the breeds had a throughput of 2.74 cycles/year on the NPFP (19 weeks feeding duration), the PMFP, with its different feeding durations, caused the cycles per year to vary from 1.93 for the Simmentaler to 3.47 for the Afrikaner. When the NPFP and PMFP were compared according to the differences between the two, the total margin for the year, as well as for all the separate breeds, was higher for the PMFP than for the NPFP. This, however, came at an environmental cost, as the total WF for the year also increased in the case of the PMFP, although the WF for two of the breeds decreased. However, the WF/R of margin for the year decreased for all the breeds, as well as for the feedlot as a whole.
Taking a closer look at the differences between the two feeding regimes, it was found that the margin of the PMFP was 33% more than that of the NPFP, creating substantial extra financial benefits for the feedlot. The WF of the PMFP, on the other hand, was only 1% higher than that of the NPFP, and the combined effect of the 33% increase in the margin and the 1% increase in the WF caused the WF/R margin to decrease by 24%. The PMFP might thus come at a slightly higher absolute WF, but it actually enabled the feedlot to reduce the WF of its value creation.
The results of the study indicated that there were notable differences between the total WFs/kg live weight gain of not only the different breeds in the same feeding regime but also between the two feeding regimes for the same breed. Some of the results were also a bit unexpected, as, for example, one would expect the WF/kg live weight gained to be lower for the PMFP than for the NPFP since the animals were fed according to optimising economic returns; however, this was not the case for five of the seven breeds. In order to provide reasons for the received outcome, it was necessary to discuss the results in a broader context, while factors, such as animal traits and the specific economic (price) scenario, were incorporated. The feedlot simulation indicated that, although the absolute WF/year for a typical feedlot would be slightly higher for the PMFP than for the NPFP, the margin or economic returns also increased substantially more and enabled the feedlot to reduce its WF in terms of wealth creation.
4. Discussion
The study set out to estimate whether the PMFP, rather than the NPFP, would positively influence the WF of the different breeds. It must be remembered that, while all the breeds were fed for the same duration of time (19 weeks) according to the NPFP, the feeding duration in terms of the PMFP differed between the breeds, as each was fed according to its optimal profit-realising potential.
A comparison of the results of the WF/kg weight gained from the NPFP and PMFP provided the following observations. The first is that the WF/kg weight gained of the PMFP was more for five of the seven breeds than it was with the NPFP. Considering this, we saw that the WF/kg weight gained of the Afrikaner and the Braham for the PMFP was less than in the case of the NPFP. Both these breeds had PMFPs that were shorter than the NPFP. This led to the question of whether all the breeds should not rather be fed for a shorter duration than the NPFP in order to reduce the WF/kg weight gained. This is not guaranteed to work, however, as was proven by the Bonsmara, of which the PMFP was also shorter than the NPFP but the WF/kg weight gained from the PMFP was higher.
The reason why the Bonsmara reacted differently than the Afrikaner and Brahman might be due to the fact that the FCR not only differed between breeds but also changed with an increase in the age and weight of an animal. Figure 2 provides the weekly FCRs for the Brahman, Simbra and Simmentaler, as well as the Bonsmara, to illustrate the differences.
It is clear from Figure 2 that the FCR did not only differ between the various breeds but also changed as the animals grew older. The FCR for the Brahman, for example, increased much faster than the FCR for the Simbra and Simmentaler. This suggested that the Simbra and Simmentaler were more feed efficient for a longer period than the Brahman. When the FCR for the Bonsmara was compared to the other three breeds, it was clear that the FCR for weeks three to nine was higher than that of the other breeds. The reason for this could be derived from the fact that the Bonsmara calves, at intake, were the heaviest of all the breeds (Table 2). The Bonsmara calves might thus have been a little older than the calves of the other breeds and might have had a higher FCR in the first few weeks of feeding that caused the average FCR over the first 16 weeks to be weaker than that of the Brahman.
The importance of the relationship between FCR and the WF was further highlighted by the fact that the WF/kg live weight gain and the average FCR over the feeding period for both feeding regimes followed the same order of ranking for the different cattle breeds. The breed with the lowest WF/kg weight gain was also the breed with the lowest FCR, and vice versa.
A second observation, when the results of the WF/kg weight gained from the NPFP and PMFP were compared (Table 3), was that the differences between the breeds in terms of the WF/kg weight gained was smaller in the case of the PMFP than in the case of the NPFP. Although the results indicated that profit maximisation would not necessarily help to optimise the WF/kg weight gain, it did assist in making the differences in terms of the WF/kg weight gain smaller between the breeds. This was an indication that the PMFP assisted each breed in reaching its optimal growth potential in order to realise profit and cause the growth potential of the breeds to be closer to one another.
A third observation regarding the WF/kg of live weight gain was that, regardless of the breed that was fed or the feeding regime that was followed, the proportional contributions of the green, blue and grey WFs to the total WF remained the same. It thus could be stated with certainty that the green, blue and grey WFs comprised 91.5%, 2.5% and 6%, respectively, of the total WF of industrially finished calves in the Liebenbergstroom feedlot.
Even though the different breeds, through the PMFP, were treated according to their growth potential, the results of this study indicated that the WF/kg weight gained increased for five of the seven breeds. Is it thus a good idea to feed cattle according to their PMFP? In terms of profitability, the answer is “yes”, but in terms of the WF, the answer is “maybe”, as some breeds in the study benefited, while others did not. The reason for this was the differences in the growth curves of the different breeds, as well as the specific price scenario at the time of the study. Since the cattle are fed until profit is maximised (loss is minimised) in the PMFP, the only determinants of the duration of the feeding period, except for the fixed growth curve for every breed, is the market prices of the inputs (feed and standing costs) and output (fattened calf). As market prices differ, the marginal factor cost and value of the marginal product of the feedlot will change, resulting in a different point in time (week) when they will be equal and profit (loss) will be maximised (minimised). As the price scenario changes, given the fixed growth curve of each breed, the PMFP may sometimes improve (reduce) and other times worsen (increase) the WF.
A feedlot, however, does not have the privilege of choosing the type of breed it wants to feed, or the price scenario in which it will happen. The effect of the two feeding regimes was thus tested in a feedlot simulation with a combination of the different breeds over one year to estimate the margin, WF and WF/R margin of the feedlot. The results showed that, even though the WF of the PMFP would be slightly higher in a typical feedlot situation, the substantial increase in the financial margin of the PMFP and the decrease in the WF/R of margin enabled the feedlot to reduce the WF of its economic wealth creation.
Irrespective of the feeding regime followed, the WF/kg weight gain for the different breeds might seem high, as it ranged between 5956 L/kg and 6602 L/kg. Although it is very difficult to compare these results to the results of other studies, as the scope and goals of the existing studies differ from this one, some comparisons can be made. Two previous studies that specifically estimated the WF of feedlot-finished cattle are by Pearce [14] and Palhares, Morelli and Junior [23].
Pearce [14] estimated the blue, green and grey WFs of beef produced from a South African feedlot with a bottom-up approach, using the total standing numbers of the feedlot and making assumptions regarding feed, growth and slaughter statistics. Palhares et al. [23] estimated the green and blue WFs of 17 different feedlots in Brazil with a bottom-up approach, using the feed, growth and slaughter data of each feedlot. Both mentioned studies, however, expressed the WF in terms of a kilogram of beef, although Pearce [14] estimated it according to carcass weight and Palhares et al. [23] according to boneless beef. The studies did not, however, consider by-products and the associated value fractions and allocated the total WF only to the amount of beef.
Pearce [14] found the WF to be almost 18 million litres/kg carcass, while Palhares et al. [23] found the blue and green WFs of a kilogram of boneless beef to range between 1934 L/kg and 9672 L/kg. The WF results of this study, even though calculated according to kilogram live weight (LW) gain, compared very well to Palhares et al.’s [23] results, while they were only a fraction of the results reported by Pearce [14]. However, when one considers the WF of a kilogram of beef produced in South Africa in other studies (where the whole value chain was considered), such as the studies by Mekonnen and Hoekstra [24], at 17,387 L/kg boneless beef (green, blue, and grey WFs), and Harding et al. [15], at 437 L/kg carcass weight (blue WF only), the results of this study showed the potential to compare well in the whole value chain analysis (VCA). This study, therefore, gave rise to the opinion that there might be some calculation errors in the WF estimated by Pearce [14].
5. Conclusions
The objective of this article was to calculate the differences in the WF per kilogram weight gain of feedlot-finished calves of different cattle breeds for the normal pre-determined feeding period (NPFP), as well as the profit-maximising feeding period (PMFP), to determine the influence of the different feeding periods on the WF. In order to reach the objective, 35 weaned calves of seven different breeds (245 calves in total) were fed in a feedlot until each breed reached the NPFP (19 weeks for all breeds), as well as the PMFP (which varied between 15 and 27 weeks, depending on the breed). The generated growth and feed intake data were used to estimate the WF/kg weight gain of each breed for the two feeding regimes. The results of the study were then used to estimate the effect of the two feeding regimes on a typical feedlot that feeds a combination of the breeds. The results indicated that the WF differed between the two feeding regimes for all the cattle breeds. While some of the breeds had a lower WF in terms of the PMFP compared to the NPFP, the WF of others increased. The objective of the PMFP was to maximise profit in a given price scenario, and no consideration was therefore given to the environmental implications. Economically it thus makes sense to follow the PMFP rather than the NPFP, but in the given price scenario, this was at the cost of the environment, as the WF increased for five of the seven breeds. As market prices change, with an associated change in the feeding period of the PMFP, the difference in the WF between the NPFP and PMFP would also change.
Considering that optimising the feeding period in terms of profitability will not necessarily assist in improving the WF, the question can be asked whether consideration should be given to optimising the feeding period to minimise the WF. The study showed that the breeds that were fed for a shorter duration than the 19 weeks for the NPFP showed an improvement in the WF/kg weight gain. The reason for this was found in the fact that the FCR of all breeds is lower for younger calves, while it increases as the calves grow older. Optimising the feeding period to minimise the WF may thus give rise to the answer that the calves should be slaughtered in the first couple of weeks of feeding, which will result in carcasses that are unacceptable for the market.
This study provided valuable new knowledge as, according to the knowledge of the authors, it was not only the first existing study to apply a bottom-up approach to estimate and compare the WF of different cattle breeds finished in an industrial system, but it also considered two different feeding regimes, viz. NPFP and PMFP. The study showed that there were differences in the WF between breeds and feeding regimes and that the WF of a cattle feedlot was indeed a function of the FCR of the cattle. The results also enabled the conclusion that the green, blue and grey WFs contributed 91.5%, 2.5% and 6%, respectively, to the total WF of industrially finished calves. The large proportional contribution of green water to the total WF shows that industrial feeding systems in South Africa actually use rainwater very effectively and do not rely on blue water as much.
The feedlot simulation showed that, while the PMFP increased the total WF of a feedlot slightly (1%), the increase in the margin (33%) and the ability to decrease the WF of wealth creation (24%) should outweigh the increase in the total WF when it comes to decision-making.
The results of the study could be applied to make recommendations on various levels. It can be recommended that the Liebenbergstroom feedlot, where the data was collected, should rather use the PMFP, as the increase in the financial margin, and the multiplier effects thereof, will enhance both economic and social sustainability. The slight increase in the total WF of the feedlot should be borne in mind, however, but since 91.5% of this WF stems from green water, the impact on the sustainable use of freshwater by the enterprise will be limited.
A second recommendation is for the feedlot industry, since the breed composition, feeding duration and feedstuffs in the feed ration differ between feedlots. It, therefore, is recommended that other feedlots should estimate their WFs and financial returns to come up with the best solution to maximise returns from water use.
Lastly, the outcomes of this study could be applied for policy recommendations in the feedlot industry regarding the WFs of feedlots. Legislation regarding water management in agriculture is currently directed towards the direct use of fresh water, such as irrigation water rights. Even though indirect water use, such as the WF concept, has been applied as a water-use quantification method for several already, no policy yet exists for this concept and the use thereof for sustainable water management. There is certainly nothing wrong with policies directing the direct use of freshwater, but since it does not account for all the water consumed to manufacture a product, it cannot really be applied to assist in ensuring sustainable water use. Although there are differences between feedlots, the bottom-up approach used in this study has provided very accurate outcomes on the WFs of different cattle breeds and feeding regimes. These results are ideal for initiating the development of a benchmark system, with acceptable WF ranges, in order to ensure the environmental sustainability of a feedlot. In the event that the WF of a feedlot is higher than what the environment can sustain, the feedlot should be penalised in the form of taxes or fines until the WF of the operation is back within the acceptable sustainable ranges.
Author Contributions
Conceptualisation, F.A.M. and H.J.; methodology, F.A.M.; formal analysis, F.A.M.; data curation, F.A.M.; writing—original draft preparation, F.A.M.; writing—review and editing, F.A.M and H.J.; supervision, H.J.; funding acquisition, F.A.M. and H.J.
Funding
This research was funded by the Water Research Commission, project number K5/2397//4, and by the Sernick Group.
Conflicts of Interest
The authors declare no conflict of interest.
Appendix A. Additional Tables

Table A1.
Descriptive statistics for growth and feed conversion data.
| Weaning Weight | Normal Pre-Determined Feeding Period (NPFP) | Profit-Maximizing Feeding Period (PMFP) | ||||||||
|---|---|---|---|---|---|---|---|---|---|---|
| N = Animals | Minimum | Maximum | Mean | Std. Deviation | N = Animals | Minimum | Maximum | Mean | Std. Deviation | |
| Afrikaner (kg) | 35 | 158 | 266 | 210 | 22.99 | 35 | 158 | 266 | 210 | 22.99 |
| Brahman (kg) | 35 | 188 | 290 | 232 | 26.51 | 35 | 188 | 290 | 232 | 26.51 |
| Angus (kg) | 35 | 174 | 274 | 227 | 26.49 | 35 | 174 | 274 | 227 | 26.49 |
| Bonsmara (kg) | 35 | 192 | 290 | 250 | 25.23 | 35 | 192 | 290 | 250 | 25.23 |
| Simbra (kg) | 35 | 178 | 296 | 231 | 28.32 | 35 | 178 | 296 | 231 | 28.32 |
| Simmentaler (kg) | 35 | 176 | 278 | 222 | 28.17 | 35 | 176 | 278 | 222 | 28.17 |
| Limousin (kg) | 35 | 194 | 284 | 243 | 18.84 | 35 | 194 | 284 | 243 | 18.84 |
| Live end weight | N = Animals | Minimum | Maximum | Mean | Std. Deviation | N = Animals | Minimum | Maximum | Mean | Std. Deviation |
| Afrikaner (kg) | 24 | 342 | 470 | 412 | 31.03 | 34 | 314 | 418 | 376 | 28.69 |
| Brahman (kg) | 34 | 354 | 522 | 433 | 39.39 | 34 | 336 | 482 | 409 | 36.89 |
| Angus (kg) | 33 | 358 | 556 | 474 | 56.09 | 9 | 448 | 588 | 506 | 49.90 |
| Bonsmara (kg) | 24 | 428 | 592 | 517 | 49.01 | 35 | 392 | 582 | 472 | 47.52 |
| Simbra (kg) | 33 | 384 | 572 | 482 | 44.83 | 22 | 402 | 574 | 493 | 43.28 |
| Simmentaler (kg) | 35 | 416 | 566 | 485 | 41.48 | 25 | 510 | 684 | 594 | 47.84 |
| Limousin (kg) | 35 | 434 | 554 | 494 | 28.75 | 15 | 510 | 592 | 575 | 26.65 |
| ADG | N = Days | Minimum | Maximum | Mean | Std. Deviation | N = Days | Minimum | Maximum | Mean | Std. Deviation |
| Afrikaner (kg) | 133 | 1.10 | 2.34 | 1.52 | 0.34 | 105 | 1.10 | 2.34 | 1.58 | 0.34 |
| Brahman (kg) | 133 | 0.53 | 2.37 | 1.51 | 0.56 | 112 | 0.53 | 2.37 | 1.58 | 0.49 |
| Angus (kg) | 133 | 0.68 | 3.37 | 1.86 | 0.63 | 154 | 0.68 | 3.37 | 1.81 | 0.59 |
| Bonsmara (kg) | 133 | 0.79 | 2.81 | 2.01 | 0.55 | 112 | 0.79 | 2.81 | 1.98 | 0.55 |
| Simbra (kg) | 133 | 0.64 | 2.71 | 1.89 | 0.52 | 147 | 0.64 | 2.71 | 1.78 | 0.60 |
| Simmentaler (kg) | 133 | 0.60 | 3.52 | 1.98 | 0.75 | 189 | 0.16 | 3.52 | 1.97 | 0.76 |
| Limousin (kg) | 133 | 0.49 | 3.22 | 1.89 | 0.76 | 182 | 0.49 | 3.22 | 1.82 | 0.74 |
| FCR | N = Days | Minimum | Maximum | Mean | Std. Deviation | N = Days | Minimum | Maximum | Mean | Std. Deviation |
| Afrikaner (kg) | 133 | 4.87 | 9.04 | 5.51 | 1.18 | 105 | 4.87 | 6.72 | 5.32 | 0.48 |
| Brahman (kg) | 133 | 3.86 | 9.17 | 5.61 | 1.31 | 112 | 3.86 | 6.47 | 5.28 | 0.74 |
| Angus (kg) | 133 | 3.56 | 6.31 | 5.28 | 0.75 | 154 | 3.56 | 7.04 | 5.56 | 0.86 |
| Bonsmara (kg) | 133 | 3.49 | 9.30 | 5.34 | 1.34 | 112 | 3.49 | 6.43 | 5.42 | 0.67 |
| Simbra (kg) | 133 | 4.24 | 6.62 | 5.07 | 0.67 | 147 | 4.24 | 6.62 | 5.47 | 0.71 |
| Simmentaler (kg) | 133 | 3.97 | 6.11 | 5.37 | 0.66 | 189 | 3.97 | 6.86 | 5.52 | 0.87 |
| Limousin (kg) | 133 | 3.91 | 6.39 | 5.25 | 0.68 | 182 | 3.91 | 7.59 | 5.50 | 0.94 |
Table A2.
The water footprint of feedlot-finished calves for the different breeds and feeding periods.
Table A2.
The water footprint of feedlot-finished calves for the different breeds and feeding periods.
| Afrikaner | Brahman | Angus | Bonsmara | Simbra | Simmentaler | Limousin | |
|---|---|---|---|---|---|---|---|
| Normal pre-determined feeding period (NPFP) | |||||||
| Feeding period (Weeks) | 19 | 19 | 19 | 19 | 19 | 19 | 19 |
| Feed green WF/animal (m3) | 1194 | 1212 | 1404 | 1536 | 1368 | 1521 | 1417 |
| Feed blue WF/animal (m3) | 28 | 29 | 33 | 36 | 32 | 36 | 34 |
| Feed grey WF/animal (m3) | 78 | 79 | 92 | 100 | 89 | 99 | 92 |
| Drinking water blue WF/animal (m3) | 5 | 5 | 5 | 5 | 5 | 5 | 5 |
| Service water blue WF/animal (m3) | 0.3 | 0.3 | 0.3 | 0.3 | 0.3 | 0.3 | 0.3 |
| Total WF/animal (m3) | 1306 | 1325 | 1534 | 1678 | 1496 | 1662 | 1548 |
| Total green WF/animal (m3) | 1194 | 1212 | 1404 | 1536 | 1368 | 1521 | 1417 |
| Total blue WF/animal (m3) | 34 | 34 | 39 | 42 | 38 | 42 | 39 |
| Total grey WF/animal (m3) | 78 | 79 | 92 | 100 | 89 | 99 | 92 |
| Weight gained/animal (kg) | 202 | 201 | 247 | 267 | 251 | 263 | 251 |
| WF/kg weight gained (litre) | 6476 | 6602 | 6208 | 6277 | 5956 | 6309 | 6174 |
| Green WF/kg (litre) | 5924 | 6039 | 5681 | 5746 | 5449 | 5775 | 5650 |
| Blue WF/kg (litre) | 168 | 171 | 157 | 157 | 151 | 158 | 156 |
| Grey WF/kg (litre) | 384 | 392 | 370 | 374 | 356 | 376 | 368 |
| Profit-maximizing feeding period (PMFP) | |||||||
| Feeding period (Weeks) | 15 | 16 | 22 | 16 | 21 | 27 | 26 |
| Feed green WF/animal (m3) | 947 | 1004 | 1666 | 1290 | 1538 | 2208 | 1964 |
| Feed blue WF/animal (m3) | 23 | 24 | 39 | 31 | 36 | 52 | 46 |
| Feed grey WF/animal (m3) | 62 | 65 | 109 | 84 | 101 | 145 | 129 |
| Drinking water blue WF/animal (m3) | 4 | 4 | 6 | 4 | 6 | 8 | 7 |
| Service water blue WF/animal (m3) | 0.2 | 0.2 | 0.3 | 0.2 | 0.3 | 0.4 | 0.4 |
| Total WF/animal (m3) | 1036 | 1097 | 1822 | 1409 | 1682 | 2413 | 2147 |
| Total green WF/animal (m3) | 947 | 1004 | 1666 | 1290 | 1538 | 2208 | 1964 |
| Total blue WF/animal (m3) | 27 | 29 | 46 | 35 | 43 | 60 | 54 |
| Total grey WF/animal (m3) | 62 | 65 | 109 | 84 | 101 | 145 | 129 |
| Weight gained/animal (kg) | 166 | 177 | 279 | 222 | 262 | 372 | 332 |
| WF/kg weight gained (litre) | 6242 | 6201 | 6523 | 6354 | 6427 | 6481 | 6465 |
| Green WF/kg (litre) | 5709 | 5671 | 5967 | 5815 | 5878 | 5929 | 5914 |
| Blue WF/kg (litre) | 163 | 162 | 165 | 160 | 163 | 161 | 163 |
| Grey WF/kg (litre) | 371 | 368 | 392 | 380 | 386 | 390 | 388 |
Source: Own calculations.
References
- Deblitz, C. Feedlots: A New Tendency in Global Beef Production. Agri Benchmark, Beef and Sheep Network, Working Paper 2/2011, Updated July 2012. Available online: https://literatur.thuenen.de/digbib_extern/dn054620.pdf (accessed on 25 September 2018).
- Department of Agriculture, Forestry and Fisheries (DAFF). A Profile of the South African Beef Market Value Chain. 2014. Available online: https://www.saiia.org.za/wp-content/uploads/2016/06/002-Beef-market-value-chain-profile-2014.pdf (accessed on 21 May 2016).
- Mekonnen, M.M.; Hoekstra, A.Y. A global assessment of the water footprint of farm animal products. Ecosystems 2015, 15, 401–415. [Google Scholar] [CrossRef] [Green Version]
- Gerbens-Leenes, P.W.; Mekonnen, M.M.; Hoekstra, A.Y. The water footprint of poultry, pork and beef: A comparative study in different countries and production systems. Water Resour. Ind. 2013, 1–2, 25–36. [Google Scholar] [CrossRef] [Green Version]
- Mekonnen, M.M.; Hoekstra, A.Y. The Green, Blue and Grey Water Footprint of Farm Animals and Animal Products; Volume 1: Main report; Value of Water Research Report Series No. 48; UNESCO-IHE Institute for Water Education: Delft, The Netherlands, 2010. [Google Scholar]
- Hoekstra, A.Y. The hidden water resource use behind meat and dairy. Anim. Front. 2012, 2, 3–8. [Google Scholar] [CrossRef]
- Ridoutt, B.G.; Sanguansri, P.; Freer, M.; Harper, G.S. Water footprint of livestock: Comparison of six geographically defined beef production systems. Int. J. Life Cycle Assess. 2012, 17, 165–175. [Google Scholar] [CrossRef]
- Bosire, D.K.; Ogutu, J.O.; Said, M.Y.; Krol, M.S.; De Leeuw, J.; Hoekstra, A.Y. Trends and spatial variation in water and land footprints of meat and milk production systems in Kenya. Agric. Ecosyst. Environ. 2015, 205, 36–47. [Google Scholar] [CrossRef]
- Koch, R.M.; Swiger, L.A.; Chambers, D.; Gregory, K.E. Efficiency of feed use in beef cattle. J. Anim. Sci. 1963, 22, 486–494. [Google Scholar] [CrossRef]
- Archer, J.A.; Bergh, L. Duration of performance tests for growth rate, feed intake and feed efficiency in four biological types of beef cattle. Livest. Prod. Sci. 2000, 65, 47–55. [Google Scholar] [CrossRef]
- Strydom, P.E.; Frylinck, L.; Van der Westhuizen, J.; Burrow, H.M. Growth performance, feed efficiency and carcass and meat quality of tropically adapted breed types from different farming systems in South Africa. Aust. J. Exp. Agric. 2008, 48, 599–607. [Google Scholar] [CrossRef]
- Crowley, J.J.; McGee, M.; Kenny, D.A.; Crews, D.H.; Evans, R.D.; Berry, D.P. Phenotypic and genetic parameters for different measures of feed efficiency in different breeds of Irish performance-tested beef bulls. J. Anim. Sci. 2010, 88, 885–894. [Google Scholar] [CrossRef] [PubMed]
- Ercin, A.E.; Aldaya, M.M.; Hoekstra, A.Y. The water footprint of soy milk and soy burger and equivalent animal products. Ecol. Indic. 2012, 18, 392–402. [Google Scholar] [CrossRef] [Green Version]
- Pearce, L. Applying Water Footprint Assessment with the Aim of Achieving Sustainable Water Resource Management at a Large Commercial Beef Cattle Feedlot in Gauteng Province. Master’s Thesis, University of Cape Town, Cape Town, South Africa, 2016. [Google Scholar]
- Harding, G.; Courtney, C.; Russo, V. When geography matters: A location-adjusted blue water footprint of commercial beef in South Africa. J. Clean. Prod. 2017, 151, 494–508. [Google Scholar] [CrossRef]
- Spies, D.S. Analysis and Quantification of the South African Red Meat Value Chain. Ph.D. Thesis, University of the Free State, Bloemfontein, South Africa, 2011. [Google Scholar]
- Oosthuizen, P.L.; Maré, F.A. The profit-maximizing feeding period for different breeds of beef cattle. Agrekon 2018, 57, 108–120. [Google Scholar] [CrossRef]
- Serfontein, N.; (Owner and managing director of the Sernick Group, Edenville, South Africa). Personal communication, 2015.
- Drummond, H.E.; Goodwin, J.W. Agricultural Economics, 3rd ed.; Pearson Publishers: New York, NY, USA, 2011. [Google Scholar]
- Zonderland-Thomassen, M.A.; Lieffering, M.; Ledgard, S.F. Water footprint of beef cattle and sheep produced in New Zealand: Water scarcity and eutrophication impacts. J. Clean. Prod. 2014, 73, 253–262. [Google Scholar] [CrossRef]
- Chapagain, A.K.; Hoekstra, A.Y. Virtual Water Flows between Nations in Relation to Trade in Livestock and Livestock Products; Value of Water Research Report Series No. 13; UNESCO-IHE Institute for Water Education: Delft, The Netherlands, 2003. [Google Scholar]
- Mekonnen, M.M.; Hoekstra, A.Y. The Green, Blue and Grey Water Footprint of Crops and Derived Crop Products; Volume 2: Appendices; Value of Water Research Report Series No. 47; UNESCO-IHE Institute for Water Education: Delft, The Netherlands, 2010. [Google Scholar]
- Palhares, J.C.P.; Morelli, M.; Junior, C.C. Impact of roughage-concentrate ratio on the water footprints of beef feedlots. Agric. Syst. 2017, 155, 126–135. [Google Scholar] [CrossRef] [Green Version]
- Mekonnen, M.M.; Hoekstra, A.Y. The Green, Blue and Grey Water Footprint of Farm Animals and Animal Products; Volume 2: Appendices; Value of Water Research Report Series No. 48; UNESCO-IHE Institute for Water Education: Delft, The Netherlands, 2010. [Google Scholar]
Figure 1.
Green, blue and grey WFs (water footprints) in litre/kg weight gain of the different breeds and feeding regimes. Source: Own calculations.
Figure 1.
Green, blue and grey WFs (water footprints) in litre/kg weight gain of the different breeds and feeding regimes. Source: Own calculations.

Figure 2.
Weekly feed conversion ratios for four of the breeds. Source: Own calculations.

Table 1.
Breed type, breed, species and frame size of the animals used in this study.
| Breed Type | Breed | Species | Frame Size |
|---|---|---|---|
| Sanga | Afrikaner | Bos taurus africanus | Small |
| Sanga derived | Bonsmara | Bos taurus africanus | Medium |
| Zebu | Brahman | Bos indicus | Medium |
| Zebu derived | Simbra | Bos taurus indicus | Medium |
| British | Angus | Bos taurus | Medium |
| European—dual purpose | Simmentaler | Bos taurus | Large |
| European—lean meat | Limousin | Bos taurus | Large |
Source: Oosthuizen and Maré [17].
Table 2.
Feedlot growth and feed intake data for the different breeds and feeding periods.
| Afrika-Ner | Brah-Man | Angus | Bons-Mara | Simbra | Simmen-Taler | Limou-Sin | |
|---|---|---|---|---|---|---|---|
| Normal Pre-determined Feeding Period (NPFP) | |||||||
| NPFP weaning weight (kg) | 210 | 232 | 227 | 250 | 231 | 222 | 243 |
| NPFP feeding period (weeks) | 19 | 19 | 19 | 19 | 19 | 19 | 19 |
| NPFP total feed intake (kg) | 1111 | 1127 | 1306 | 1428 | 1273 | 1415 | 1317 |
| Starter intake (kg) | 144 | 143 | 143 | 162 | 132 | 153 | 153 |
| Grower intake (kg) | 836 | 866 | 987 | 1101 | 981 | 1087 | 1017 |
| Finisher intake (kg) | 130 | 117 | 176 | 166 | 160 | 175 | 147 |
| NPFP daily feed intake (kg) | 8.4 | 8.5 | 9.8 | 10.7 | 9.6 | 10.6 | 9.9 |
| NPFP live end weight (kg) | 412 | 433 | 474 | 517 | 482 | 485 | 494 |
| NPFP ADG (kg) | 1.52 | 1.51 | 1.86 | 2.01 | 1.89 | 1.98 | 1.89 |
| NPFP FCR (kg) | 5.51 | 5.61 | 5.28 | 5.34 | 5.07 | 5.37 | 5.25 |
| Profit-Maximising Feeding Period (PMFP) | |||||||
| PMFP weaning weight (kg) | 210 | 232 | 227 | 250 | 231 | 222 | 243 |
| PMFP feeding period (weeks) | 15 | 16 | 22 | 16 | 21 | 27 | 26 |
| PMFP total feed intake (kg) | 883 | 935 | 1552 | 1202 | 1433 | 2055 | 1828 |
| Starter intake (kg) | 144 | 143 | 143 | 162 | 132 | 153 | 153 |
| Grower intake (kg) | 478 | 557 | 1057 | 707 | 981 | 1553 | 1381 |
| Finisher intake (kg) | 260 | 235 | 352 | 332 | 319 | 349 | 295 |
| PMFP daily feed intake (kg) | 8.4 | 8.3 | 10.1 | 10.7 | 9.7 | 10.9 | 10 |
| PMFP live end weight (kg) | 376 | 409 | 506 | 472 | 493 | 594 | 575 |
| PMFP ADG (kg) | 1.58 | 1.58 | 1.81 | 1.98 | 1.78 | 1.97 | 1.82 |
| PMFP FCR (kg) | 5.32 | 5.28 | 5.56 | 5.42 | 5.47 | 5.52 | 5.50 |
Source: Own data. ADG: average daily gain; FCR: feed conversion ratio.
Table 3.
The water footprint of feedlot-finished calves for the different breeds and feeding periods.
Table 3.
The water footprint of feedlot-finished calves for the different breeds and feeding periods.
| Afrikaner | Brah-Man | Angus | Bons-Mara | Simbra | Simmen-Taler | Limou-Sin | |
|---|---|---|---|---|---|---|---|
| Normal Pre-determined Feeding Period (NPFP) | |||||||
| Total WF/animal (m3) | 1306 | 1325 | 1534 | 1678 | 1496 | 1662 | 1548 |
| Weight gained/animal (kg) | 202 | 201 | 247 | 267 | 251 | 263 | 251 |
| WF/kg weight gained (litre) | 6476 | 6602 | 6208 | 6277 | 5956 | 6309 | 6174 |
| Profit-Maximising Feeding Period (PMFP) | |||||||
| Total WF/animal (m3) | 1036 | 1097 | 1822 | 1409 | 1682 | 2413 | 2147 |
| Weight gained/animal (kg) | 166 | 177 | 279 | 222 | 262 | 372 | 332 |
| WF/kg weight gained (litre) | 6242 | 6201 | 6523 | 6354 | 6427 | 6481 | 6465 |
Source: Own calculations. WF: water footprint.
Table 4.
Feedlot simulation results from the Liebenbergstroom feedlot for the NPFP and PMFP.
| Afrikaner | Brahman | Angus | Bonsmara | Simbra | Simmentaler | Limousin | Total | |
|---|---|---|---|---|---|---|---|---|
| % | 5 | 8 | 15 | 35 | 13 | 12 | 12 | 100 |
| N | 400 | 640 | 1200 | 2800 | 1040 | 960 | 960 | 8000 |
| Normal Pre-determined Feeding Period (NPFP) | ||||||||
| Cycles/year | 2.74 | 2.74 | 2.74 | 2.74 | 2.74 | 2.74 | 2.74 | |
| Margin/year | R 409,013 | R 1,450,940 | R 3,422,210 | R 7,225,615 | R 4,676,969 | R 4,915,875 | R 5,141,466 | R 27,242,087 |
| WF/year (m3) | 1,429,538 | 2,320,315 | 5,037,651 | 12,858,760 | 4,257,286 | 4,366,058 | 4,066,704 | 34,336,311 |
| WF/R margin (m3) | 3.50 | 1.60 | 1.47 | 1.78 | 0.91 | 0.89 | 0.79 | 1.26 |
| Profit-Maximising Feeding Period (PMFP) | ||||||||
| Cycles/year | 3.47 | 3.25 | 2.36 | 3.25 | 2.48 | 1.93 | 2.00 | |
| Margin/year | R 1,224,176 | R 2,869,038 | R 4,027,492 | R 12,598,550 | R 5,007,889 | R 5,072,321 | R 5,328,334 | R 36,127,799 |
| WF/year (m3) | 1,436,151 | 2,282,533 | 5,167,530 | 12,823,200 | 4,330,888 | 4,461,633 | 4,121,966 | 34,623,901 |
| WF/R margin (m3) | 1.17 | 0.80 | 1.28 | 1.02 | 0.86 | 0.88 | 0.77 | 0.96 |
| Difference (PMFP − NPFP) | ||||||||
| Margin/year | R 815,162 | R 1,418,098 | R 605,282 | R 5,372,935 | R 330,920 | R 156,447 | R 186,868 | R 8,885,712 |
| WF/year (m3) | 6612 | −37,782 | 129,880 | −35,560 | 73,603 | 95,575 | 55,262 | 287,590 |
| WF/R margin (m3) | −2.32 | −0.80 | −0.19 | −0.76 | −0.05 | −0.01 | −0.02 | −0.30 |
© 2019 by the authors. Licensee MDPI, Basel, Switzerland. This article is an open access article distributed under the terms and conditions of the Creative Commons Attribution (CC BY) license (http://creativecommons.org/licenses/by/4.0/).
Share and Cite
MDPI and ACS Style
Maré, F.A.; Jordaan, H. Industrially Finished Calves: A Water Footprint-Profitability Paradox. Water 2019, 11, 2565. https://doi.org/10.3390/w11122565
AMA Style
Maré FA, Jordaan H. Industrially Finished Calves: A Water Footprint-Profitability Paradox. Water. 2019; 11(12):2565. https://doi.org/10.3390/w11122565
Chicago/Turabian StyleMaré, Frikkie Alberts, and Henry Jordaan. 2019. "Industrially Finished Calves: A Water Footprint-Profitability Paradox" Water 11, no. 12: 2565. https://doi.org/10.3390/w11122565
Note that from the first issue of 2016, this journal uses article numbers instead of page numbers. See further details here.