Long-Term Drought Trends in Ethiopia with Implications for Dryland Agriculture
by
 , , and
Dawd Temam
1, 
Venkatesh Uddameri
1,2,* ,
,
Ghazal Mohammadi
2 ,
,
E. Annette Hernandez
2 and
Stephen Ekwaro-Osire
3,4 1
Jimma Institute of Technology, Faculty of Civil and Environmental Engineering, University of Jimma, Jimma, Ethiopia
2
Department of Civil, Environmental and Construction Engineering, Texas Tech University, Lubbock, TX 79409, USA
3
Department of Mechanical Engineering, Jimma Institute of Technology, University of Jimma, Jimma, Ethiopia
4
Department of Mechanical Engineering, Texas Tech University, Lubbock, TX 79409, USA
*
Author to whom correspondence should be addressed.
Water 2019, 11(12), 2571; https://doi.org/10.3390/w11122571
Submission received: 31 October 2019
/
Revised: 29 November 2019
/
Accepted: 4 December 2019
/
Published: 6 December 2019
(This article belongs to the Section Hydrology)
Abstract
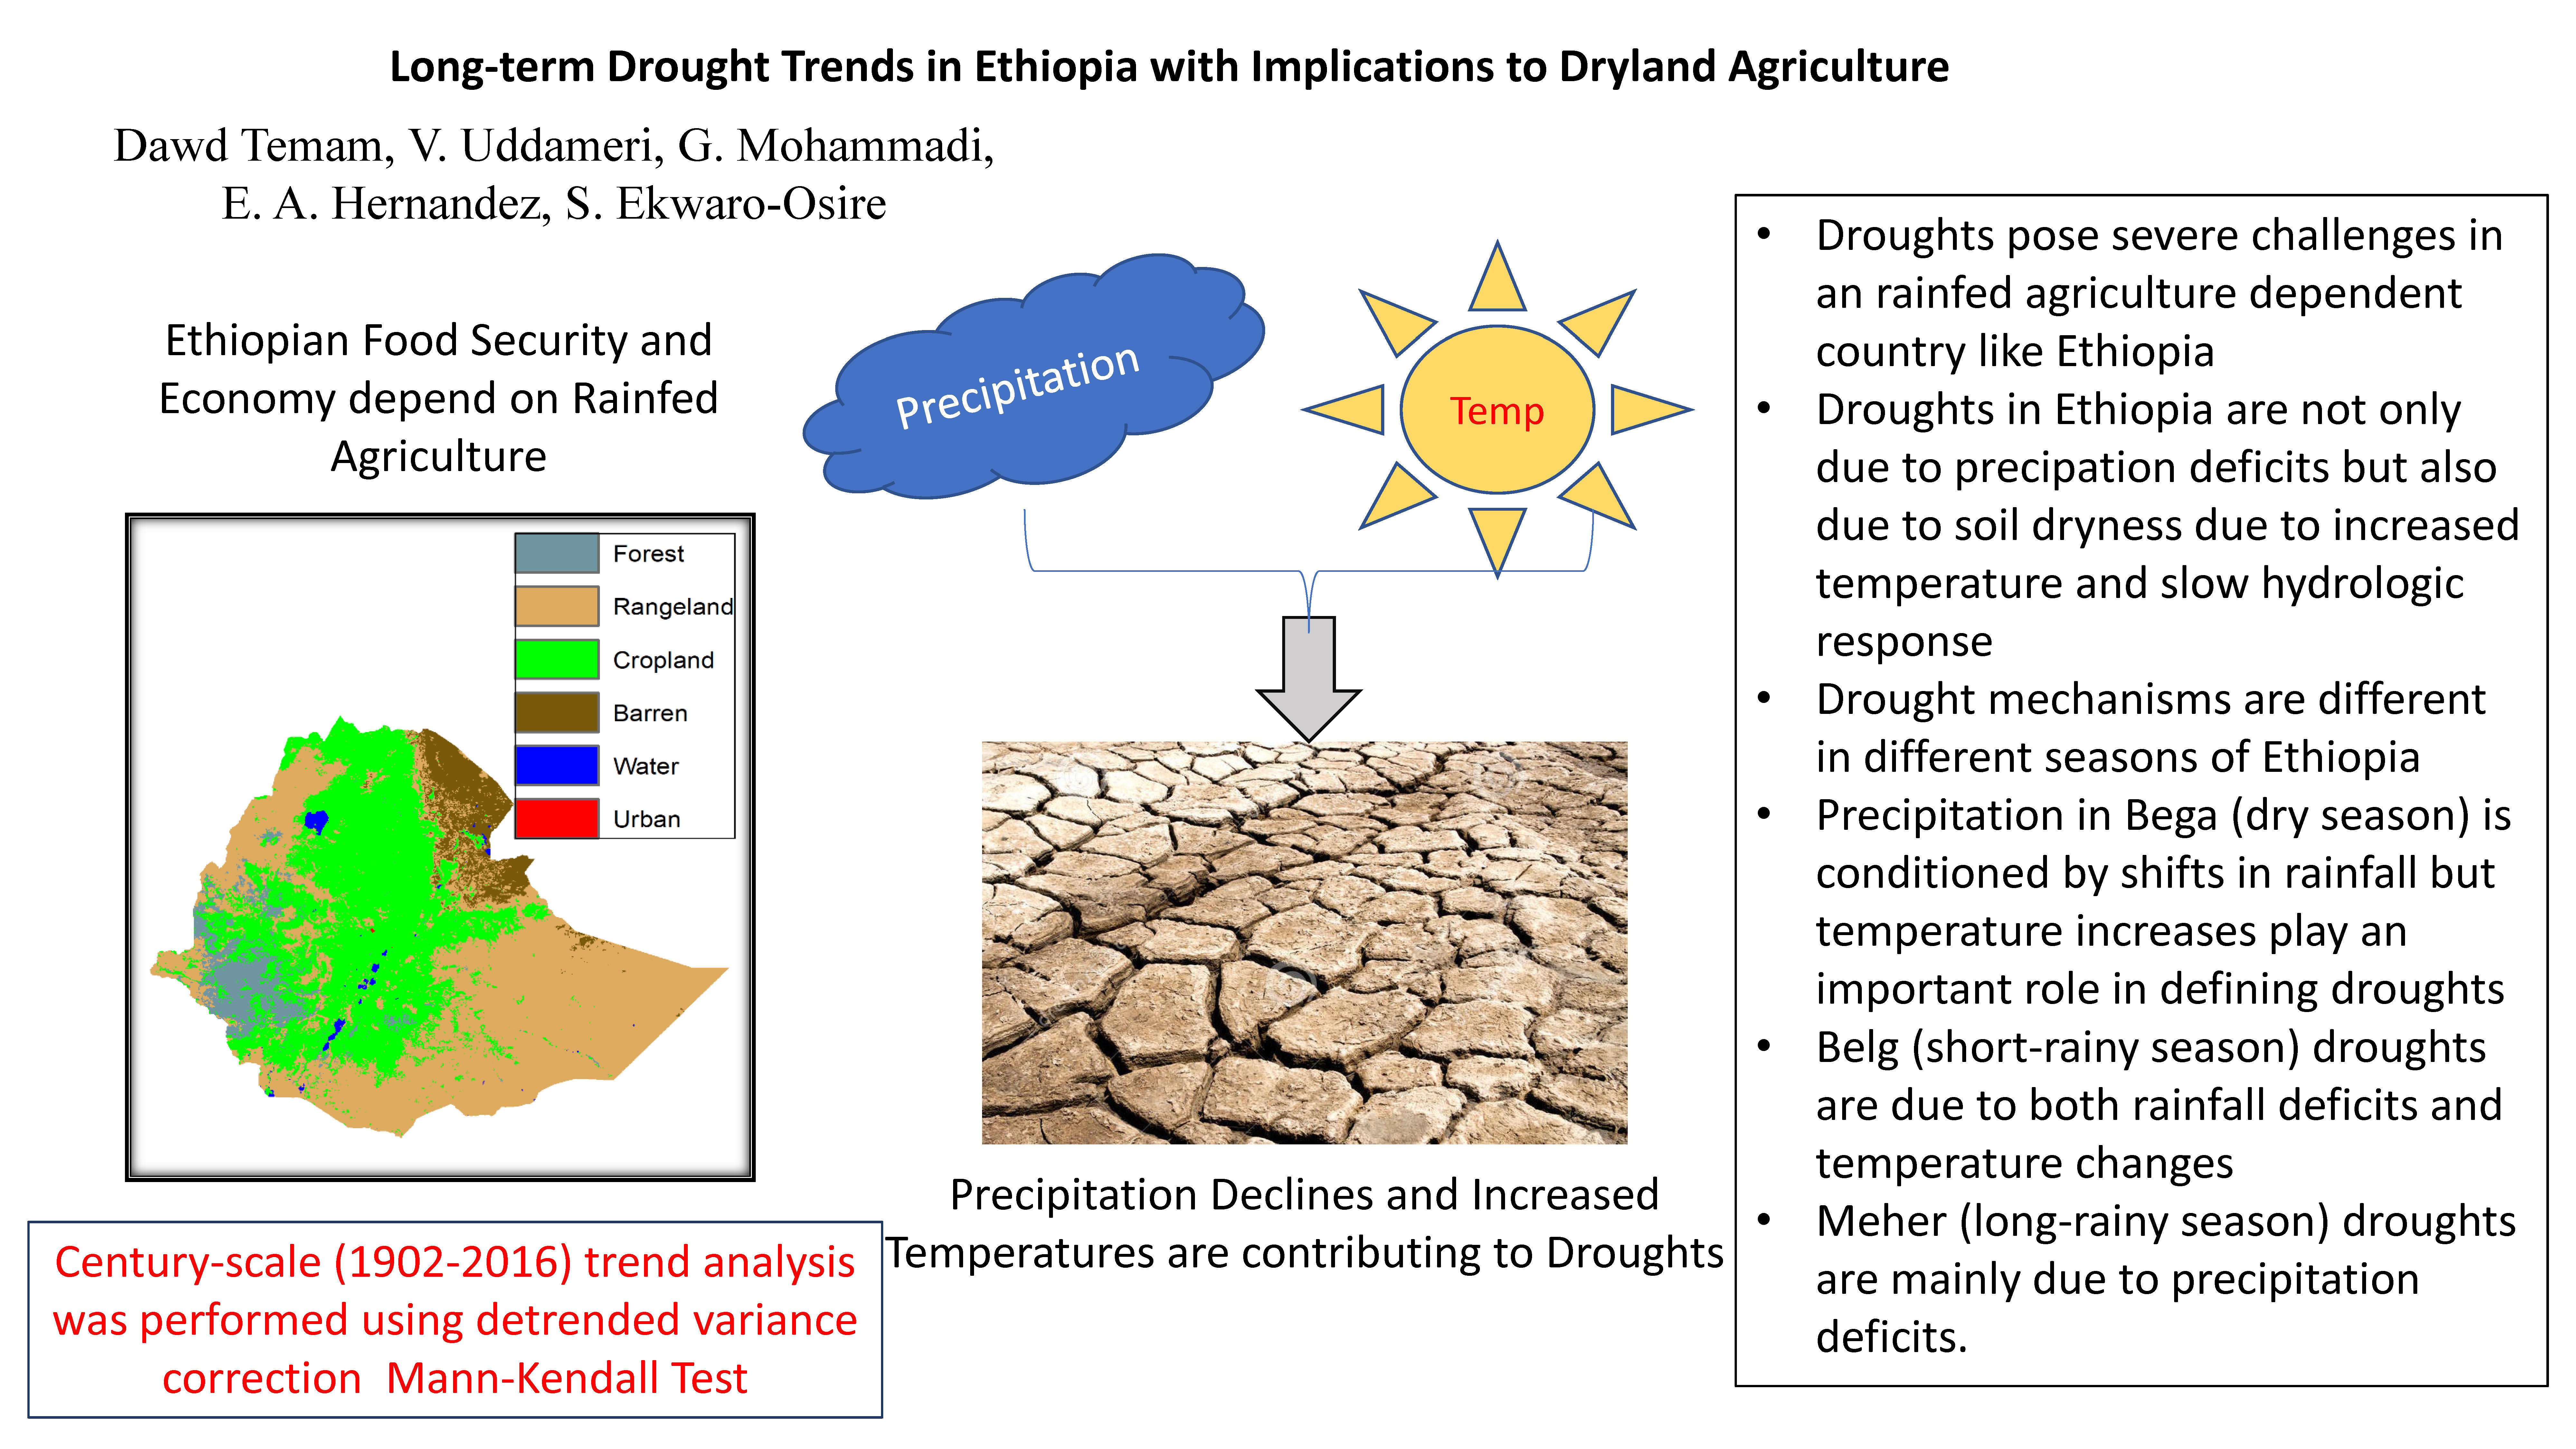
:Intraseason and seasonal drought trends in Ethiopia were studied using a suite of drought indicators—standardized precipitation index (SPI), standardized precipitation evapotranspiration index (SPEI), Palmer drought severity index (PDSI) and Z-index for Meher (long-rainy), Bega (dry), and Belg (short-rainy) seasons—to identify drought-causing mechanisms. Trend analysis indicated shifts in late-season Meher precipitation into Bega in the southwest and southcentral portions of Ethiopia. Droughts during Bega (October–January) are largely temperature controlled. Short-term temperature-controlled hydrologic processes exacerbate rainfall deficits during Belg (February–May) and highlight the importance of temperature- and hydrology-induced soil dryness on production of short-season crops such as tef. Droughts during Meher (June–September) are largely driven by precipitation declines arising from the narrowing of the intertropical convergence zone (ITCZ). Increased dryness during Meher has severe consequences on the production of corn and sorghum. PDSI is an aggressive indicator of seasonal droughts suggesting the low natural resilience to combat the effects of slow-acting, moisture-depleting hydrologic processes. The lack of irrigation systems in the nation limits the ability to combat droughts and improve agricultural resilience. There is an urgent need to monitor soil moisture (a key agro-hydrologic variable) to better quantify the impacts of meteorological droughts on agricultural systems in Ethiopia.
Keywords:
SPI; SPEI; PDSI; Palmer Z-index; Ethiopia; food security; climate change; droughts; trend analysis; autocorrelation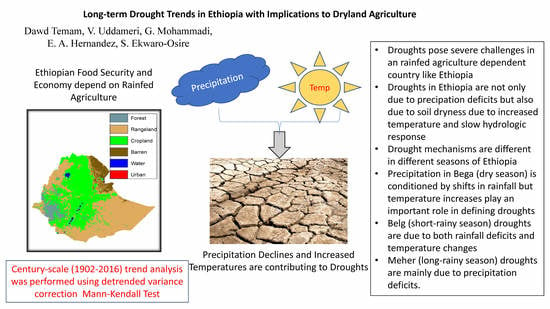
1. Introduction
Ethiopia is predominantly rural with a large population depending on agriculture and pastoral activities, but there has been limited development of surface water and groundwater resources for irrigation [1]. Dryland farming is widely practiced in Ethiopia and accounts for over two-thirds of all agricultural land [2]. Unfortunately, droughts have frequently plagued Ethiopia and are a major climatic hazard that impacts the long-term sustainability of this rapidly growing African nation [3,4].
The government of Ethiopia has adopted a national policy to deal with droughts [5] and requires local stakeholder-driven drought contingency planning to foster sustainable water resources management [6]. Droughts are primarily caused by atmospheric moisture deficits (meteorological droughts). They propagate through hydrologic systems and cause reductions in water supplies (hydrologic droughts). Meteorological droughts also have the potential to disrupt agricultural production by diminishing soil moisture availability (agricultural droughts). Thus, droughts can have grave implications on the socio-economic well-being (socio-economic droughts) of rural areas [7].
Droughts are multidimensional in nature, manifest at different temporal scales, and cannot be fully characterized using a single indicator [8]. Agriculture and hydrologic droughts are affected not only by rainfall but also other processes such as plant water uptake (evapotranspiration). Rainfall deficits tend to create warmer temperatures due to lowered humidity. Droughts also affect many other hydrologic processes such as exfiltration and baseflow to streams. Analysis of droughts using multiple indicators calculated at different time spans is, therefore, necessary to build a better understanding of droughts [9,10,11].
As Ethiopia relies heavily on rainfed agriculture, there has been a significant emphasis on evaluating trends in rainfall, rainfall anomalies, or precipitation-derived rainfall drought indicators such as the standardized precipitation index, SPI [12,13,14,15,16,17,18,19,20,21]. Most of these studies, however, tend to be regional and utilize short-span (approximately 30–40 years) datasets with a focus on long-term (12 month) droughts. Even national-scale studies are limited in the number of stations that are used because there are long periods of missing records. Trend studies are often noted to be contradictory or inconclusive and are known to depend upon regional divisions and the quality of the data that are used to estimate trends [15,22]. A few recent studies have utilized the Palmer drought severity index, PDSI [21,23], which attempts to define droughts using the principles of water budget. However, these studies are limited to a few watersheds in the country and do not always compare the performance of PDSI with other drought indicators.
Meteorological droughts focus on the atmospheric moisture deficits, and delineating their trends is undoubtedly important in Ethiopia given its high reliance on rainfed agricultural practices. However, the onset of an agricultural drought is typically marked by deficiencies in soil moisture [24], which is a complex function of precipitation as well as soil and land use characteristics of the watershed. The onset and cessation of agricultural droughts need not coincide with the beginning and end of meteorological droughts. Antecedent soil moisture can help buffer the soil initially to withstand meteorological droughts. In a similar vein, soil dryness may continue to occur even after the cessation of meteorological droughts because of deep percolation and evapotranspiration. Therefore, trends in meteorological droughts may not translate to trends in agricultural droughts or vice-versa. In countries, such as Ethiopia, with multiple growing seasons, differences between meteorological, agricultural, and hydrologic droughts can vary across the seasons because of the variations in underlying drought generation processes.
There are three main seasons in Ethiopia. The main rainy season (June–September), also known as Kiremt, exists over all of Ethiopia except perhaps in southern and southeastern parts. The agricultural season corresponding with this rainfall is referred to as Meher. Both Meher and Kiremt are used interchangeably in local parlance, and this practice will be adopted here as well. The country is generally dry during the months of October–January, except for the central part, which receives some rainfall. This relatively dry period is locally referred to as Bega. The Belg is the shorter rainy season that extends from February–May but is the primary source of water in the southern and southeastern part of the nation [12].
Agriculture in Ethiopia is adapted around the rainy seasons. The major crops in Ethiopia include a variety of grains (cereals), oilseeds, and coffee [25]. Single-season crops (wheat, tef, sorghum, and barley) are harvested during both Belg and Meher. Long-cycle crops (e.g., maize, millet, and sorghum) are grown over both the seasons (Belg and Meher) and account for nearly 50% of the total crop production [26]. The period between April–September/October represents the growing phase of the long-season crops. Given the seasonal nature of agriculture practices in Ethiopia, drought studies need to focus on short (1–3 months) to medium (3–6 months) time scales to properly capture the moisture dynamics during the growing seasons.
A simultaneous assessment of drought trends using multiple drought indicators is useful for drought planning and management studies. While some indicators may detect droughts in one season (say dry), another might exhibit greater sensitivity in a different (say wet) season. If various drought indicators (which are computed using different parameters and conceptualizations) all exhibit similar trends, then there will be greater confidence in the detected trend as all available information is pointing to the change. In such an instance, the use of a simpler drought index (e.g., one based on precipitation alone) would be validated and deemed reasonable for trend detection. If different drought indices exhibit diverging trends, then additional insights with regards to the underlying mechanisms driving droughts can be ascertained [27]. Identification of such underlying factors are helpful to guide future data collection activities and identify mechanistic shifts in drought-producing processes [28].
The primary goal of the present study is to undertake a multi-indicator evaluation of drought trends with an emphasis on agricultural production across the three different seasons (Bega, Belg, and Meher) in Ethiopia. Despite the growing recognition of the need to use multiple drought indicators to fully assess droughts, a simultaneous comparison of drought trends from multiple indicators at multiple scales is an important knowledge gap in Ethiopia that this study seeks to address.
2. Selection of Drought Indicators
There are over 150 drought indicators reported in the literature [8]. Careful selection of drought indicators is, therefore, an important decision in any trend analysis studies. The choice of the drought indicator used in the study was based on several factors including (1) the availability of reliable data to compute these indicators, (2) those based on sound technical principles, (3) those based on standardized approaches that allow comparisons in space and time, (4) widespread acceptance of the indicators, and (5) suitability of the indicators for use in agriculture dominant regions such as Ethiopia.
Four drought indicators, namely, the standardized precipitation index (SPI), standardized precipitation evapotranspiration index (SPEI), the self-calibrating Palmer drought severity index (PDSI), and the Palmer Z-index (Z-index), were selected for this study. Furthermore, SPI and SPEI were computed at short (1–3 months) and long (4–6 months) timescales to account for intraseasonal and full-season droughts. In a similar vein, PDSI is known to better capture long-term droughts [29,30] and used for full-season assessment, while the Z-index is designed to model the short-term moisture dynamics better [31,32] and used for intraseasonal drought comparisons.
As Ethiopia is largely agrarian, a drought indicator that is directly based on soil moisture would be ideal. The lack of soil moisture measurements in the country is, however, a key limitation. While global gridded soil moisture estimates have become available, the underlying algorithms have not been ground-truthed for Ethiopian conditions because of the lack of soil moisture data and, as such, may not be reliable. Therefore, while recognizing the limitation, surrogate meteorological drought indicators that exhibit strong correlations to soil moisture and that can be computed using reliable data had to be resorted to in this study. Table 1 summarizes the key references and salient characteristics of drought indicators selected in this study.
3. Datasets and Methods
Following Asfaw et al. [21], Full Data Monthly Product Version 2018 from the Global Precipitation and Climatology Center (GPCC), available on 0.5° × 0.5° grid [41], was used along with temperature data from the Climate Research Unit (CRU TS 4.21) as described in Harris et al. [42]. GPCC Full Data Monthly Product is the most comprehensive gridded rainfall dataset available today and is based on measurements from over 80,000 stations worldwide. When this study was conducted, the dataset covered a period ranging from January 1891 to December 2016 [11,43]. While GPCC data are available at different spatial resolutions, the data with 0.5° × 0.5° spatial resolution were used to be consistent with the resolution of the available temperature data. The rainfall data at the adopted resolution is known to provide reasonable estimates in Ethiopia [21].
The CRU Climate Dataset is produced by the Climate Research Unit at the University of East Anglia and is also gridded at a resolution of 0.5° × 0.5° over the land mass, and during the time of this study, data were available at a monthly time-step from 1901–2017. The CRU dataset is again based on long-term observations from several thousand stations worldwide that are compiled under the auspices of the World Meteorological Organization (WMO) and the National Oceanic and Atmospheric Administration (NOAA through its National Climate Data Center, NCDC). This dataset has also been used in several hundred climate change assessment studies and known to provide reasonable estimates for temperature [42].
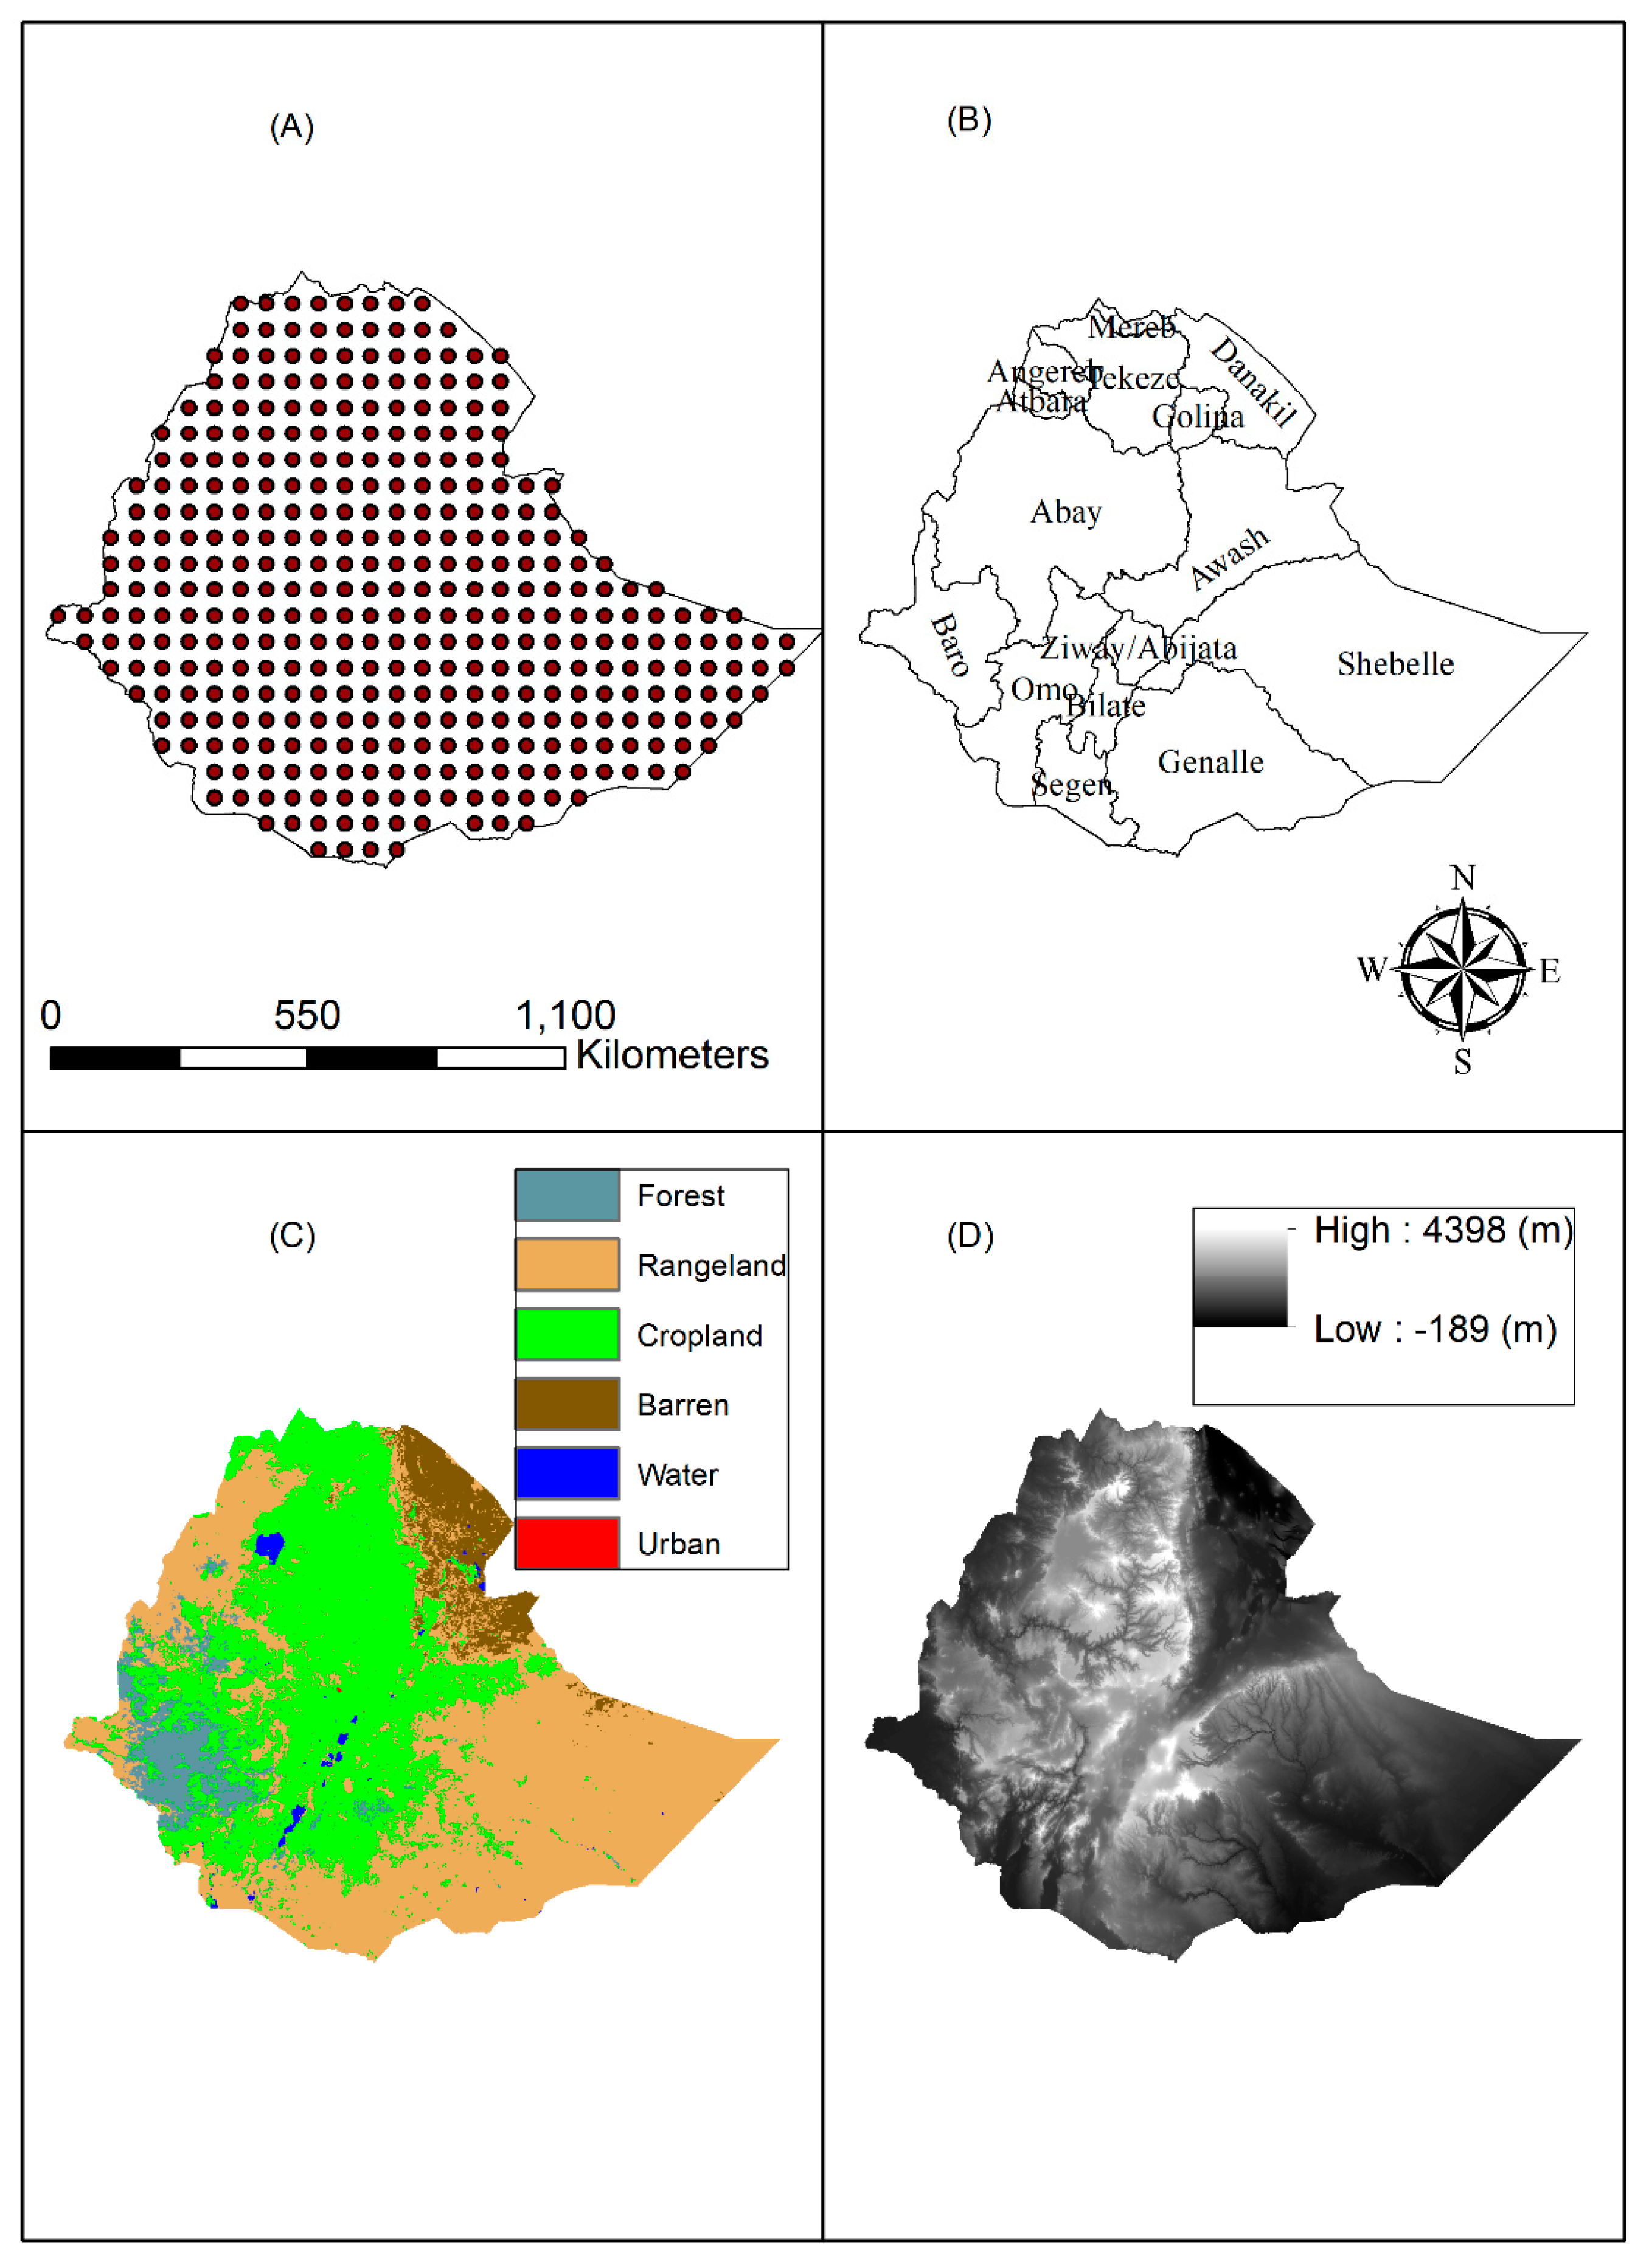
The adopted spatial resolution of 0.5° corresponds to roughly 50 km in Ethiopia and resulted in 377 locations across the country where trend analysis was carried out (see Figure 1a). The 15 major water basins in Ethiopia are shown in Figure 1b and represent the federal-level water planning boundaries of the nation. Figure 1c shows the land use land cover (LULC) classification, which highlights the rural nature of the country with high reliance on climate-dependent agricultural and pastoral activities. As depicted in Figure 1d, Ethiopia exhibits a great variation in relief ranging from areas below mean sea level to mountain ranges that are over 4000 m high. Rainfall correlates strongly with elevation, with higher elevations getting more rainfall than lowlands as a result of air traveling from the Indian Ocean and the north [18].
The SPI and SPEI calculations were carried out using procedures presented in Stagge et al. [44] to correct for zero rainfall values that are likely during dry months. As the interest is on agricultural systems, SPI and SPEI were computed at 2, 3, 4, and 6 months of accumulation to evaluate both intraseasonal and full-season trends. The analysis indicated that the results of intermediate accumulation periods (3 and 4 months) yielded results that were similar to the bracketing accumulation periods of 2 and 6 months. As such, the results are only presented here for 2 months (intraseason) and 6 months (full-season) of accumulation in the interest of brevity.
The drought indicators were all computed on a monthly basis and then aggregated to obtain values for seasonal climate states. For a hydrologic year, the seasons were defined as Bega (October–January), Belg (February–May), and Meher (June–September). Trend analysis was carried out over hydrologic years 1902–2016 (October 1901–September 2016), and to the best of the authors’ knowledge, this represents the longest assessment period in Ethiopia that has been documented in the literature. Century-scale trend assessment studies, such as the one conducted here, better capture a higher degree of climate variability than what is observed at shorter timespans, which in turn helps minimize artifacts associated with any short-term or cyclical effects present in the climate signals.
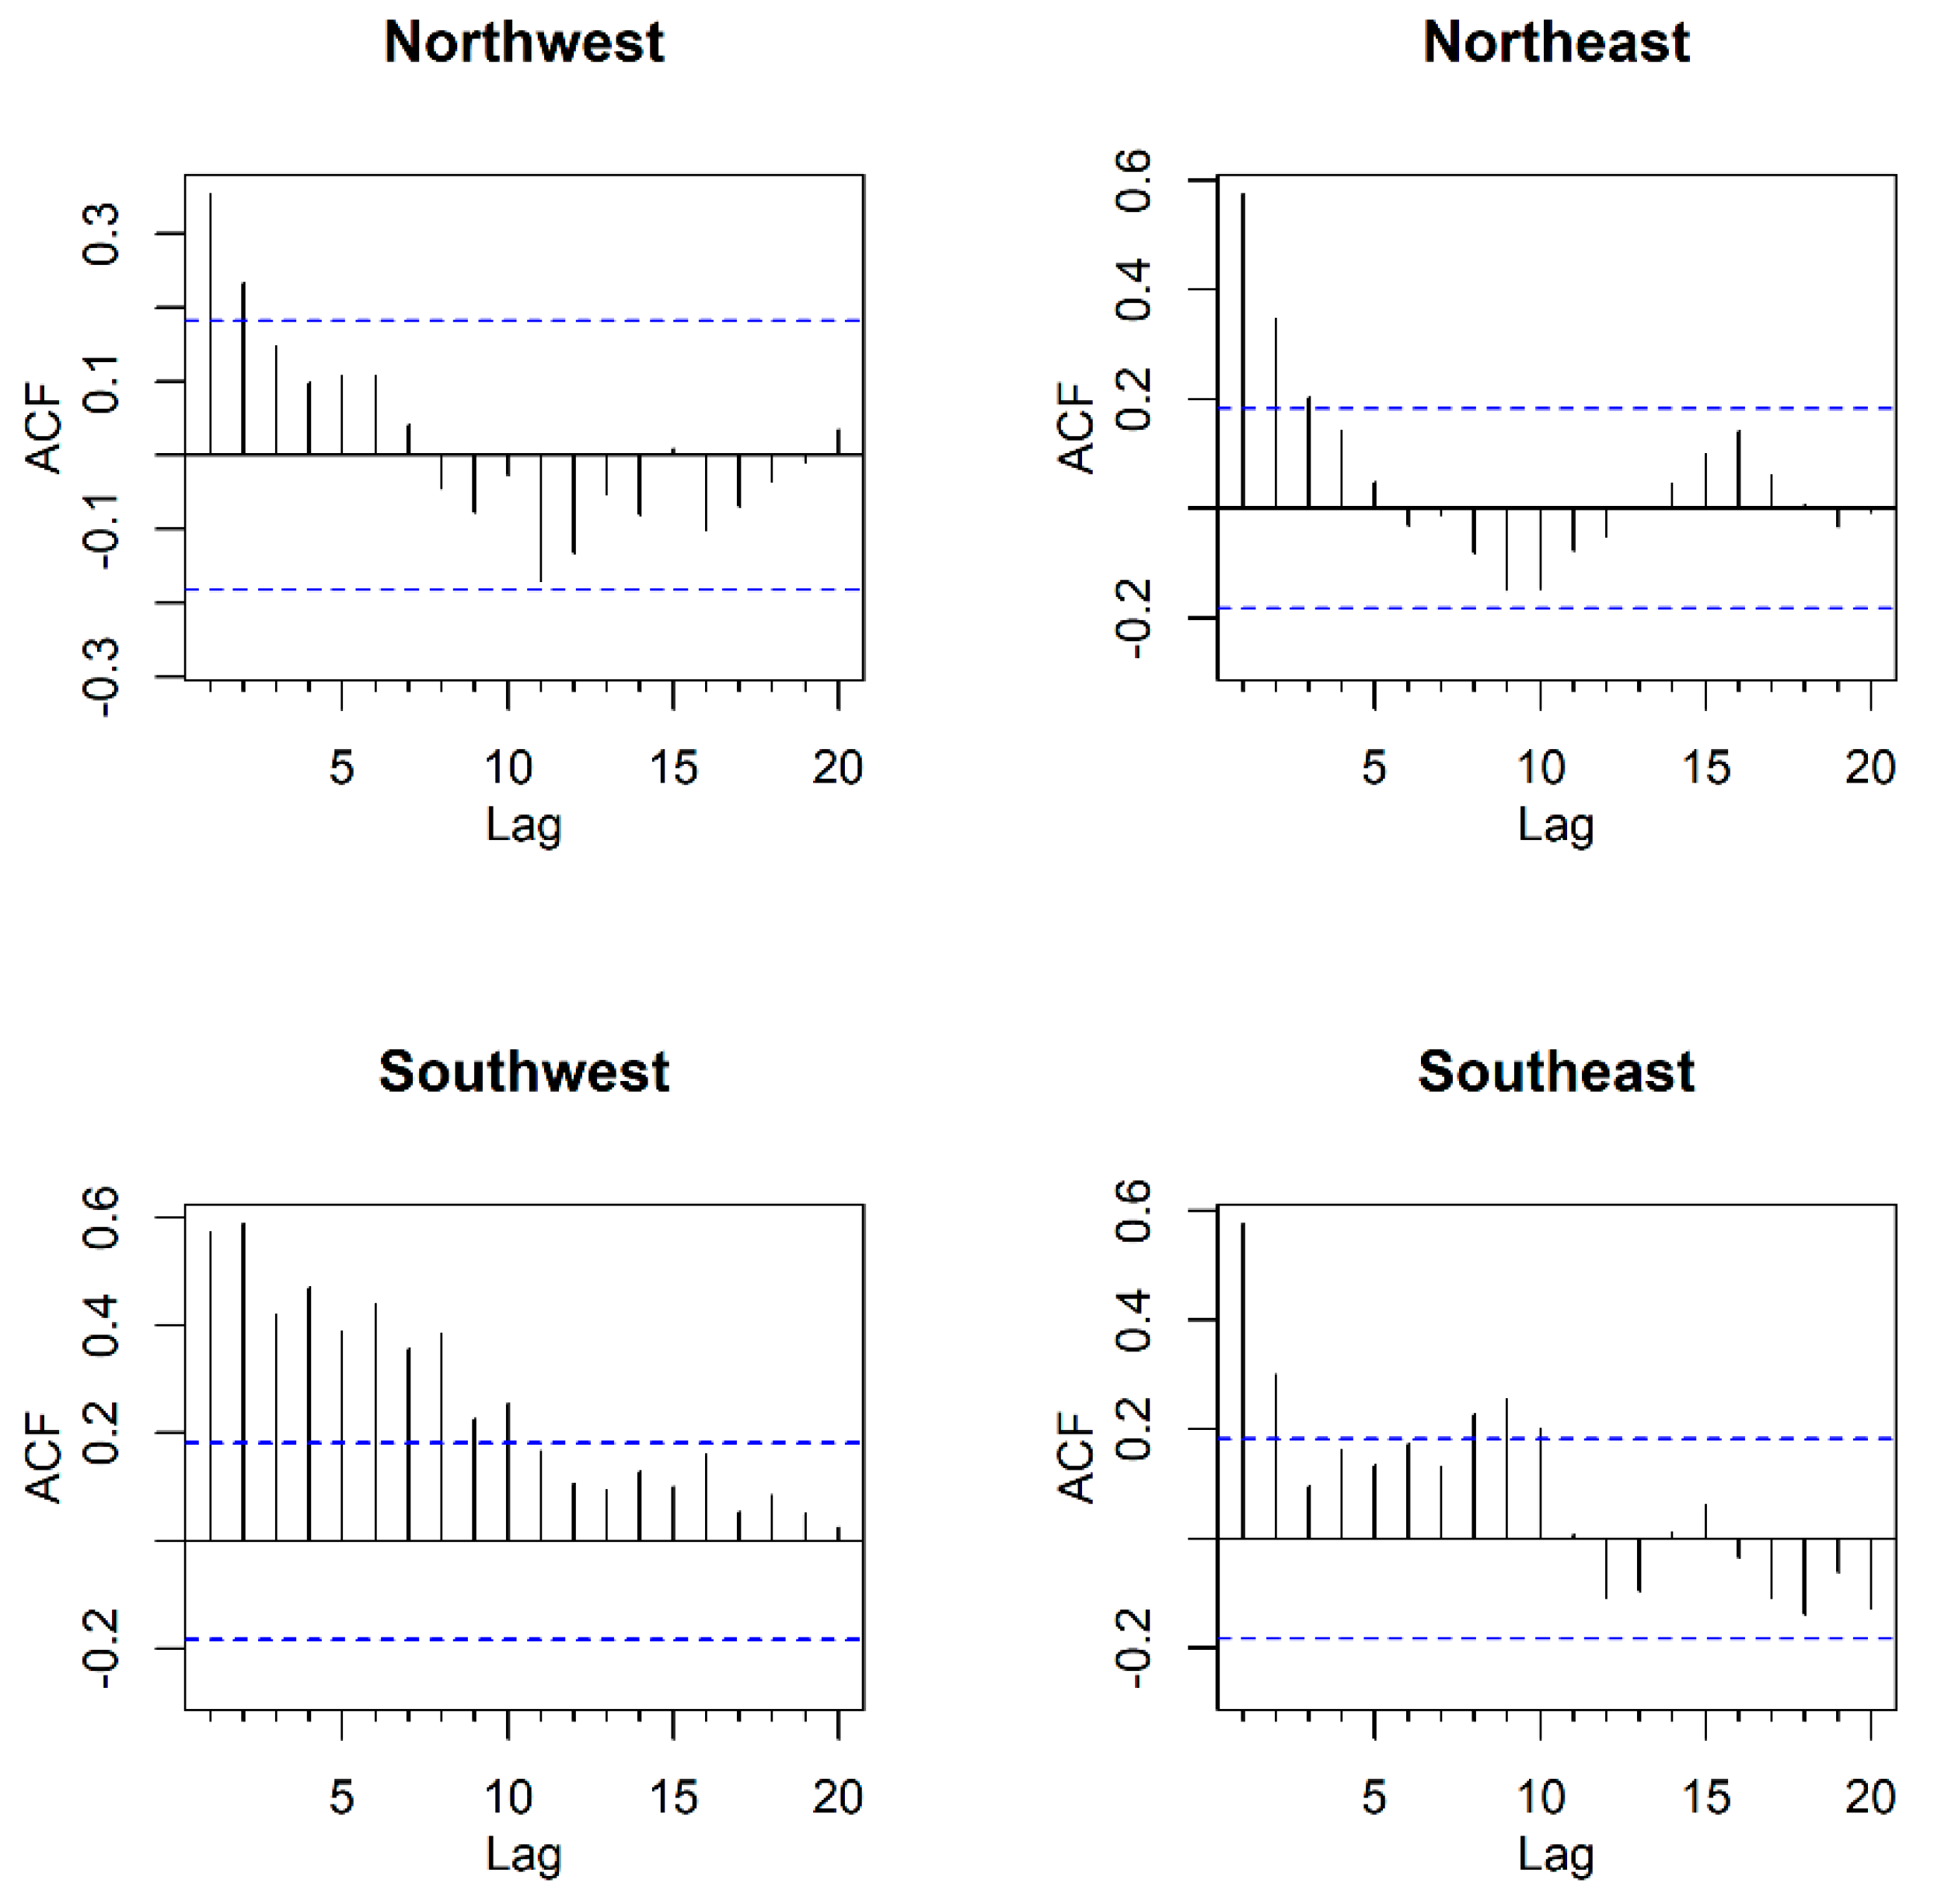
The Mann–Kendall (MK) test is a robust nonparametric test that has been widely used for trend assessment but is also sensitive to autocorrelation effects in time-series data used for trend detection [45,46,47,48]. Exploratory data analysis indicated the presence of autocorrelation even when drought indicators were aggregated over the season to create an annual time-series. Furthermore, autocorrelation structures that were observed varied across indicators and in space (see Figure 2 for an illustrative example). In all cases, at least the lag-1 autocorrelation was significant. Autocorrelation effects from higher-order lags were also significant and had to be corrected for at several locations. Many approaches have been suggested in the literature to properly assess trends in autocorrelated time-series (Hamed and Rao [45], Yue et al. [46], Rao et al. [47], Yue and Wang [48]) and need to be used, as the presence of autocorrelation induces spurious trends in the data and invalidates trend analysis studies. Autocorrelation effects have not been accounted for in many previous studies in Ethiopia [12,13,14,15,16,17,18,19,20,21], which could be another factor for inconsistencies and divergence in results that have been noted in them.
The detrended variance correction Mann–Kendall (DTVCMK) approach of Yue and Wang [48] was adopted here because it has lower false detections than rank-based variance corrections methods [46,48]. In addition, the DTVCMK approach is also known for its ability to deal with higher-order dependencies [49] and exhibits statistical power that is comparable to more computationally intensive block bootstrap methods [50]. The detrended variance correction approach entails the following computations.
To begin the procedure, an observation (Xi) is split into a trend component (Ti) and residual component ε:
The Theil–Sen slope trend [51,52] offers a robust non-parametric approach to estimate the trend component of the observation. In this approach, the slopes of the lines drawn between an observation (Xi) and each successive observation (Xl) are computed to form a series of slopes. The median value of the slope series is taken as the representative trend value (see Equation (2)):
The trend component is subtracted from the observed value to obtain the residual component. The lagged correlation coefficients of the residual components (rεk) are computed and used to obtain the detrended variance correction factor (CF) as:
The correction factor (CF) is used to correct the raw Mann–Kendall variance (Var(S)) that is obtained using Equation (4) to calculate the detrended variance Var(S)* (Equation 5). As autocorrelation causes information to be shared between adjacent datapoints, the correction factor is a measure of the fraction of estimated independent (uncorrelated) measurements within the dataset. In Equation (3), N is the sample size, and N* is the effective sample size after correcting for the presence of autocorrelation.
Again, N is the sample size, and ti refers to ties in the data which are indexed using m in Equation (4).
where S is the Mann–Kendall slope obtained using Equation (6).
The detrended variance, Var(S)*, is then used to obtain the detrended variance correction Mann–Kendall statistic (DTVCMK) as follows:
The DTVCMK statistic is used to test the null hypothesis of no-trend against the alternative of an upward (or downward) test by comparing the theoretical distribution of the statistic.
Custom scripts were developed in R software [53] that made use of available libraries and packages for pre-processing data [54], calculating drought indicators [55,56], and performing variance-corrected Mann–Kendall tests [57] as appropriate.
Indicators used in this study specify droughts with negative values (below a threshold) and wet periods using positive values (above a threshold). As trend analysis was carried out using the seasonally aggregated sum of the drought indicator, a negative trend implied the drought indicator became more negative (or less positive) over time (i.e., increase in drought severity or a drying trend), while a positive trend implied a shift towards more positive (or less negative) values over time (decrease in drought severity or a wetting trend).
4. Results and Discussion
4.1. Trends across Ethiopia during Bega Season
The Bega season (October–January) has the lowest rainfall amounts compared to other seasons within the year (~2% of the annual rainfall of the country). Nonetheless, rainfall during Bega is important for several reasons. Bega rains can be significant in the central portions of the country. Bega rains provide much needed antecedent soil moisture that facilitates the tilling and planting of Belg crops. Bega rains are also important to maintain grasses in rangelands that pastoralists depend upon throughout the year. Therefore, droughts during Bega can have devastating impacts on both agricultural and pastoral activities of the nation.
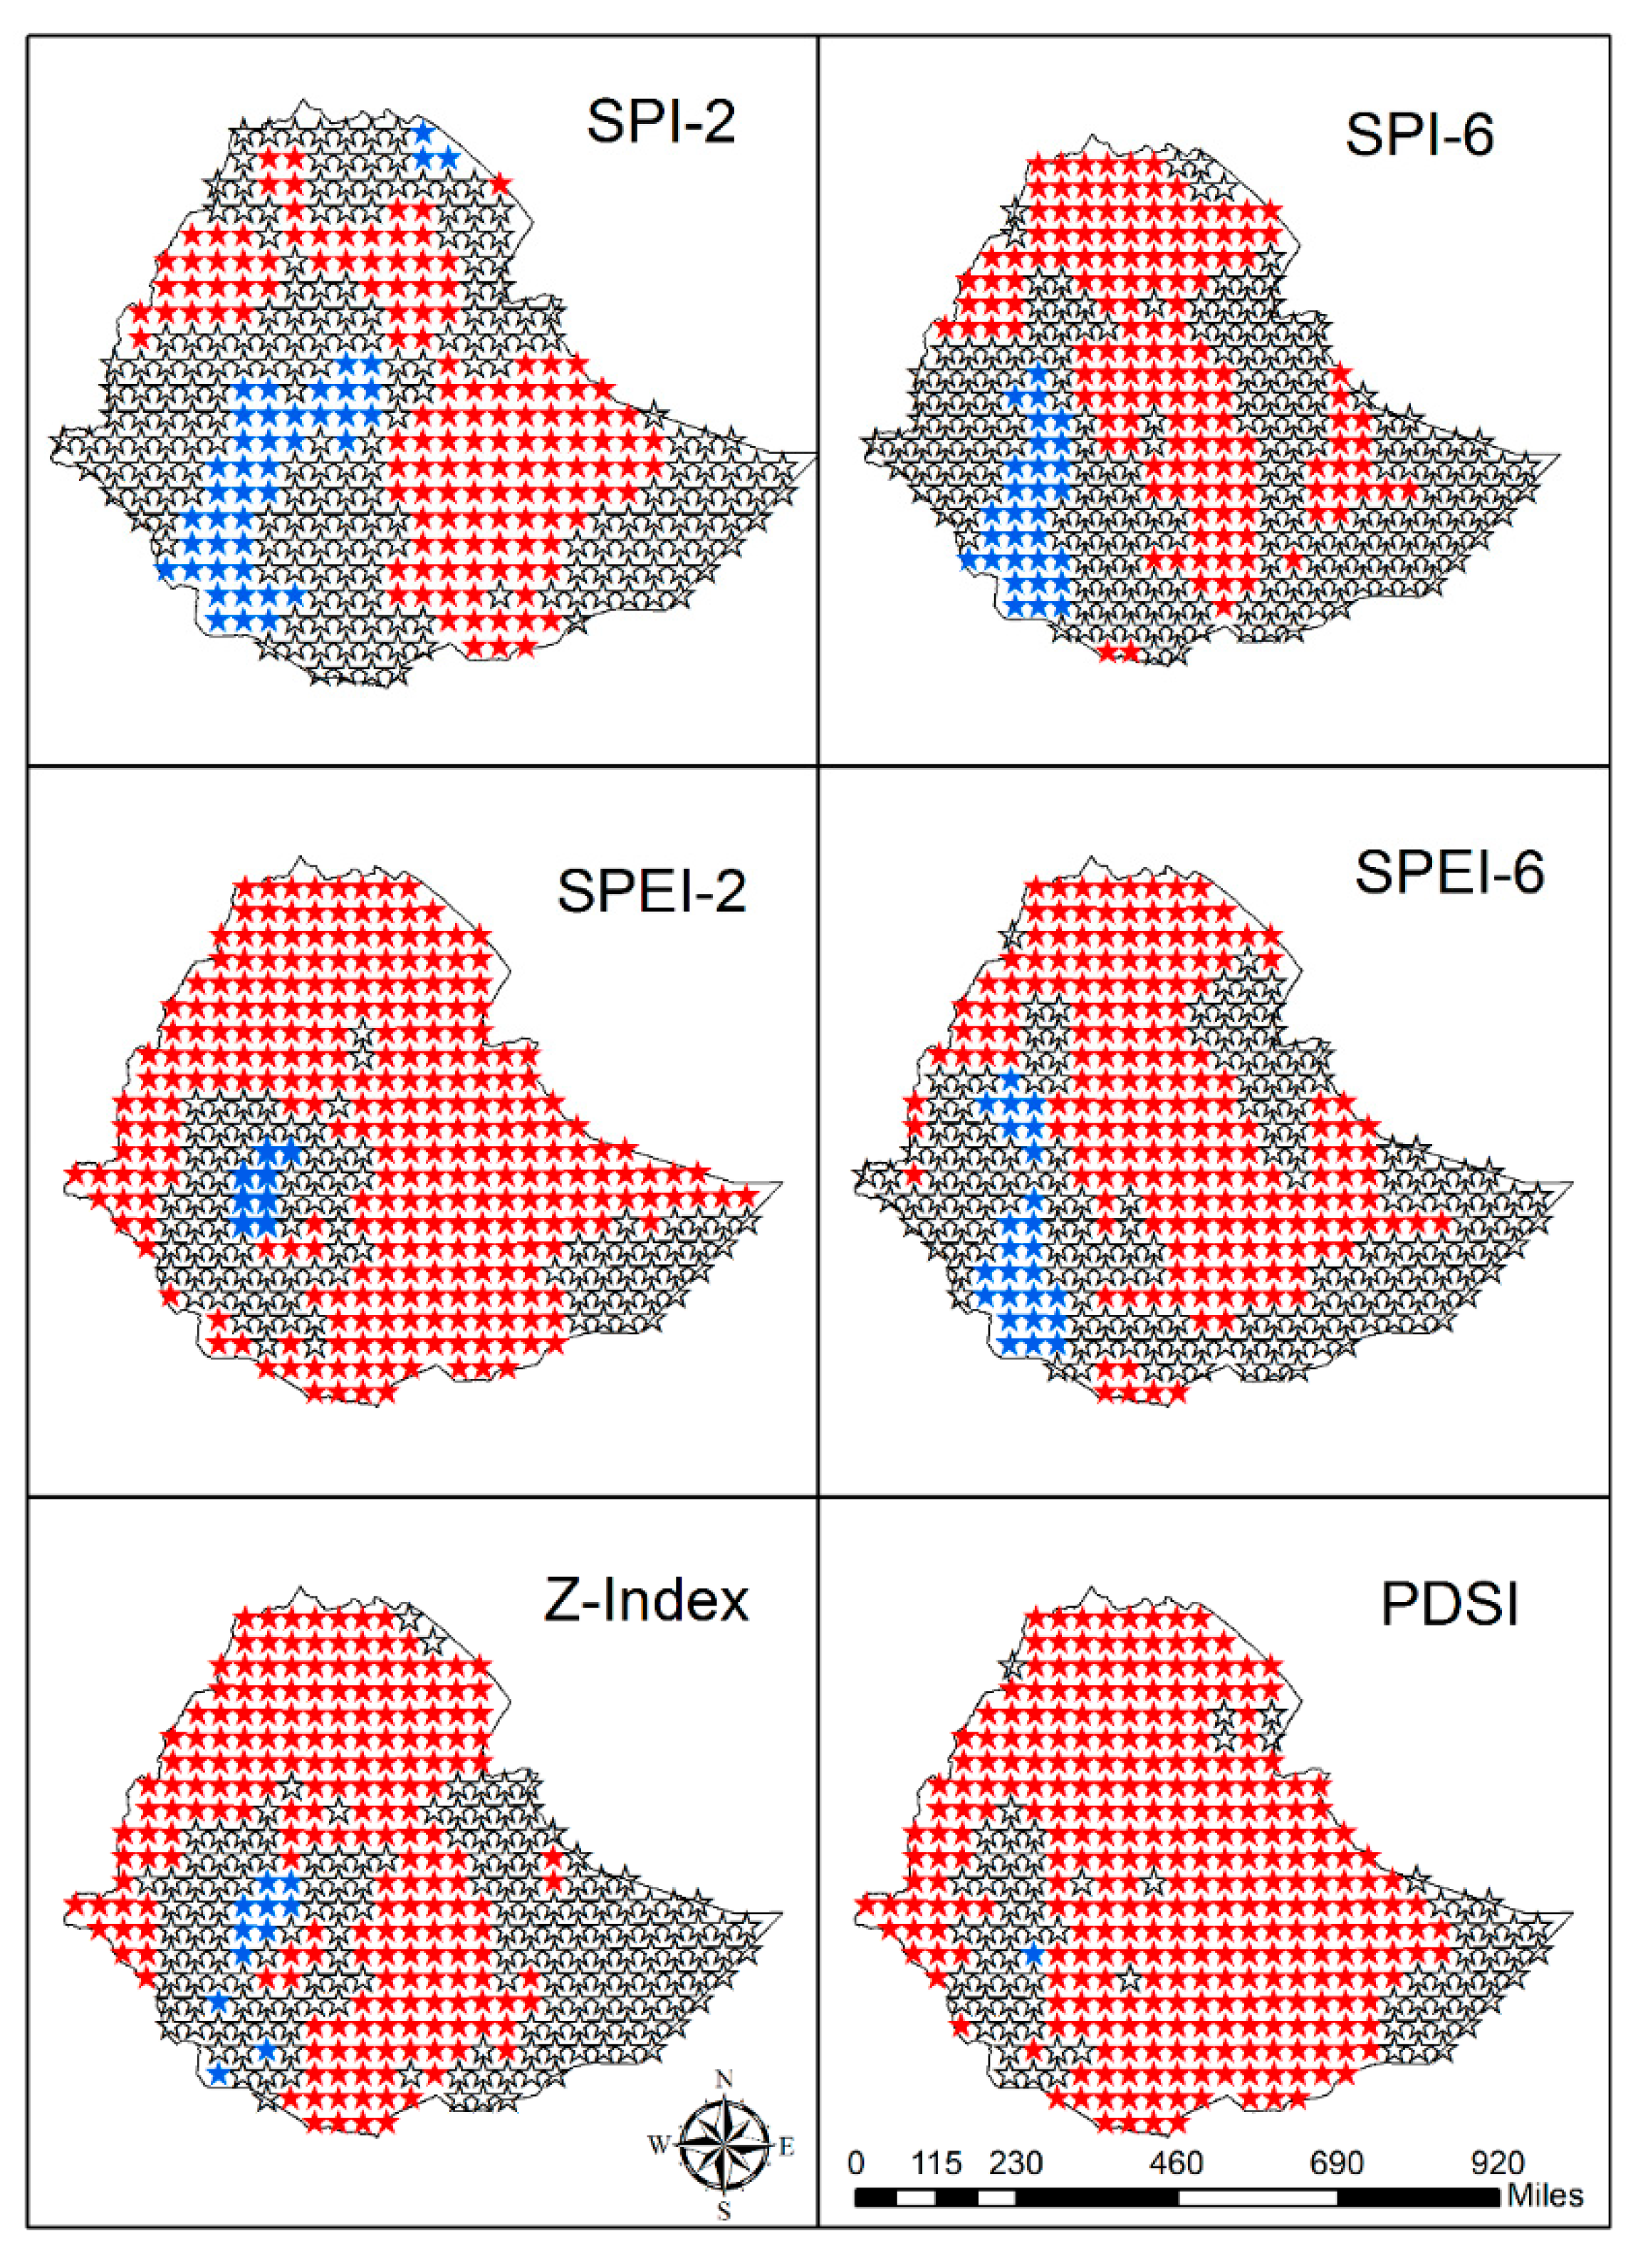
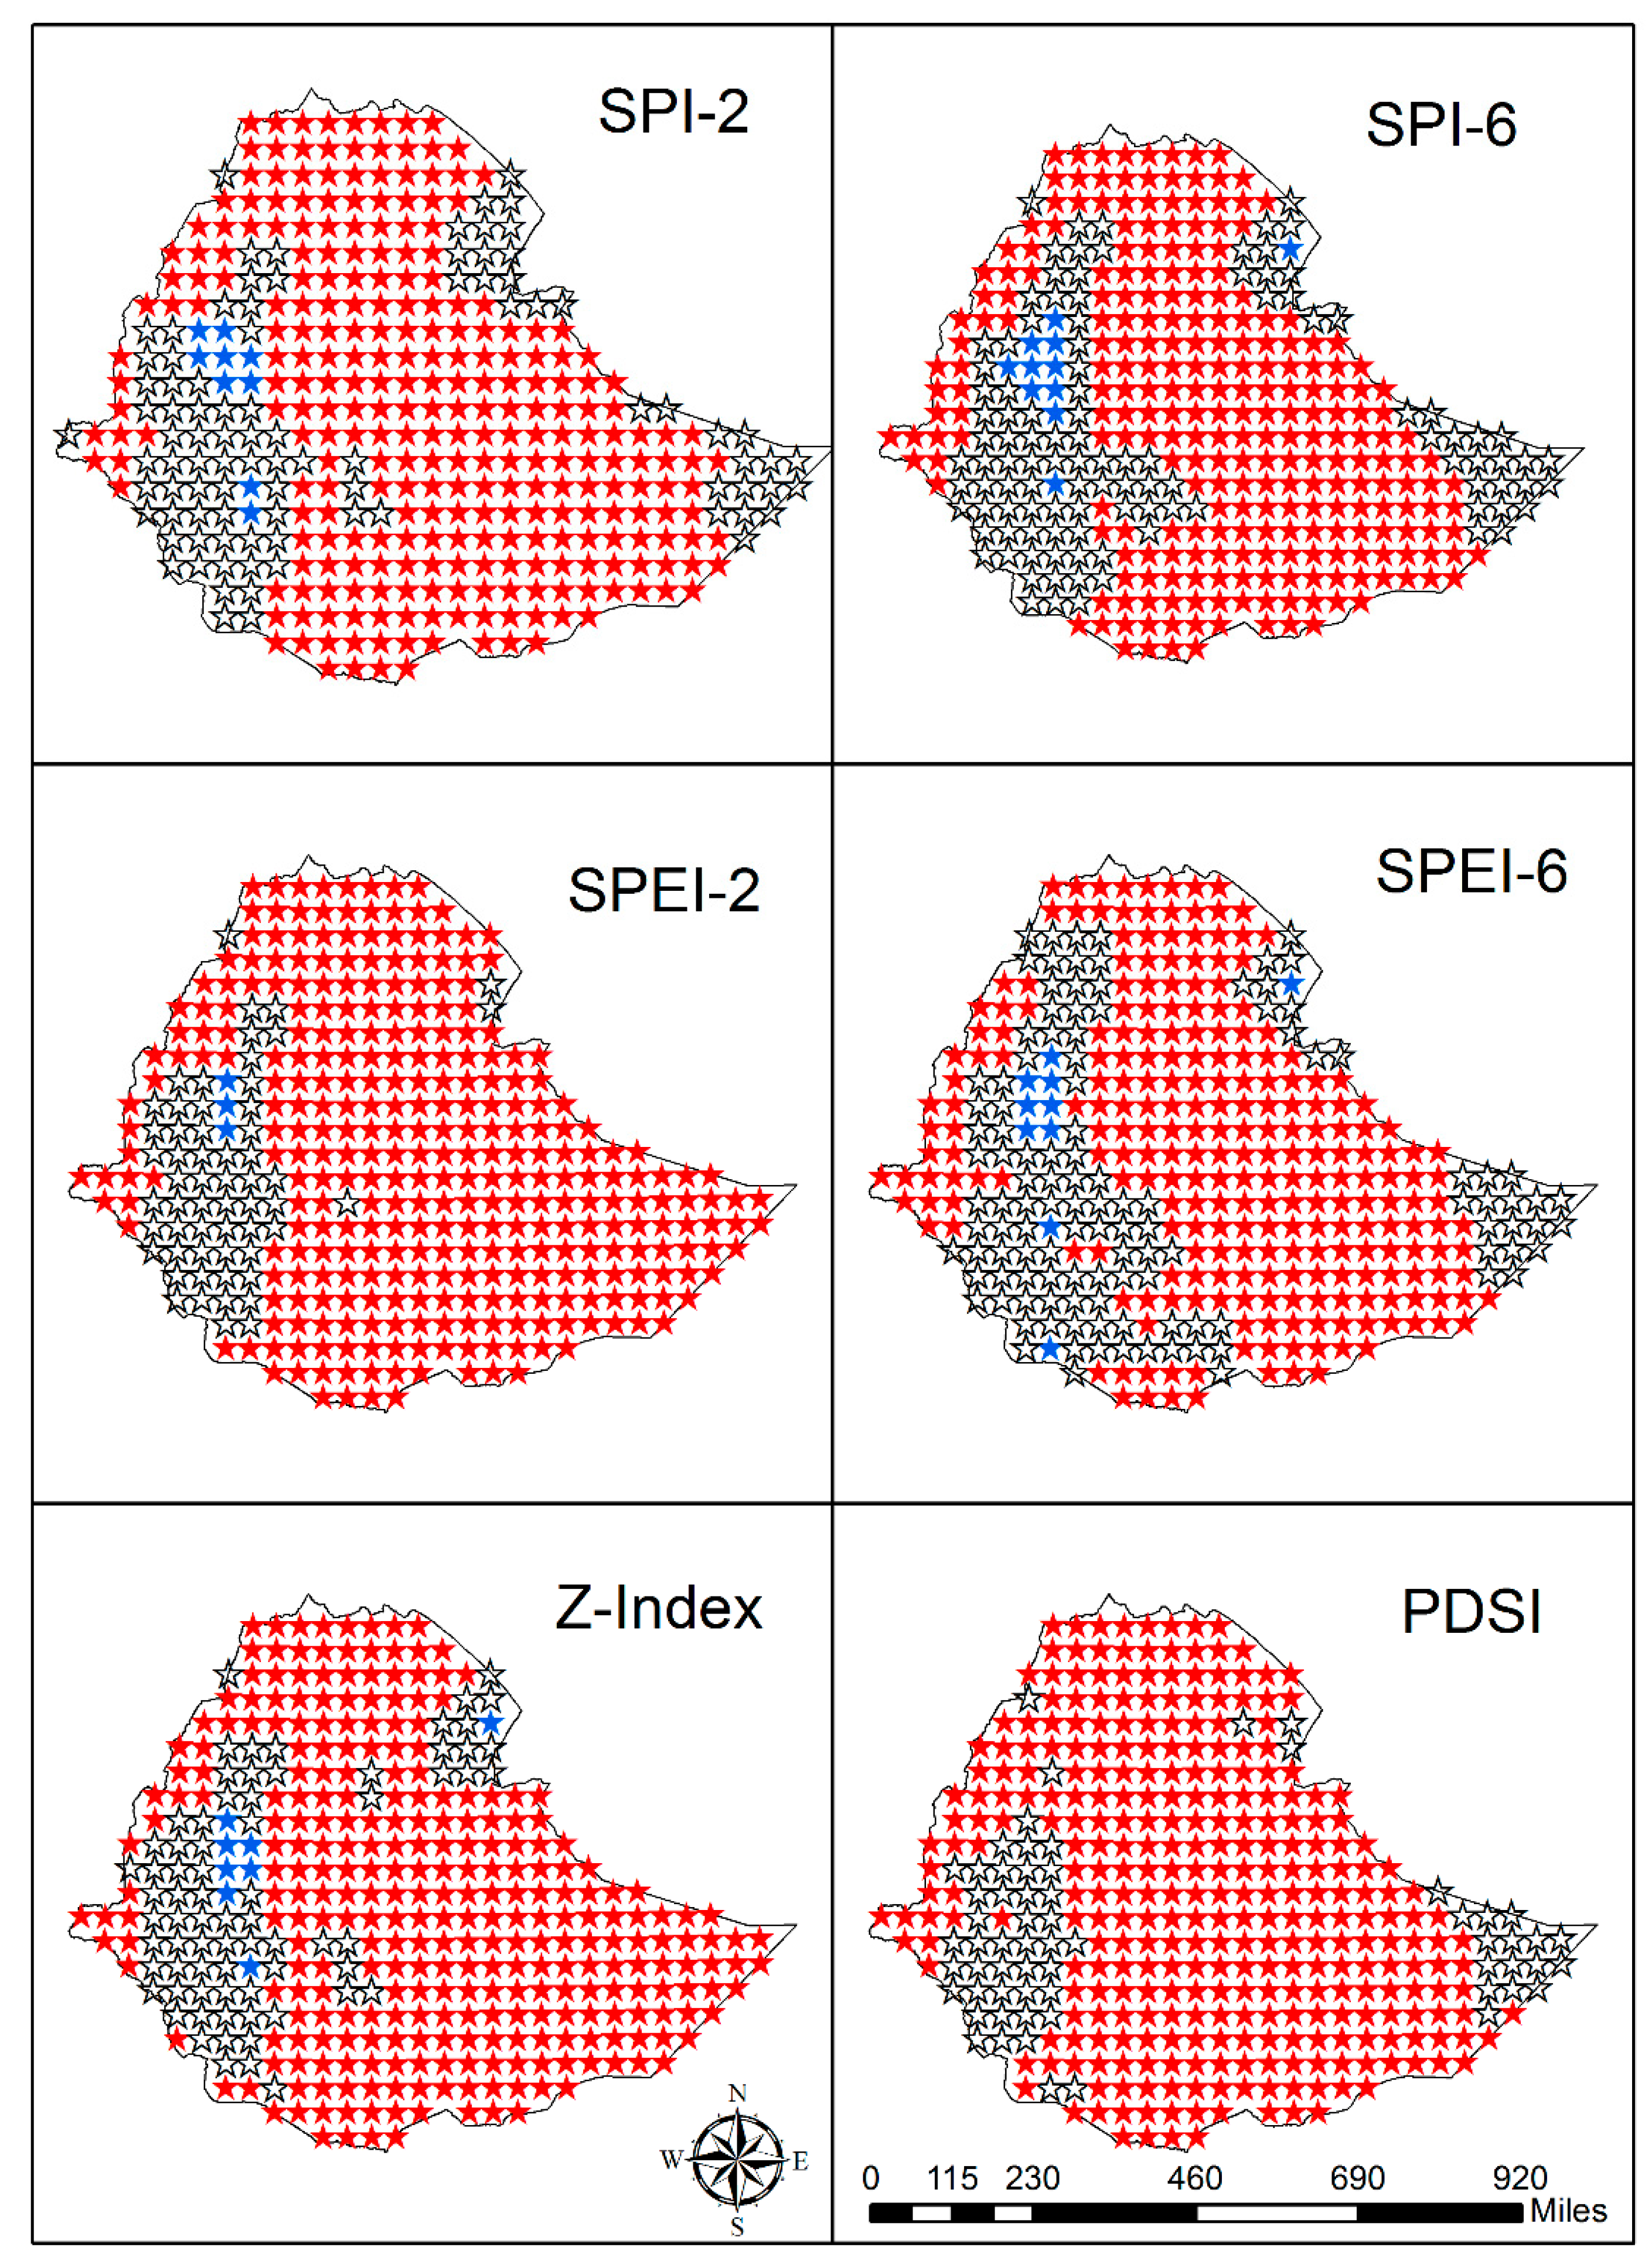
Figure 3 depicts the century-scale drought trends during the Bega season across Ethiopia. The left panel depicts short-term (intraseason) drought trends captured using SPI-2, SPEI-2, and Z-index, while the right panel depicts full season effects captured using SPI-6, SPEI-6, and PDSI. Declines in rainfall (increased meteorological droughts) can be seen in southeastern and northwestern portions of the country. Decreased meteorological drought intensities or increased rainfall can be at some locations in the east. The null hypothesis of no drought trend could not be rejected over much of the southwestern and northeastern as well as western portions of the nation. Bega rains are critical in the central portions of Ethiopia, and the short-term meteorological droughts have either not changed or decreased in the west-central portions, while statistically significant (0.05 significance level) increasing trends can be seen in the east-central sections of the country.
Many locations that have a wetting SPI-2 trend either have no trend or exhibit drying trends for SPI-6, which accumulates more of Meher and Belg rainfall. This result appears to indicate that some of the noted increased wetness could be attributable to shifts in rainfall patterns. In a similar vein, there are a greater number of wetting trends noted with SPEI-6 than SPEI-2. This result points to likely drying in the winter months (October–January), which is dampened over longer accumulation periods. The PDSI is the most aggressive indicator in terms of predicting long-term agriculture-related droughts. The Z-index does not point to significant wetting trends, nor is it able to discern negative trends in the southeastern portions of the country. SPEI-2 appears to exhibit slightly better statistical power in discerning short-term agricultural droughts in this region for the Bega season, indicating the importance of temperature on moisture deficit conditions in this mostly dry season.
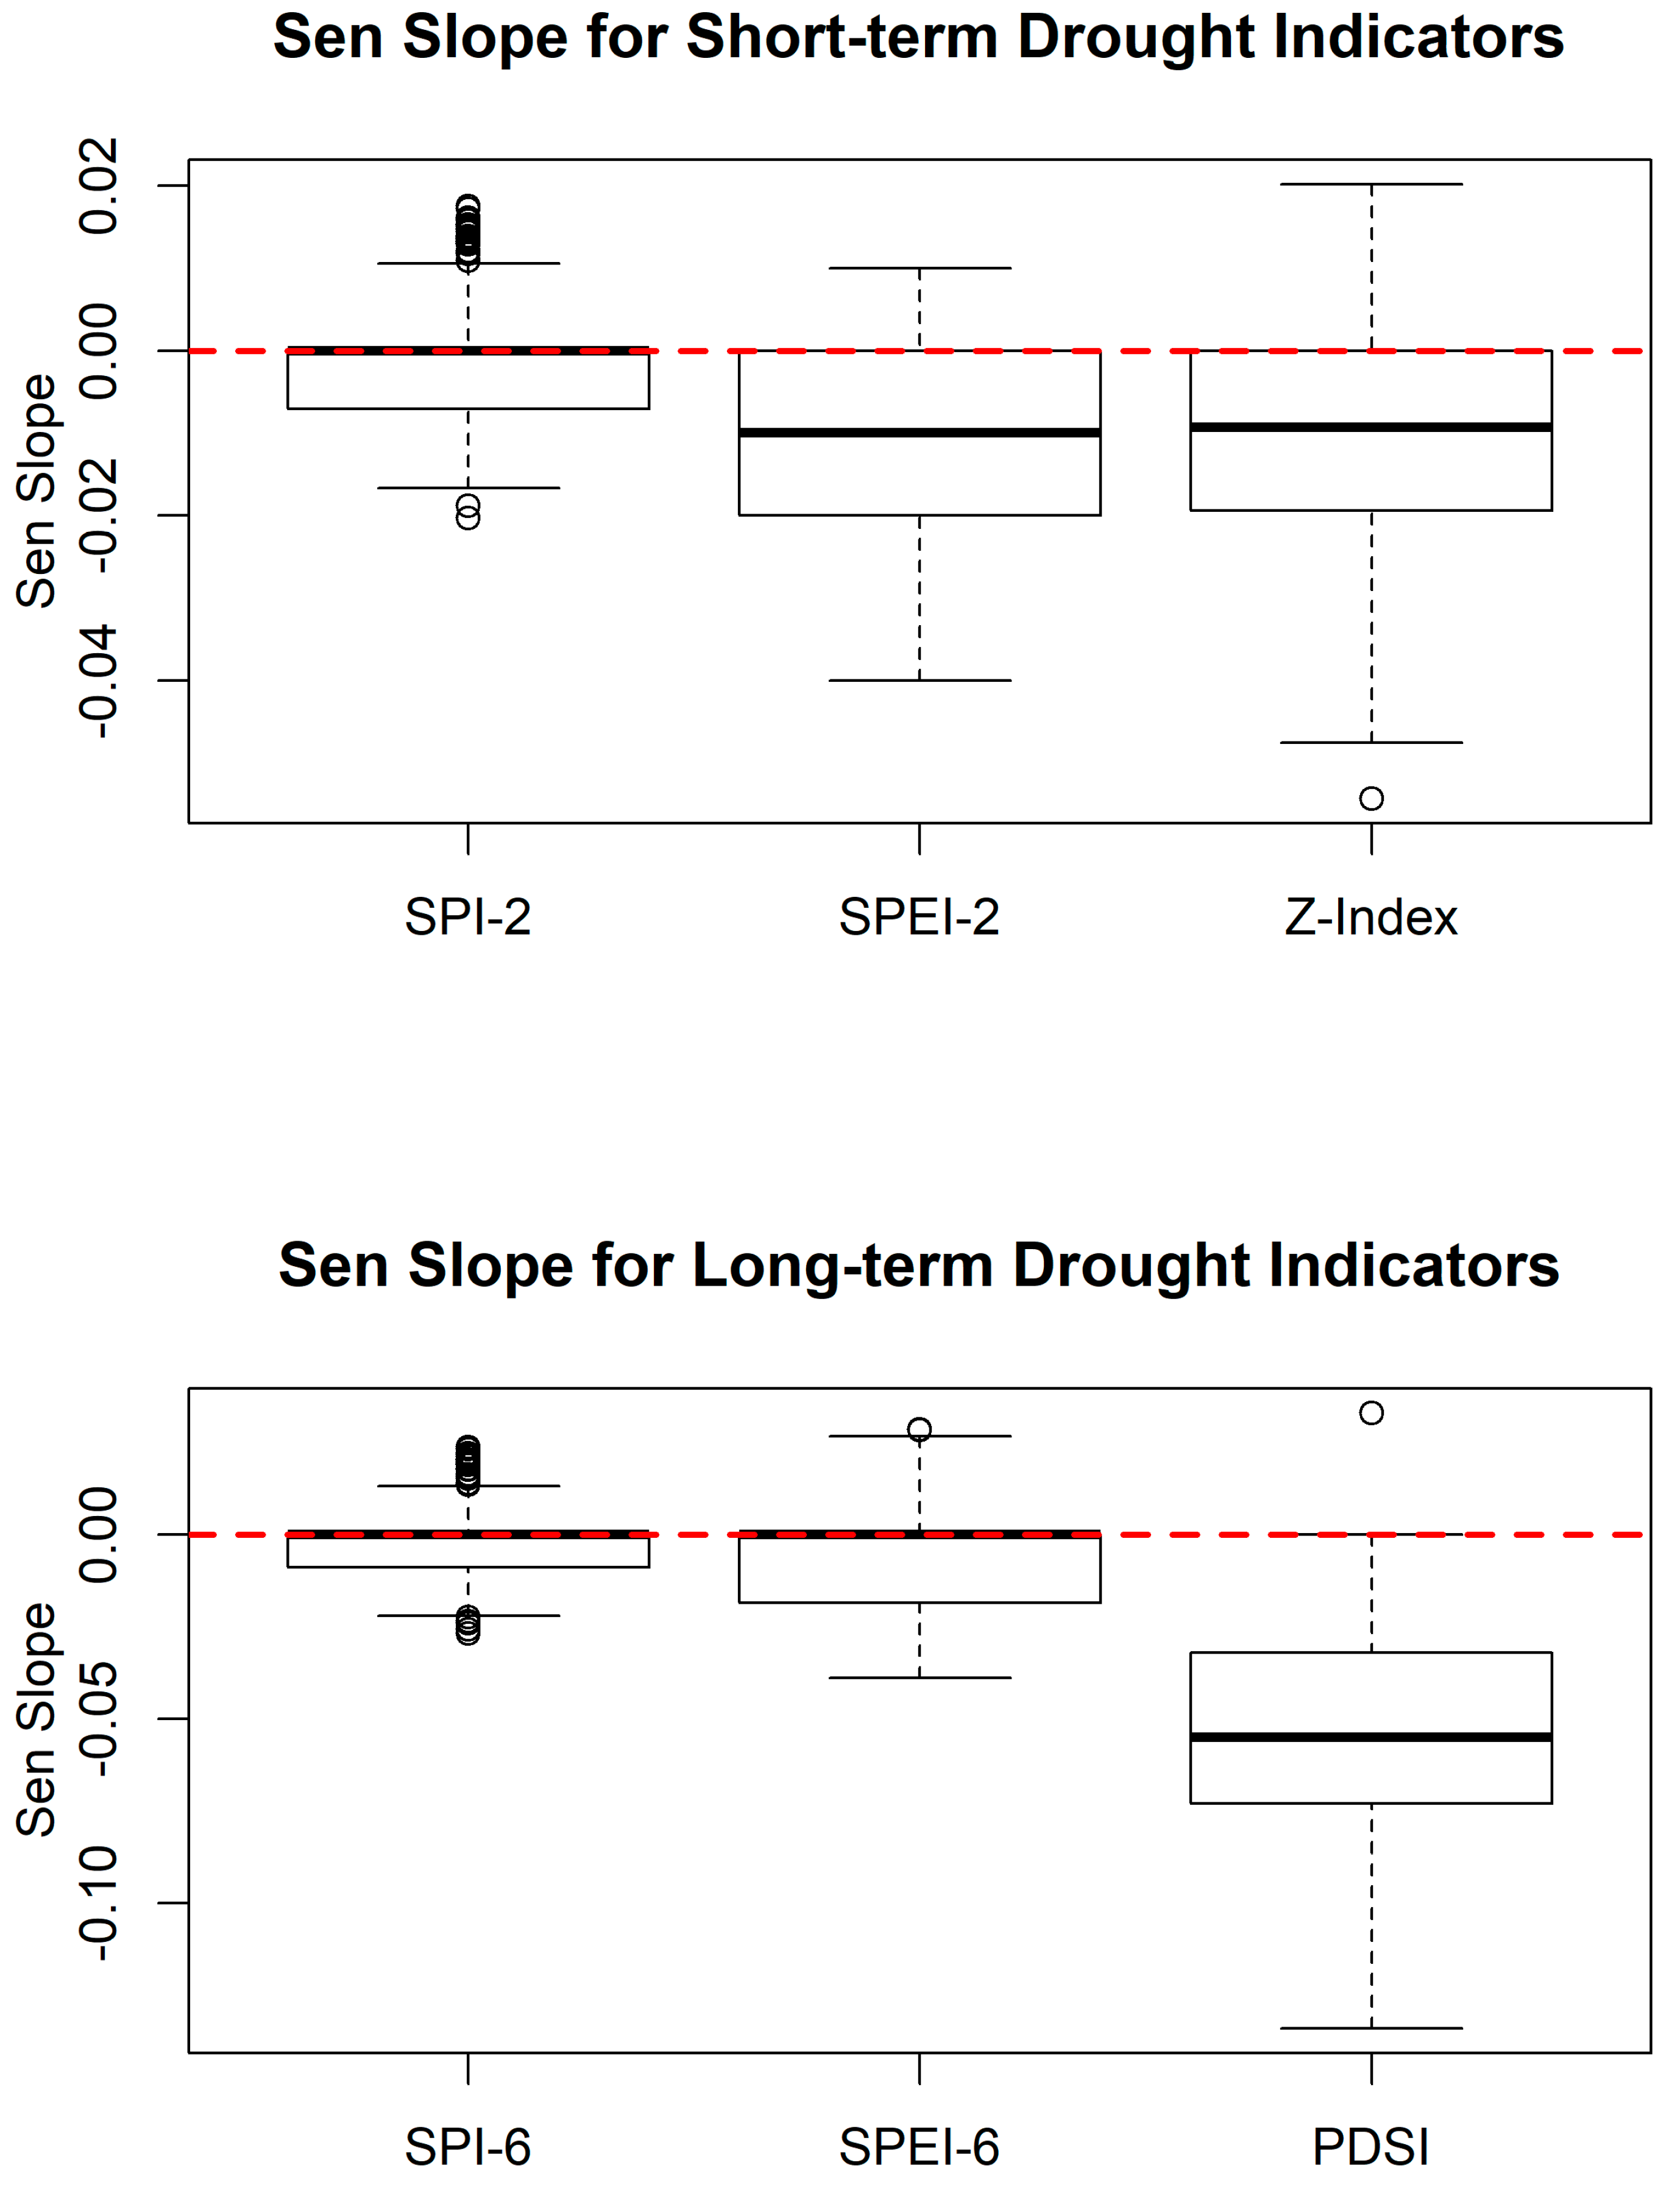
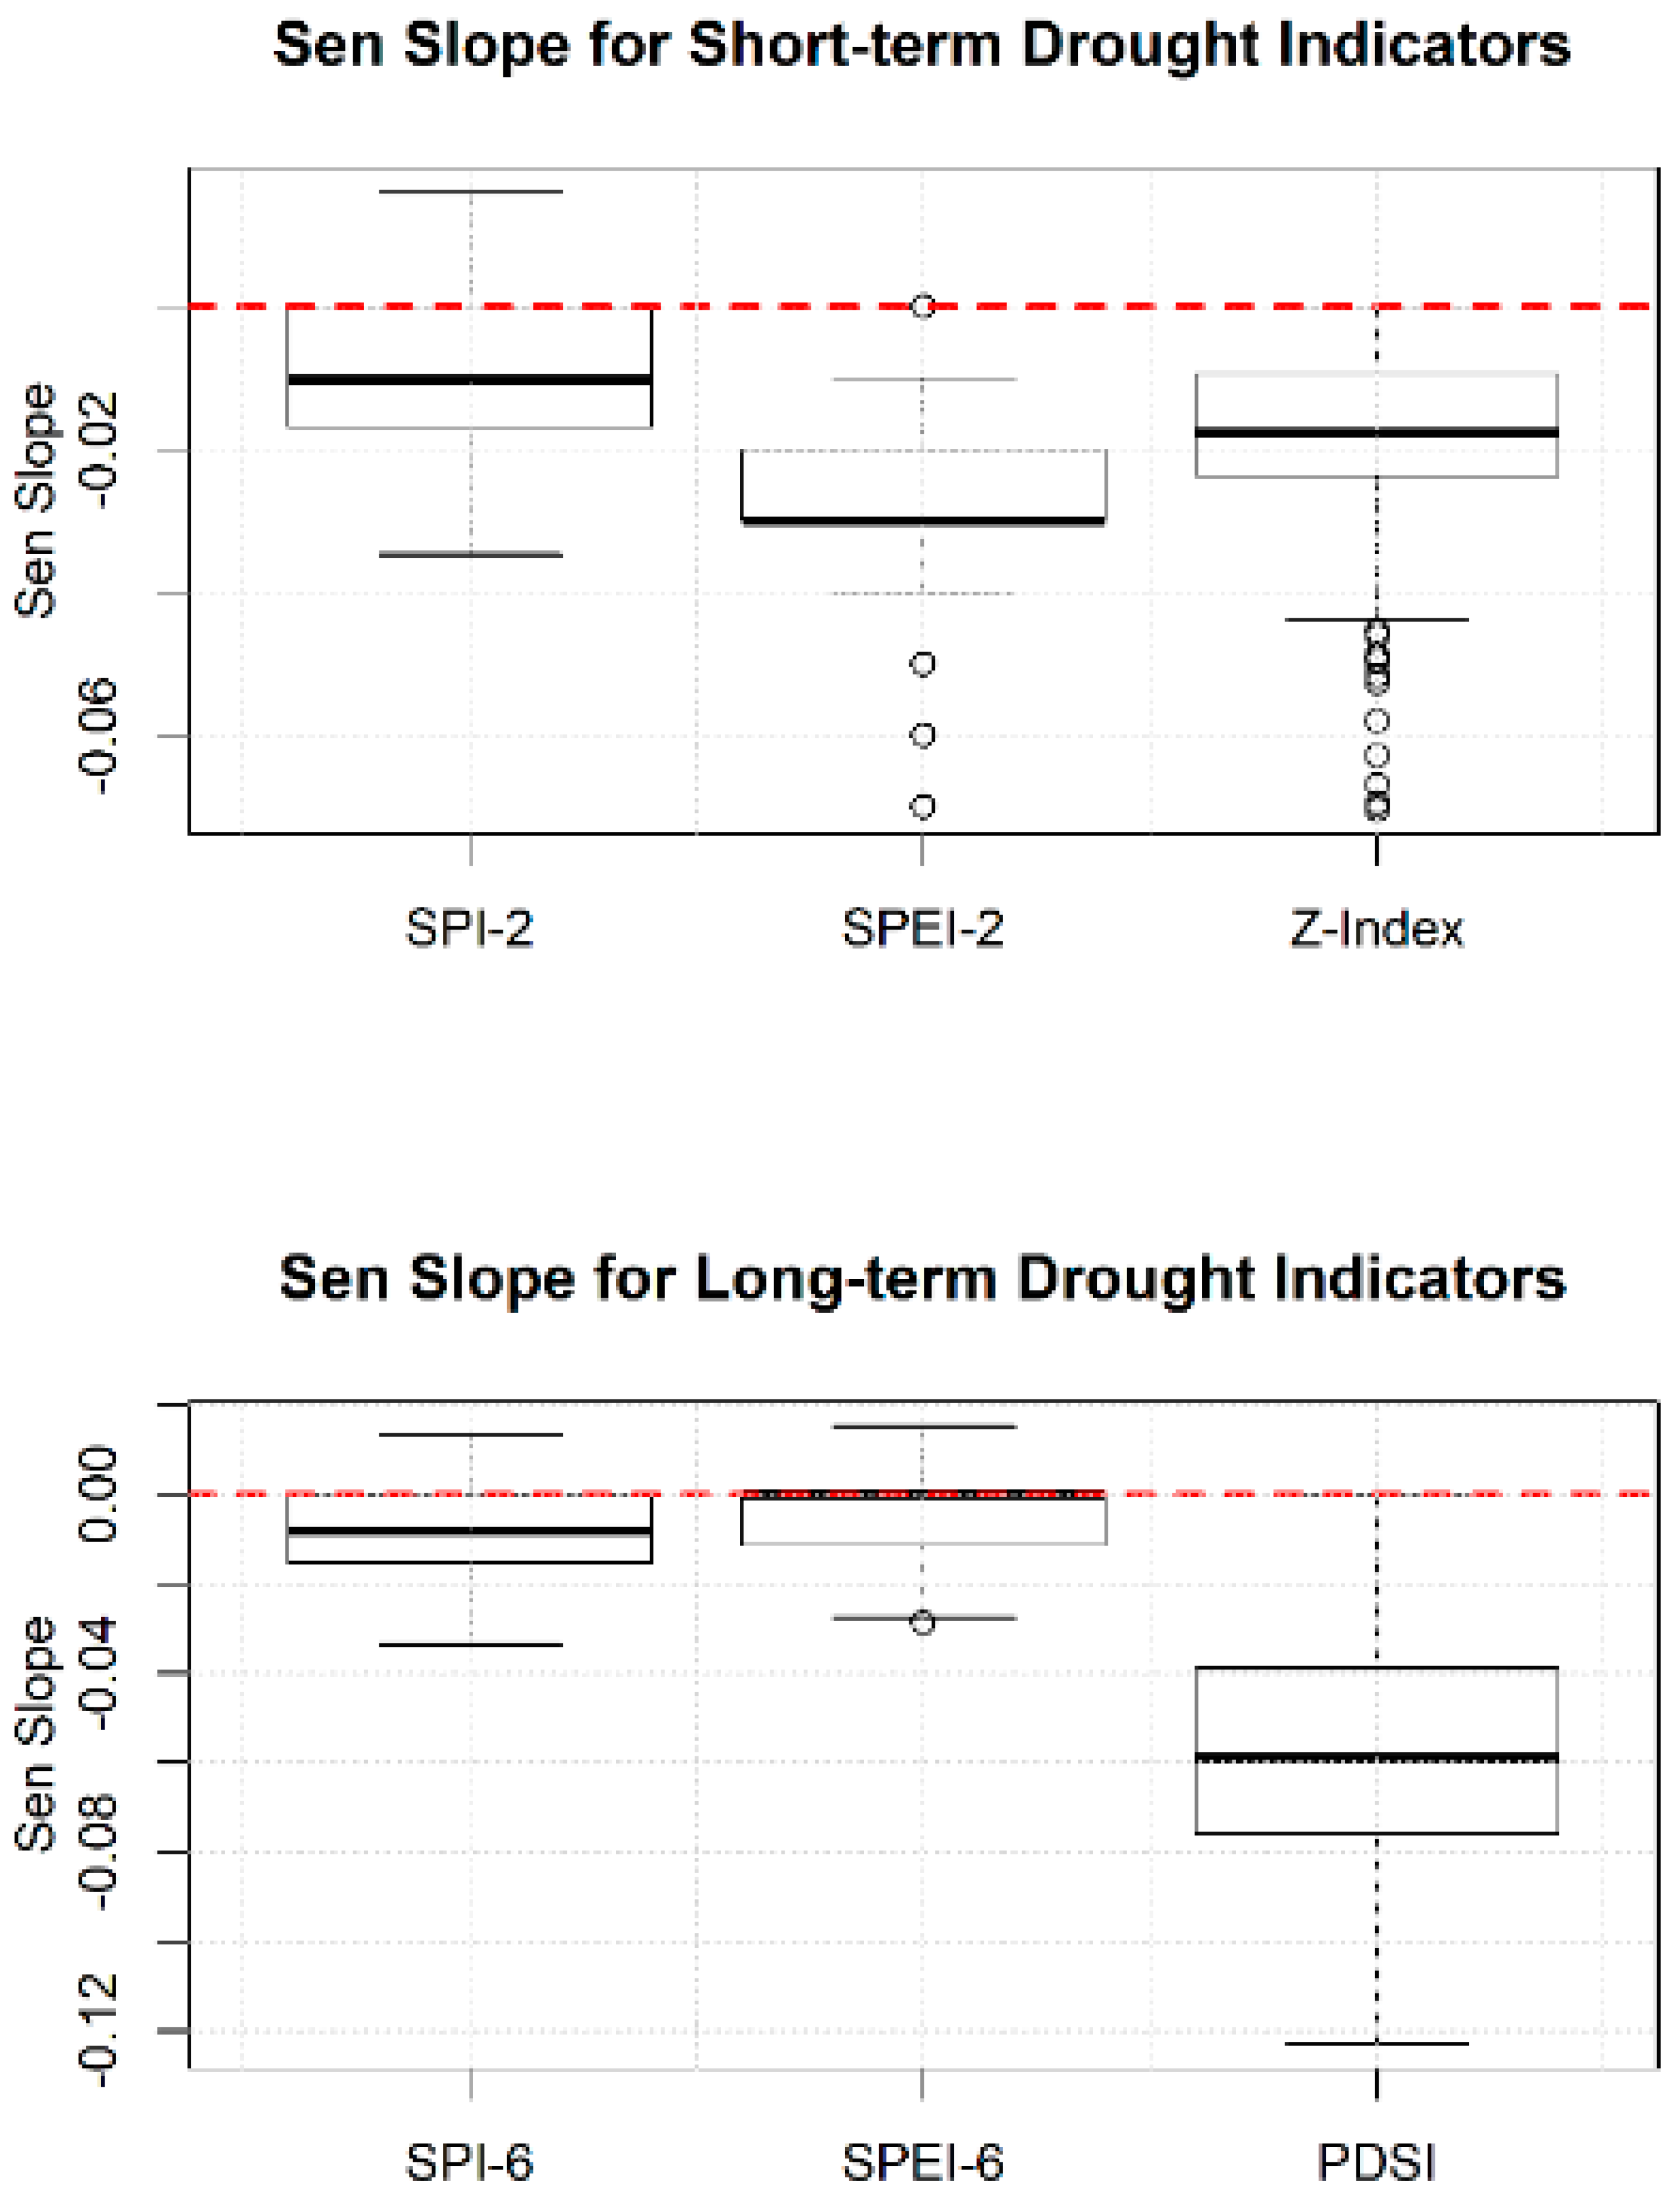
The magnitude of the observed trend is important to evaluate the rate of progression of observed wetting and drying phenomena. Figure 4 depicts the Sen’s slope values for different drought indictors for Bega season. The Sen slope was set to zero when the null hypothesis of no trend could not be rejected. Figure 4 shows that the median magnitude of the Sen’s slope was ~0.005 drought units (DU)/year for SPI-2 and ~0.01 (DU/year) for SPEI-2 and Z-Index. At least 75% of the locations exhibited a drying rainfall trend, and this number increased considerably for SPEI-2. While Z-index is not as aggressive as SPEI-2 in identifying drying trends, the rate of drying for Z-index exhibited a much larger variability and was sometimes more intense than SPEI-2. The results suggest that rainfall-reduced dryness is increasing at a rate of 5% per decade, while the drought intensification rate is about 10% per decade when both rainfall and evapotranspiration effects are considered. This result implies that temperature increases roughly doubles the intensity of rainfall declines for short-term (intraseasonal) droughts during Bega.
The long-term wetting and drying trends produced a vastly different picture than short-term drying effects. The median rainfall-related drying intensity was much smaller, ~0.001 DU/year, for SPI-6 and only slightly higher for SPEI-2. PDSI on the other hand exhibited a strong drying intensity of ~0.05 DU/year (5% increase in dryness per year). This result indicates that while surficial dryness arising due to increased atmospheric temperature may not be significant for longer accumulation periods (SPEI-6), it does have a considerable effect on the hydrologic soil water balance as conceptualized and computed using PDSI. The long-term PDSI-based drying trends occur at an alarming rate. As PDSI is a long-term indicator, the results indicate that moisture-holding compartments (e.g., soil moisture) have very little resilience to combat the impacts of reduced rainfall and increased temperature. Accurate soil moisture measurements are critical to rigorously validate the trend projections of PDSI, and the absence of soil moisture networks is a major limiting factor to assess drought impacts on agriculture systems in Ethiopia [58].
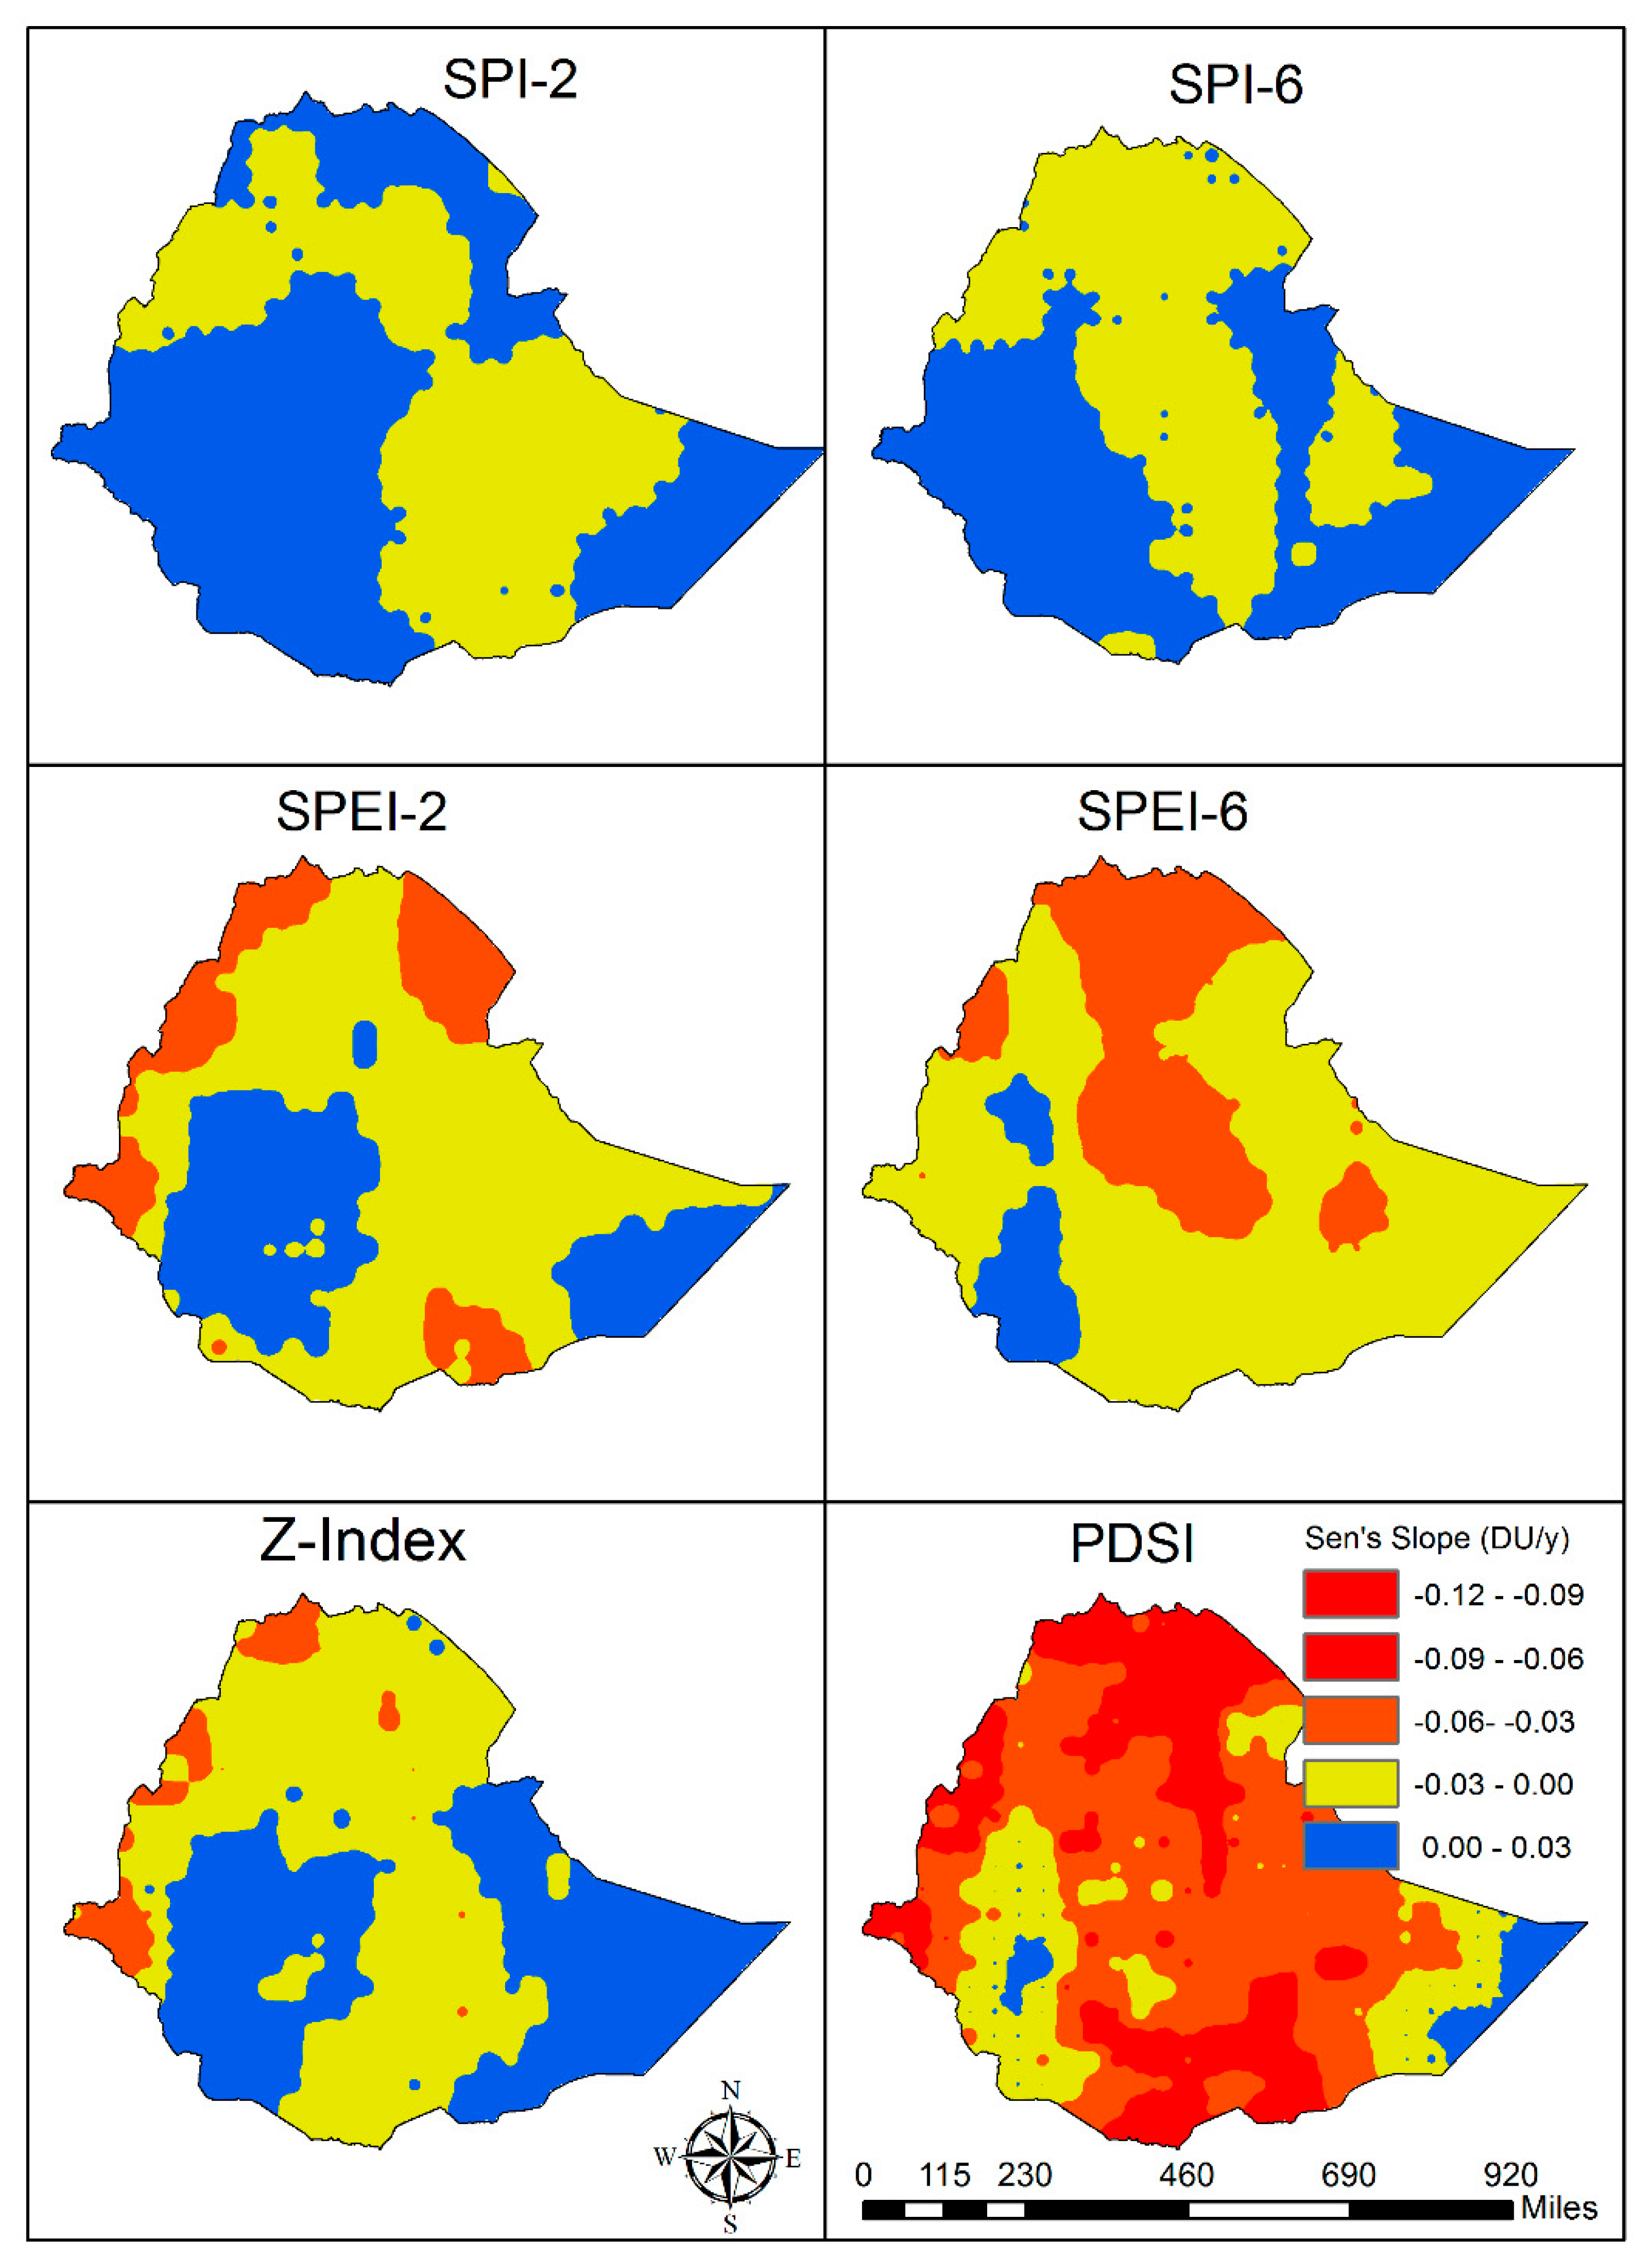
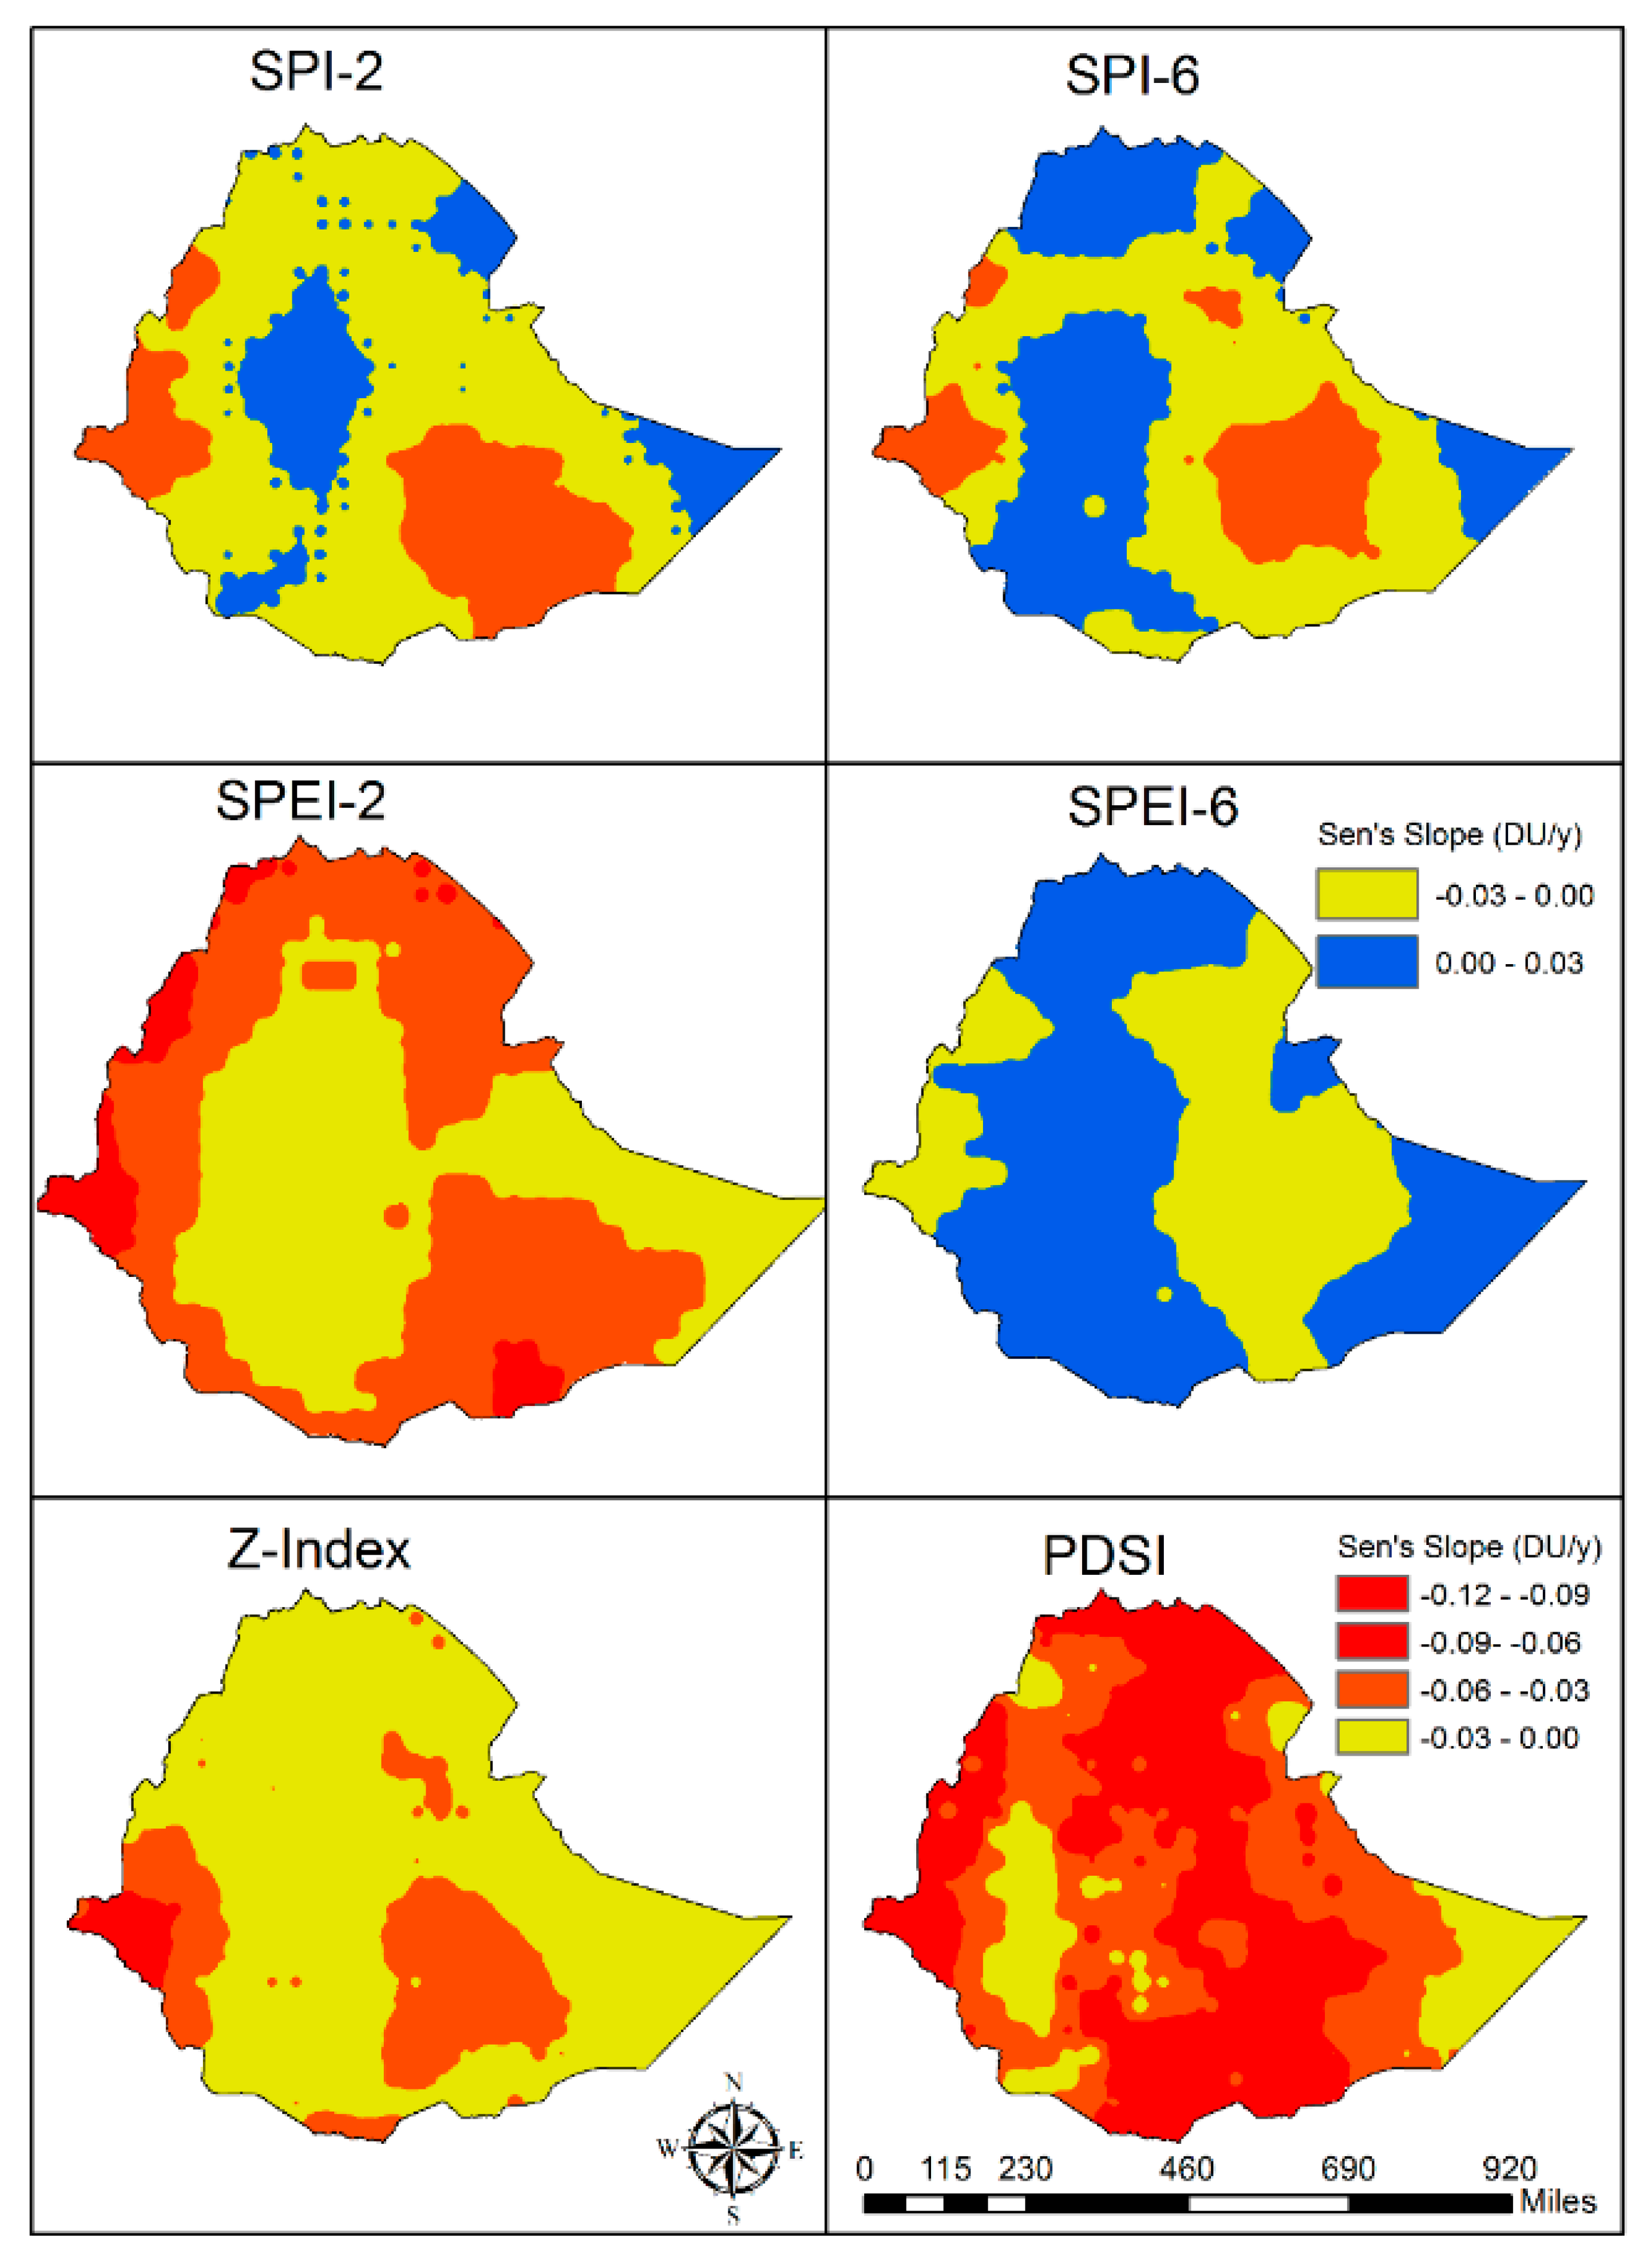
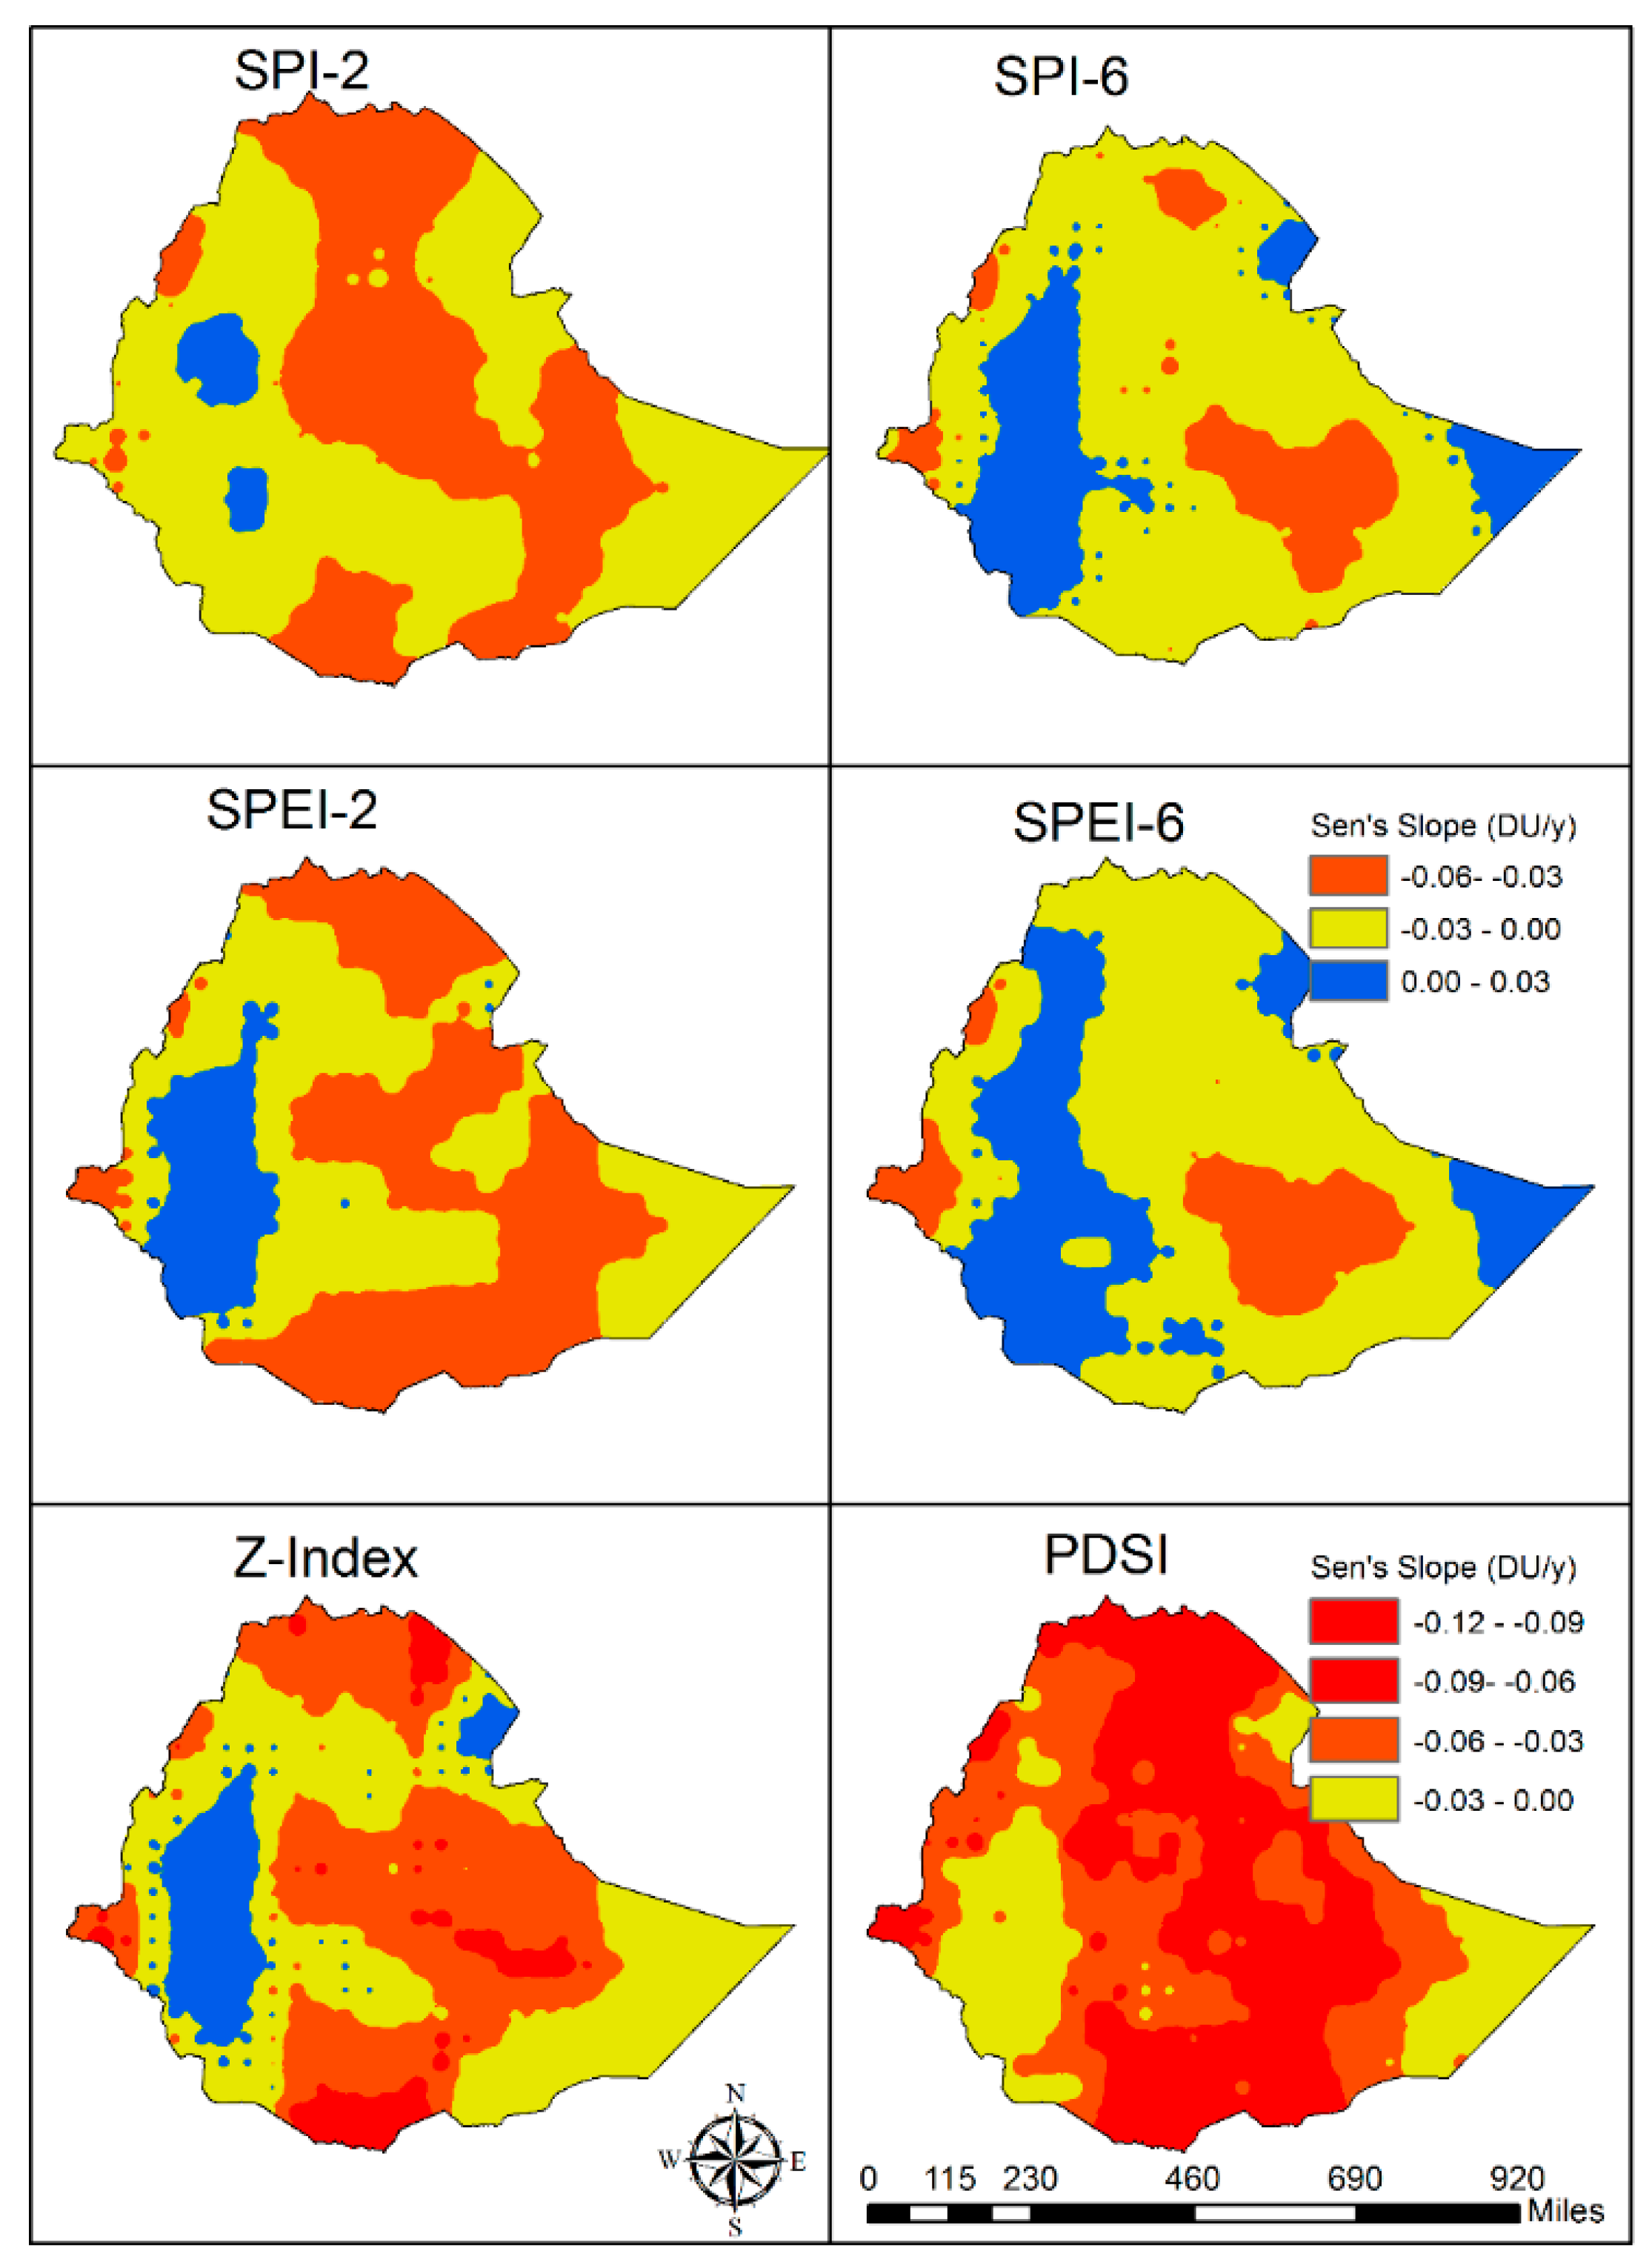
As to be expected, the magnitudes of wetting and drying trends also exhibited considerable spatial variability (see Figure 5). The north and north-central portions of the country experienced the highest rate of drying intensity compared to eastern and western portions of the country. Short-term Bega rainfall deficits (as denoted by SPI-2) appeared to transition from a wetting to a drying trend moving west to east across the Rift Valley. It can also be seen that the trend variability was not uniform across the indicators, with PDSI and Z-index showing much different trends than SPI- and SPEI-based indicators. This result highlights the fact that a single indicator does not provide a complete picture of the droughts during Bega.
4.2. Trends across Ethiopia during Belg Season
Figure 6 indicates that drying trends were most prevalent during the Belg season, especially in comparison to the Bega season (Figure 4). Belg rainfall results from easterly and southeasterly winds, which bring considerable rainfall to eastern and southeastern parts of the country. Again, for short-term droughts, SPEI-2 provided the most aggressive trend detection (mostly drying trends) compared to SPI-2 and Z-index. For seasonal droughts, PDSI predicted drying trends over a much larger spatial extent than other long-term drought trend indicators (SPI-6 and SPEI-6), highlighting the important role of long-term hydrological processes in defining agricultural drought trends.
A comparison of SPI-2 and SPEI-2 indicates that many areas where SPI-2 (rainfall) had discerned no trend appear to show declining trends under SPEI-2, indicating that increased temperature is likely an important mechanism for controlling intraseasonal droughts. However, as declining SPI-2 (rainfall) trends can be seen across Ethiopia, rainfall declines during this season also exert a considerable amount of influence on short-term droughts. The SPEI-6 showed lesser drying trends and even some wetting trends compared to SPI-6. The small section in the northern portion where SPI-6 showed a wetting trend is masked by temperature effects of SPEI (resulting in no SPEI-6 trends in that area). However, some areas where rainfall has not changed (no trends in SPI) were marked as positive (wetting) trends by SPEI-6, especially in the south and south-central portions of Ethiopia. This result points to increased humidity and cloud cover that do not necessarily translate to rainfall. The moisture in the atmosphere is unable to condense into rainfall, but its presence reduces the evapotranspiration, which results in a wetting trend in SPEI but not in SPI.
As was the case with Bega (Figure 3), the Z-index and PDSI exhibited drought patterns that were considerably different from SPI and SPEI during Belg (Figure 6). While Z-index may be somewhat buffered by soil moisture storage in some pockets of the country (where no trends are detected), the PDSI trends indicated that this storage is short-lived and not sustained over the entire growing season due to the effects of hydrological processes that remove water from the soil column, once again pointing to the limited resilience of the soil moisture storage pool in the country.
From an agricultural perspective, the Belg season is important for growing tef (Eragrostis tef), which is a staple food in the Ethiopian diet. Empirical evidence of farmers unable to harvest their crops during this season has been discussed by Rossel and Holmer [59] and supports the drying trends noted here. As tef grown during Belg is mostly consumed internally, droughts during Belg have profound implications for the food security and livelihoods of Ethiopia. Furthermore, if the production of tef is shifted to the longer Meher season, the growth of high-valued (export-oriented) crops comes under threat, affecting the economic viability of the nation, which depends extensively on agricultural production.
Rainfall during the Belg season is also important for long-cycle crops (e.g., corn, sorghum), which are planted in the Belg season but harvested in Meher. Droughts during Belg, particularly in the latter parts of Belg season, affect the planting of these long-season crops. Shifts in planting often have cascading effects on overall plant growth and crop yields. Shifting of planting dates can result in critical growth stages (e.g., grain-filling) to occur during drier parts of Meher when there is insufficient moisture in the soil to meet plant water demands. Strong correlations between Belg droughts and yields of long-cycle crops have been noted even when the Meher season was noted to be normal [60].
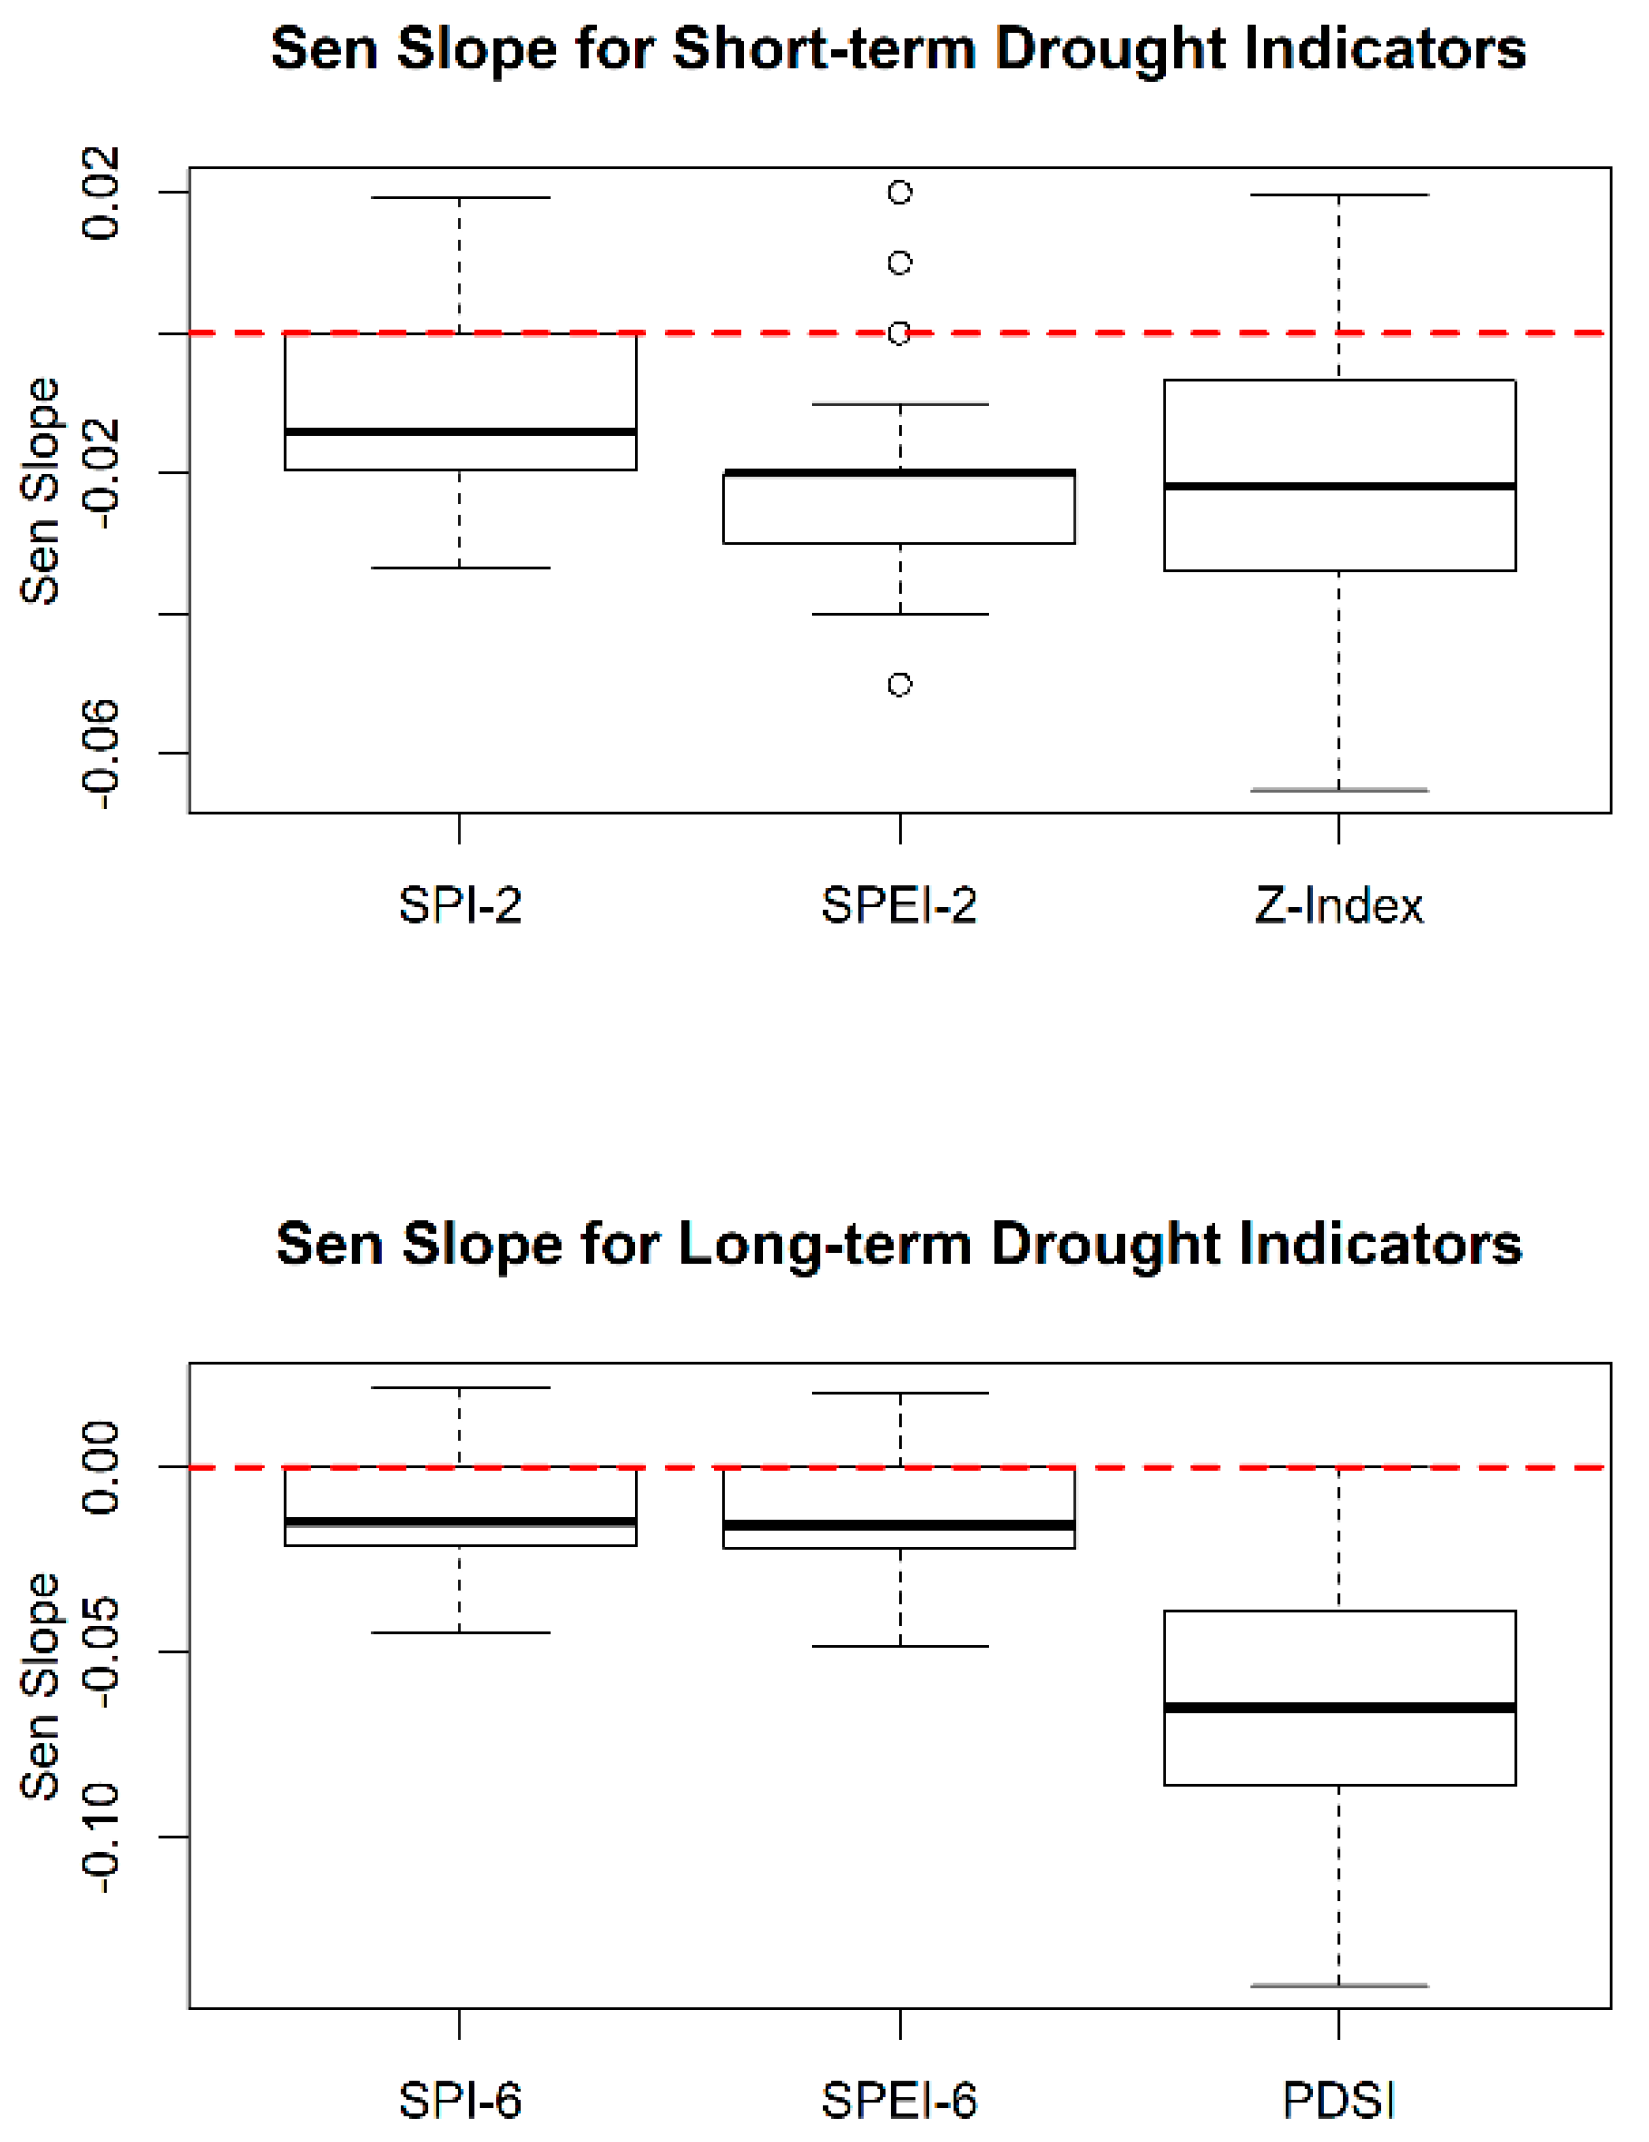
The Sen’s slope values were much higher in magnitude when compared to Bega season. The median drop rate was ~0.01 DU/year for SPI-2, ~0.03 DU/year for SPEI-2, and ~0.02 DU/year for Z-index (see Figure 7). The intraseasonal drought indicators changed (declined) on average by 10%–30% over a decade. Again, the changes in SPEI-2 were 3 times that of SPI, which suggests that temperature-induced soil drying has a far greater influence than rainfall reductions. The comparison of Z-index and SPEI-2 points to some short-term buffering, which is, again, not sustained over the long-term as evidenced by the declines in PDSI.
The changes in SPI-6 (~0.01 DU/year), SPEI-6 (~0.00 DU/year), and PDSI ~0.06 (DU/year) were noted. The median changes in short-term and long-term SPI were roughly the same, but with an improvement in SPEI over the long-term possibly from the decrease in evapotranspiration in the northern parts of the nation. PDSI changes were most drastic when compared across indicators, indicating the key role of slower hydrologic processes (baseflows, exfiltration, deep percolation) on soil moisture dynamics. The declines in rainfall during Belg, especially in relation to Bega, stood out, and the declines in rainfall played a much greater role in defining agricultural droughts in this season.
The variability of Sen’s slope for various drought indicators during the Belg season is shown in Figure 8. Areas along the eastern border (Sudan and South Sudan) generally saw increased dryness in both short-term and long-term trends. This drying along the Sudan border will likely exacerbate the already existing scarcity of water resources and associated conflicts, especially the sharing of transboundary rivers such as the Blue Nile between Ethiopia and her neighbors. Increased dryness can be seen across the east central portions, again, across all indicators, albeit with different intensities. This area includes cities such as Dira Dawa and Dolo Odo, which are critical for the development of eastern Ethiopia. All in all, both meteorological and agricultural droughts have increased over the last century. This declining trend in conjunction with a rapidly increasing population and limited irrigation systems has profound implications on the future food security of the nation and highlights the need for improved irrigation systems to build resilience into Ethiopian agricultural systems.
4.3. Trends across Ethiopia during Meher Season
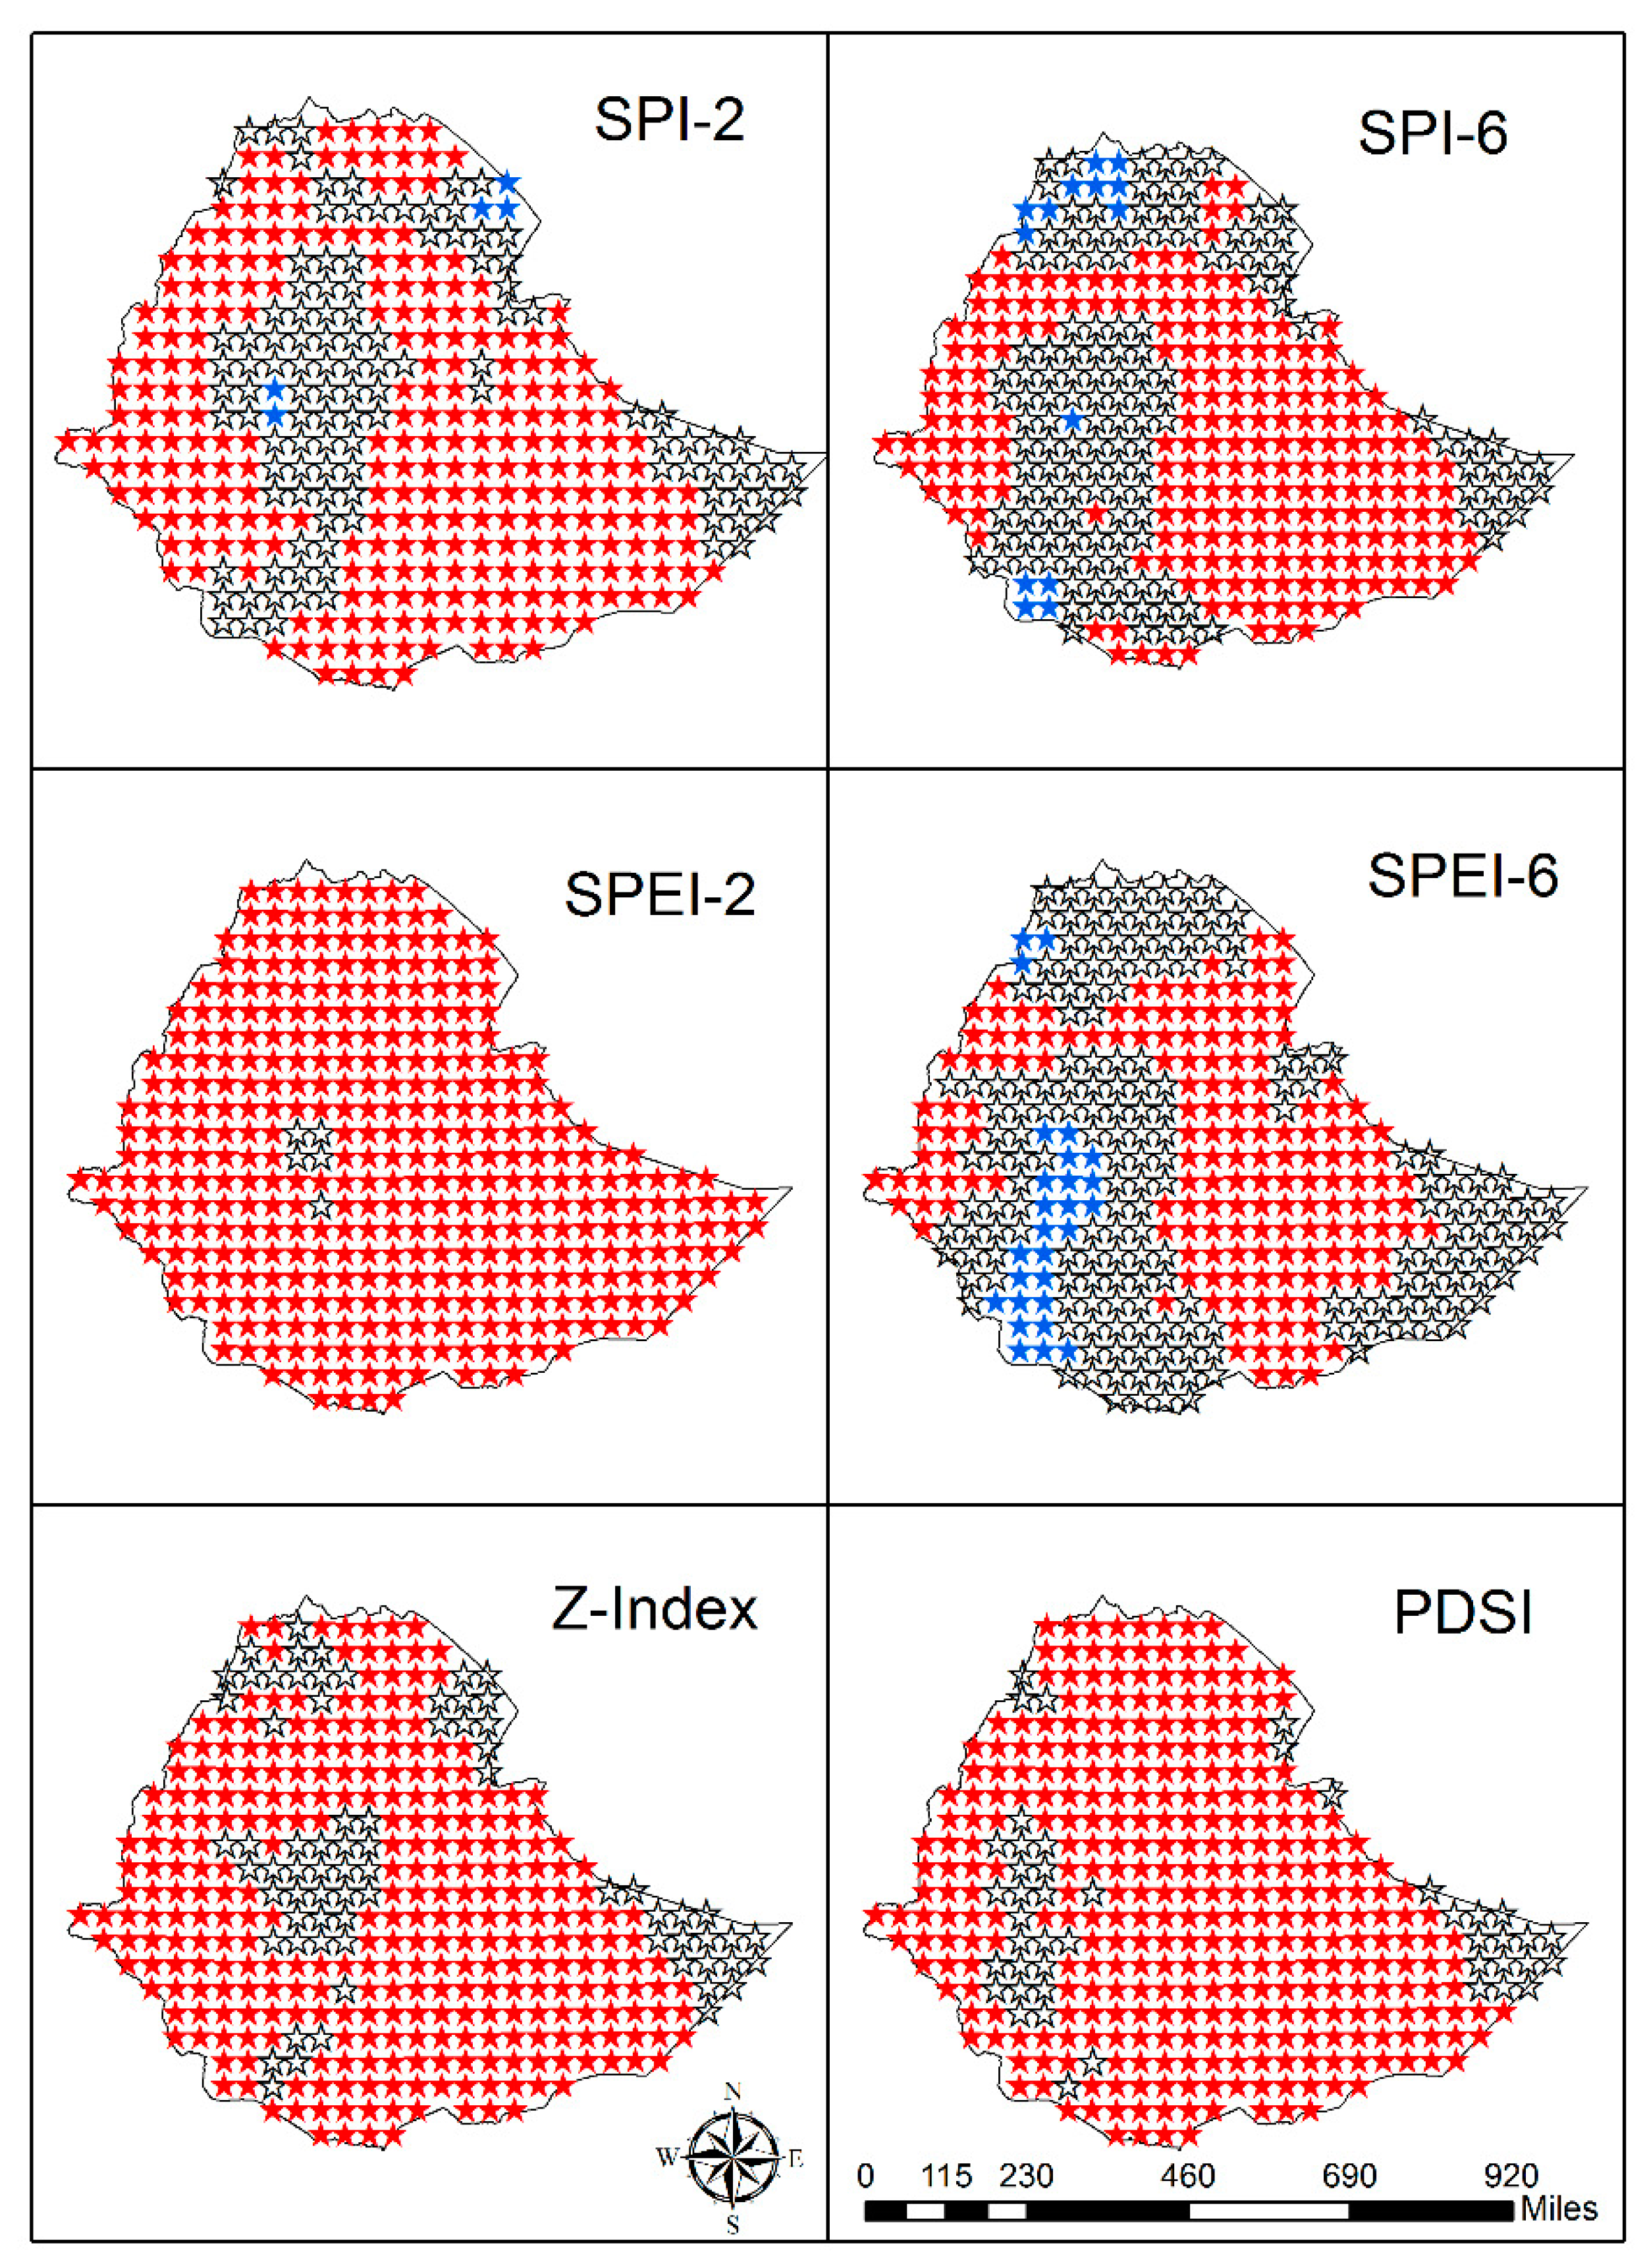
Rainfall during Meher season is caused by the convergence of low-pressure systems and the intertropical convergence zone (ITCZ). This is the main rainy season across most of Ethiopia where the majority of crops are grown. Figure 9 shows the trends of various drought indictors across Ethiopia during the Meher season. Again, significant drying trends, both from rainfall declines as well as seasonal warming, could be seen over large parts of the country. A few locations did exhibit increasing rainfall trends (see SPI maps), which was dwarfed by changes in seasonal temperature (see SPEI maps). Warming effects could be noticed both in short-term and long-term drought indicators. Again, SPEI-2 was the most aggressive of all short-term drought indicators, while PDSI exhibited the greatest sensitivity to predicting long-term droughts. As rainfall during this season is mainly derived from ITCZ, the narrowing of ITCZ noted over the last century [61] explains some of the noted increased dryness. Seleshi and Zanke [12] also indicate that warm El Niño–southern oscillation (ENSO) episodes correlate well with declines in June–September rainfall over the Ethiopian Highlands.
The magnitude of median Sen’s slope was ~0.018 DU/year for SPI-2 and around 0.02 DU/year for SPEI-2 and Z-index, indicating that temperature changes exacerbated the dryness induced by rainfall declines for most parts of Ethiopia, but the difference was not as pronounced during the Meher season (Figure 10). For long-term droughts, SPI-6 and SPEI-6 had a median Sen’s slope of ~0.01 DU/year, while PDSI had a value of about 0.06 DU/year (see Figure 10), indicating a 1%–6% increase in dryness on average across the country comparable to noted changes in Belg. The short-term dryness observed during the Meher Season is dampened by rainfall from other seasons, which factor in long-term meteorological and agricultural drought calculations. Comparison of short-term drought indicators of Meher (Figure 11) against those during Bega (Figure 3) appeared to indicate that some areas that exhibited declining trends during Meher exhibited increased SPI-2 during Bega, likely pointing towards shifts in late-season rainfall of Meher into Bega. As Meher is the major rainy season, which accounts for more than 50% of the annual rainfall of the country, even small changes in trends can imply significant changes in terms of rainfall declines. Funk et al. [17] reported 50–150 mm declines in Kremit (Meher) rainfall over the last 50 year period, which is consistent with the estimates of this study and represents a significant proportion of water needs for many crops that are grown during the Meher season.
Short-season, cereal crops such as barley, teff, and wheat are extensively grown during the Meher season, especially by small landowners. The cereal production during Meher accounts for over 90% of the total cereal production of the nation [62]. These crops typically reach grain-filling stages during the October–December timeframe. Availability of soil moisture is critical during this period to maximize crop yields. The noted shifts in late-season rainfall from Meher to Belg or even within Meher, therefore, can have devastating impacts on short-season rainfed grain production in Ethiopia. Crop failures due to lack of moisture during grain-filling stages have been documented through field observations during drought years [63]. Corn (Zea mays) production is particularly sensitive to droughts because of its relatively high water requirements and sensitivity to moisture deficits over much of its growing cycle [64]
Sorghum (Sorghum bicolor) is often viewed as a drought-tolerant, long-season crop that can be produced even in areas with marginal soil quality in Ethiopia. Sorghum production is, therefore, important to sustain food security of the nation [65]. Sorghum is the second most important cereal crop after tef [66]. Empirical evidence, however, suggests that rainfed farming of sorghum is vulnerable to droughts. In Ethiopia, sorghum is mostly grown as a long-season crop and is planted late in Belg and harvested near the end of Meher; therefore, its yield can be affected by droughts in both these seasons. As with other cereals, droughts during the grain-filling stage have been shown to critically affect sorghum production [66]. Recent research has indicated that droughts during the early part of Meher (June/July), when sorghum plants are in rapid growth stages, can also have a serious impact on crop sustainability and yields that cannot be compensated by rainfall at other times [67].
Farmers in Ethiopia generally recognize the robustness of sorghum to withstand dry conditions, especially in comparison to other cereal crops. They also know that the crop yields are sensitive to water deficits during critical growth stages and, therefore, tend to use indigenous drought-tolerant landraces that tend to mature early but generate lower yields [66]. Nearly all of the cultivable land has been exploited and put into production in Ethiopia [68]. Therefore, increased food production is only possible by increasing crop yields. Adaption of low-yielding, drought-tolerant varieties of sorghum may build some resilience for subsistence farmers in Ethiopia, but this is not a step in the right direction to tackle the food security of the nation. There is a critical need to breed cereal varieties that are both high yielding and drought tolerant. Understanding seasonal and intraseasonal trends in droughts is important for this effort [67].
The spatial variability in drought indicators for the Meher season (mapped in Figure 11) again points to the east-central band that runs across the nation. Changes in drought indicators are prominent along the Ethiopia–Eretria border but relatively subdued along the eastern borders with Sudan and South Sudan. Nonetheless, the contributions of the Blue Nile to overall flow of the Nile is over 80% during the Meher season, and even small declines in rainfall trends in the catchment area can have profound implications on these transboundary river systems.
The drying trends noted resulting from rainfall declines and temperature increases in the central parts of the country (37.5° E–42.5° E) place greater risk on agricultural production of the nation, as a large proportion of agricultural lands and rangelands lie in this portion of the country (see Figure 1c). High-valued crops such as corn are grown during this season, and increasing drying trends in major agricultural production regions significantly increases the risk to food and economic security of the nation.
4.4. Closing Remarks
As a rainfall-dependent country, droughts can cause major economic, environmental, and sociopolitical disruptions in Ethiopia. Agriculture is the primary economic driver in Ethiopia, and understanding how meteorological droughts propagate through agro-hydrological systems is of paramount importance. Given most agriculture systems are rainfed, there have been many studies that have evaluated regional trends in the standardized precipitation index (SPI). However, in addition to rainfall, soil dryness (the master variable for defining agricultural droughts) can be caused by increased temperatures as well as other persistent hydrologic processes. Drought indicators that account for both rainfall and temperature effects are, therefore, better suited for quantifying agricultural droughts than those based on rainfall alone. In this study, the standardized precipitation evapotranspiration index (SPEI), the Palmer drought severity index (PDSI), and the associated Z-index are used to characterize short-term (two-month accumulation) and long-term (six-month accumulation) droughts during the three major seasons (Bega, Belg, and Meher) in Ethiopia.
The results consistently indicate that SPEI-2 (two-month accumulation) was the most aggressive drought indicator for characterizing short-term droughts, indicating surficial drying due to increased temperatures are important in characterizing intraseason droughts over much of the country. Intraseasonal droughts over much of the country exhibited declining trends when evaluated on a century-scale (1902–2016). Winter temperatures had a major influence on Bega droughts. Temperature increases further exacerbated soil dryness caused by rainfall declines during Belg, during which many crops are grown for internal food consumption. Declining trends were also noted during Meher but were largely attributable to changes in rainfall more so than changes in temperature. Even small changes in the magnitude of rainfall has a greater impact, as this is the major rainy season over much of Ethiopia.
Long-term (six months) drought indicators typically had a slightly subdued response than short-term intraseason droughts, but similar trends noted over the short-term also manifested in the long-term for the most part. The subdued long-term signals arise because rainfall in other seasons that accumulates in the longer-term droughts help buffer intraseasonal changes. PDSI was noted to be the most assertive drought indicator for long-term droughts, indicating that noted precipitation and temperature declines create delayed but more prominent changes in hydrologic and soil moisture dynamics that other indicators (SPI and SPEI) do not capture fully because of their conceptualization limitations.
Increased dryness trends during Belg were noted along the eastern borders of Ethiopia with Sudan and South Sudan. These changes create additional water scarcity and make transboundary water sharing more contentious. A band approximately between (37.5° E–42.5° E) is a climate hot-spot where a significant percent of the Ethiopia population resides and practices agricultural and pastoral activities. The increased dryness coupled with exponential population growth places an enormous stress on the agricultural systems of the country, which are generally not buffered by blue water (irrigation) supplements.
The results of the study indicate that climate has changed considerably over the last century in Ethiopia, which in turn has affected the drought characteristics. This study focused on assessing long-term trends and changes in drought intensities. In addition to changes in intensities, the patterns of wet–dry spells and transitions between these climate states is also important to fully understand drought characteristics [69]. The reader is referred to a complementary study presented in [58] that addresses this aspect. The available datasets limit the evaluation of drought characteristics on a monthly timescale. The meteorological network of the country must be expanded to provide better nationwide coverage and operated to collect data at higher frequencies (i.e., daily timescale) with little to no downtime to avoid large data gaps as they currently exist to further improve drought assessments and better characterize the impacts of trends and wet–dry spells.
Agricultural systems are affected by short-term soil drying during increased temperatures. Hydrologic changes caused by precipitation declines and temperature increases act slowly but affect soil moisture availability over the growing season. The comparison of multiple drought indicators suggests that precipitation-based SPI, while useful, does not provide a more complete picture of long-term drought trends noted in Ethiopia. Soil moisture is also affected by surficial drying and other hydrological processes (e.g., deep percolation) that remove water from the soil. Therefore, it is recommended that multiple drought indicators be used during water policy planning and management endeavors. The creation of a national-scale soil moisture sensing program and improving agriculture resilience through irrigation should be top priorities for sustaining the agricultural-dependent economy of Ethiopia.
Author Contributions
Conceptualization, V.U. and E.A.H.; Data curation, G.M.; Formal analysis, D.T. and V.U.; Funding acquisition, V.U. and S.E.-O.; Methodology, V.U. and E.A.H.; Project administration, S.E.-O.; Software, V.U.; Supervision, V.U.; Visualization, D.T.; Writing—original draft, V.U.; Writing—review & editing, G.M., E.A.H. and S.E.-O.
Funding
This research was funded by the Ministry of Science and Higher Education, The Federal Democratic Republic of Ethiopia Grant No. 23A742. Any opinions, findings, and conclusions or recommendations expressed in this material are those of the author(s) and do not necessarily reflect the views of the Ministry of Science and Higher Education.
Acknowledgments
We thank the Ministry of Higher Education, Federal Democratic Republic of Ethiopia and the Jimma Institute of Technology for extending their support to this research. The logistic support provided by Job Kasule is also gratefully acknowledged. Thoughtful comments and suggestions provided by two anonymous reviewers is much appreciated as it greatly helped improve the manuscript.
Conflicts of Interest
The authors declare no conflict of interest
Data Availability
The drought indicator dataset that forms the basis for this study has been made publicly available at —https://osf.io/s7fxa/?view_only=db3e909747d84313b29909296836b7c4 (doi:10.17605/OSF.IO/S7FXA) [70].
References
- Ewonetu, G. Identifing Major Constraints of Ground Water Use for Irrigated Crop Production: Fogera Plain, North Western Ethiopia; Project Paper; Cornell University: Ithaca, NY, USA, 2012. [Google Scholar]
- MoA (Ministry of Agriculture). Small-Scale Irrigation Situation Analysis and Capacity Needs Assessment; Natural Resource Management and Regulatory Department: Addis Ababa, Ethiopia, 2011. [Google Scholar]
- Meze-Hausken, E. Contrasting climate variability and meteorological drought with perceived drought and climate change in northern Ethiopia. Clim. Res. 2004, 27, 19–31. [Google Scholar] [CrossRef] [Green Version]
- Mersha, A.A.; van Laerhoven, F. The interplay between planned and autonomous adaptation in response to climate change: Insights from rural Ethiopia. World Dev. 2018, 107, 87–97. [Google Scholar] [CrossRef]
- FDRE (Federal Democratic Republic of Ethiopia). Ethiopia’s Climate Resilience Strategy for Agriculture and Forestry; Ministry of Agriculture and Rural Development: Addis Ababa, Ethiopia, 2015.
- Megersa, B.; Markemann, A.; Angassa, A.; Valle Zárate, A. The role of livestock diversification in ensuring household food security under a changing climate in Borana, Ethiopia. Food Secur. 2014, 6, 15–28. [Google Scholar] [CrossRef]
- Linke, A.M.; O’Loughlin, J.; McCabe, J.T.; Tir, J.; Witmer, F.D.W. Rainfall variability and violence in rural Kenya: Investigating the effects of drought and the role of local institutions with survey data. Glob. Environ. Chang. 2015, 34, 35–47. [Google Scholar] [CrossRef] [Green Version]
- Wilhite, D.A.; Glantz, M.H. Understanding: The Drought Phenomenon: The Role of Definitions. Water Int. 1985, 10, 111–120. [Google Scholar] [CrossRef] [Green Version]
- Karamouz, M.; Rasouli, K.; Nazif, S. Development of a Hybrid Index for Drought Prediction: Case Study. J. Hydrol. Eng. 2009, 14, 617–627. [Google Scholar] [CrossRef]
- Sepulcre-Canto, G.; Horion, S.; Singleton, A.; Carrao, H.; Vogt, J. Development of a Combined Drought Indicator to detect agricultural drought in Europe. Nat. Hazards Earth Syst. Sci. 2012, 12, 3519–3531. [Google Scholar] [CrossRef] [Green Version]
- Ziese, M.; Schneider, U.; Meyer-Christoffer, A.; Schamm, K.; Vido, J.; Finger, P.; Bissolli, P.; Pietzsch, S.; Becker, A. The GPCC Drought Index—A new, combined and gridded global drought index. Earth Syst. Sci. Data 2014, 6, 285–295. [Google Scholar] [CrossRef] [Green Version]
- Seleshi, Y.; Zanke, U. Recent changes in rainfall and rainy days in Ethiopia. Int. J. Climatol. 2004, 24, 973–983. [Google Scholar] [CrossRef]
- Seleshi, Y.; Camberlin, P. Recent changes in dry spell and extreme rainfall events in Ethiopia. Theor. Appl. Climatol. 2006, 83, 181–191. [Google Scholar] [CrossRef] [Green Version]
- Bewket, W.; Conway, D. A note on the temporal and spatial variability of rainfall in the drought-prone Amhara region of Ethiopia. Int. J. Climatol. 2007, 27, 1467–1477. [Google Scholar] [CrossRef]
- Cheung, W.H.; Senay, G.B.; Singh, A. Trends and spatial distribution of annual and seasonal rainfall in Ethiopia. Int. J. Climatol. 2008, 28, 1723–1734. [Google Scholar] [CrossRef]
- Edossa, D.C.; Babel, M.S.; Das Gupta, A. Drought Analysis in the Awash River Basin, Ethiopia. Water Resour. Manag. 2010, 24, 1441–1460. [Google Scholar] [CrossRef]
- Funk, C.; Rowland, J.; Eilerts, G.; Kebebe, E.; Biru, N.; White, L.; Galu, G. A Climate Trend Analysis of Ethiopia; U.S. Geological Survey Fact Sheet: Reston, VA, USA, 2012; p. 3053.
- Viste, E.; Korecha, D.; Sorteberg, A. Recent drought and precipitation tendencies in Ethiopia. Theor. Appl. Climatol. 2013, 112, 535–551. [Google Scholar] [CrossRef] [Green Version]
- Bekele, D.; Alamirew, T.; Kebede, A.; Zeleke, G.; Melese, A.M. Analysis of rainfall trend and variability for agricultural water management in Awash River Basin, Ethiopia. J. Water Clim. Chang. 2016, 8, 127–141. [Google Scholar] [CrossRef]
- Abebe, G. Long-term climate data description in Ethiopia. Data Brief 2017, 14, 371–392. [Google Scholar] [CrossRef]
- Asfaw, A.; Simane, B.; Hassen, A.; Bantider, A. Variability and time series trend analysis of rainfall and temperature in northcentral Ethiopia: A case study in Woleka sub-basin. Weather Clim. Extrem. 2018, 19, 29–41. [Google Scholar] [CrossRef]
- Easterling, D.R.; Evans, J.L.; Groisman, P.Y.; Karl, T.R.; Kunkel, K.E.; Ambenje, P. Observed Variability and Trends in Extreme Climate Events: A Brief Review. Bull. Am. Meteorol. Soc. 2000, 81, 417–426. [Google Scholar] [CrossRef] [Green Version]
- Wondie, M.; Terefe, T. Assessment of drought in Ethiopia by using self-calibrated Palmer Drought Severity Index. Int. J. Eng. Manag. Sci. 2016, 7, 108–117. [Google Scholar]
- Keyantash, J.; Dracup, J.A. The Quantification of Drought: An Evaluation of Drought Indices. Bull. Am. Meteorol. Soc. 2002, 83, 1167–1180. [Google Scholar] [CrossRef]
- Ofcansky, T.P. Ethiopia: A country study. In Laverle Bennette Berry; Federal Research Division: Washington, DC, USA, 1991. [Google Scholar]
- Verdin, J.; Funk, C.; Senay, G.; Choularton, R. Climate science and famine early warning. Philos. Trans. R. Soc. B: Biol. Sci. 2005, 360, 2155–2168. [Google Scholar] [CrossRef] [PubMed] [Green Version]
- Uddameri, V.; Singaraju, S.; Hernandez, E.A. Is Standardized Precipitation Index (SPI) a Useful Indicator to Forecast Groundwater Droughts?—Insights from a Karst Aquifer. JAWRA J. Am. Water Resour. Assoc. 2019, 55, 70–88. [Google Scholar] [CrossRef]
- Hernandez, E.A.; Uddameri, V. Standardized precipitation evaporation index (SPEI)-based drought assessment in semi-arid south Texas. Environ. Earth Sci. 2014, 71, 2491–2501. [Google Scholar] [CrossRef]
- Vicente-Serrano, S.M.; Beguería, S.; López-Moreno, J.I. A Multiscalar Drought Index Sensitive to Global Warming: The Standardized Precipitation Evapotranspiration Index. J. Clim. 2009, 23, 1696–1718. [Google Scholar] [CrossRef] [Green Version]
- Liu, X.; Zhu, X.; Pan, Y.; Bai, J.; Li, S. Performance of different drought indices for agriculture drought in the North China Plain. J. Arid Land 2018, 10, 507–516. [Google Scholar] [CrossRef] [Green Version]
- Karl, T.R. The Sensitivity of the Palmer Drought Severity Index and Palmer’s Z-Index to their Calibration Coefficients Including Potential Evapotranspiration. J. Clim. Appl. Meteorol. 1986, 25, 77–86. [Google Scholar] [CrossRef] [Green Version]
- Dai, A. Characteristics and trends in various forms of the Palmer Drought Severity Index during 1900–2008. J. Geophys. Res. Atmos. 2011, 116, D121115. [Google Scholar] [CrossRef] [Green Version]
- McKee, T.B.; Doesken, N.J.; Kleist, J. The relationship of drought frequency and duration to time scales. In Proceedings of the 8th Conference on Applied Climatology, Zürich, Switzerland, 13–17 September 2010; pp. 179–183. [Google Scholar]
- Guttman, N.B. Accepting the standardized precipitation index: a calculation algorithm. JAWRA J. Am. Water Resour. Assoc. 1999, 35, 311–322. [Google Scholar] [CrossRef]
- Mishra, A.K.; Singh, V.P. A review of drought concepts. J. Hydrol. 2010, 391, 202–216. [Google Scholar] [CrossRef]
- Potop, V. Evolution of drought severity and its impact on corn in the Republic of Moldova. Theor. Appl. Climatol. 2011, 105, 469–483. [Google Scholar] [CrossRef]
- Zambreski, Z.T.; Lin, X.; Aiken, R.M.; Kluitenberg, G.J.; Pielke, R.A., Sr. Identification of hydroclimate subregions for seasonal drought monitoring in the U.S. Great Plains. J. Hydrol. 2018, 567, 370–381. [Google Scholar] [CrossRef]
- Palmer, W.C. Meteorological Drought, Research Paper no. 45; US Weather Bureau: Washington, DC, USA, 1965; p. 58.
- Zhai, J.; Su, B.; Krysanova, V.; Vetter, T.; Gao, C.; Jiang, T. Spatial Variation and Trends in PDSI and SPI Indices and Their Relation to Streamflow in 10 Large Regions of China. J. Clim. 2010, 23, 649–663. [Google Scholar] [CrossRef]
- Gunda, T.; Hornberger, G.M.; Gilligan, J.M. Spatiotemporal Patterns of Agricultural Drought in Sri Lanka: 1881–2010. Int. J. Climatol. 2016, 36, 563–575. [Google Scholar] [CrossRef]
- Schneider, U.; Finger, P.; Meyer-Christoffer, A.; Rustemeier, E.; Ziese, M.; Becker, A. Evaluating the Hydrological Cycle over Land Using the Newly-Corrected Precipitation Climatology from the Global Precipitation Climatology Centre (GPCC). Atmosphere 2017, 8, 52. [Google Scholar] [CrossRef] [Green Version]
- Harris, I.; Jones, P.D.; Osborn, T.J.; Lister, D.H. Updated high-resolution grids of monthly climatic observations—The CRU TS3.10 Dataset. Int. J. Climatol. 2014, 34, 623–642. [Google Scholar] [CrossRef] [Green Version]
- Becker, A.; Finger, P.; Meyer-Christoffer, A.; Rudolf, B.; Schamm, K.; Schneider, U.; Ziese, M. A description of the global land-surface precipitation data products of the Global Precipitation Climatology Centre with sample applications including centennial (trend) analysis from 1901–present. Earth Syst. Sci. Data 2013, 5, 71–99. [Google Scholar] [CrossRef] [Green Version]
- Stagge, J.H.; Tallaksen, L.M.; Gudmundsson, L.; Van Loon, A.F.; Stahl, K. Candidate Distributions for Climatological Drought Indices (SPI and SPEI). Int. J. Climatol. 2015, 35, 4027–4040. [Google Scholar] [CrossRef]
- Hamed, K.H.; Ramachandra Rao, A. A modified Mann-Kendall trend test for autocorrelated data. J. Hydrol. 1998, 204, 182–196. [Google Scholar] [CrossRef]
- Yue, S.; Pilon, P.; Cavadias, G. Power of the Mann–Kendall and Spearman’s rho tests for detecting monotonic trends in hydrological series. J. Hydrol. 2002, 259, 254–271. [Google Scholar] [CrossRef]
- Rao, A.R.; Hamed, K.H.; Chen, H.-L. Time domain analysis. In Nonstationarities in Hydrologic and Environmental Time Series; Springer: Berlin/Heidelberg, Germany, 2003; pp. 27–55. [Google Scholar]
- Yue, S.; Wang, C. The Mann-Kendall Test Modified by Effective Sample Size to Detect Trend in Serially Correlated Hydrological Series. Water Resour. Manag. 2004, 18, 201–218. [Google Scholar] [CrossRef]
- Khaliq, M.N.; Ouarda, T.B.M.J.; Gachon, P.; Sushama, L.; St-Hilaire, A. Identification of hydrological trends in the presence of serial and cross correlations: A review of selected methods and their application to annual flow regimes of Canadian rivers. J. Hydrol. 2009, 368, 117–130. [Google Scholar] [CrossRef]
- Önöz, B.; Bayazit, M. Block bootstrap for Mann–Kendall trend test of serially dependent data. Hydrol. Process. 2012, 26, 3552–3560. [Google Scholar] [CrossRef]
- Theil, H. A rank-invariant method of linear and polynominal regression analysis (parts 1–3). Proc. K. Ned. Akad. Wet. Ser. A Math. Sci. 1950, 53, 1397–1412. [Google Scholar]
- Sen, P.K. Estimates of the Regression Coefficient Based on Kendall’s Tau. J. Am. Stat. Assoc. 1968, 63, 1379–1389. [Google Scholar] [CrossRef]
- Core Team. R: A Language and Environment for Statistical Computing; R Foundation for Statistical Computing: Vienna, Austria, 2018. [Google Scholar]
- Pierce, D. ncdf4: Interface to Unidata netCDF (Version 4 or Earlier) Format Data Files. 2017, p. 36. Available online: https://cran.r-project.org/web/packages/ncdf4/ncdf4.pdf (accessed on 1 March 2019).
- Gudmundsson, L.S.; Stagge, J.H. SCI: Standardized Climate Indices Such as SPI, SRI or SPEIR Package version 1.0. 2016, p. 12. Available online: https://cran.r-project.org/web/packages/SCI/SCI.pdf (accessed on 15 July 2019).
- Zhong, R.; Chen, X.; Wang, Z.; Lai, C. scPDSI: Calculation of the Conventional and Self-Calibrating Palmer Drought Severity Index. 2018, p. 7. Available online: https://cran.r-project.org/web/packages/scPDSI/scPDSI.pdf (accessed on 20 August 2019).
- Patakamuri, S.K.; O’Brien, N. Modified Versions of Mann Kendall and Spearman’s Rho Trend Tests. 2019, p. 8. Available online: https://cran.r-project.org/web/packages/modifiedmk/modifiedmk.pdf (accessed on 20 August 2019).
- Teweldebirhan Tsige, D.; Uddameri, V.; Forghanparast, F.; Hernandez, E.A.; Ekwaro-Osire, S. Comparison of Meteorological- and Agriculture-Related Drought Indicators across Ethiopia. Water 2019, 11, 2218. [Google Scholar] [CrossRef] [Green Version]
- Rosell, S.; Holmer, B. Rainfall Change and its Implications for Belg Harvest in South Wollo, Ethiopia. Geogr. Ann. Ser. APhys. Geogr. 2007, 89, 287–299. [Google Scholar] [CrossRef] [Green Version]
- Bewket, W. Rainfall variability and crop production in Ethiopia: Case study in the Amhara region. In Proceedings of the 16th International Conference of Ethiopian Studies; Norwegian University of Science and Technology: Trondheim, Norway, 2009; Volume 3, pp. 823–836. [Google Scholar]
- Byrne, M.P.; Pendergrass, A.G.; Rapp, A.D.; Wodzicki, K.R. Response of the Intertropical Convergence Zone to Climate Change: Location, Width, and Strength. Curr. Clim. Chang. Rep. 2018, 4, 355–370. [Google Scholar] [CrossRef] [Green Version]
- Se, A.S.T.; Dorosh, P.; Gemessa, S.A. Crop production in Ethiopia: Regional patterns and trends. In Food and Agriculture in Ethiopia: Progress and Policy Challenges; ETHIOPIAN DEVELOPMENT RESEARCH INSTITUTE: Addis Ababa, Ethiopia; IFPRI HEADQUARTERS INTERNATIONAL FOOD POLICY RESEARCH INSTITUTE: Washington, DC, USA, 2013; p. 53. [Google Scholar]
- USDA-FAS. Ethiopia 2008 Crop Assessment Travel Report. US Department of Agriculture—Foreign Agricultural Service. Washington, DC. Available online: https://ipad.fas.usda.gov/highlights/2008/11/eth_25nov2008/ (accessed on 20 August 2019).
- International Crops Research Institute for the Semi-Arid Tropics (ICRISAT). Socioeconomics, Policy Division, Agriculture Organization of the United Nations. Basic Foodstuffs Service, Agriculture Organization of the United Nations. Commodities, & Trade Division. In The World Sorghum and Millet Economies: Facts, Trends and Outlook; Food & Agriculture Organization of the United Nations: Rome, Italy, 1996. [Google Scholar]
- Thornton, P.K.; Jones, P.G.; Alagarswamy, G.; Andresen, J. Spatial variation of crop yield response to climate change in East Africa. Glob. Environ. Chang. 2009, 19, 54–65. [Google Scholar] [CrossRef]
- Amelework, B.A.; Shimelis, H.A.; Tongoona, P.; Mengistu, F.; Laing, M.D.; Ayele, D.G. Sorghum production systems and constraints, and coping strategies under drought-prone agro-ecologies of Ethiopia. S. Afr. J. Plant Soil 2016, 33, 207–217. [Google Scholar] [CrossRef]
- Eggen, M.; Ozdogan, M.; Zaitchik, B.F.; Ademe, D.; Foltz, J.; Simane, B. Vulnerability of sorghum production to extreme, sub-seasonal weather under climate change. Environ. Res. Lett. 2019, 14. [Google Scholar] [CrossRef]
- Taffesse, A.S.; Dorosh, P.A.; Asrat, S. Crop Production in Ethiopia: Regional Patterns and Trends: Summary of ESSP Working Paper 16 (No. 11); International Food Policy Research Institute (IFPRI): Washington, DC, USA, 2012. [Google Scholar]
- Chowdhury, A.K.; Kar, K.K.; Shahid, S.; Chowdhury, R.; Rashid, M.M. Evaluation of spatio-temporal rainfall variability and performance of a stochastic rainfall model in Bangladesh. Int J. Climatol. 2019, 39, 4256–4273. [Google Scholar] [CrossRef]
- Uddameri, V. Ethiopia—Drought Indicator Data 1902–2016. OSF, 26 November 2019. [Google Scholar] [CrossRef]
Figure 1.
Study grid and geographical characteristics of Ethiopia.

Figure 2.
Illustrative autocorrelation functions noted at different locations in Ethiopia for PDSI (Note: lags are in months).
Figure 2.
Illustrative autocorrelation functions noted at different locations in Ethiopia for PDSI (Note: lags are in months).

Figure 3.
Trends in Bega drought indicators (red: drying trend, blue: wetting trend, and black: no statistical trend).
Figure 3.
Trends in Bega drought indicators (red: drying trend, blue: wetting trend, and black: no statistical trend).

Figure 4.
Variability of Sen’s slope for various indicators for the Bega season.

Figure 5.
Variability of Sen’s slope across Ethiopia for various drought indicators for the Bega season.
Figure 5.
Variability of Sen’s slope across Ethiopia for various drought indicators for the Bega season.

Figure 6.
Trends for various drought indicators across Ethiopia for the Belg season (red: drying trends, blue: wetting trends, and black: no trends).
Figure 6.
Trends for various drought indicators across Ethiopia for the Belg season (red: drying trends, blue: wetting trends, and black: no trends).

Figure 7.
Variability in Sen’s slope for various drought indicators across Ethiopia during the Belg season (Sen slope was set zero when there was no trend detected).
Figure 7.
Variability in Sen’s slope for various drought indicators across Ethiopia during the Belg season (Sen slope was set zero when there was no trend detected).

Figure 8.
Variation in Sen’s slope across Ethiopia for various drought indicators for the Belg season.
Figure 8.
Variation in Sen’s slope across Ethiopia for various drought indicators for the Belg season.

Figure 9.
Trends across Ethiopia during the Meher season for various drought indicators.

Figure 10.
Variability of Sen’s slope across short-term and long-term drought indicators during Meher.
Figure 10.
Variability of Sen’s slope across short-term and long-term drought indicators during Meher.

Figure 11.
Variability of Sen’s slope across Ethiopia for various drought indicators for Meher.


Table 1.
Salient characteristics of drought indicators selected for this study (numbers in parentheses refer to key references pertaining to the indicators).
Table 1.
Salient characteristics of drought indicators selected for this study (numbers in parentheses refer to key references pertaining to the indicators).
| Indicator | Primary Variables | Conceptualization | Remarks |
|---|---|---|---|
| Standardized Precipitation Index (SPI) [33,34] | Accumulated Rainfall | Rainfall during an accumulation period compared to historical average for that period | Widely used meteorological drought indicator but based on rainfall alone, which is both a strength and a shortcoming. |
| Standardized Evapotranspiration Index (SPEI) [29] | Accumulated precipitation and Accumulated Evapotranspiration (ET) | Net atmospheric moisture supply accounting for ET losses | Potential ET is used for simplicity as it can be calculated using average monthly temperature and latitude information. A meteorological indicator that is known to correlate well with agriculture droughts due to incorporation of surficial drying [35,36,37]. Improves SPI still retaining simplicity. Does not account for soil moisture dynamics |
| Palmer Drought Severity Index (PDSI) [32,38] | Precipitation, Temperature, Soil parameters | Two-layer bucket model to simulate watershed. Indicator based on water budget calculations. | Another widely used meteorological drought indicator. Known to correlate well with hydrological [39] and agricultural droughts [38,40]. The conceptualization is complex and comprehensive (strength) but requires more data and self-calibration (weakness). |
| Palmer Z-Index [38,39,40] | Precipitation, Temperature, Soil parameters | Computed by removing the long-term effects from PDSI. | An indicator of short-term variations in water budget largely attributable to soil moisture dynamics. A good indicator for intraseason agricultural droughts [38]. The conceptualization is complex and comprehensive (strength) but requires more data and self-calibration (weakness). |
© 2019 by the authors. Licensee MDPI, Basel, Switzerland. This article is an open access article distributed under the terms and conditions of the Creative Commons Attribution (CC BY) license (http://creativecommons.org/licenses/by/4.0/).
Share and Cite
MDPI and ACS Style
Temam, D.; Uddameri, V.; Mohammadi, G.; Hernandez, E.A.; Ekwaro-Osire, S. Long-Term Drought Trends in Ethiopia with Implications for Dryland Agriculture. Water 2019, 11, 2571. https://doi.org/10.3390/w11122571
AMA Style
Temam D, Uddameri V, Mohammadi G, Hernandez EA, Ekwaro-Osire S. Long-Term Drought Trends in Ethiopia with Implications for Dryland Agriculture. Water. 2019; 11(12):2571. https://doi.org/10.3390/w11122571
Chicago/Turabian StyleTemam, Dawd, Venkatesh Uddameri, Ghazal Mohammadi, E. Annette Hernandez, and Stephen Ekwaro-Osire. 2019. "Long-Term Drought Trends in Ethiopia with Implications for Dryland Agriculture" Water 11, no. 12: 2571. https://doi.org/10.3390/w11122571
Note that from the first issue of 2016, this journal uses article numbers instead of page numbers. See further details here.