Continuous Wetting on the Tibetan Plateau during 1970–2017


1
School of Geography and Environment, Jiangxi Normal University, Nanchang 330028, China
2
Key Laboratory of Land Surface Pattern and Simulation, Institute of Geographic Sciences and Natural Resources Research, CAS, Beijing 100101, China
3
School of Computer and Information Engineering, Xiamen University Technology, Xiamen 361024, China
*
Author to whom correspondence should be addressed.
Water 2019, 11(12), 2605; https://doi.org/10.3390/w11122605
Submission received: 20 November 2019
/
Revised: 4 December 2019
/
Accepted: 8 December 2019
/
Published: 10 December 2019
(This article belongs to the Section Hydrology)
Abstract
:Based on daily observation records at 277 meteorological stations on the Tibetan Plateau (TP) and its surrounding areas during 1970–2017, drought evolution was investigated using the Standardized Precipitation Evapotranspiration Index (SPEI). First, the spatiotemporal changes in the growing season of SPEI (SPEIgs) were re-examined using the Mann–Kendall and Sen’s slope approach—the piecewise linear regression and intensity analysis approach. Then, the persistence of the SPEIgs trend was predicted by the Hurst exponent. The results showed that the SPEIgs on the TP exhibited a significant increasing trend at the rate of 0.10 decade−1 (p < 0.05) and that there is no significant trend shift in SPEIgs (p = 0.37), indicating that the TP tended to undergo continuous wetting during 1970–2017. In contrast, the areas surrounding the TP underwent a significant trend shift from an increase to a decrease in SPEIgs around 1984 (p < 0.05), resulting in a weak decreasing trend overall. Spatially, most of the stations on the TP were characterized by an increasing trend in SPEIgs, except those on the Eastern fringe of TP. The rate of drought/wet changes was relatively fast during the 1970s and 1980s, and gradually slowed afterward on the TP. Finally, the consistent increasing trend and decreasing trend of SPEIgs on the TP and the area East of the TP were predicted to continue in the future, respectively. Our results highlight that the TP experienced a significant continuous wetting trend in the growing season during 1970–2017, and this trend is likely to continue.
1. Introduction
Drought is recognized as one of the most destructive and expensive natural disasters in the world and has serious influences on agriculture, water resources, and human society [1,2]. In the context of global warming, increasing drought has been observed over much of the global land area and has resulted in increased drought losses [3,4]. Annual drought losses have been above 200 billion dollars worldwide since 1960 [5]. Global warming is projected to enhance droughts in the current century [6], and drought losses are also expected to continue to soar in the future [7]. Given that drought exerts complex spatial and temporal heterogeneity, a better understanding of the occurrence and evolution of drought will increase our ability to manage drought risk and reduce drought losses.
In the past several decades, a variety of multivariate drought indices have been developed for meteorological drought detection and monitoring, such as the Standardized Precipitation Index (SPI) [8] and the Palmer drought severity index (PDSI) [9]. Some studies have also improved the algorithms of these drought indices, such as the self-calibrating Palmer drought severity index (sc-PDSI) [10]. Numerous studies have found deficiencies in these drought indices, which limits the accuracy of drought studies to a certain extent [2,11]. A new Standardized Precipitation Evapotranspiration Index (SPEI) was developed by integrating the multi-scalar characteristic of SPI and the sensitivity of PDSI to potential evapotranspiration (PET) [2,12]. The SPEI is considered to be a useful index for drought assessment and has been widely applied to investigate the spatiotemporal patterns and variations in drought at global and regional scales [12,13,14,15].
The Tibetan Plateau (TP), known as the “Asian Water Tower” and the “Third Pole”, acts as water storage tower for South and East Asia and plays an important role in regional and hemispheric climates [16,17]. The TP has been undergoing profound climate change over the past decades, which has tended to favor climate extremes [18]. Rapid warming has been observed and predicted on the TP, and the warming rate exceeded those of the Northern Hemisphere and the globe [19]; the rapid warming could induce an increase in evaporation [20]. Meanwhile, the annual precipitation is slightly increasing in most areas of the TP [21,22]. The question of whether the TP is becoming wetter or drier has attracted much attention; however, recent literature has presented inconsistent conclusions. For example, several studies using the sc-PDSI found that the TP exhibited a significant drying trend [23], especially in the Northern TP [24], whereas other studies showed that the TP experienced wetting [13,25,26,27,28] and exhibited a decrease in drought intensity [29]. Additionally, the drought intensity on the TP exhibited obvious inter-decadal variation [30]; however, the variation characteristics of the drought intensity in each time interval remain seldom investigated.
In the regions surrounding the TP, several studies have noted that the SPEI in Southwestern China (e.g., the Sichuan Basin and the Yunnan–Guizhou Plateau) exhibited a significant decreasing trend over the past five decades [31,32,33], and Northwestern China (e.g., Xinjiang Province) displayed an increasing trend before 1997, but a slightly decreasing trend overall [34]. However, most previous studies have focused either on the TP or on the sub-regions of its surrounding areas, and it is not clear whether there is an obvious difference in the change in drought intensity between the TP and its surrounding areas.
Based on the daily meteorological records from 277 stations throughout the TP and its surrounding area during 1970–2017, this study revisited the spatiotemporal variations in drought using the SPEI and identified differences in the change trends of drought between the TP and its surrounding area. The objectives of this study are: (1) To re-examine the temporal and spatial variation characteristics of drought with Mann–Kendall, Sen’s slope approach, and piecewise linear regression; (2) to explore the inter-decadal variations among the categories of drought intensity using an intensity analysis approach; and (3) to predict the persistence or anti-persistence of drought trends using the Hurst exponent with R/S analysis. We also compare the variation characteristics of drought on the TP with those in the area surrounding the TP.
2. Materials and Methods
2.1. Study Area
The TP, located in Southwest China (25–40° N and 76–104° E), encompasses an area of approximately 2.57 × 10⁶ km2 with an average elevation of higher than 4000 m above sea level [35], which leads to the generation of a unique climate regime (Figure 1). The temperature in the Southeastern TP is relatively warmer, while that in the Northwestern TP is extremely cold. The amount of precipitation generally decreases from the Southeast to the Northwest, which results in an increase in aridity from the Southeast to the Northwest. Due to its thermal and mechanical forcing influences, the TP has a profound impact on the regional and even global climate [16,36] and is considered a “driver” and “amplifier” of global climate change [37]. To investigate the similarities and differences in the temporal and spatial changes in SPEI between the TP and its surrounding areas, this study creates a 200 km buffer zone with the TP at the center. Considering the limitations in our data acquisition, the buffer zone is limited to China (Figure 1).
2.2. Data Source
The original daily meteorological records during 1970–2017 were collected at 2474 stations from the China National Stations’ Fundamental Elements Datasets, v3.0. The daily meteorological datasets include precipitation (P), maximum temperature (Tmax), minimum temperature (Tmin), wind speed at a height of 10 m, sunshine duration, and relative humidity. These datasets have been quality-controlled [38]. The data for 315 meteorological stations on the TP and in the surrounding area (0–200 km) were then extracted. To ensure the completeness of the data time series, 277 meteorological stations were retained after removing the stations that had missing records more than 1% of the data. Of the stations, 109 are located on the TP, and the remaining 168 are distributed in the surrounding area (0–200 km). The reliable station data are limited to the Northwestern part of the TP (Figure 1). A few missing records were interpolated through linear regression from the responding records in neighboring stations, and a consistency test was then performed [39]. The daily data were processed into monthly data, and SPEI was then calculated. Considering that the growing season in most parts of the TP is very short and is generally considered to be from May to October [40], the growing season SPEI (SPEIgs) data were selected for the analysis of the temporal and spatial variation characteristics of drought on the TP and its surrounding areas.
2.3. Methods
2.3.1. Calculation of the SPEI
SPEI can reveal the drought intensity by standardizing the difference between precipitation and potential evapotranspiration (PET) [2] and is an ideal indicator to monitor and assess drought in the context of global change [13]. Vicente–Serrano et al. developed the SPEI in 2010, based on monthly temperature and precipitation [2], and the PET was estimated from the temperature by the empirical Thornthwaite equation [41]. The SPEI method was modified in 2014 by Beguería et al. [12]. For example, the Thornthwaite equations were replaced by the Penman–Monteith equation for the PET calculation. Studies noted that SPEI calculations based on the Penman–Monteith equation outperformed those based on the Thornthwaite equation with regard to drought monitoring in arid regions of China [11]. Therefore, this study employed the updated method to calculate SPEI. The computation of SPEI was as follows:
Step 1: Calculating the Potential Evaporation (PET) (FAO56 Penman–Monteith equation)
where indicates the slope of the saturated vapor pressure, kPa·°C−1; Rn indicates the net radiation, MJ·m−2·d−1; G indicates the soil heat flux, MJ·m−2·d−1; γ denotes the psychrometric constant, kPa·°C−1; T denotes the mean air temperature at 2 m, T = (Tmax + Tmin)/2, °C; U2 denotes the average wind speed at 2 m, m·s−1; and and are the saturated vapor pressure and the actual vapor pressure, kPa, respectively.
Step 2: Calculating the difference between precipitation and evapotranspiration
The difference, in a given month j of year i depends on the timescale k. The accumulated difference for month l in a particular year i with a 12-month timescale is calculated as follows,
where denotes the P − PET in month l of year i. Given that the growing season in most parts of the TP is generally from May to October, the k of this study was set to six, that is, the timescale was set to six-months.
Step 3: Normalizing the water balance into a log-logistic probability distribution to obtain the SPEI index series.
The probability distribution function of series D is calculated as follows:
where α, β, and γ indicate the scale, shape, and origin parameters, respectively. The details for these three parameters can be found in References [2,12].
Step 4: Calculating the SPEI
where W is equal to if P is not higher than 0.5, then P is the probability of exceeding a determination D value and is equal to l − F(x). When P is higher than 0.5, P is replaced by 1 − P, and the sign of the resultant SPEI is reversed. The constants d1, d2, d3, C0, C1, and C2 are equal to 1.432788, 0.189269, 0.001308, 2.515517, 0.802853, and 0.010328, respectively. According to the SPEI, the drought categories based on SPEI values are shown in Table 1 [14,42].
2.3.2. Mann–Kendall and Theil–Sen Approach
The Mann–Kendall (MK) nonparametric test, which was proposed by Mann [43] and then modified by Kendall [44], is a useful tool to detect variations in hydro-meteorological time series and has been recommended for general use by the World Meteorological Organization (WMO). The advantage of this approach is that the data series do not require a certain sample distribution, which avoids the potential interference of a few outliers. This approach was employed to investigate the gradual changes in drought indices from 1971 to 2017. The formula is as follows:
where
where n refers to the length of data series and both and indicate sequential data values. Sgn() is equal to +1, 0, and −1 when , , or , respectively. The null hypothesis is rejected at a specific α significant level when .
The trends of SPEIgs were then estimated by the Theil–Sen estimator [45], as follows:
where , and bsen denotes the magnitude of change in SPEIgs.
2.3.3. Piecewise Linear Regression Model
The piecewise linear regression model, proposed by Page [46] and then improved by Quandt [47], is an advanced statistical method to solve the problem of heterogeneous trends in long-term time-series data [48,49]. As this model can reveal one or more change-points in heterogeneous trends, it effectively compensates for the shortcomings of a simple linear regression [39]. Here, we applied the model with one change point to detect the significance of possible change points in the trend of SPEI. This approach is as follows:
where denotes the SPEI time series; t denotes the year; j indicates the estimated change-point of the trend in SPEI time series; , , and are the regression coefficients; and ε denotes the residual error. The SPEI trend before the change point is , and after that, the change point is +. When a change-point was captured, the significance of the overall non-linearity would be tested by the pseudo-score statistic test [50].
2.3.4. Intensity Analysis Approach
The intensity analysis approach, developed by Aldwaik and Pontius [51], was initially used for the quantitative analysis of land use and land cover change. Recently, studies have noted that this approach is also a useful tool for the quantitative analysis of drought change at regional scales [5,52]. The different patterns of land use and land cover change or the drought category at the interval, category, and transition level can be obtained using intensity analysis. For drought categories, the interval level intensity analysis can be used to detect whether the rate of drought category changes within a certain time interval was fast or slow, and the category intensity analysis can be applied to determine whether the change in a certain drought category became relatively active or dormant. Additionally, the intensity analysis approach required the classification criteria to be consistent at each time interval. Thus, the mean values of the SPEIgs in the 1970s, 1980s, 1990s, 2000s, and 2010s were calculated. According to the drought categories shown in Table 1, for each drought category, we calculated the percentage of stations that transitioned from one certain time interval to the next time interval.
2.3.5. Hurst Exponent
The Hurst exponent, proposed by Hurst [53] and modified by Mandelbrot and Wallis [54], is generally applied to assess the durability of changes in time series data over long periods. The most commonly used method to calculate the Hurst exponent is the rescaled range (R/S) analysis. The Hurst exponent with R/S analysis was used to predict the persistence or anti-persistence of trends in the SPEIgs time series on the TP and the surrounding area. The main calculation steps are as follows: Divide the time series SPEIgs(τ), (τ = 1, 2, 3, …, n) into τ sub series X(i), and for each subseries, i = 1, 2, 3,…, τ.
According to previous studies [53,54], the H value expanded from 0 to 1 and is generally categorized into three cases. When 0.5 < H < 1, the future trend of the SPEIgs is likely to be consistent with the historical trend. When H = 0.5, the SPEIgs time series are likely to be a true random walk without consistency. When 0 < H < 0.5, the future trend of the SPEIgs is likely to be the opposite of the trend in the past.
3. Results
3.1. Trend Analysis of the SPEIgs Time Series at Regional Scales
The SPEIgs for the entire TP and its surrounding area were generally within −0.5–0.5 from 1970 to 2017 (Figure 2), but there were also some light wet or light dry years. SPEIgs values higher than 0.5 mainly occurred in the 1990s and 2000s on the entire TP, while those in the area surrounding the TP primarily occurred in the 1980s and 1990s. The three years with SPEIgs values lower than −0.5 were sparsely distributed throughout the study period on the TP, whereas SPEIgs values lower than −0.5 mainly occurred after 1995 in the area surrounding the TP.
The Mann–Kendall and Theil–Sen approach were used to detect gradual changes in the SPEIgs series (Table 2). The SPEIgs on the entire TP exhibited a significant increasing trend during 1970–2017 at a rate of −0.10 decade−1 (p < 0.05), whereas the SPEIgs in the area surrounding the TP exhibited an insignificant decreasing trend (p > 0.05). A similar result was also detected by the least squares estimator (Table 2). These results indicate that the TP experienced a significant wetting trend, while the areas surrounding TP witnessed a weak drying trend, although not significantly.
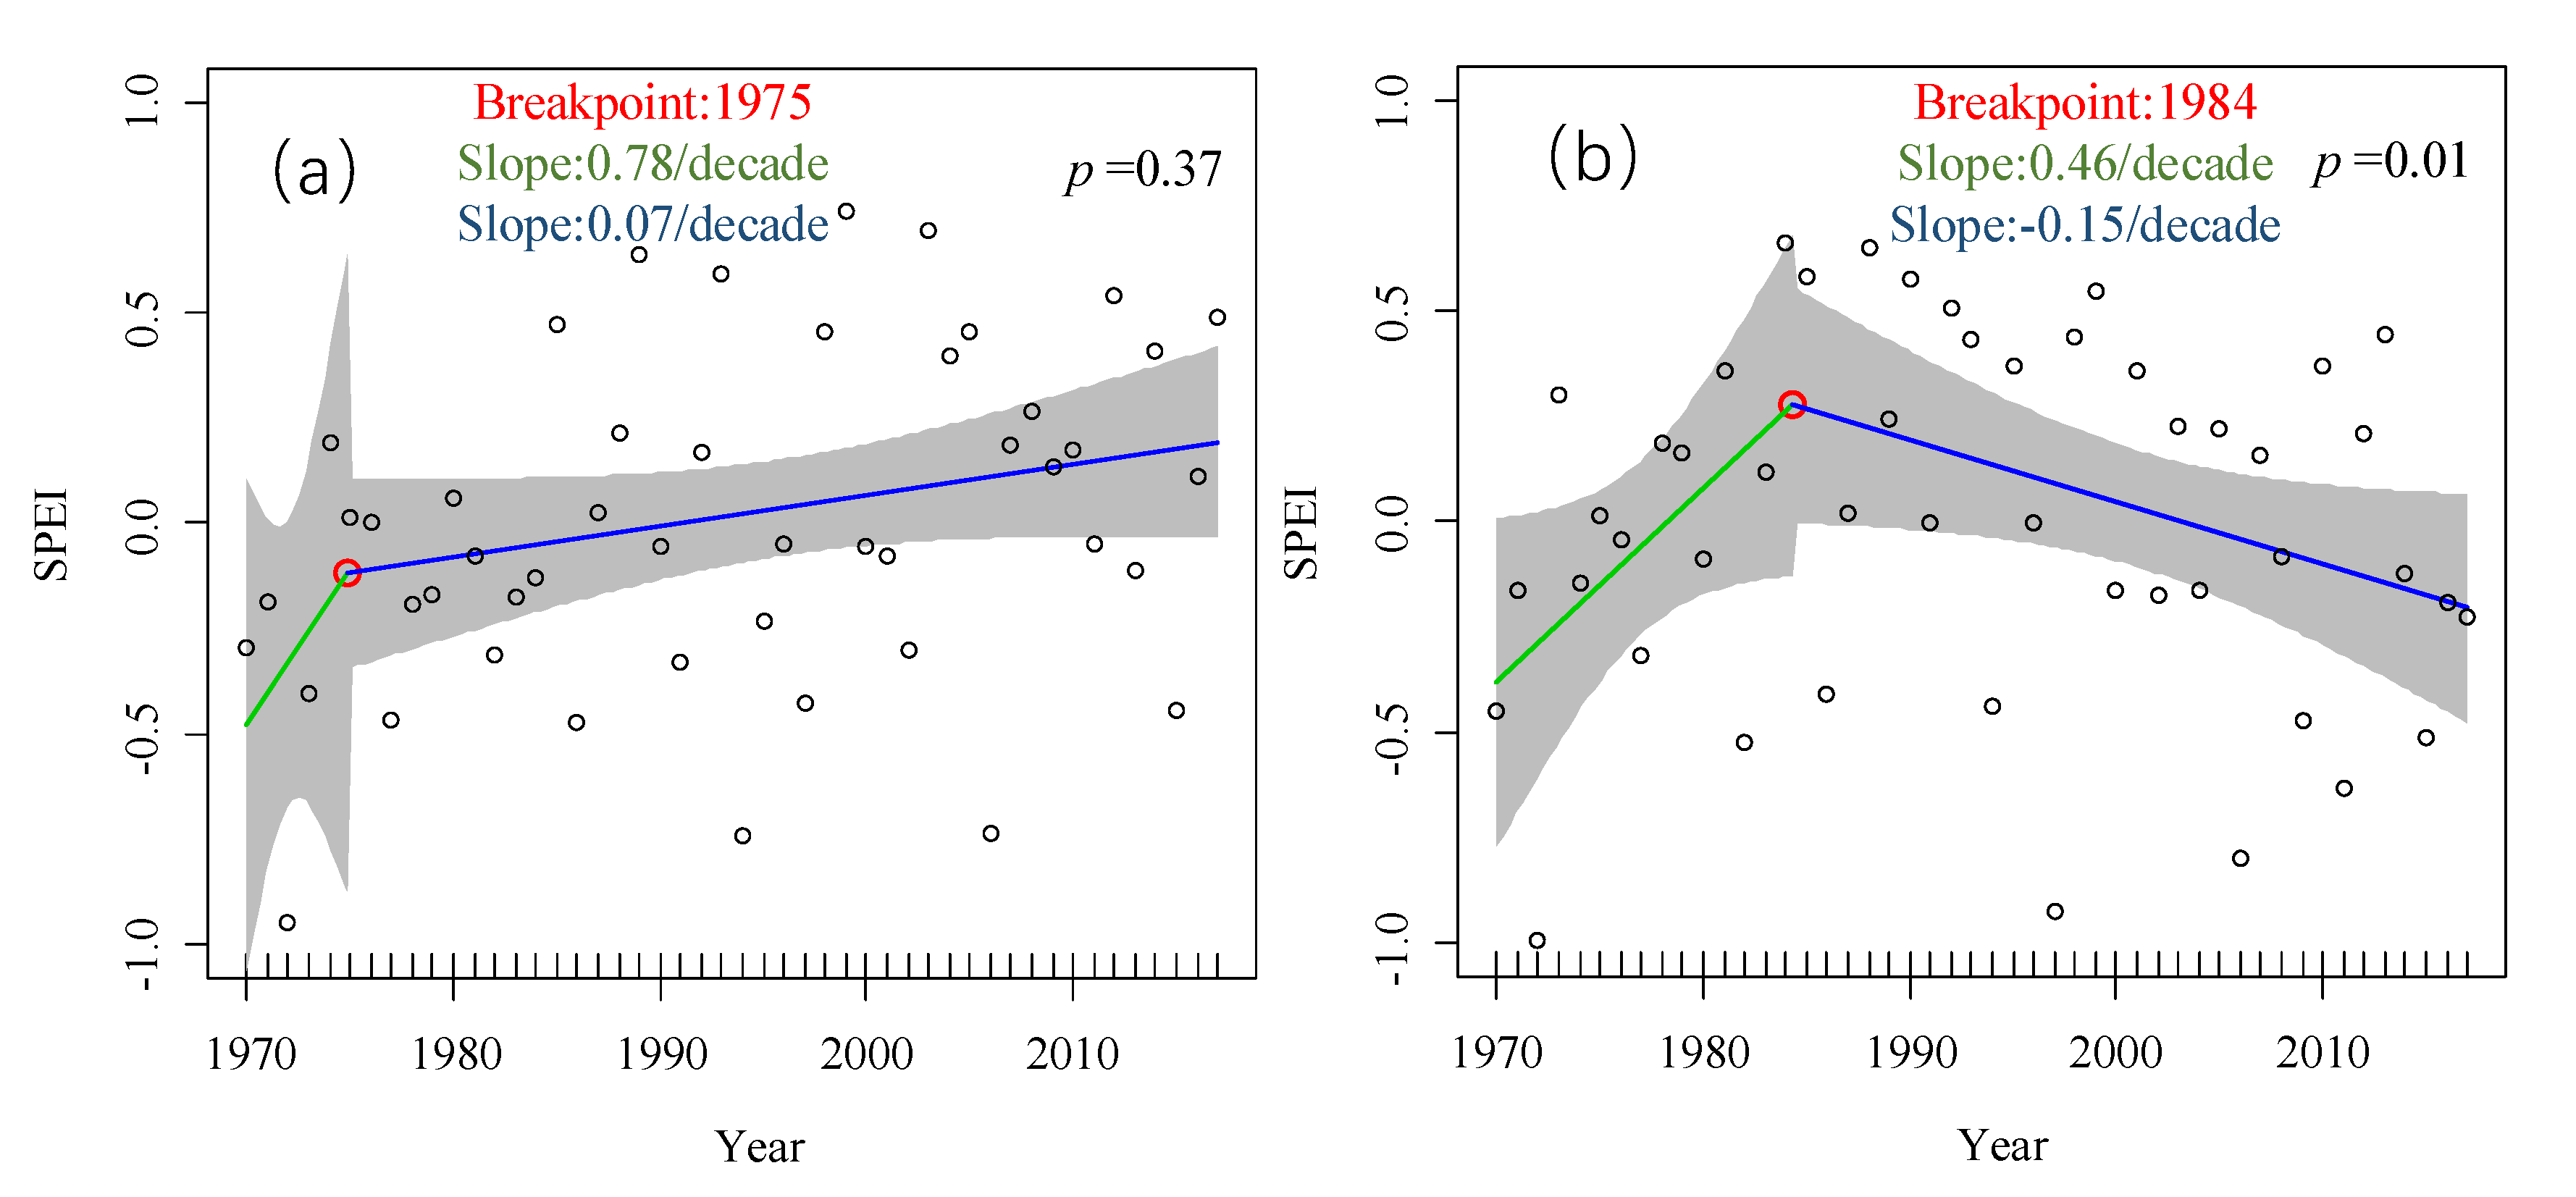
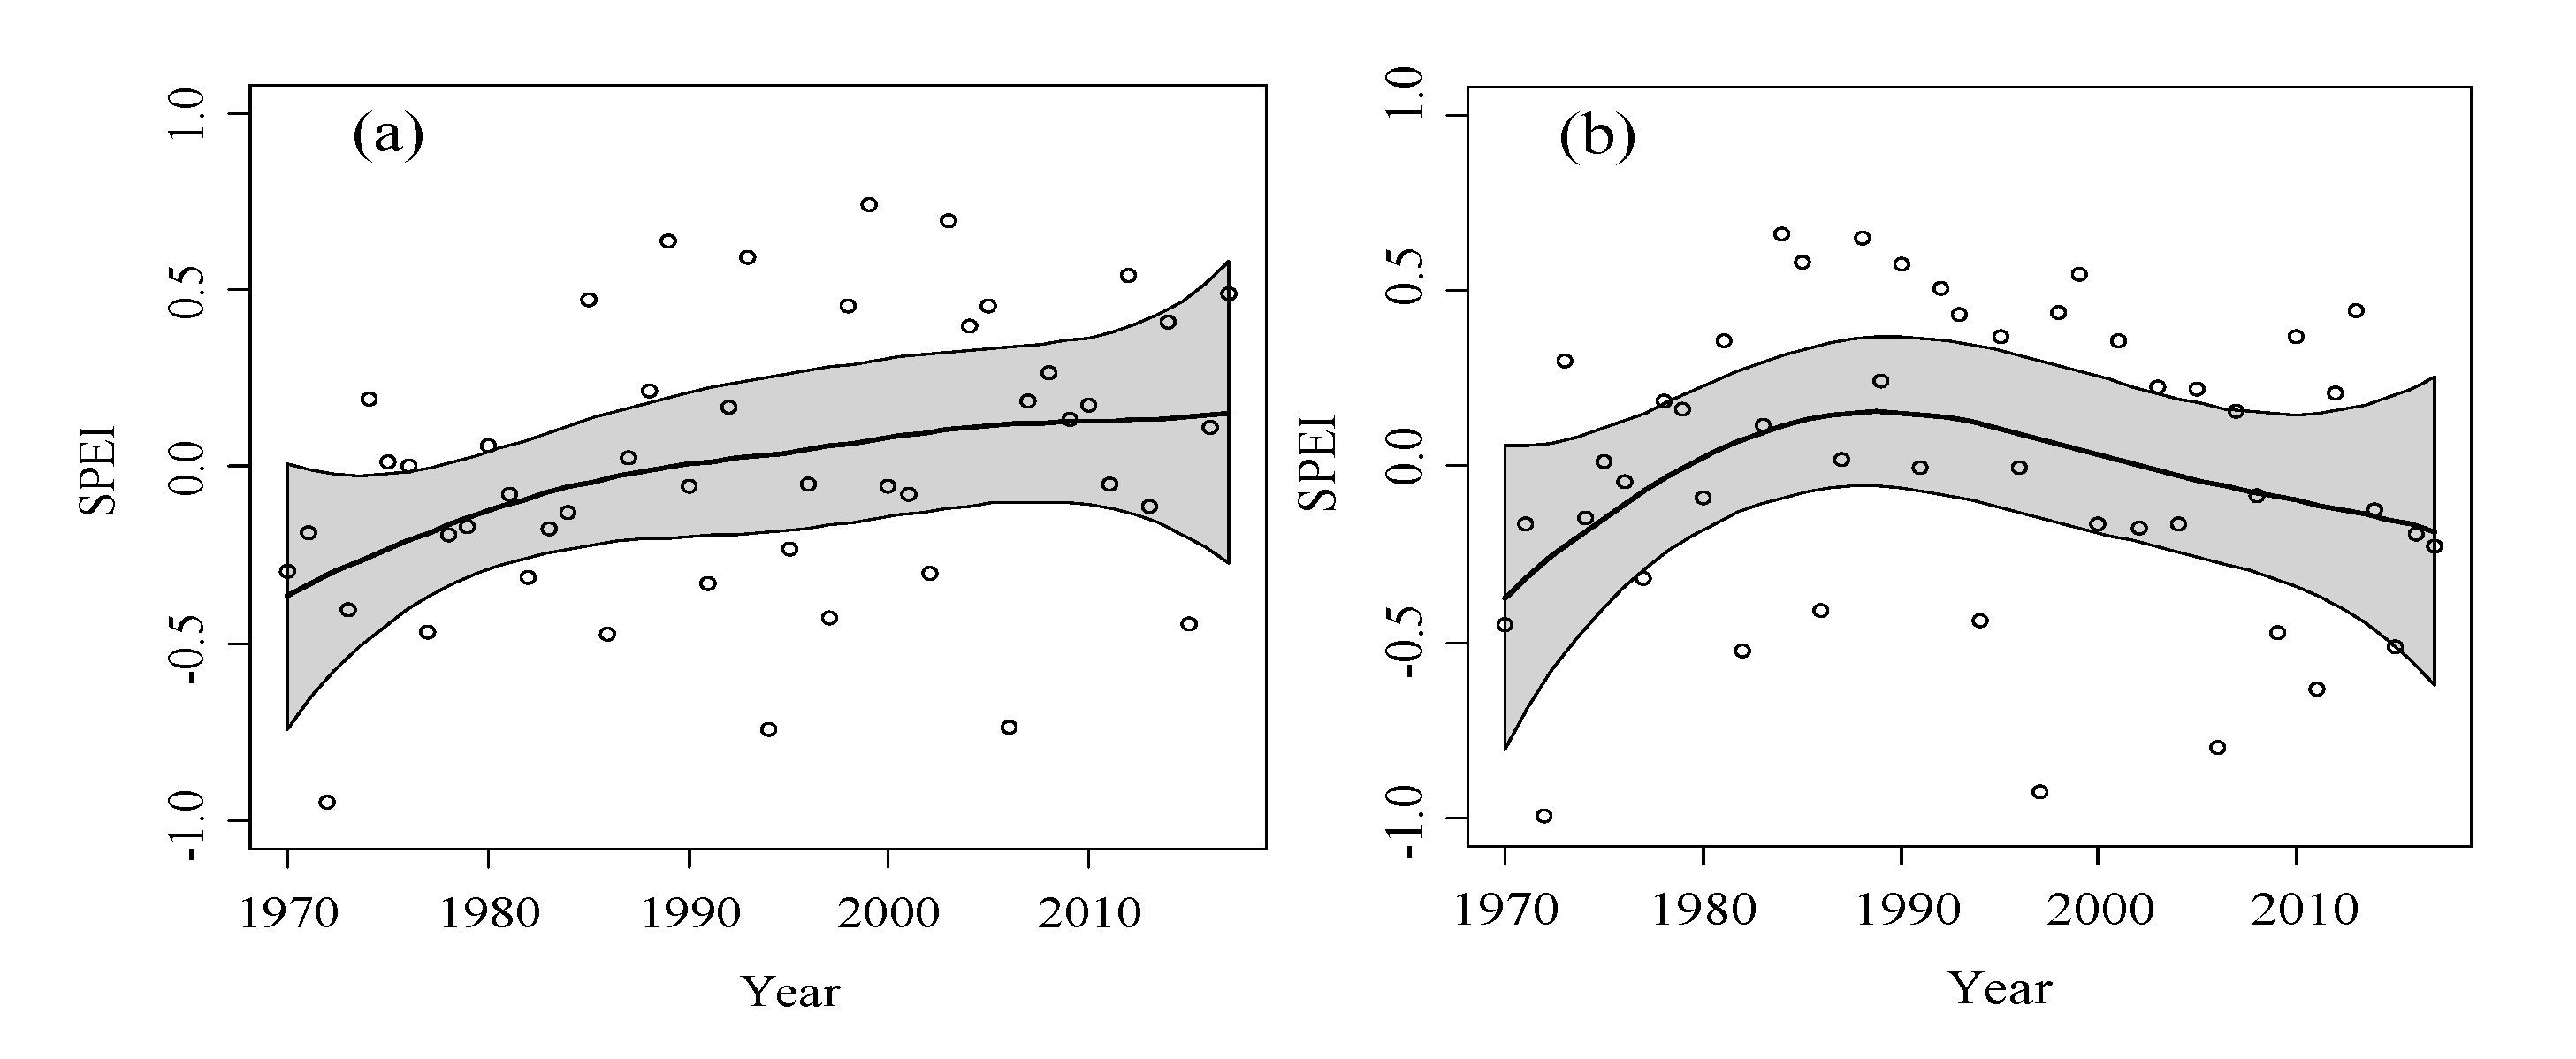
We then applied piecewise linear regression to explore whether there was a change-point in the changing trend in SPEIgs during 1970–2017, both on the TP and in the surrounding area. There is an obvious difference in the trend shift of SPEIgs between the TP and the surrounding area (Figure 3). No statistically significant abrupt change was detected in the SPEIgs on the TP (p > 0.05). However, a change-point was identified around 1984 in the SPEIgs in the area surrounding the TP (p < 0.05), switching from a wetting trend (0.46 decade−1) during 1970–1984 to a drying trend (−0.15 decade−1) since the mid-1980s. Consistent results were also identified using a locally weighted polynomial regression (Figure A1). These results indicated that, in contrast to the trend shift from wetting to drying in the area surrounding the TP, the TP exhibited a continuous wetting trend in the period 1970–2017.
3.2. Spatial Pattern of Trends in SPEIgs on the TP and Its Surrounding Area
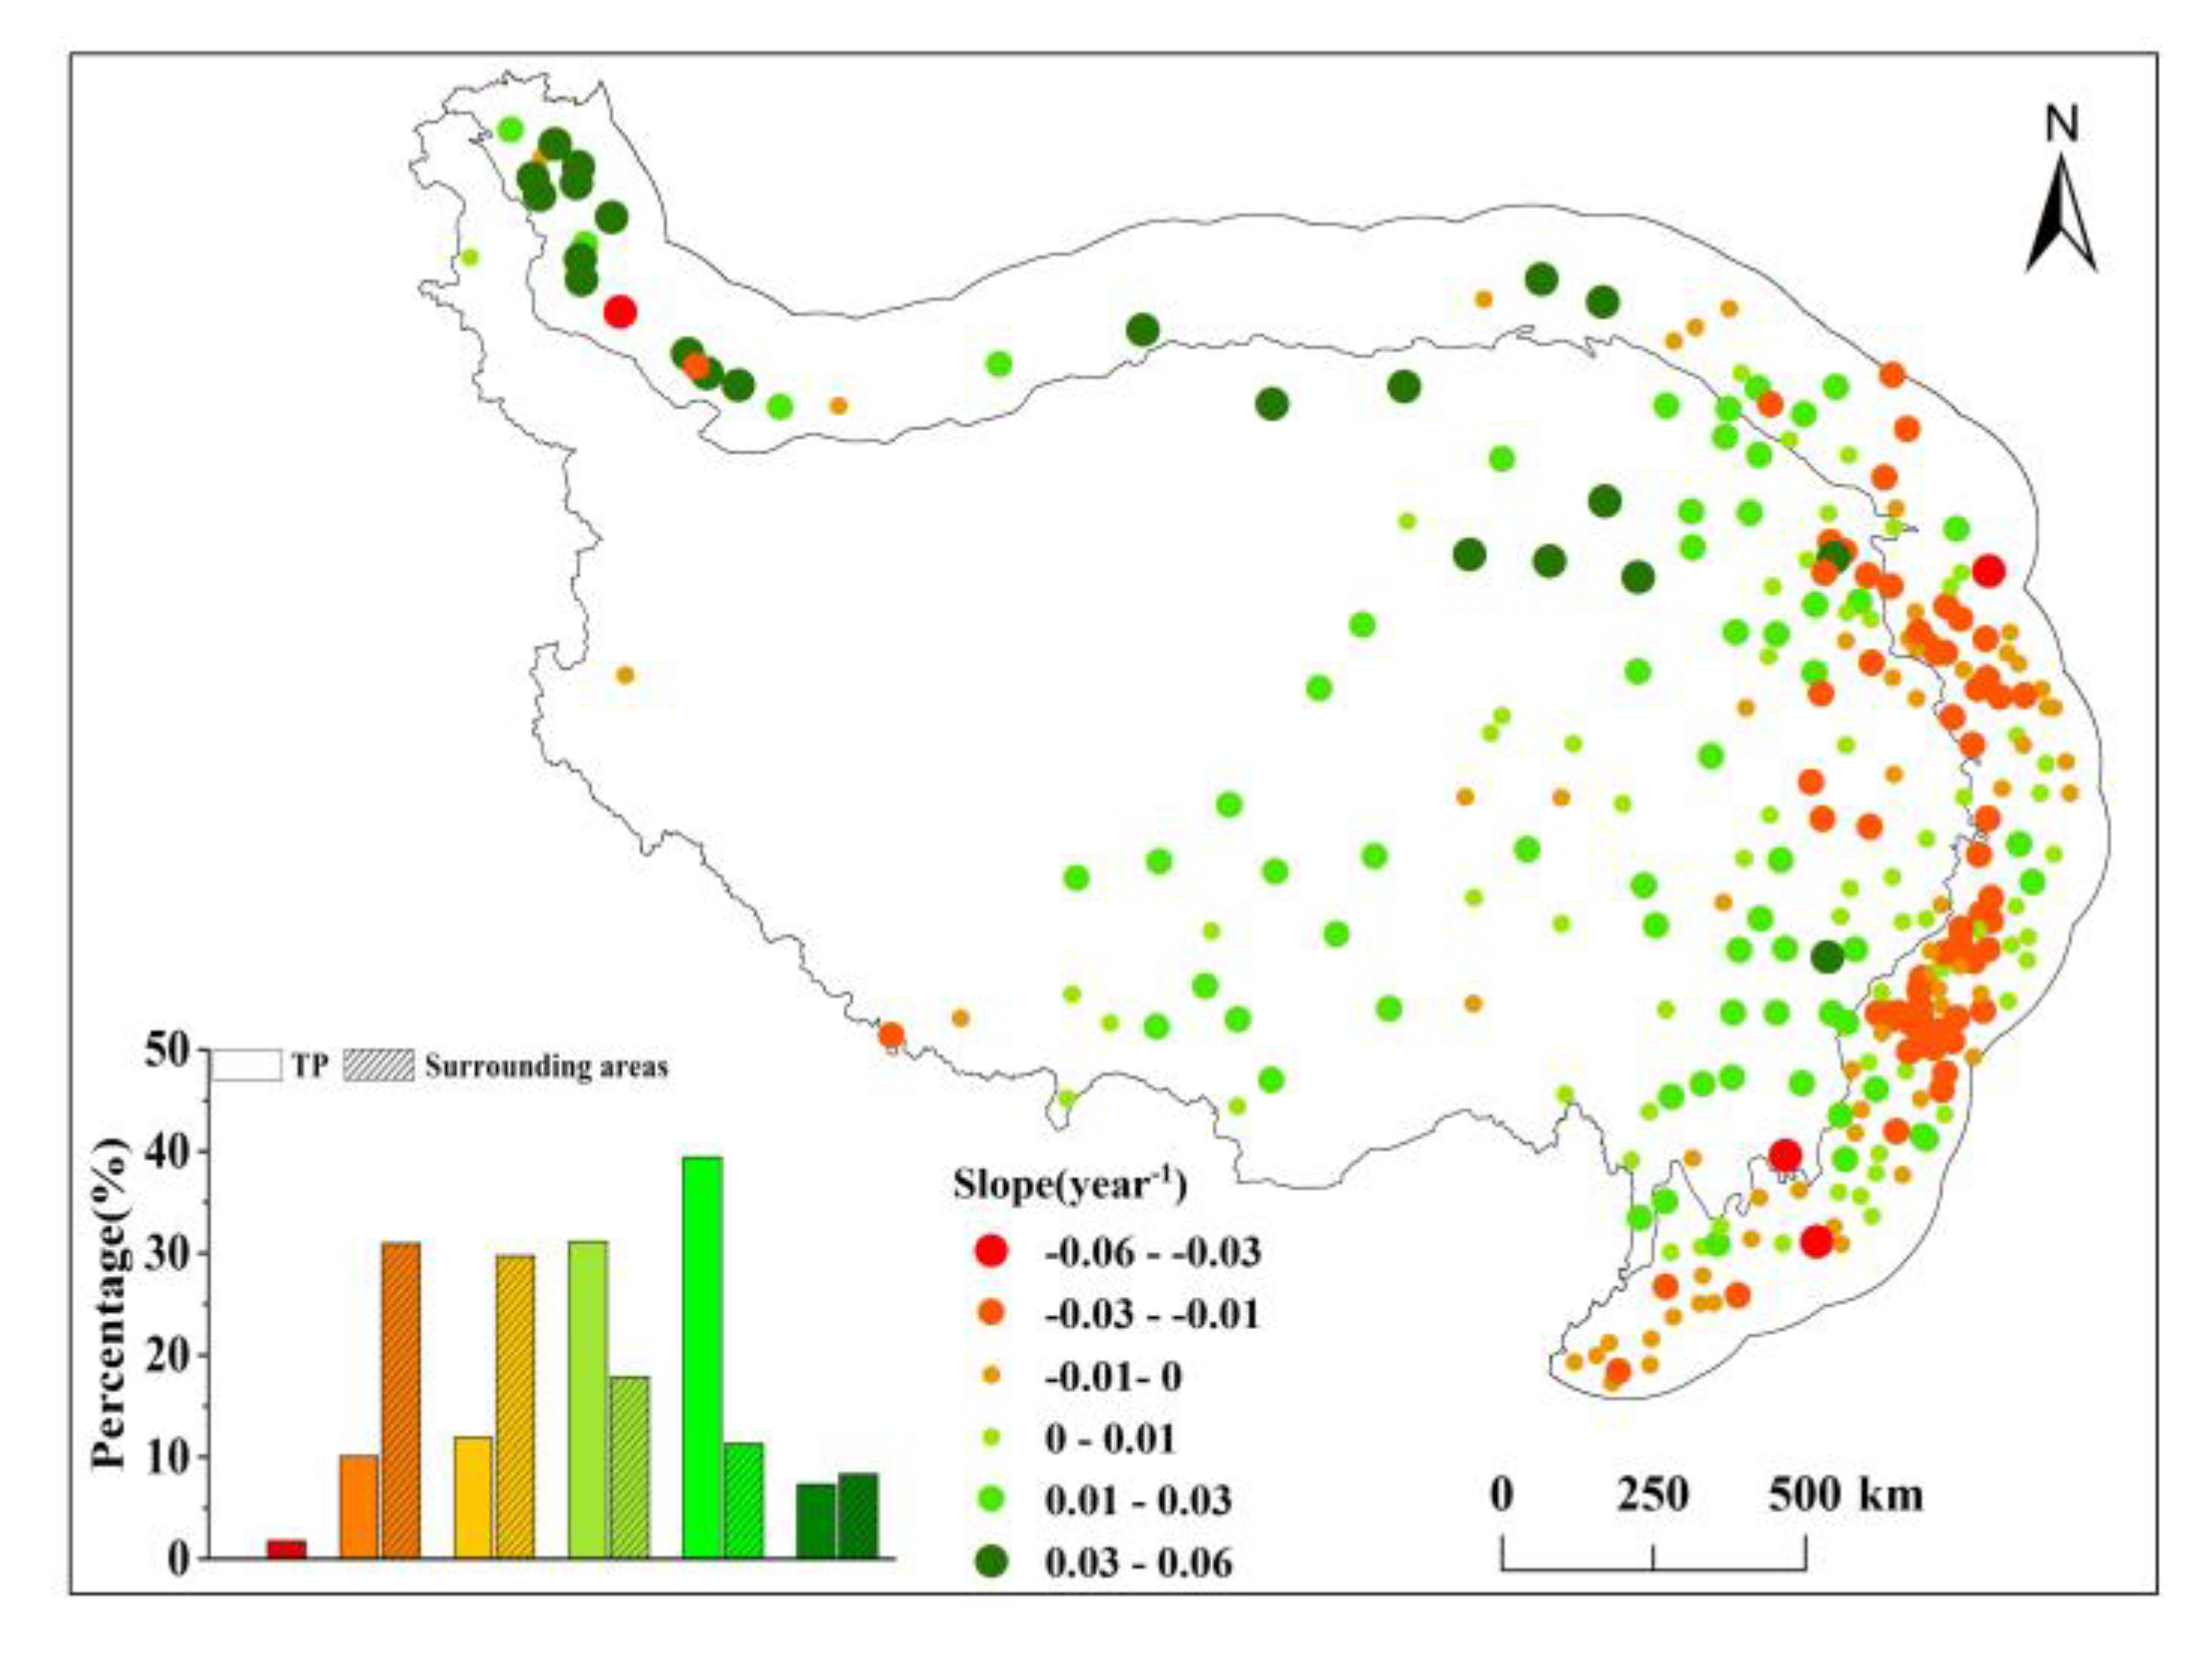
The trends in SPEIgs on the TP and its surrounding area during 1970–2017 showed strongly different patterns of distribution (Figure 4). The SPEIgs increased in 77.98% of stations on the TP. A total of 46.79% of stations were characterized by rates above 0.10/decade (the rate of the entire TP, Table 2), most of which are located in the Northeastern and Southern parts of the TP. In addition, a decreasing trend was also identified at 22.02% of stations, with approximately half of them characterized by a rate lower than −0.10/decade, mainly distributed in the Eastern fringe of the TP.
However, approximately two-thirds of stations were characterized by a decreasing trend in SPEIgs in the area surrounding the TP. In total, 32.74% and 29.76% of stations were characterized by rates lower than and higher than −0.10/decade, respectively, primarily located in the East of the TP, especially in Southern Gansu Province and Western Sichuan Province. A total of 37.50% of stations displayed an increasing trend in SPEIgs. Only 19.64% of stations were characterized by rates higher than 0.10/decade, and those stations were mainly distributed in Southern Xinjiang Province, North of the TP.
3.3. Intensity Analysis for the Decadal Variations in SPEIgs
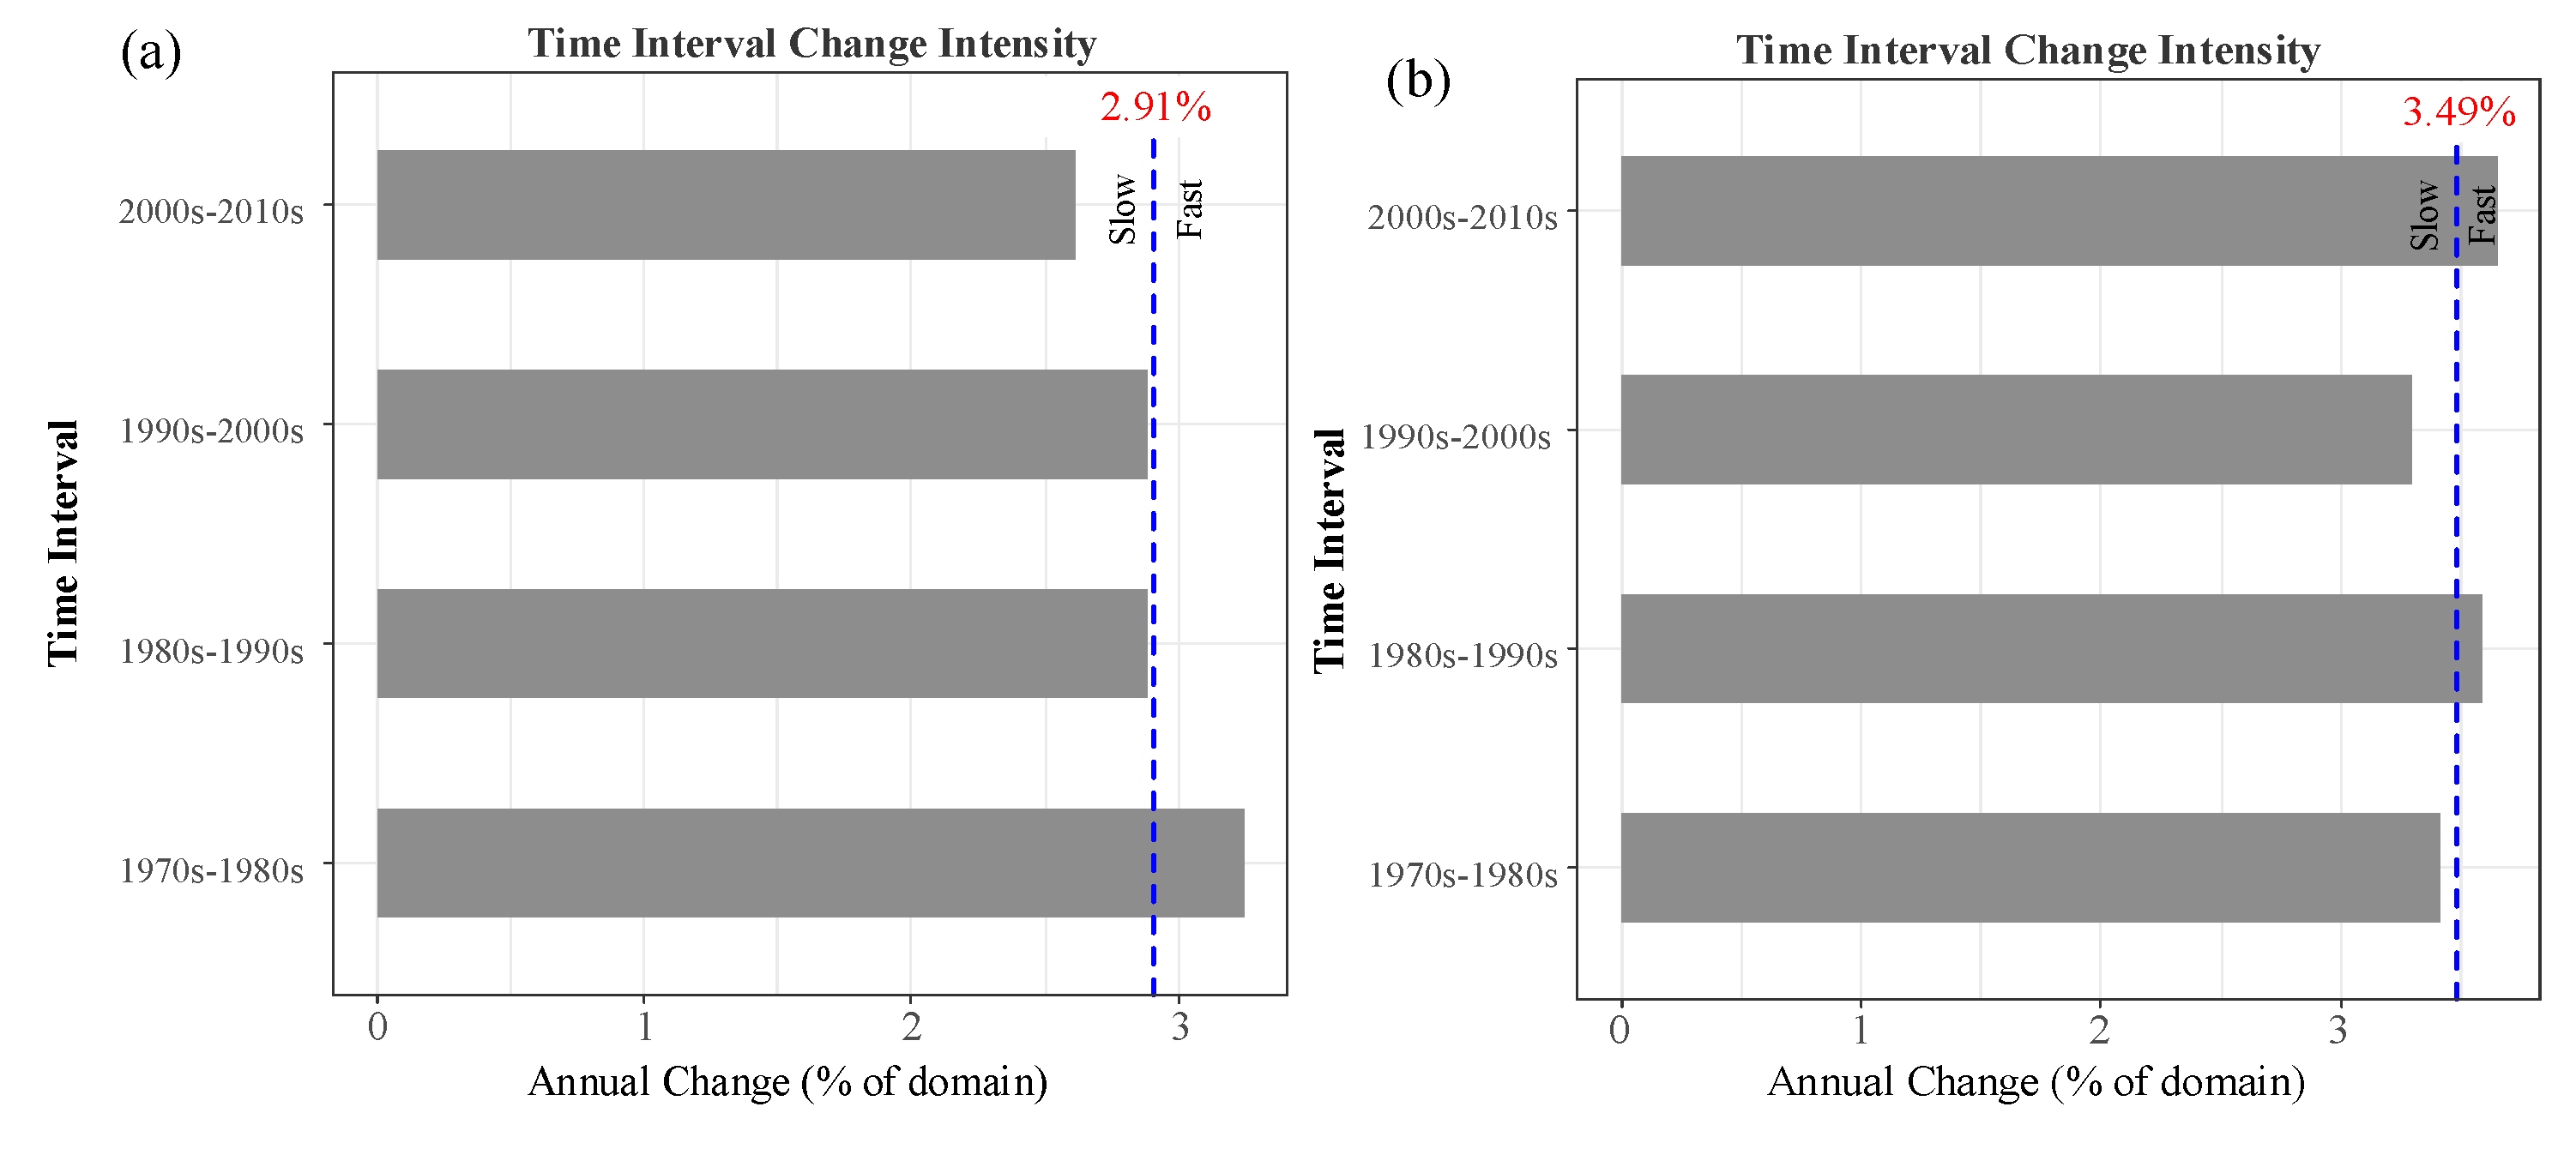
In this study, the drought transition matrix for four time intervals (1970s–1980s, 1980s–1990s, 1990s–2000s, and 2000s–2010s) were employed for the intensity analysis on the TP and the surrounding area, respectively. The interval level intensity analysis for the above four time intervals showed that the rate of drought/wet changes was relatively fast at first and gradually slowed afterward on the TP. In detail, the rate of drought/wet changes was relatively fast in the time interval of 1970s–1980s and those in the time interval of 1980s–1990s, 1990s–2000s, and 2000s–2010s were relatively slow, especially that in 2000s–2010s (Figure 5a). In contrast, the change rates in the area surrounding the TP were relatively fast for the period of 1980s–1990s and 2000s–2010s compared with those in the time interval of 1970s–1980s and 1990s–2000s (Figure 5b).
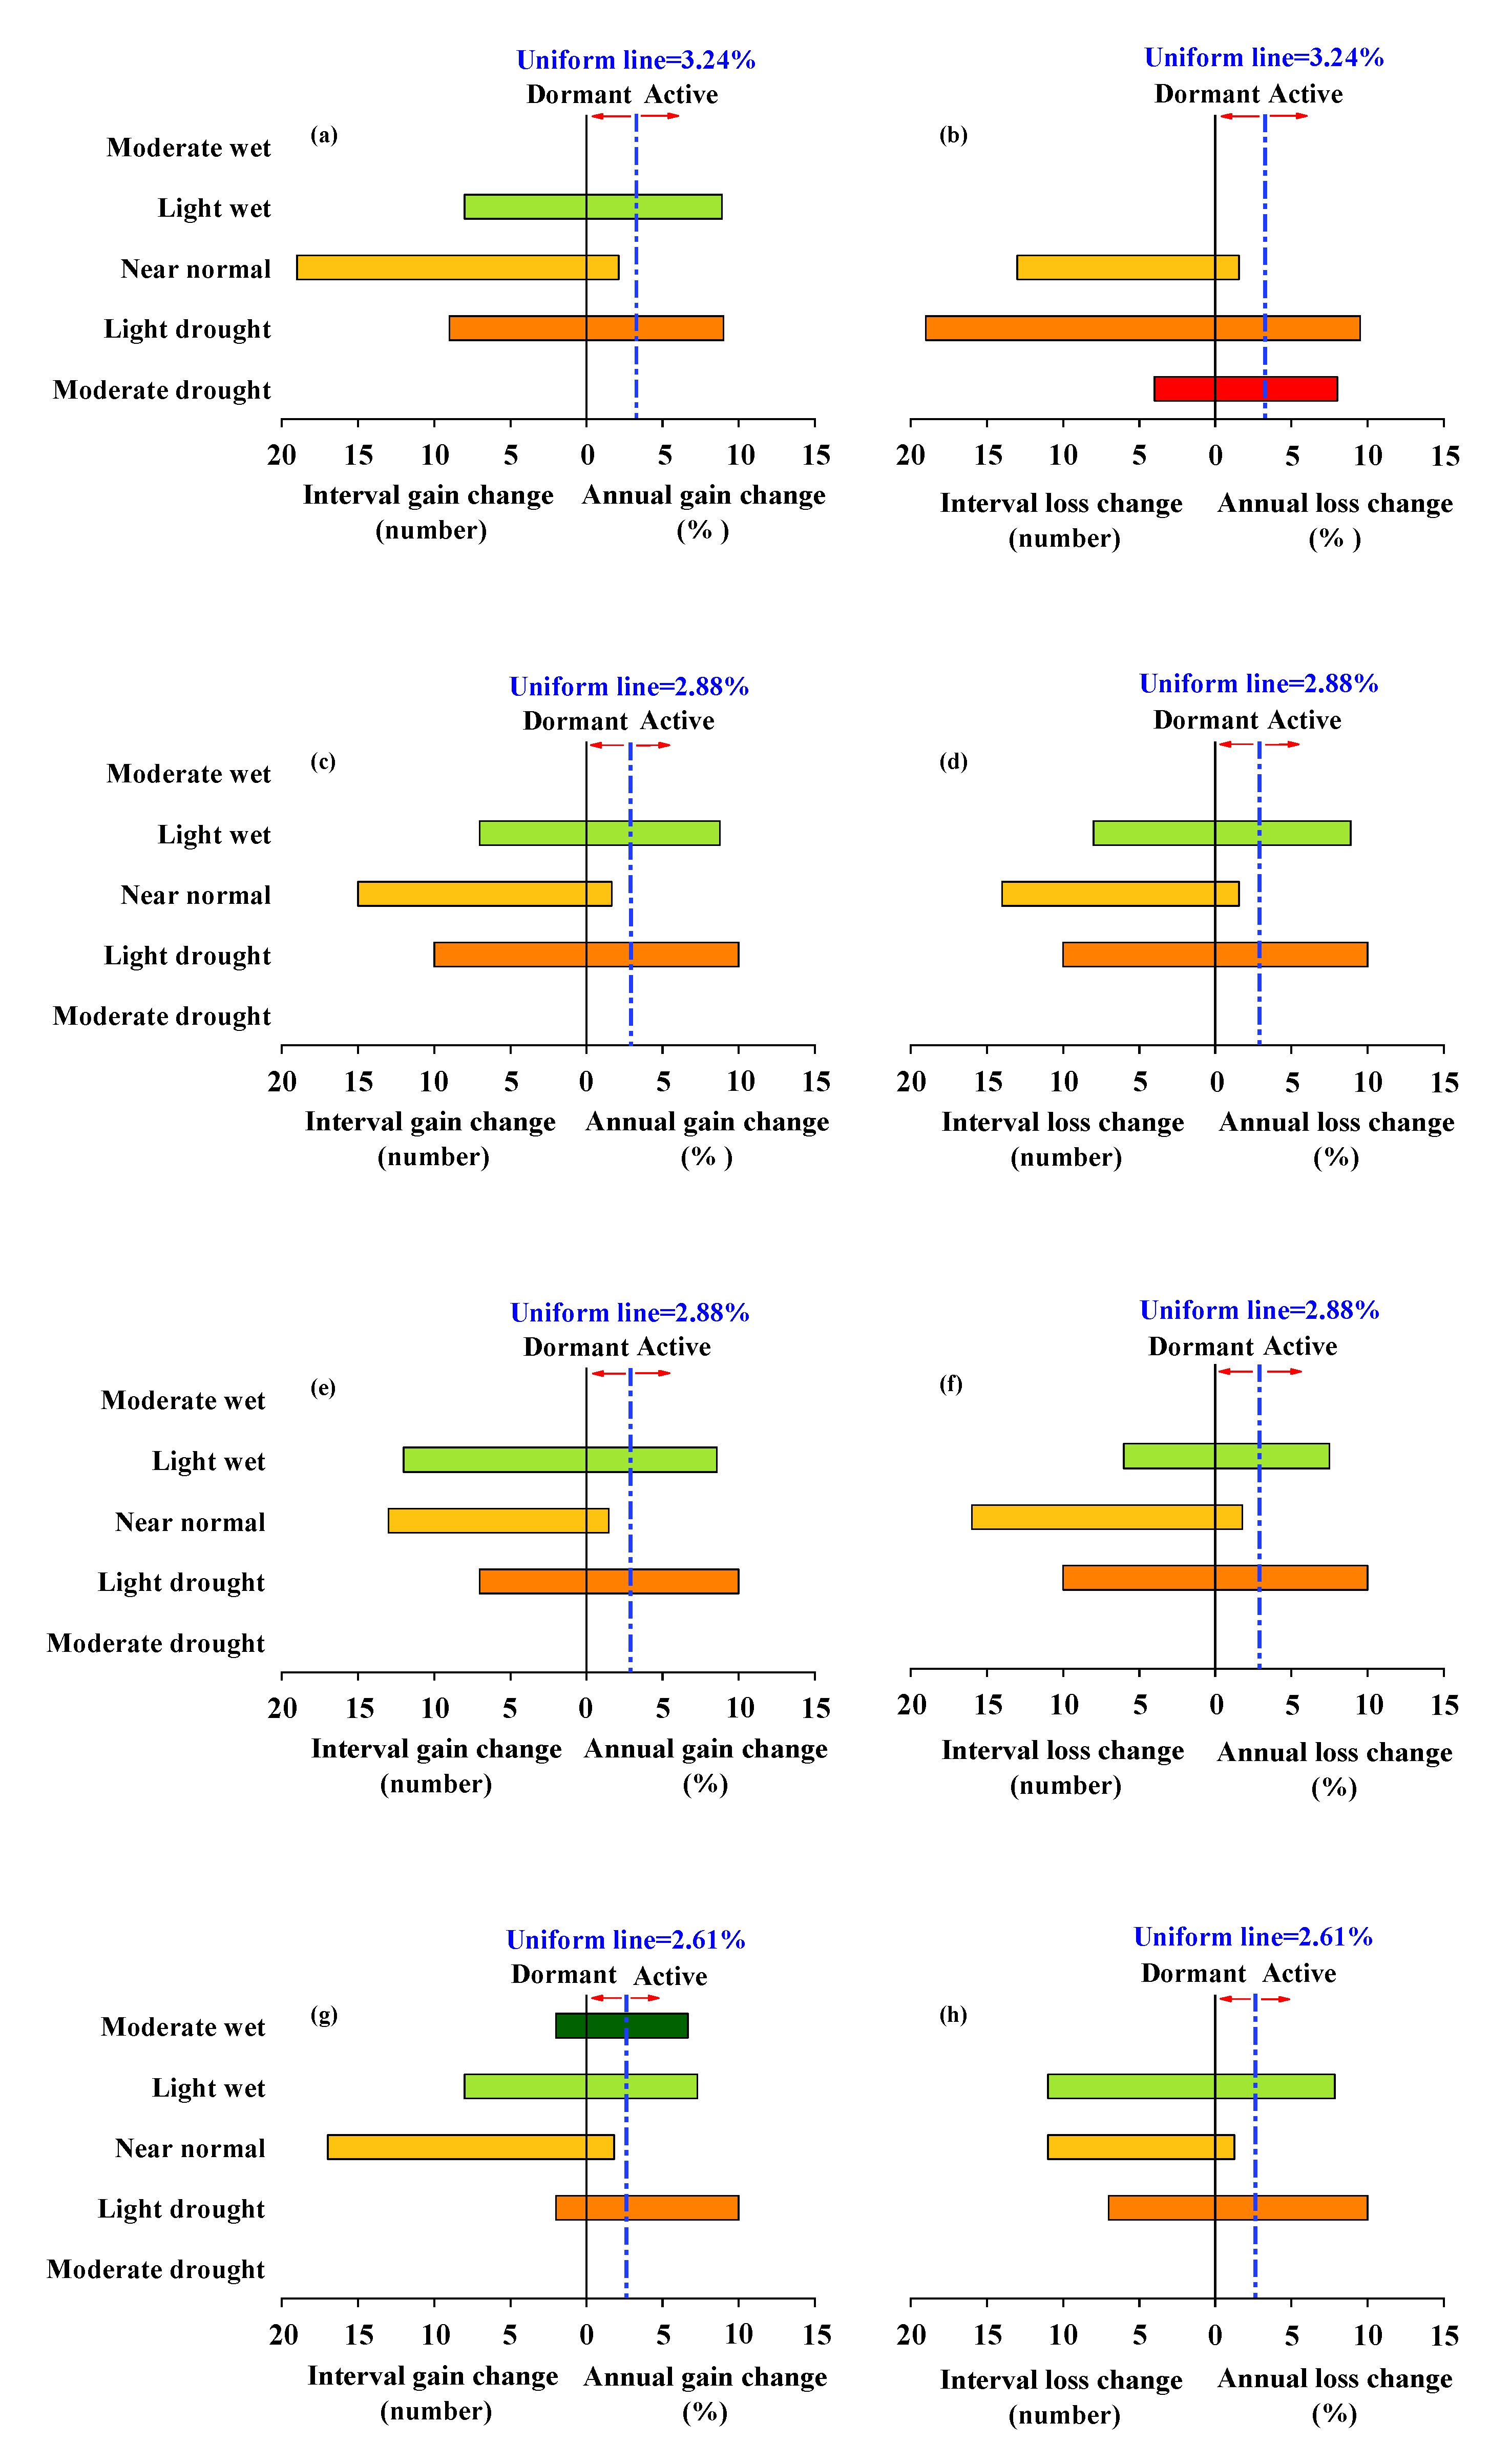
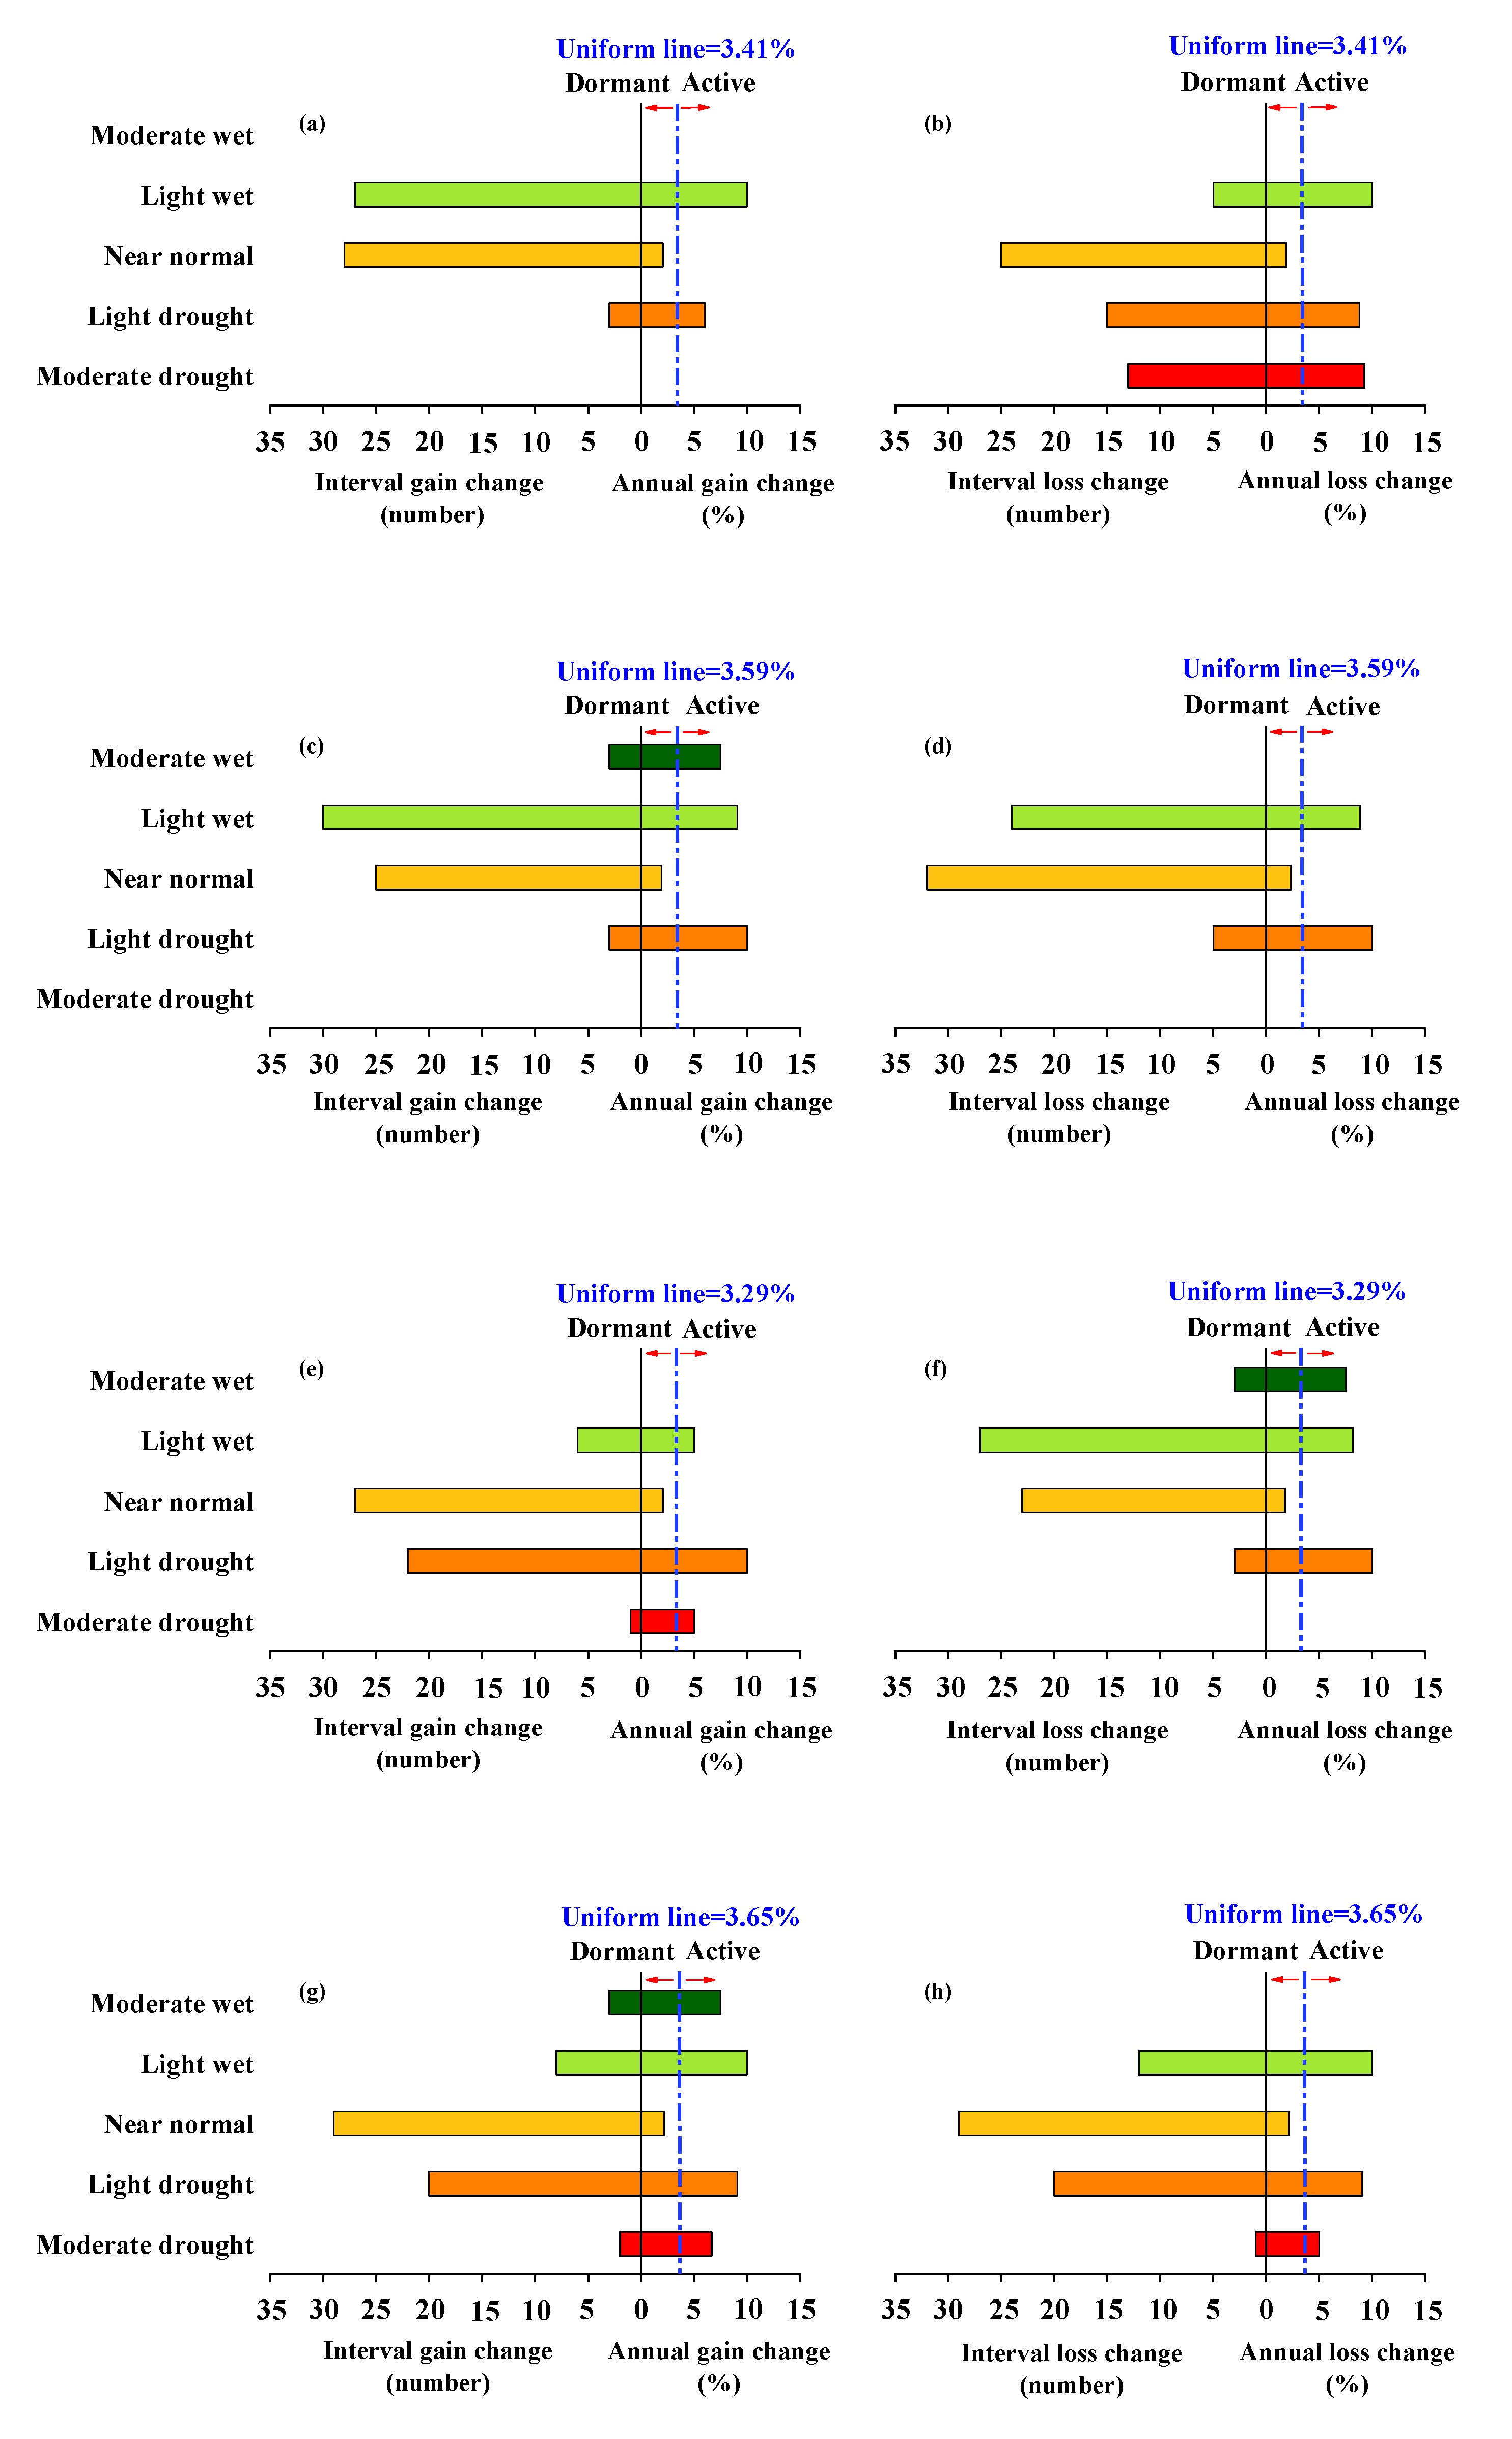
The category intensity analysis for the four time intervals on the TP were shown in Figure 6. The annual changes station of light wet gains and moderate drought losses were both relatively active during 1970s–1980s. The annual change station of light drought category was relatively active, and the change in stations of losses was larger than gains in the period of 1970s–1980s (Figure 6a,b). The changes of light wet and light drought categories were both relatively active in the interval of 1980s–1990s and 1990s–2000s, but their change rates of gains and losses were similar (Figure 6c–f). In the interval of 2000s–2010s, the change of moderate wet gains was relatively active and the moderately wet was zero in the 2000s. Meanwhile, the change of light drought category was relatively active, and the change in stations of losses was much larger than gains (Figure 6g–h). These results indicated that the losses of drought levels were larger than the gains in the light wet level on the TP during 1970s–1980s, followed by a maintenance phase during 1980s–1990s and 1990s–2000s, and the transition from the 2000s to 2010s was associated with wetting.
The category intensity analysis for the area surrounding the TP is shown in Figure 7. The annual change station of light wet and light drought categories were both relatively active in the interval of 1970s–1980s. The change in stations of light wet gains was larger than losses, and the change in stations of light drought losses was much larger than gains. The annual change station of moderate drought losses was relatively active, and the station of moderate drought category was zero in the 1980s (Figure 7a,b). The annual change stations of light wet category were relatively active, and the change in stations of gains was larger than losses in the period of 1980s–1990s. The annual change station of moderate wet gains was relatively active, and the stations of moderate wet were zero in the 1980s (Figure 7c,d). However, in the interval of 1990s–2000s, the annual change station of moderate wet losses was relatively active, and the stations of moderate wet were zero in the 1990s (Figure 7e–f). In this interval, the annual change station of light drought and light wet categories were also relatively active, and the former experienced a large increase, but the latter experienced a large decrease. The change situation in the interval of 2000s–2010s was similar to that in the interval of 1980s–1990s, but the change in stations of light wet losses was still larger than gains, while the change in stations of light drought gains was much larger than losses (Figure 7g–h). These results suggested that the surrounding areas of TP experienced a relatively wet period during 1970s–1990s and then turned into increasing drought since the 1990s, but the drought condition tended to weaken during 2000s–2010s.
3.4. Persistence Analysis of Trends in SPEIgs Variations
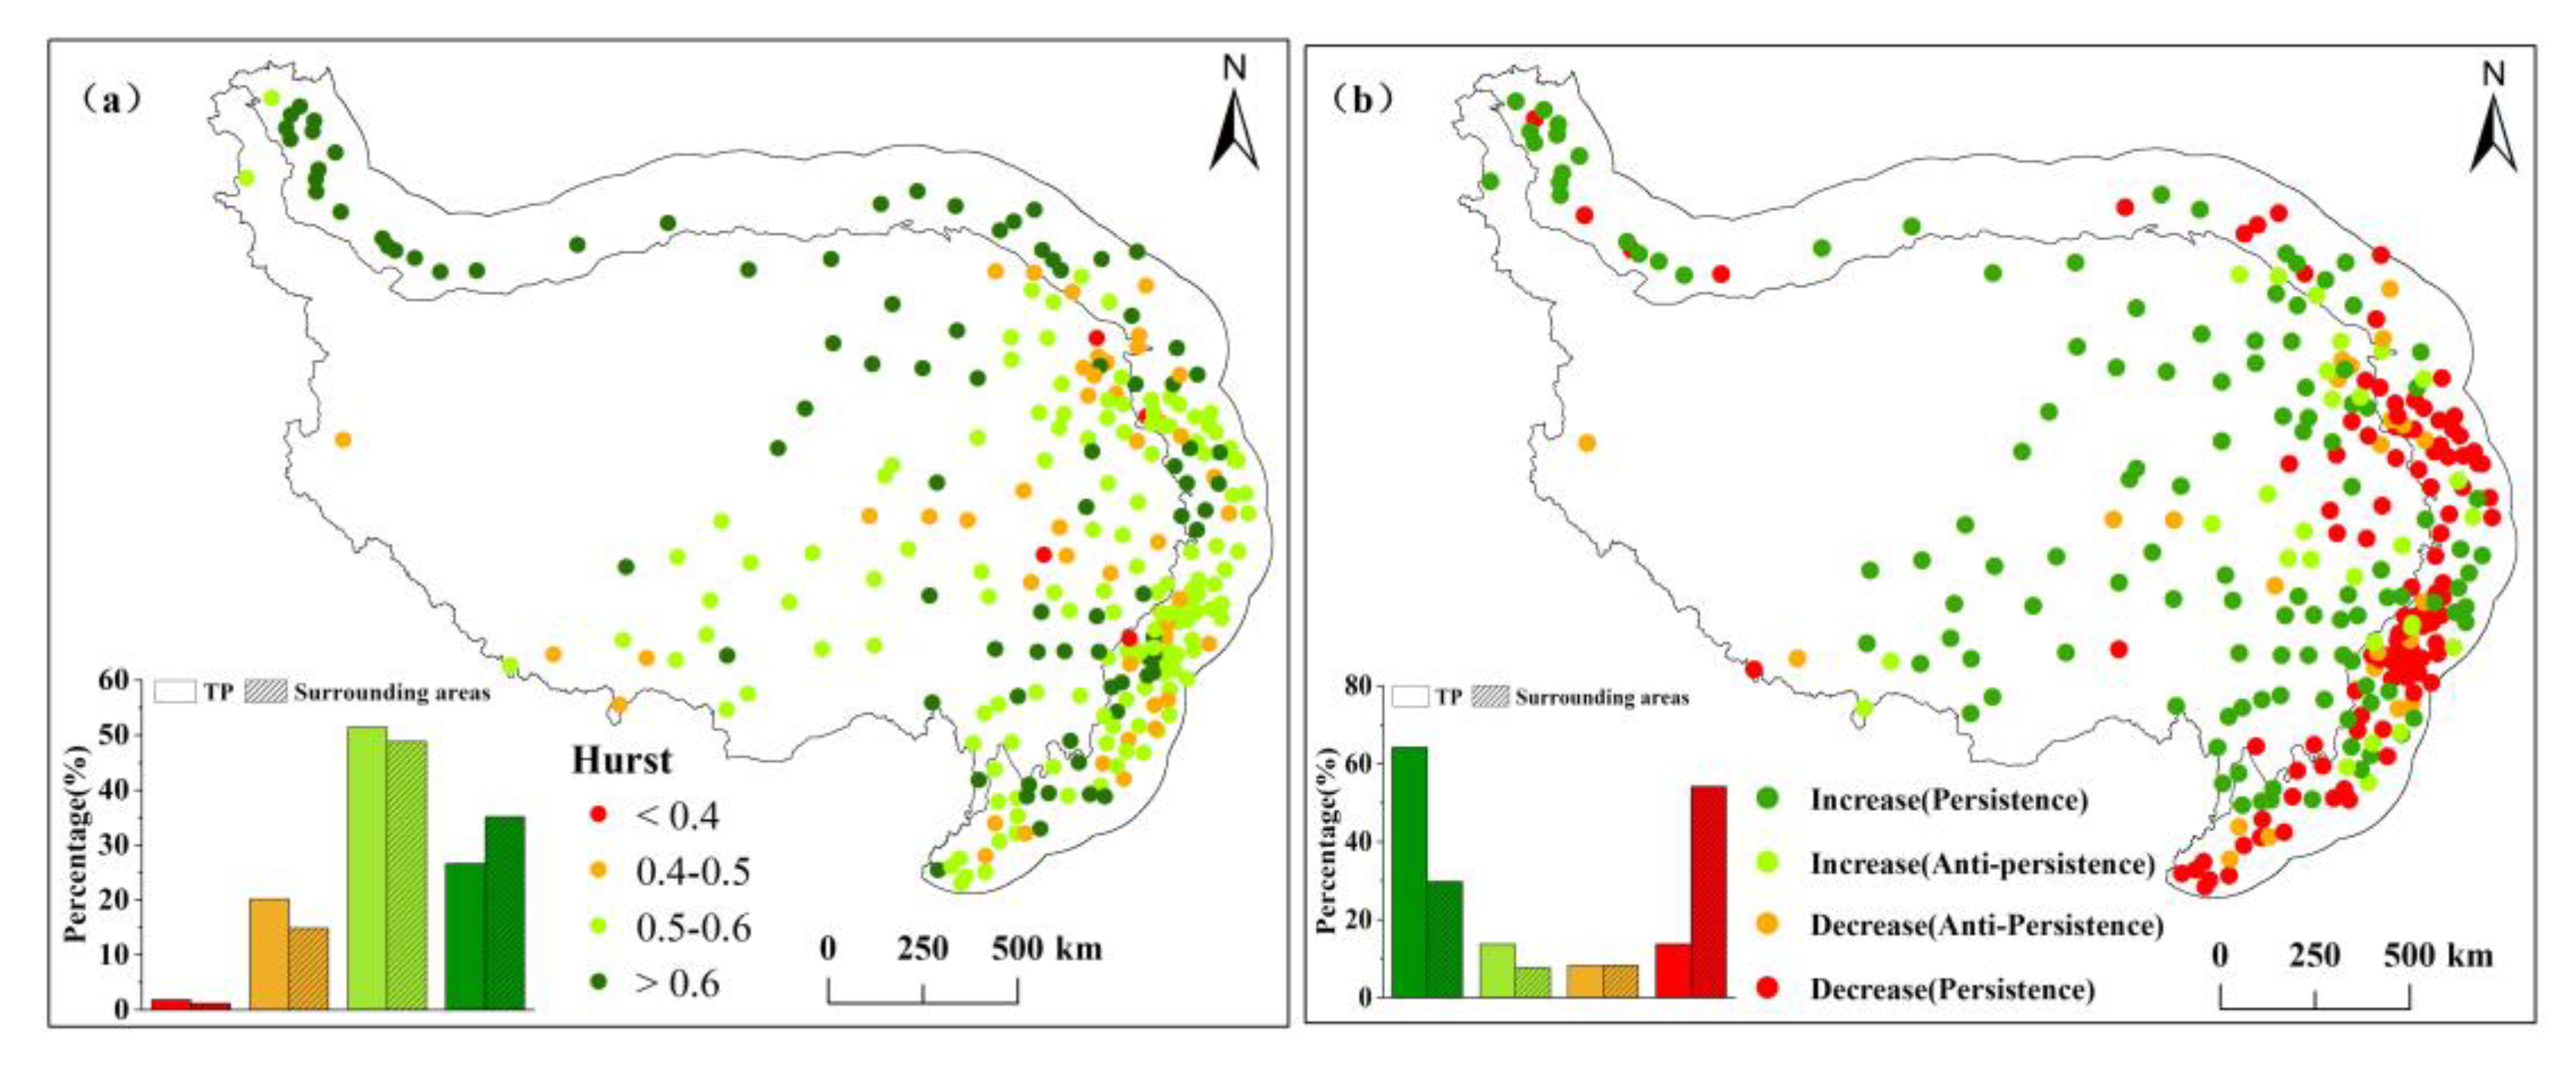
The persistence characteristics of future change trends in SPEIgs were analyzed based on the Hurst exponent of the SPEIgs. The Hurst exponent values of the entire TP and of the surrounding area were 0.55 and 0.56, respectively, indicating an overall consistent increasing trend of the SPEIgs on the TP and a consistent decreasing trend in the area surrounding the TP in the future. To further explore the spatial pattern of the consistency in the change trends of SPEIgs, we superimposed the results of SPEIgs trend analysis on the Hurst exponent on the TP and the surrounding area (Figure 4 and Figure 8a). The coupling results show that approximately three-quarters of stations are likely to exhibit wetting trends in the future on the TP (Figure 8b). Among them, the future trend at two-thirds of the stations is consistent with the historical continued wetting trend, located on the TP, except for the Eastern fringe of the TP (Figure 8b). In contrast, approximately 60% of stations are likely to display a drying trend in the future in the area surrounding the TP, most of which are consistent with the historical drying trend, except those in Southern Xinjiang Province.
4. Discussion
In this study, we revisited the changes in drought characteristics across the TP for the period of 1970–2017 using the SPEI based on the highly available and abundant records from national meteorological stations. Our analysis result confirms an overall wetting trend in the growing season on the TP since 1970, which corresponds with previous studies based on observational station data using the SPI/SPEI [25,29] and aridity index [27,28]. However, this finding is not in line with the results based on the sc-PDSI calculated with global reanalysis data sets [23,24]. This discrepancy might be related to the substantial biases in trends for the global gridded data on the TP [22,55]. Spatially, apart from the Eastern fringe of the TP, most of the stations on the TP were characterized by an obvious wetting trend, which is in good agreement with the finding that most areas of the TP experienced wetting trends over the past six decades [25,27].
Compared with previous assessments, however, two findings obtained in this study were not fully reported. First, there was no significant shift in the increasing trends of SPEIgs during 1970–2017 over the TP (Figure 3a and Figure A1a), which indicated that the TP has exhibited a continuous wetting trend since 1970. This is in strong contrast to the fact that the SPEIgs displayed a significant trend shift from wetting to drying around 1984 in the area surrounding the TP (Figure 3b and Figure A1b), resulting in a slight drying trend for the whole study period (Table 2). Liu et al. noted that the TP exhibited wetter states after 1987, compared to before 1987 [27]; however, the wetting trends were continuous throughout the whole study period.
Second, a consistent increasing trend of the SPEIgs was predicted for the entire TP and most stations of the TP, suggesting that the wetting trend on the TP is likely to continue in the future. Meanwhile, the rapid warming trend on the TP is projected to strengthen in this century [56]. Therefore, the future climate on the TP is expected to be warmer and wetter than the current climate, which might lead to profound influences on alpine vegetation growth and on the ecosystem function and services of the TP [57]. Additionally, the opposite trends in SPEIgs between the TP and the areas East of the TP were also predicted to continue in the future (Figure 8b).
Changes in meteorological drought are generally associated with anomalies in precipitation, temperature, and evaporation. The opposite trends in meteorological drought between the TP and its surrounding area were mainly related to the opposite change trends in precipitation [13,27,28,29,58]. An overall increasing trend in precipitation primarily led to an increasing trend in SPEIgs on the TP and in the areas North of the TP, followed by a change in wind speed, relative humidity, and sunshine duration, which contribute to the evaporation variation [29]. Previous assessments noted that the drying trend in the areas East of the TP was mainly due to the significant decrease in precipitation [58], coupled with a temperature increase [13]. The increasing evaporation driven by a temperature increase would influence the surface moisture status [59,60], but it is difficult to measure evaporation directly. Furthermore, precipitation variation is strongly driven by large-scale atmospheric circulations. Several studies have also noted that the drought evolution in the areas East of the TP has teleconnections with the change of the Asian summer monsoon [31], the ENSO strength [29] and even the strength of the polar vortex in Asia [32]. Further investigations of the complex mechanisms of the opposite drought trends between the TP and the surrounding area are still required.
5. Conclusions
This study re-examined the spatiotemporal evolution of drought in the growing season on the TP and its surrounding area during 1970–2017 using SPEI with potential evapotranspiration estimated by the Penman–Monteith equation. The analysis results showed that, in contrast to a significant trend shift from wetting to drying around 1984 in the area surrounding the TP, the TP exhibited a continuous wetting trend in the growing season during 1970–2017. Spatially, more than three-quarters of the stations on the TP were characterized by a wetting trend, apart from those on the Eastern fringe of the TP, whereas most of the stations in the areas East of the TP exhibited a drying trend. The results of the intensity analysis showed that the rate of drought/wet changes was relatively fast in the 1970s–1980s and gradually slowed afterward on the TP. The different drought levels were transformed into the light wet level on the TP during 1970s–1980s, followed by a maintenance phase during 1980s–1990s and 1990s–2000s, and the transition from 2000s to 2010s was associated with wetting. The wetting trend on the TP is likely to continue in the future, and the opposite trends in drought between the TP and the areas East of the TP are also predicted to continue.
Author Contributions
L.L. (Lanhui Li) conceived and designed this study, H.Z. analyzed the data, H.Z. and L.L. (Lanhui Li) wrote the paper; M.D. and L.L. (Linshan Liu) revised the paper and contributed to result explanation and discussion. All authors have read and approved the final vision of the manuscript.
Funding
This work is funded by the Strategic Priority Research Program of the Chinese Academy of Sciences (XDA20040201), the second Tibetan Plateau Scientific Expedition and Research Program (STEP) (2019QZKK060300), the National Science Foundation of China (No.41761144081) and Jiangxi Normal University Graduate Innovation Foundation (YC2018-S171).
Conflicts of Interest
The authors declare no conflict of interest.
Appendix A
Figure A1.
Locally weighted polynomial regression analyses for the SPEIgs during 1970–2017 on the Tibetan Plateau (a) and its surrounding area (b).
Figure A1.
Locally weighted polynomial regression analyses for the SPEIgs during 1970–2017 on the Tibetan Plateau (a) and its surrounding area (b).

References
- Stocker, B.D.; Zscheischler, J.; Keenan, T.F.; Prentice, I.C.; Seneviratne, S.I.; Peñuelas, J. Drought impacts on terrestrial primary production underestimated by satellite monitoring. Nat. Geosci. 2019, 12, 264–270. [Google Scholar] [CrossRef]
- Vicente-Serrano, S.M.; Beguería, S.; López-Moreno, J.I. A multiscalar drought index sensitive to global warming: The standardized precipitation evapotranspiration index. J. Clim. 2010, 23, 1696–1718. [Google Scholar] [CrossRef] [Green Version]
- Trenberth, K.E.; Dai, A.; van der Schrier, G.; Jones, P.D.; Barichivich, J.; Briffa, K.R.; Sheffield, J. Global warming and changes in drought. Nat. Clim. Chang. 2014, 4, 17–22. [Google Scholar] [CrossRef]
- Dai, A. Increasing drought under global warming in observations and models. Nat. Clim. Chang. 2013, 3, 52–58. [Google Scholar] [CrossRef]
- Tong, S.; Lai, Q.; Zhang, J.; Bao, Y.; Lusi, A.; Ma, Q.; Li, X.; Zhang, F. Spatiotemporal drought variability on the Mongolian Plateau from 1980–2014 based on the SPEI-PM, intensity analysis and Hurst exponent. Sci. Total Environ. 2018, 615, 1557–1565. [Google Scholar] [CrossRef] [PubMed]
- Cook, B.I.; Smerdon, J.E.; Seager, R.; Coats, S. Global warming and 21st century drying. Clim. Dynam. 2014, 43, 2607–2627. [Google Scholar] [CrossRef] [Green Version]
- Su, B.; Huang, J.; Fischer, T.; Wang, Y.; Kundzewicz, Z.W.; Zhai, J.; Sun, H.; Wang, A.; Zeng, X.; Wang, G.; et al. Drought losses in China might double between the 1.5 °C and 2.0 °C warming. Proc. Natl. Acad. Sci. USA 2018, 115, 10600–10605. [Google Scholar] [CrossRef] [Green Version]
- Mckee, T.B.; Doesken, N.J.; Kleist, J. The relationship of drought frequency and duration to time scales. In Proceedings of the 8th Conference on Applied Climatology, Boston, MA, USA, 17–22 January 1993; pp. 179–183. [Google Scholar]
- Palmer, W.C. Meteorological Drought; Research paper no. 45; US Weather Bureau: Washington, DC, USA, 1965; p. 58.
- Wells, N.; Goddard, S.; Hayes, M.J. A self-calibrating palmer drought severity index. J. Clim. 2004, 17, 2335–2351. [Google Scholar] [CrossRef]
- Chen, H.; Sun, J. Changes in drought characteristics over China using the standardized precipitation evapotranspiration index. J. Clim. 2015, 28, 5430–5447. [Google Scholar] [CrossRef]
- Beguería, S.; Vicente-Serrano, S.M.; Reig, F.; Latorre, B. Standardized precipitation evapotranspiration index (SPEI) revisited: parameter fitting, evapotranspiration models, tools, datasets and drought monitoring. Int. J. Climatol. 2014, 34, 3001–3023. [Google Scholar]
- Yu, M.; Li, Q.; Hayes, M.J.; Svoboda, M.D.; Heim, R.R. Are droughts becoming more frequent or severe in China based on the Standardized Precipitation Evapotranspiration Index: 1951–2010? Int. J. Climatol. 2014, 34, 545–558. [Google Scholar] [CrossRef]
- Liu, L.; Niu, Q.; Heng, J.; Li, H.; Xu, Z. Transition characteristics of the dry-wet regime and vegetation dynamic responses over the Yarlung Zangbo River basin, southeast Qinghai-Tibet Plateau. Remote Sens. 2019, 11, 1254. [Google Scholar] [CrossRef] [Green Version]
- Hao, Z.; Singh, V.P. Drought characterization from a multivariate perspective: A review. J. Hydrol. 2015, 527, 668–678. [Google Scholar] [CrossRef]
- Kang, S.; Xu, Y.; You, Q.; Flügel, W.; Pepin, N.; Yao, T. Review of climate and cryospheric change in the Tibetan Plateau. Environ. Res. Lett. 2010, 5, 15101. [Google Scholar] [CrossRef]
- Yao, T.; Xue, Y.; Chen, D.; Chen, F.; Thompson, L.; Cui, P.; Koike, T.; Lau, W.K.M.; Lettenmaier, D.; Mosbrugger, V.; et al. Recent Third Pole’s rapid warming accompanies cryospheric melt and water cycle intensification and interactions between monsoon and environment: Multi-Disciplinary approach with observation, modeling and analysis. B. Am. Meteorol. Soc. 2019, 100, 423–444. [Google Scholar] [CrossRef]
- Liu, D.; Wang, T.; Yang, T.; Yan, Z.; Liu, Y.; Zhao, Y.; Piao, S. Deciphering impacts of climate extremes on Tibetan grasslands in the last fifteen years. Sci. Bulletin. 2019, 64, 446–454. [Google Scholar] [CrossRef] [Green Version]
- Yan, L.; Liu, X. Has climatic warming over the Tibetan Plateau paused or continued in recent years. J. Earth Ocean Atmos. Sci. 2014, 30, 544–545. [Google Scholar]
- Wei, K.; Wang, L. Reexamination of the aridity conditions in arid northwestern China for the last decade. J. Clim. 2013, 26, 9594–9602. [Google Scholar] [CrossRef]
- Kuang, X.; Jiao, J.J. Review on climate change on the Tibetan Plateau during the last half century. J. Geophys. Res. Atmos. 2016, 121, 3979–4007. [Google Scholar] [CrossRef]
- You, Q.; Min, J.; Zhang, W.; Pepin, N.; Kang, S. Comparison of multiple datasets with gridded precipitation observations over the Tibetan Plateau. Clim. Dynam. 2015, 45, 791–806. [Google Scholar] [CrossRef]
- Shao, D.; Chen, S.; Tan, X.; Gu, W. Drought characteristics over China during 1980–2015. Int. J. Climatol. 2018, 38, 3532–3545. [Google Scholar] [CrossRef]
- Wang, Z.; Li, J.; Lai, C.; Zeng, Z.; Zhong, R.; Chen, X.; Zhou, X.; Wang, M. Does drought in China show a significant decreasing trend from 1961 to 2009? Sci. Total Environ. 2017, 579, 314–324. [Google Scholar] [CrossRef] [PubMed]
- Wang, W.; Zhu, Y.; Xu, R.; Liu, J. Drought severity change in China during 1961–2012 indicated by SPI and SPEI. Nat. Hazards. 2015, 75, 2437–2451. [Google Scholar] [CrossRef]
- Wang, A.; Lettenmaier, D.P.; Sheffield, J. Soil moisture drought in China, 1950–2006. J. Clim. 2011, 24, 3257–3271. [Google Scholar] [CrossRef]
- Liu, L.; Wang, Y.; You, N.; Liang, Z.; Qin, D.; Li, S. Changes in aridity and its driving factors in China during 1961–2016. Int. J. Climatol. 2019, 39, 50–60. [Google Scholar] [CrossRef] [Green Version]
- Gao, Y.; Li, X.; Leung, R.L.; Chen, D.; Xu, J. Aridity changes in the Tibetan Plateau in a warming climate. Environ. Res. Lett. 2015, 10, 34013. [Google Scholar] [CrossRef]
- Wang, H.; Chen, Y.; Pan, Y.; Chen, Z.; Ren, Z. Assessment of candidate distributions for SPI/SPEI and sensitivity of drought to climatic variables in China. Int. J. Climatol. 2019, 39, 4392–4412. [Google Scholar] [CrossRef]
- Liang, J.; Zhang, B.; Ma, B.; Wei, H. Drought evolution characteristics on the Tibetan Plateau based on daily standardized precipitation evapotranspiration index. J. Glaciol. Geocryol. 2018, 40, 1100–1109. [Google Scholar]
- Li, Y.; Wang, Z.; Zhang, Y.; Li, X.; Huang, W. Drought variability at various timescales over Yunnan Province, China: 1961–2015. Theor. Appl. Climatol. 2019, 138, 1–15. [Google Scholar] [CrossRef]
- Wang, Z.; Li, J.; Lai, C.; Huang, Z.; Zhong, R.; Zeng, Z.; Chen, X. Increasing drought has been observed by SPEI_pm in Southwest China during 1962–2012. Theor. Appl. Climatol. 2018, 133, 23–38. [Google Scholar] [CrossRef]
- Wang, D.; Zhang, B.; An, M.; Zhang, T. Temporal and spatial distributions of drought in southwest China over the past 53 years based on standardized precipitation evapotranspiration index. J. Nat. Resour. 2014, 29, 1003–1016. [Google Scholar]
- Yao, J.; Zhao, Y.; Chen, Y.; Yu, X.; Zhang, R. Multi-scale assessments of droughts: A case study in Xinjiang, China. Sci. Total Environ. 2018, 630, 444–452. [Google Scholar] [CrossRef] [PubMed]
- Yi-Li, Z.; Bing-Yuan, L.; Du, Z. A discussion on the boundary and area of the Tibetan Plateau in China. Geogr. Res. 2002, 21, 1–8. [Google Scholar]
- Duan, A.; Wu, G.; Liu, Y.; Ma, Y.; Zhao, P. Weather and climate effects of the Tibetan Plateau. Adv. Atmos. Sci. 2012, 29, 978–992. [Google Scholar] [CrossRef]
- Pan, B.; Li, J. Qjinghai-Tibetan Plateau: A driver and amplifier of the global climate change–III. The impact of climate change on the Qinghai-Tibet Plateau’s uplift. J. Lan Zhou Univ. 1996, 1, 108–115. [Google Scholar]
- Cao, L.; Zhu, Y.; Tang, G.; Yuan, F.; Yan, Z. Climatic warming in China according to a homogenized data set from 2419 stations. Int. J. Climatol. 2016, 36, 4384–4392. [Google Scholar] [CrossRef] [Green Version]
- Liu, X.; Zhu, X.; Pan, Y.; Li, S.; Zhang, D.; Liu, Y. The spatial-temporal changes of cold surge in Inner Mongolia during recent 53 years. Acta Geogr. Sinica. 2014, 69, 1013–1024. [Google Scholar]
- Ding, M.; Zhang, Y.; Sun, X.; Liu, L.; Wang, Z.; Bai, W. Spatiotemporal variation in alpine grassland phenology in the Qinghai-Tibetan Plateau from 1999 to 2009. Chin. Sci. Bull. 2013, 58, 396–405. [Google Scholar] [CrossRef] [Green Version]
- Thornthwaite, C.W. An approach toward a rational classification of climate. Geogr. Rev. 1948, 38, 55–94. [Google Scholar] [CrossRef]
- Ye, L.; Shi, K.; Zhang, H.; Xin, Z.; Hu, J.; Zhang, C. Spatio-Temporal analysis of drought indicated by SPEI over northeastern China. Water 2019, 11, 908. [Google Scholar] [CrossRef] [Green Version]
- Mann, H.B. Nonparametric tests against trend. Econom. J. Econom. Soc. 1945, 13, 245–259. [Google Scholar] [CrossRef]
- Kendall, M.G. Rank Correlation Methods, 4th ed.; Charles Griffin: London, UK, 1975. [Google Scholar]
- Sen, P.K. Estimates of the regression coefficient based on Kendall’s Tau. J. Am. Stat. Assoc. 1968, 63, 1379–1389. [Google Scholar] [CrossRef]
- Page, E.S. A test for a change in a parameter occurring at an unknown point. Biometrika. 1955, 42, 523–527. [Google Scholar] [CrossRef]
- Quandt, R.E. The estimation of the parameters of a linear regression system obeying two separate regimes. J. Am. Stat. Assoc. 1958, 53, 873–880. [Google Scholar] [CrossRef]
- Wang, S.; Wang, Z.; Piao, S.; Fang, J. Regional differences in the timing of recent air warming during the past four decades in China. Chin. Sci. Bull. 2010, 55, 1968–1973. [Google Scholar] [CrossRef]
- Li, L.; Zhang, Y.; Qi, W.; Wang, Z.; Liu, Y.; Ding, M. No significant shift of warming trend over the last two decades on the mid-south of Tibetan Plateau. Atmosphere 2019, 10, 416. [Google Scholar] [CrossRef] [Green Version]
- Muggeo, V.M.R. Testing with a nuisance parameter present only under the alternative: a score-based approach with application to segmented modelling. J. Stat. Comput. Sim. 2016, 86, 3059–3067. [Google Scholar] [CrossRef]
- Aldwaik, S.Z.; Pontius, R.G. Intensity analysis to unify measurements of size and stationarity of land changes by interval, category, and transition. Landsc. Urban Plan. 2012, 106, 103–114. [Google Scholar] [CrossRef]
- Wang, Y.; Liu, G.; Guo, E. Spatial distribution and temporal variation of drought in Inner Mongolia during 1901–2014 using Standardized Precipitation Evapotranspiration Index. Sci. Total Environ. 2019, 654, 850–862. [Google Scholar] [CrossRef]
- Hurst, E.H. Long-Term storage capacity of reservoirs. Trans. Am. Soc. Civ. Eng. 1951, 116, 770–808. [Google Scholar]
- Wallis, M.A. Robustness of the rescaled range R/S in the measurement noncyclic long run statistical dependence. Water Resour. Res. 1969, 5, 967–988. [Google Scholar]
- You, Q.; Fraedrich, K.; Ren, G.; Ye, B.; Meng, X.; Kang, S. Inconsistencies of precipitation in the eastern and central Tibetan Plateau between surface adjusted data and reanalysis. Theor. Appl. Climatol. 2012, 109, 485–496. [Google Scholar] [CrossRef]
- Palazzi, E.; Filippi, L.; von Hardenberg, J. Insights into elevation-dependent warming in the Tibetan Plateau-Himalayas from CMIP5 model simulations. Clim. Dynam. 2017, 48, 3991–4008. [Google Scholar] [CrossRef] [Green Version]
- Yao, T.; Wu, F.; Ding, L.; Sun, J.; Zhu, L.; Piao, S.; Deng, T.; Ni, X.; Zheng, H.; Ouyang, H. Multispherical interactions and their effects on the Tibetan Plateau’s earth system: A review of the recent researches. Natl. Sci. Rev. 2016, 2, 468–488. [Google Scholar] [CrossRef] [Green Version]
- Xu, K.; Yang, D.; Yang, H.; Li, Z.; Qin, Y.; Shen, Y. Spatio-Temporal variation of drought in China during 1961–2012: A climatic perspective. J. Hydrol. 2015, 526, 253–264. [Google Scholar] [CrossRef]
- Ma, Z.; Fu, C. Some evidence of drying trend over northern China from 1951 to 2004. Chin. Sci. Bull. 2006, 51, 2913–2925. [Google Scholar] [CrossRef]
- Sheffield, J.; Wood, E.F.; Roderick, M.L. Little change in global drought over the past 60 years. Nature 2012, 491, 435–438. [Google Scholar] [CrossRef]
Figure 1.
The study area and the meteorological stations. The black and red circles indicate the meteorological stations located on the Tibetan Plateau and its surrounding areas, respectively.
Figure 1.
The study area and the meteorological stations. The black and red circles indicate the meteorological stations located on the Tibetan Plateau and its surrounding areas, respectively.

Figure 2.
Variation in the SPEIgs on the Tibetan Plateau (TP) and the surrounding area during 1970–2017.
Figure 2.
Variation in the SPEIgs on the Tibetan Plateau (TP) and the surrounding area during 1970–2017.

Figure 3.
Trend shift in SPEIgs on the Tibetan Plateau (a) and the surrounding area (b).

Figure 4.
Spatial distribution of trends in the SPEIgs on the TP and its surrounding area during 1970−2017. The trends were estimated by the Theil–Sen approach.
Figure 4.
Spatial distribution of trends in the SPEIgs on the TP and its surrounding area during 1970−2017. The trends were estimated by the Theil–Sen approach.

Figure 5.
The interval level intensity analysis on the TP (a) and in the surrounding area (b). The gray bar denotes the time intensity, and the blue dashed line refers to the uniform line. If the gray bar surpasses the blue dashed line, the change in the drought in a certain time interval is considered relatively fast, and vice versa.

Figure 6.
Category intensity analysis for each time interval on the TP. The blue dashed line represents the uniform line; if a bar surpasses the blue dashed line, the change in the corresponding drought category in the given time interval is considered relatively active, and vice versa. (a,b) for 1970s–1980s, (c,d) for 1980s–1990s, (e,f) for 1990s–2010s, and (g,h) for 2000s–2010s. (a), (c), (e), and (g) for gains, and (b), (d), (f), and (h) for losses.

Figure 7.
Similar to Figure 6, but for the area surrounding the TP.
Figure 7.
Similar to Figure 6, but for the area surrounding the TP.

Figure 8.
Spatial distribution of the Hurst exponent (a) and persistence (b) of the trend in SPEIgs on the TP and the surrounding area.
Figure 8.
Spatial distribution of the Hurst exponent (a) and persistence (b) of the trend in SPEIgs on the TP and the surrounding area.


Table 1.
Drought category based on the SPEI.
| Number | SPEI Value | Classification |
|---|---|---|
| 1 | SPEI ≥ 2.0 | Extreme wet |
| 2 | 1.5 ≤ SPEI < 2.0 | Severe wet |
| 3 | 1.0 ≤ SPEI < 1.5 | Moderate wet |
| 4 | 0.5 ≤ SPEI < 1.0 | Light wet |
| 5 | −0.5 ≤ SPEI < 0.5 | Near normal |
| 6 | −1.0 ≤ SPEI < −0.5 | Light dry |
| 7 | −1.5 ≤ SPEI < −1.0 | Moderate dry |
| 8 | −2.0 ≤ SPEI < −1.5 | Severe dry |
| 9 | SPEI ≤ −2.0 | Extreme dry |
Table 2.
Trend analysis of the SPEIgs on the TP and in the surrounding area during 1970–2017 based on two trend estimation methods.
Table 2.
Trend analysis of the SPEIgs on the TP and in the surrounding area during 1970–2017 based on two trend estimation methods.
| Region | Theil-Sen Estimator | Least Squares Estimator | ||
|---|---|---|---|---|
| Trend (Decade−1) | p-Value | Trend (Decade−1) | p-Value | |
| TP | 0.10 | 0.02 | 0.10 | 0.02 |
| Area surrounding TP | −0.02 | 0.65 | −0.01 | 0.83 |
© 2019 by the authors. Licensee MDPI, Basel, Switzerland. This article is an open access article distributed under the terms and conditions of the Creative Commons Attribution (CC BY) license (http://creativecommons.org/licenses/by/4.0/).
Share and Cite
MDPI and ACS Style
Zhang, H.; Ding, M.; Li, L.; Liu, L. Continuous Wetting on the Tibetan Plateau during 1970–2017. Water 2019, 11, 2605. https://doi.org/10.3390/w11122605
AMA Style
Zhang H, Ding M, Li L, Liu L. Continuous Wetting on the Tibetan Plateau during 1970–2017. Water. 2019; 11(12):2605. https://doi.org/10.3390/w11122605
Chicago/Turabian StyleZhang, Huamin, Mingjun Ding, Lanhui Li, and Linshan Liu. 2019. "Continuous Wetting on the Tibetan Plateau during 1970–2017" Water 11, no. 12: 2605. https://doi.org/10.3390/w11122605
Note that from the first issue of 2016, this journal uses article numbers instead of page numbers. See further details here.