Examination of Blockage Effects on the Progression of Local Scour around a Circular Cylinder


Department of Civil and Environmental Engineering, University of Windsor, Windsor, ON N9B 3P4, Canada
*
Author to whom correspondence should be addressed.
Water 2019, 11(12), 2631; https://doi.org/10.3390/w11122631
Submission received: 30 October 2019
/
Revised: 27 November 2019
/
Accepted: 11 December 2019
/
Published: 13 December 2019
(This article belongs to the Special Issue Experimental, Numerical and Field Approaches to Scour Research)
Abstract
:An evaluation of scour estimation methods has indicated that the effects of blockage ratio are neglected in both scour modelling and development of new predictive methods. The role of channel blockage on the mechanism and progression of local scour is not well understood, and further analysis is required in order to incorporate this effect into scour estimation. In the present investigation, local scour experiments were carried out under varying blockage ratio. The results were compared with data from literature in order to explore the effects of blockage ratio (D/b, where D is the pier diameter, and b is the channel width) on equilibrium scour depth (dse/D, where dse is the depth of scour at equilibrium). It was determined that D/b had a small influence on both dse/D and the progression of scour depth (ds/D) when relative coarseness D/d50 < 100 (where d50 is the median diameter of sediment), and that the influence appeared to be amplified when D/d50 > 100. The efficacy of scour estimation methods used to predict the progression of local scour was also dependent on D/d50. A method of scour estimation used to predict dse/D was evaluated, and it was similarly found to be particularly effective when D/d50 < 100. In future work, further experiments and analysis in the range of D/d50 > 100 are required in order to establish the role of D/b under prototype conditions and to refine existing scour estimation methods.
1. Introduction
1.1. The Cost of Scour
Scour and erosion have been well established as leading causes of bridge failures. Over half of bridge failures in the United States alone have been attributed to scour [1,2]. Damage to roadway infrastructure due to scour can consist of minor erosion or complete failure of a bridge. Restoration of an overwater bridge of any size can require significant expenditure, cause disruption of local traffic and pose appreciable risk to surrounding ecosystems. In addition to capital for reconstruction, costs include rerouting of traffic and potential erection of temporary service bridges which can exceed the cost of replacement itself by 50 percent [3]. Furthermore, it has been estimated that indirect losses incurred by the general public, local business, and industry are five times greater than reconstruction costs alone [4]. Most crucially, due to the sudden nature of collapses caused by scour, failure of this type can result in loss of life.
In 1987, riprap protection around one pier of the Schoharie Creek Bridge on Interstate 90 over Schoharie Creek in New York failed due to spring flooding. The unprotected pier footing failed in tension, causing collapse of the pier and two spans of the bridge, resulting in the deaths of 10 motorists [5]. In 1995, a road bridge on Interstate 5 over Arroyo Pasajero in California collapsed, similarly under flood conditions. The collapse resulted in the deaths of seven motorists. After investigation by the Federal Highway Administration (FHWA), the cause of failure was found to be bed degradation due to the presence of flooding [4].
In 2013, a single pier of the Bonnybrook Bridge over the Bow River in Alberta, Canada, was undermined due to scour during an unprecedented rainfall event, causing derailment of six cars of a passing Canadian Pacific Railway freight train. Fortunately, the collapse did not result in any fatalities. The derailed train cars were transporting industrial chemicals (including petroleum products) and flammable liquids which were contained during the incident [6,7]. A subsequent investigation by the Government of Canada [7] stated: “If measures are not taken to inhibit local scour, especially at bridges with spread footing foundations, there is an increased risk that high water events will lead to bridge failures.”
1.2. The Mechanism of Local Scour
When a structure such as a circular cylinder is introduced into a fluvial environment, there are several features which are induced in the surrounding flow field. One such feature is the downflow, which is formed when the approach flow decelerates leading up to the upstream face of the cylinder. Due to the nature of the velocity profile of the approach flow in an open channel, the pressure changes along the stagnation line, driving the flow downwards. This feature is known as the downflow, which impinges upon the bed at the base of the cylinder [8,9].
A horseshoe vortex (HSV) is formed when the downflow rolls up to form a vortex tube at the junction between the base of the cylinder and the bed. The legs of the HSV wrap around the cylinder extending in the downstream direction and are occasionally broken up and shed. A necklace or collar vortex is formed when the adverse pressure gradient (APG) associated with the stagnation line causes flow separation in the near-bed region. The boundary layer on the bed surface around the pier separates and the vorticity from the approach flow causes formation of a necklace vortex in the region of maximum shear stress in the vicinity of the cylinder. The necklace vortex is broken up in the wake region by the high bed shear stress and interaction with the wake vortices. The necklace vortex contributes to scour [10], and the HSV is one of the primary mechanisms by which sediment is removed from around the base of the cylinder. The vortical motion of the HSV entrains sediment from the bed into the flow around the cylinder. The size and strength of the HSV are related to the size of the scour hole around the cylinder, and both will continue to increase until equilibrium is reached. This is the point at which the strength of the HSV is no longer sufficiently high to continue to remove sediment from the bottom of the scour hole or when the critical shear stress of sediment at the bottom of the scour hole is no longer exceeded [8,9].
The vortices in the von Kármán vortex street are formed due to the shear layers which are detached from either side of the cylinder. Flow velocity is maximized along the separating streamline, and scour is thus initiated along the sides of the cylinder where the bed shear stress is also highest. The wake vortices shed alternately from the cylinder and carry the entrained sediment from the HSV region past the cylinder into the wake region. Downstream of the cylinder, the size of the wake vortices increases, causing them to weaken and deposit the sediment in dune-like formations [9]. From this discussion, it can be inferred that the strength and structure of the downflow, the horseshoe vortex, and the wake vortices are unsteady and highly influential on local scour around a cylinder. It is important to make note of the significant variation in structure, strength, and scale of each of the aforementioned turbulence structures.
1.3. Scale Effects in Hydraulic Modelling
Experimental modelling of local scour around a cylinder has been comprehensively explored for an appreciable range of flow, structure, and bed material characteristics. Typical scour experiments involve installation of a cylinder in a sediment recess filled with bed material of a prescribed size within a recirculating flume, from which point scour is allowed to progress until equilibrium is reached. The geometry of the scour formation is then measured to varying levels of detail, where the maximum depth of scour dse (typically located near the upstream face of the cylinder) is the primary quantity of interest. Under prototype conditions, this would theoretically be taken as the minimum required foundation head, or the depth below which pier foundations should be placed in order to avoid the possibility of structural failure due to a loss of lateral support from the bed material. In practice, foundation head is determined on the basis of empirical equations, which have been developed by curve-fitting large quantities of laboratory data acquired through an experimental methodology similar to what is described above. Dimensional analysis has indicated that the maximum depth of scour normalized with pier diameter dse/D can be evaluated from a set of dimensionless variables which can be further reduced under certain conditions [9,11]. For fully turbulent subcritical flow aligned with a circular cylinder in well-graded erodible sediment, relative scour depth dse/D can be evaluated as described in Equation (1):
dse/D = f (U/Uc, h/D, D/d50)
In Equation (1), U is the average velocity of approach flow, Uc is the critical velocity for incipient motion of sediment, h is the flow depth, D is the cylinder diameter, and d50 is the median sediment diameter. The relationship between each dimensionless parameter and dse/D has been well established in the literature [3,9]. However, analysis has indicated that commonly used empirical equations in the form of Equation (1) have a tendency to overestimate dse/D values acquired from laboratory measurements [11]. Scale effects, which arise due to the imbalance in force ratios between a model and prototype, are certainly partially responsible for this discrepancy. This is particularly obvious in scaling of relative coarseness, D/d50, which cannot be equated between the laboratory and the field. If sediment size were to be scaled similarly to cylinder diameter, the bed material would be in the size range for cohesive sediment, and flow-sediment interactions would not be accurately replicated in the model. Therefore, bed material size in the approximate range of d50 in the field is used for modelling, and the experimental value of D/d50 is significantly reduced [11].
There are other model effects to which the poor performance of scour-predicting equations can be attributed. In a laboratory flume experiment, bed sediment is typically well-graded, and the approach flow is well regulated and usually two-dimensional in the central region of flow at the position of the cylinder. These are controlled conditions under which natural river flow rarely, if ever, occurs. Therefore, the differences between a value of dse/D estimated using an equation derived from laboratory results and an actual maximum depth of scour in the field can be understood. It has also been shown that prediction of scour in experiments with similar values of each governing parameter described in Equation (1) yields different values of dse/D, which implies that there are additional significant influences in scour modelling which have not been incorporated into scour estimation [12,13].
1.4. The Influence of Blockage Ratio D/b on Local Scour
One such influence which has been previously explored in physical scour modelling is blockage ratio, D/b, where b is the channel width. While the effect of D/b on flow around bluff bodies has been widely investigated for a fixed bed condition (e.g., [14,15]), the effect of D/b on local scour has not been clearly established. This is partially due to the generally significant relative width in naturally occurring rivers which mostly eliminates channel blockage as a concern for scour in the field. Nonetheless, in a comprehensive review of pier scour processes, Ettema et al. [9] stated that estimation of dse/D at a pier can be “complicated” by close channel bank proximity.
The effect of channel blockage in scour experiments has been erroneously defined as negligible when D/b is less than ten percent [8]. Laboratory flumes are usually constrained in width by facility size, and pier diameter D is generally chosen such that relative coarseness D/d50 is high enough to induce a measurable scour formation. Blockage ratio in experiments is therefore of greater concern than in the field. The influence of blockage ratio on scour around circular cylinders has been investigated by Hodi [16], D’Alessandro [17], and Tejada [18]. A review of these investigations, in which scour experiments were conducted for varying D/b, can be found in Williams et al. [19] (see Figure 1). The results of this investigation as well as those of both D’Alessandro [17] and Tejada [18] reported changes in dse/D when D/b was ten percent or less, which does not agree with the assumed threshold stated above. Examination of the literature indicates that there are many experiments for which the effects of blockage have been ignored, despite having D/b > 0.10. Since code-specified design equations were derived from such experiments, a correction factor for the effect of D/b in prediction of dse/D was presented by Williams et al. [19].
However, the results reported by Hodi [16], D’Alessandro [17], Tejada [18], and Williams et al. [19] indicate that while changes to the scour formation (i.e., the extent of the scour hole and the shape of the dune) can be considerable due to the changes in D/b, changes to dse/D are minimal in the context of foundation head design.
1.5. Time Scale of Local Scour
The definition of the aforementioned equilibrium state of local scour varies slightly among investigations. As previously described, the most commonly used definition is the point at which the bed shear stress within the scour hole reaches the critical shear stress of the bed material [19,20]. In the field, a point of true equilibrium according to this description is rarely reached, and so the progression of local scour under peak flood discharge is of particular interest for the design of foundation head in prototypes. For instance, the duration of peak discharge for which a foundation head is established may not reach the time to equilibrium, resulting in an overdesigned pier [20]. As such, the time scale of local scour around a circular cylinder is of particular interest to the hydraulic engineer.
There have been several experimental investigations into the progression of local scour under particular hydraulic conditions [20,21,22,23,24]. It has generally been established that scour depth increases rapidly in the early stages of the scour process, and the relationship between elapsed time and scour depth becomes asymptotic as the point of equilibrium is approached. The main objective of some studies has been to develop empirical relations for estimation of the time scale of local scour [21,23].
Guan et al. [24] acquired particle image velocimetry (PIV) measurements in the flow field surrounding a cylinder during the process of local scour. Bed measurements and PIV measurements were taken at various times up to a point of equilibrium, from which the evolution of the horseshoe vortex system was investigated. At 0.5 h, one clockwise vortex was observed near the leading face of the scour hole; when 48 h had elapsed, the system had evolved to generate two clockwise vortices and one smaller counterclockwise vortex [24].
1.6. Description of the Current Investigation
The above review of the literature has indicated the importance of understanding both blockage effects on local scour and the time scale of scour. Further experimentation and analysis will allow for clarification and quantification of these effects for future incorporation into design methods used in practice.
In the present work, the effect of channel blockage D/b on the progression of local scour was further investigated. Local scour tests were carried out for varying D/b and D/d50, and experimental results were compared with data from literature in order to isolate the influence of blockage ratio on scour depth. Predictive methods from literature were evaluated for the tests under consideration.
2. Materials and Methods
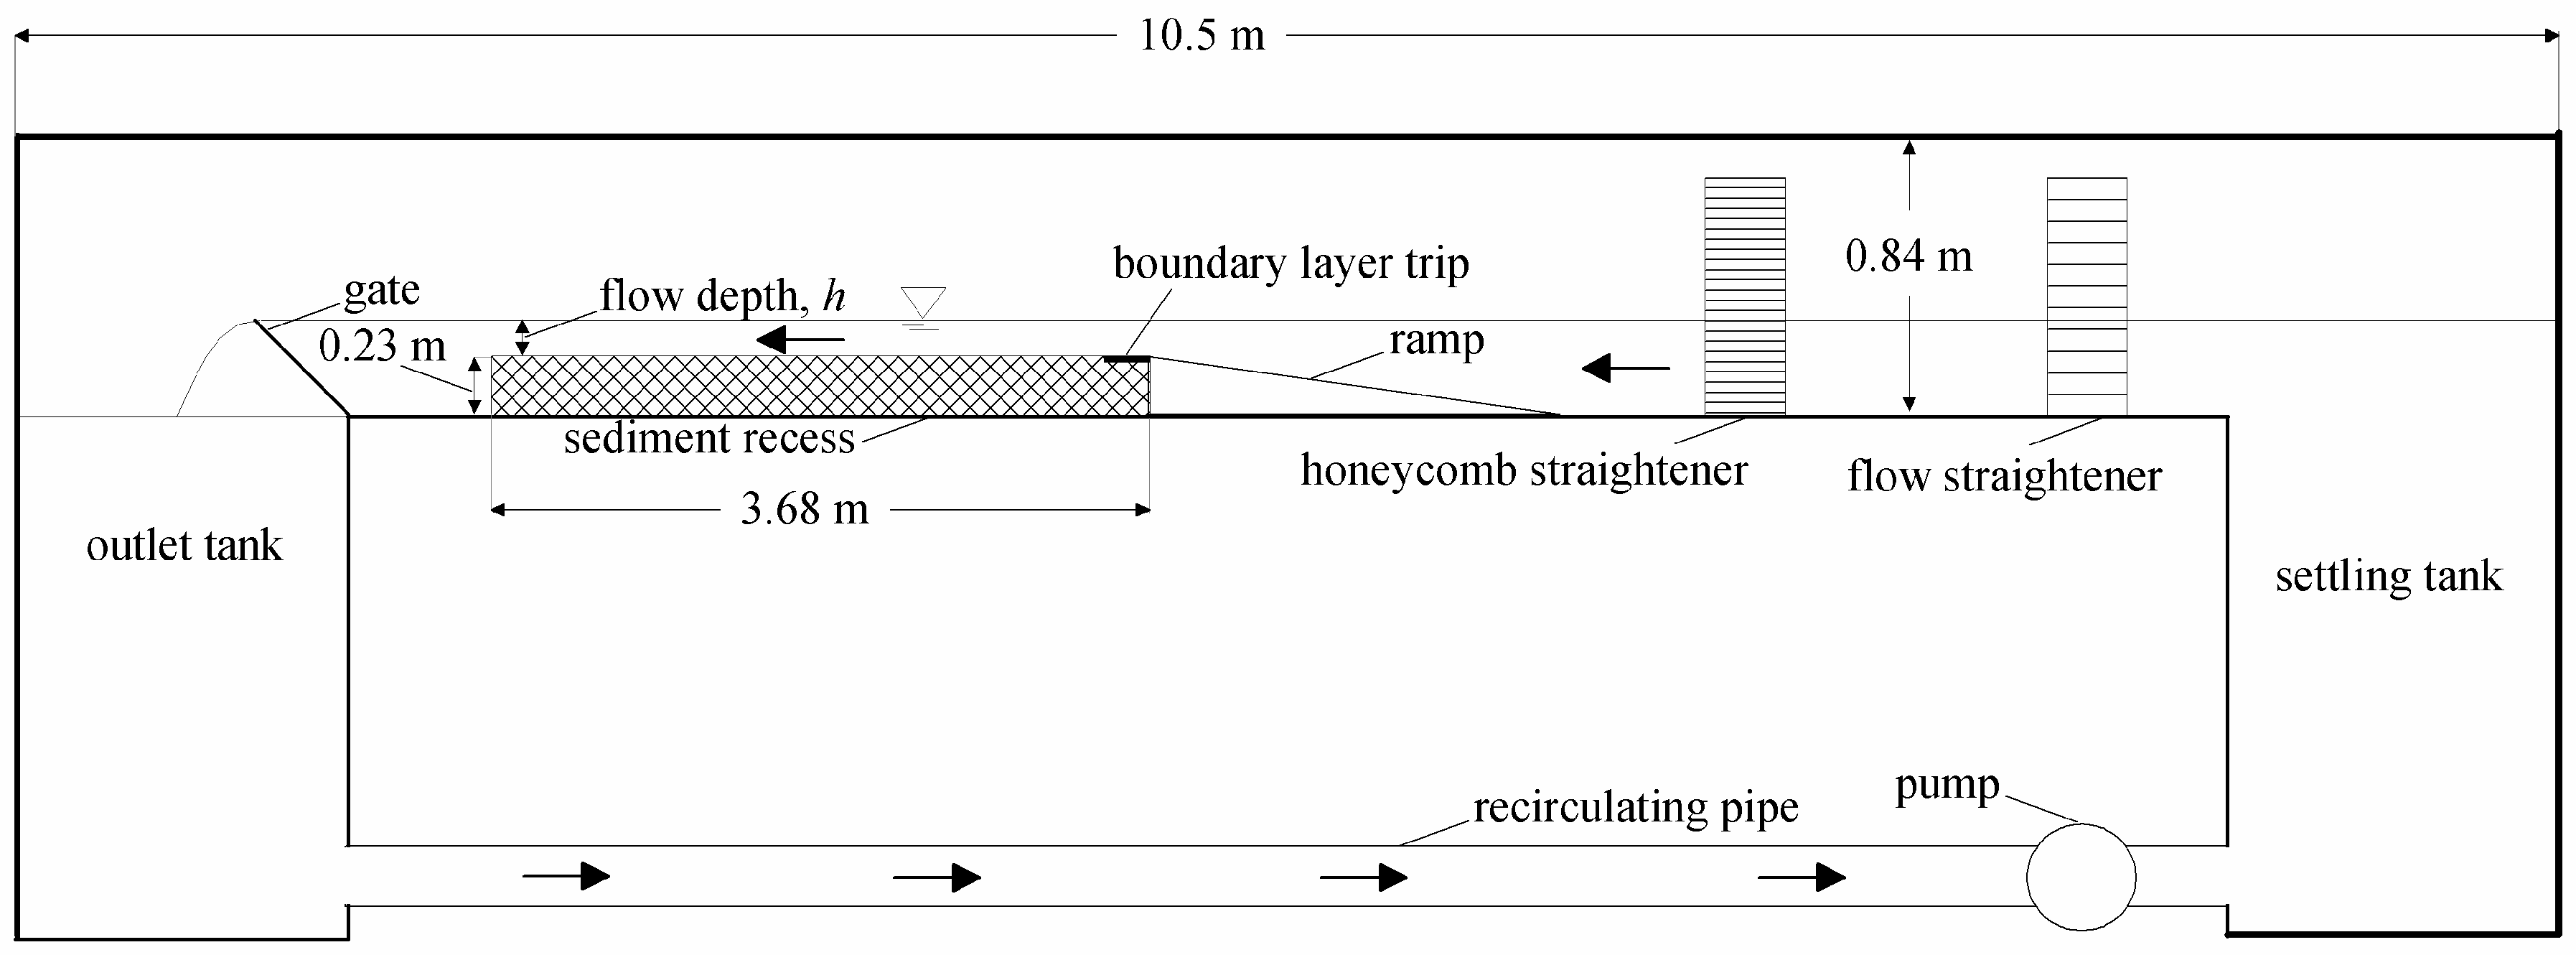
Experiments were carried out at the University of Windsor in Windsor, Canada. The laboratory facility contains a horizontal flume that is 10.5 m in length, 0.84 m in depth, and 1.22 m in width. A schematic of the flume is shown in Figure 2. The flume was fitted with two flow conditioners upstream of the test section. As shown in Figure 2, a PVC ramp led to the test section, which was a sediment recess of 3.68 m in length and 0.23 m in depth, encompassing the width of the flume. The sediment recess was filled with granular material with d50 = 0.74 mm, standard deviation of particle size σg = = 1.34, coefficient of uniformity Cu = = 1.56, and coefficient of gradation Cc = = 0.96. (Here, dXX is the sediment size for which XX percent is finer). The material was classified as poorly graded sand according to ASTM standards. The critical velocity for incipient motion of sediment (Uc) for the bed material was evaluated using standard methods which have been described in previous works [13,19].
A boundary layer trip was located at the beginning of the sediment recess. Flow measurements in the absence of the cylinder indicated that the streamwise velocity was self-similar in the streamwise direction in the test section at the location of the cylinder. Further details are provided in Williams [25]. The depth of flow at the cylinder was adjusted by a gate located at the downstream end of the flume, preceding the outlet tank. The flow was serviced by a 60 HP centrifugal pump. The flow was calibrated with 30°, 60°, and 90° v-notch weirs, using methods described in the U.S. Department of the Interior Bureau of Reclamation Water Measurement Manual [26]. The Kindsvater–Shen relationship and 8/15 triangular weir equation were used to calculate flow rate and develop the performance curve for the flume pump in the absence of the installed test section [26]. The orientation of the flume and experimental measurements corresponded to X in the streamwise direction, Y in the vertical direction, and Z in the spanwise or transverse direction. The bed level was taken as zero in the vertical direction for all experiments, and the geometric centre of the cylinder was taken as the origin in the XZ plane for local scour tests.
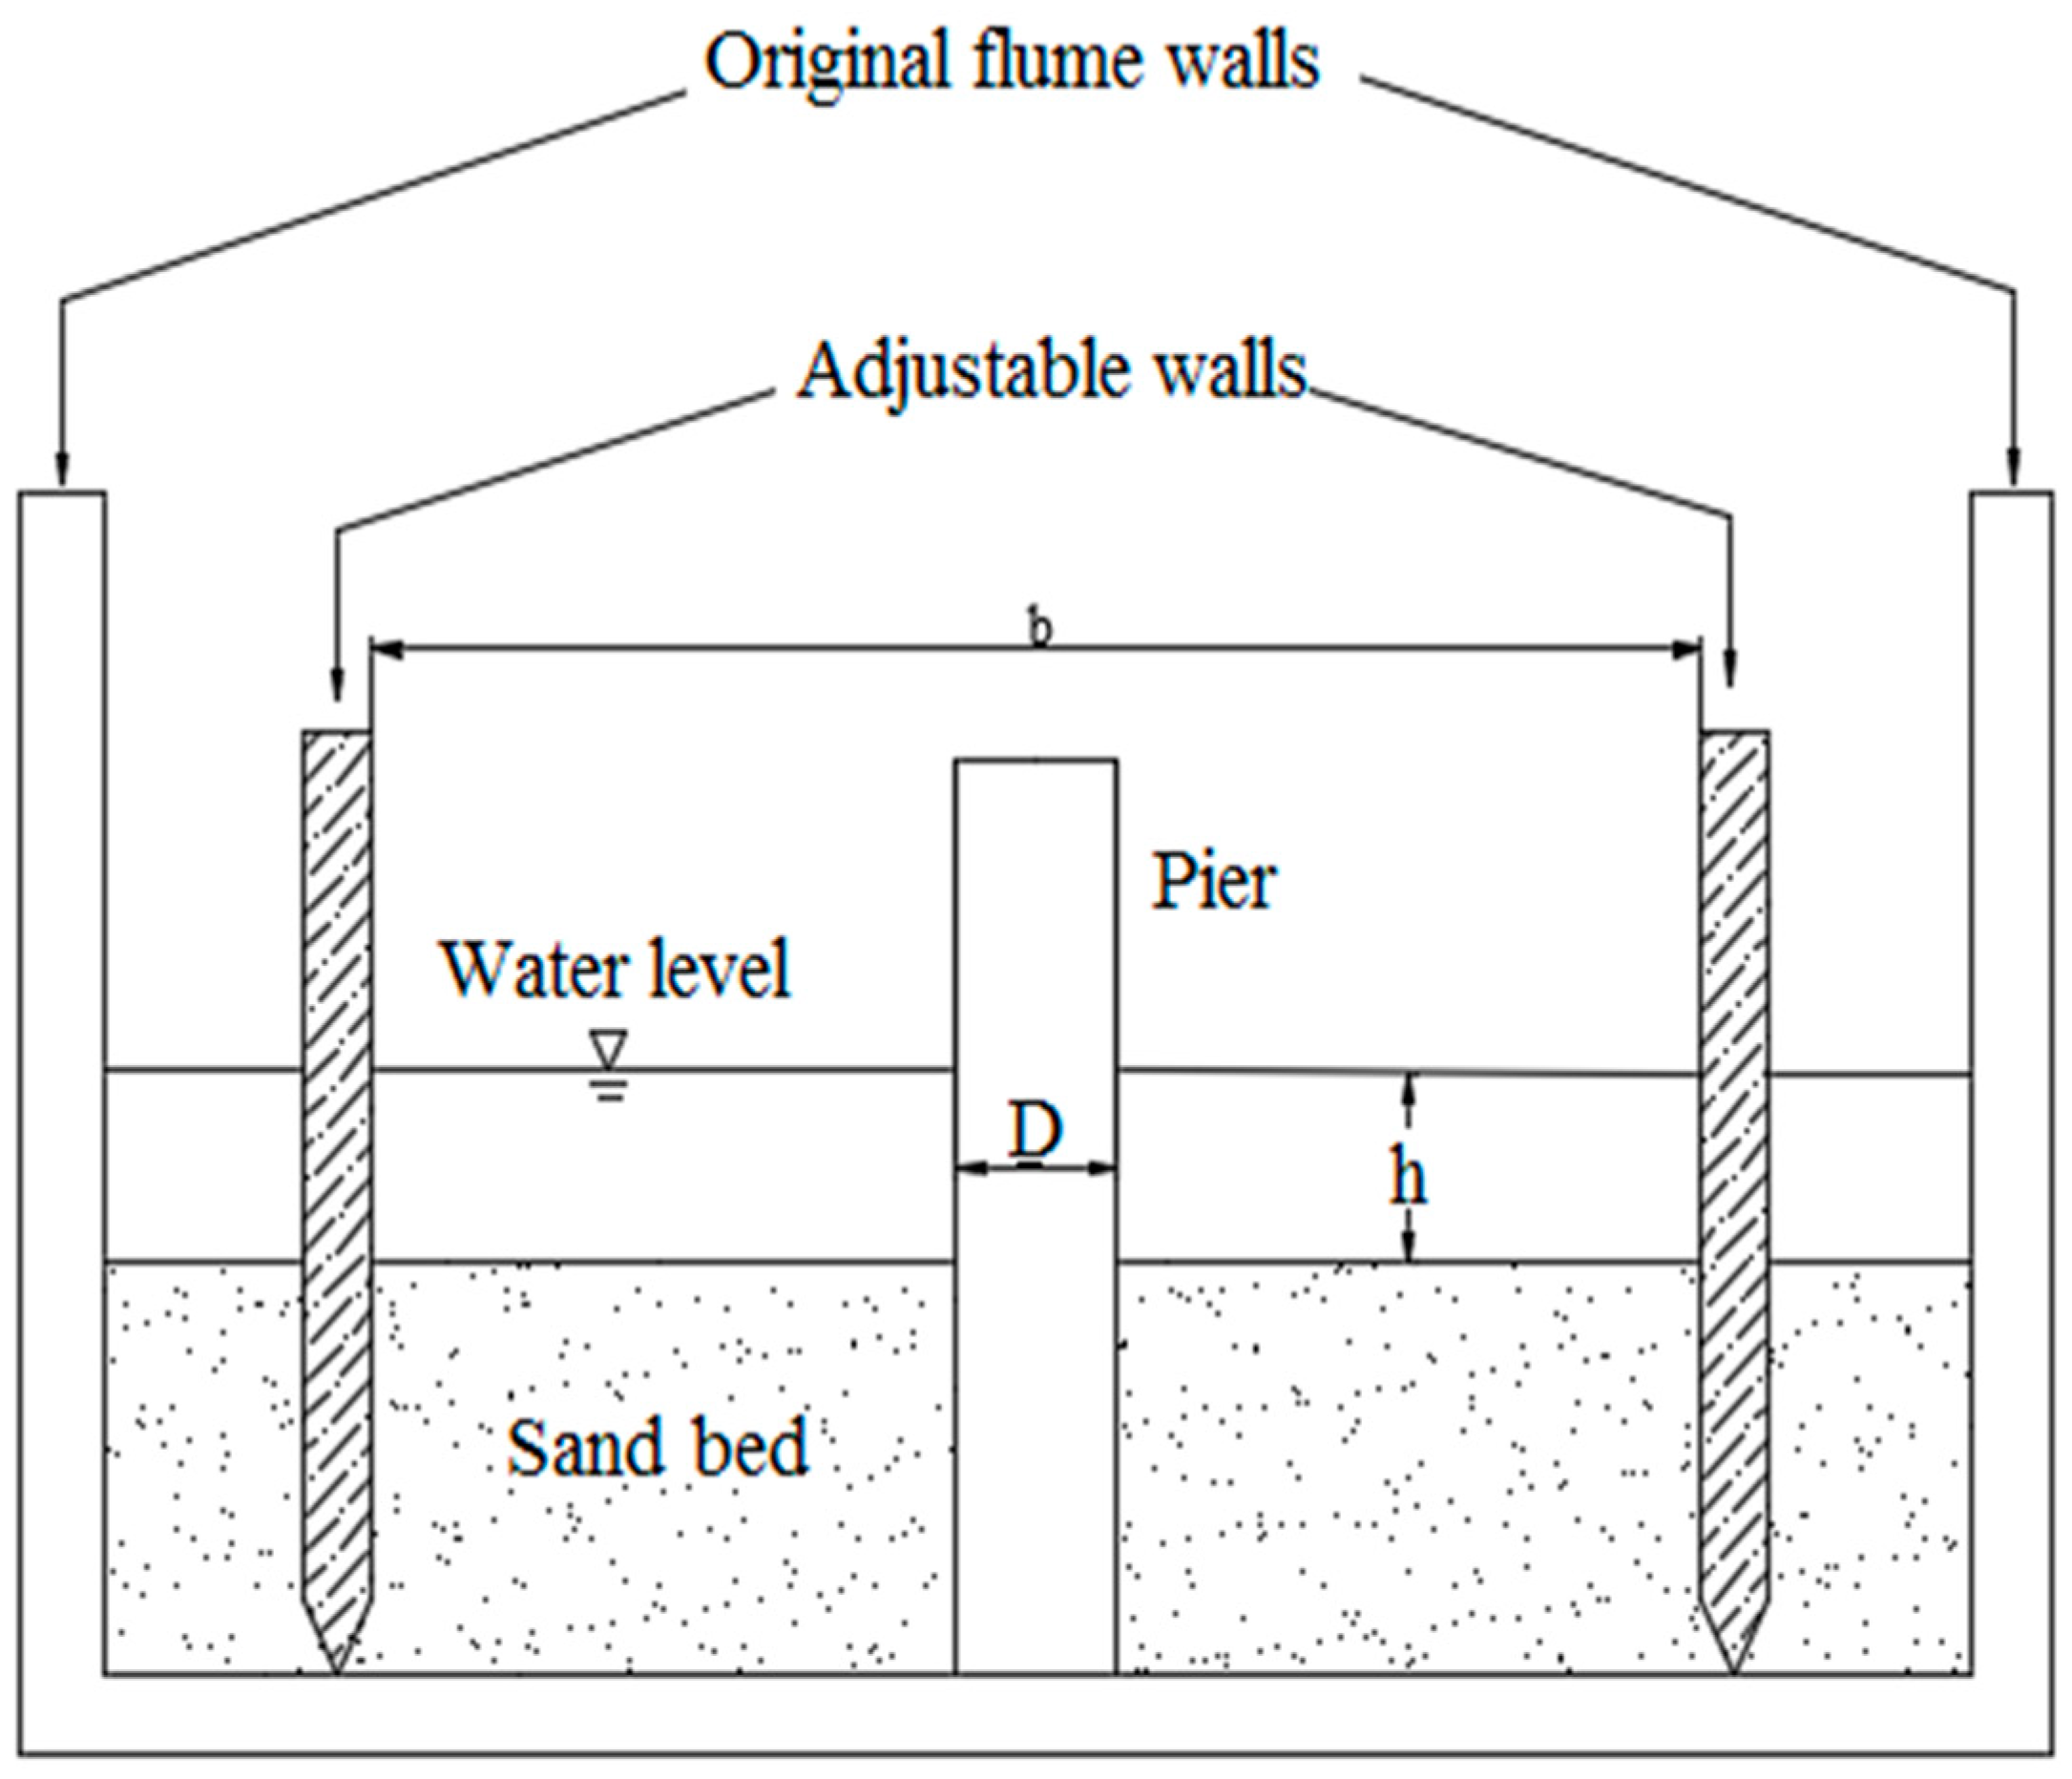
In the current investigation, three local scour tests were carried out under varying conditions (see Table 1). In Table 1, te is the time to equilibrium. Prior to testing, movable PVC walls were installed in the flume and adjusted to the desired width, b (see Figure 3). This was done in order to alter the blockage ratio D/b while maintaining cylinder diameter D thus isolating the effects of D/b. The sediment in the test section was levelled using a trowel, and the necessary pier was installed in the centre of the channel. The flume was then filled with water to the desired depth (for which the resolution of measurement was accurate within ±0.5 mm) [25], and the pump was started and brought up to the required flow rate corresponding to an approximate flow intensity (U/Uc) of 0.85, used in order to maintain clear-water conditions for local scour.
The tests were conducted for a period of 24 h, after which the pump was slowed gradually in order to avoid disturbance of the bed material and then shut off. The flume was then drained slowly in order to avoid disturbance of the scour formation and a Leica laser distance meter was used to measure bed profiles in the streamwise direction along the centreline in the XY plane (Z/D = 0) and around the contour of the bed formation in the XZ plane (Y/D = 0). The uncertainty of the acquired bed measurements due to the accuracy of the laser distance meter was determined to be ±0.05 mm from the resolution of the measurements.
3. Results
3.1. Time Series for Test E3
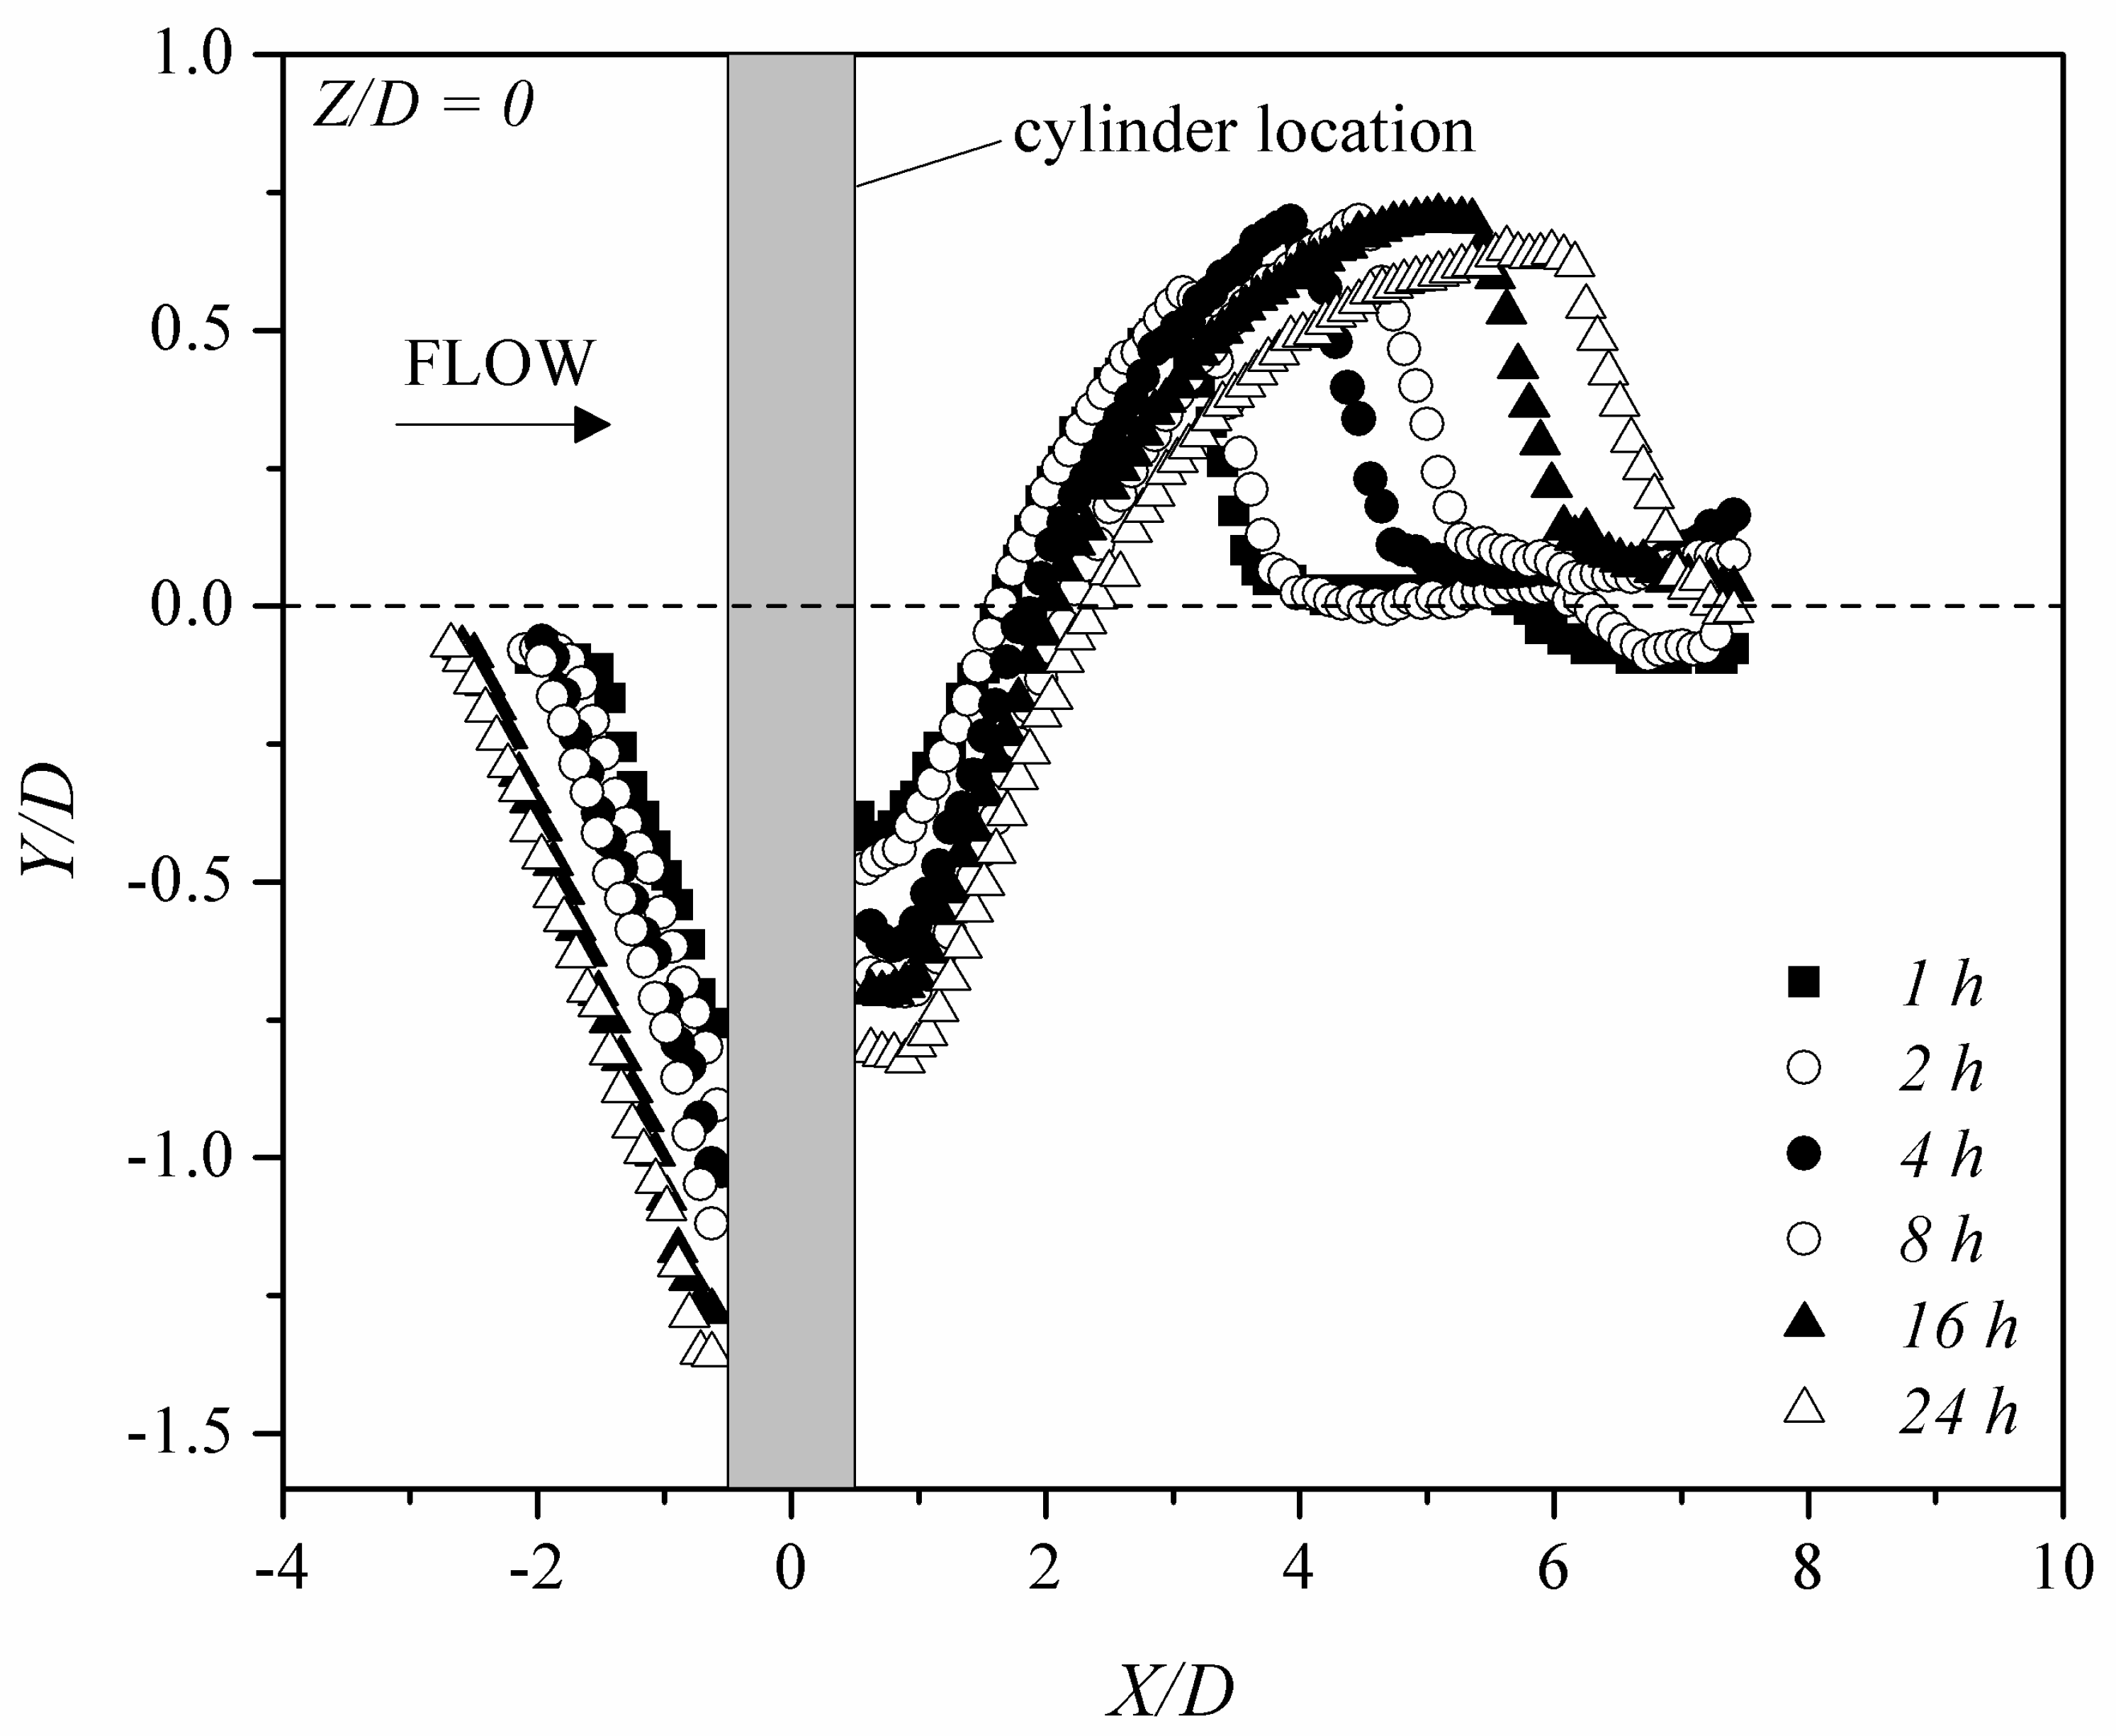
In Figure 4, a time series for test E3 is given. The tests were conducted under the conditions for test E3 (see Table 1 for details) for 1, 2, 4, 8, 16, and 24 h, after which bed profile measurements along the symmetry plane at Z/D = 0 were acquired. It can be seen that the depth of the scour hole upstream of the cylinder increased incrementally with time throughout the first 24 h of the experiment. However, between 16 and 24 h, the profiles in the upstream region were very similar, showing minimal differences. In terms of the relative scour depth, dse/D, and its relation to the foundation head, this indicates that 24 h can be seen as an acceptable time to equilibrium, te, under the described experimental conditions.
Downstream of the cylinder, it can be seen that the dune-like primary deposit increased in height and length with time until 16 h elapsed. At 24 h, the profile further increased in length, but the height of the dune decreased slightly when compared with the dune formed after 16 h. It can be seen that changes in the scour formation in the downstream region were more significant than changes in the upstream region with time; however, since the primary quantity for the foundation head design is dse/D located near the upstream face of the cylinder, the best indication of an equilibrium condition with respect to design can be taken from this region.
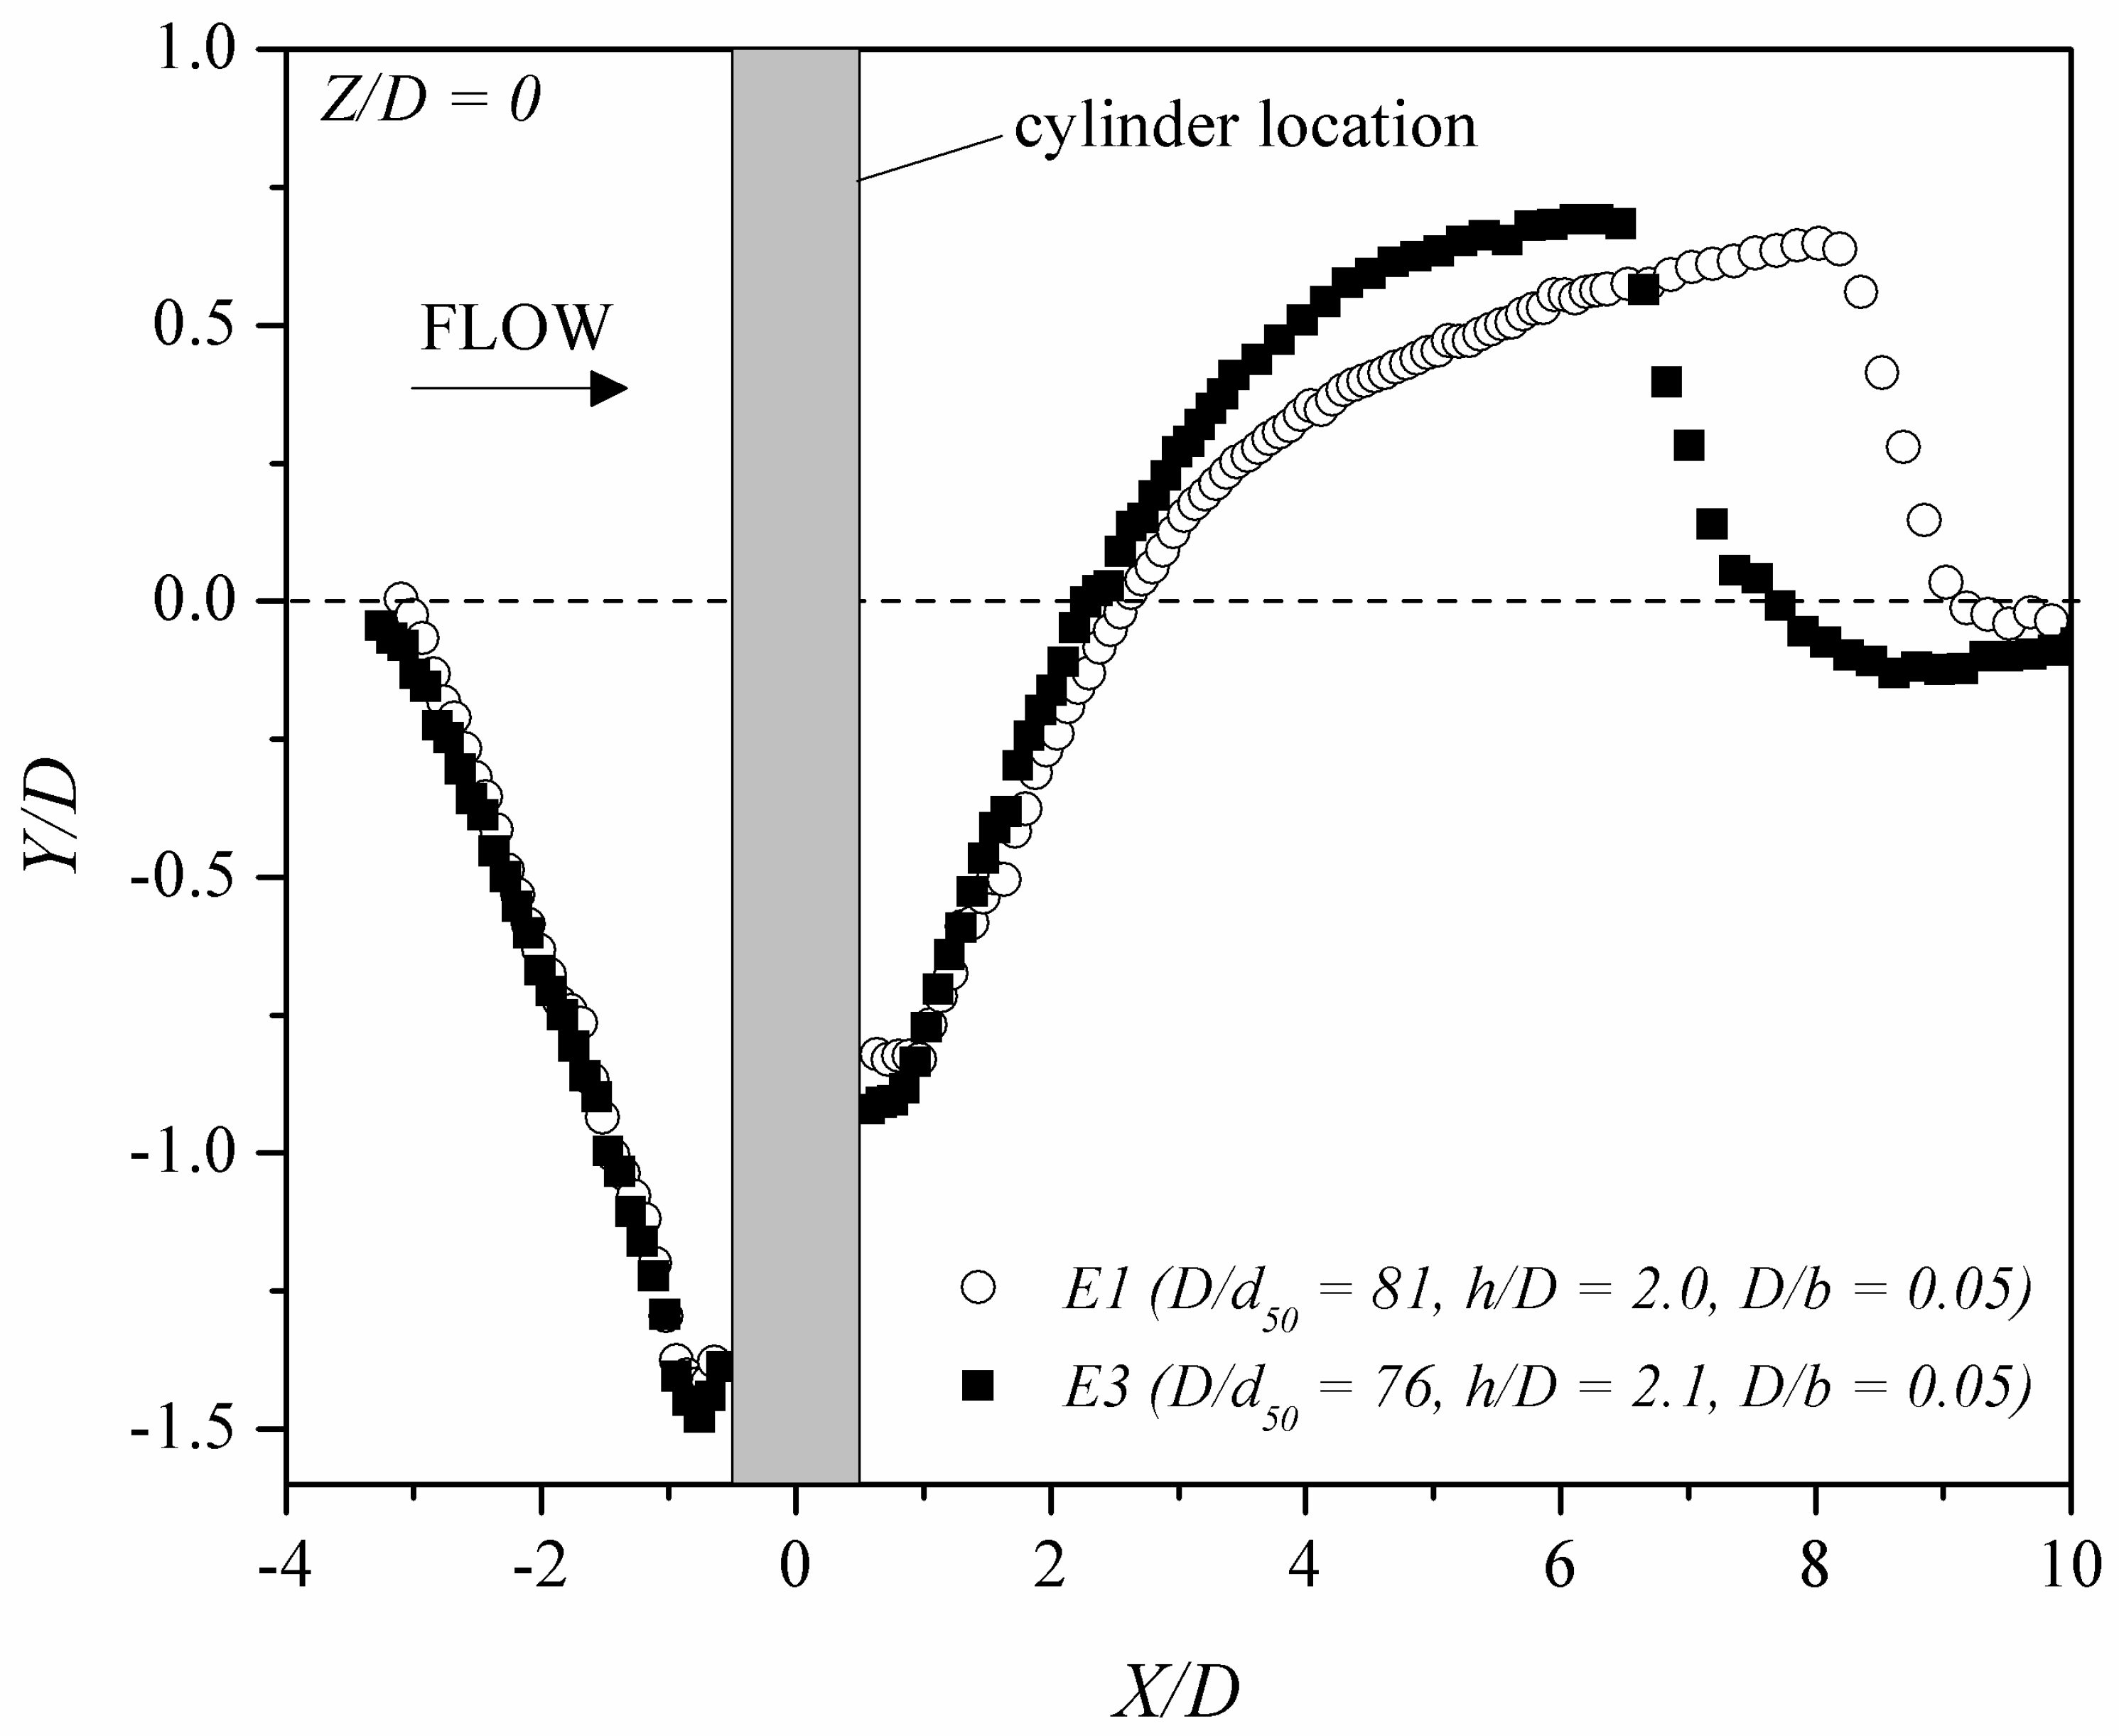
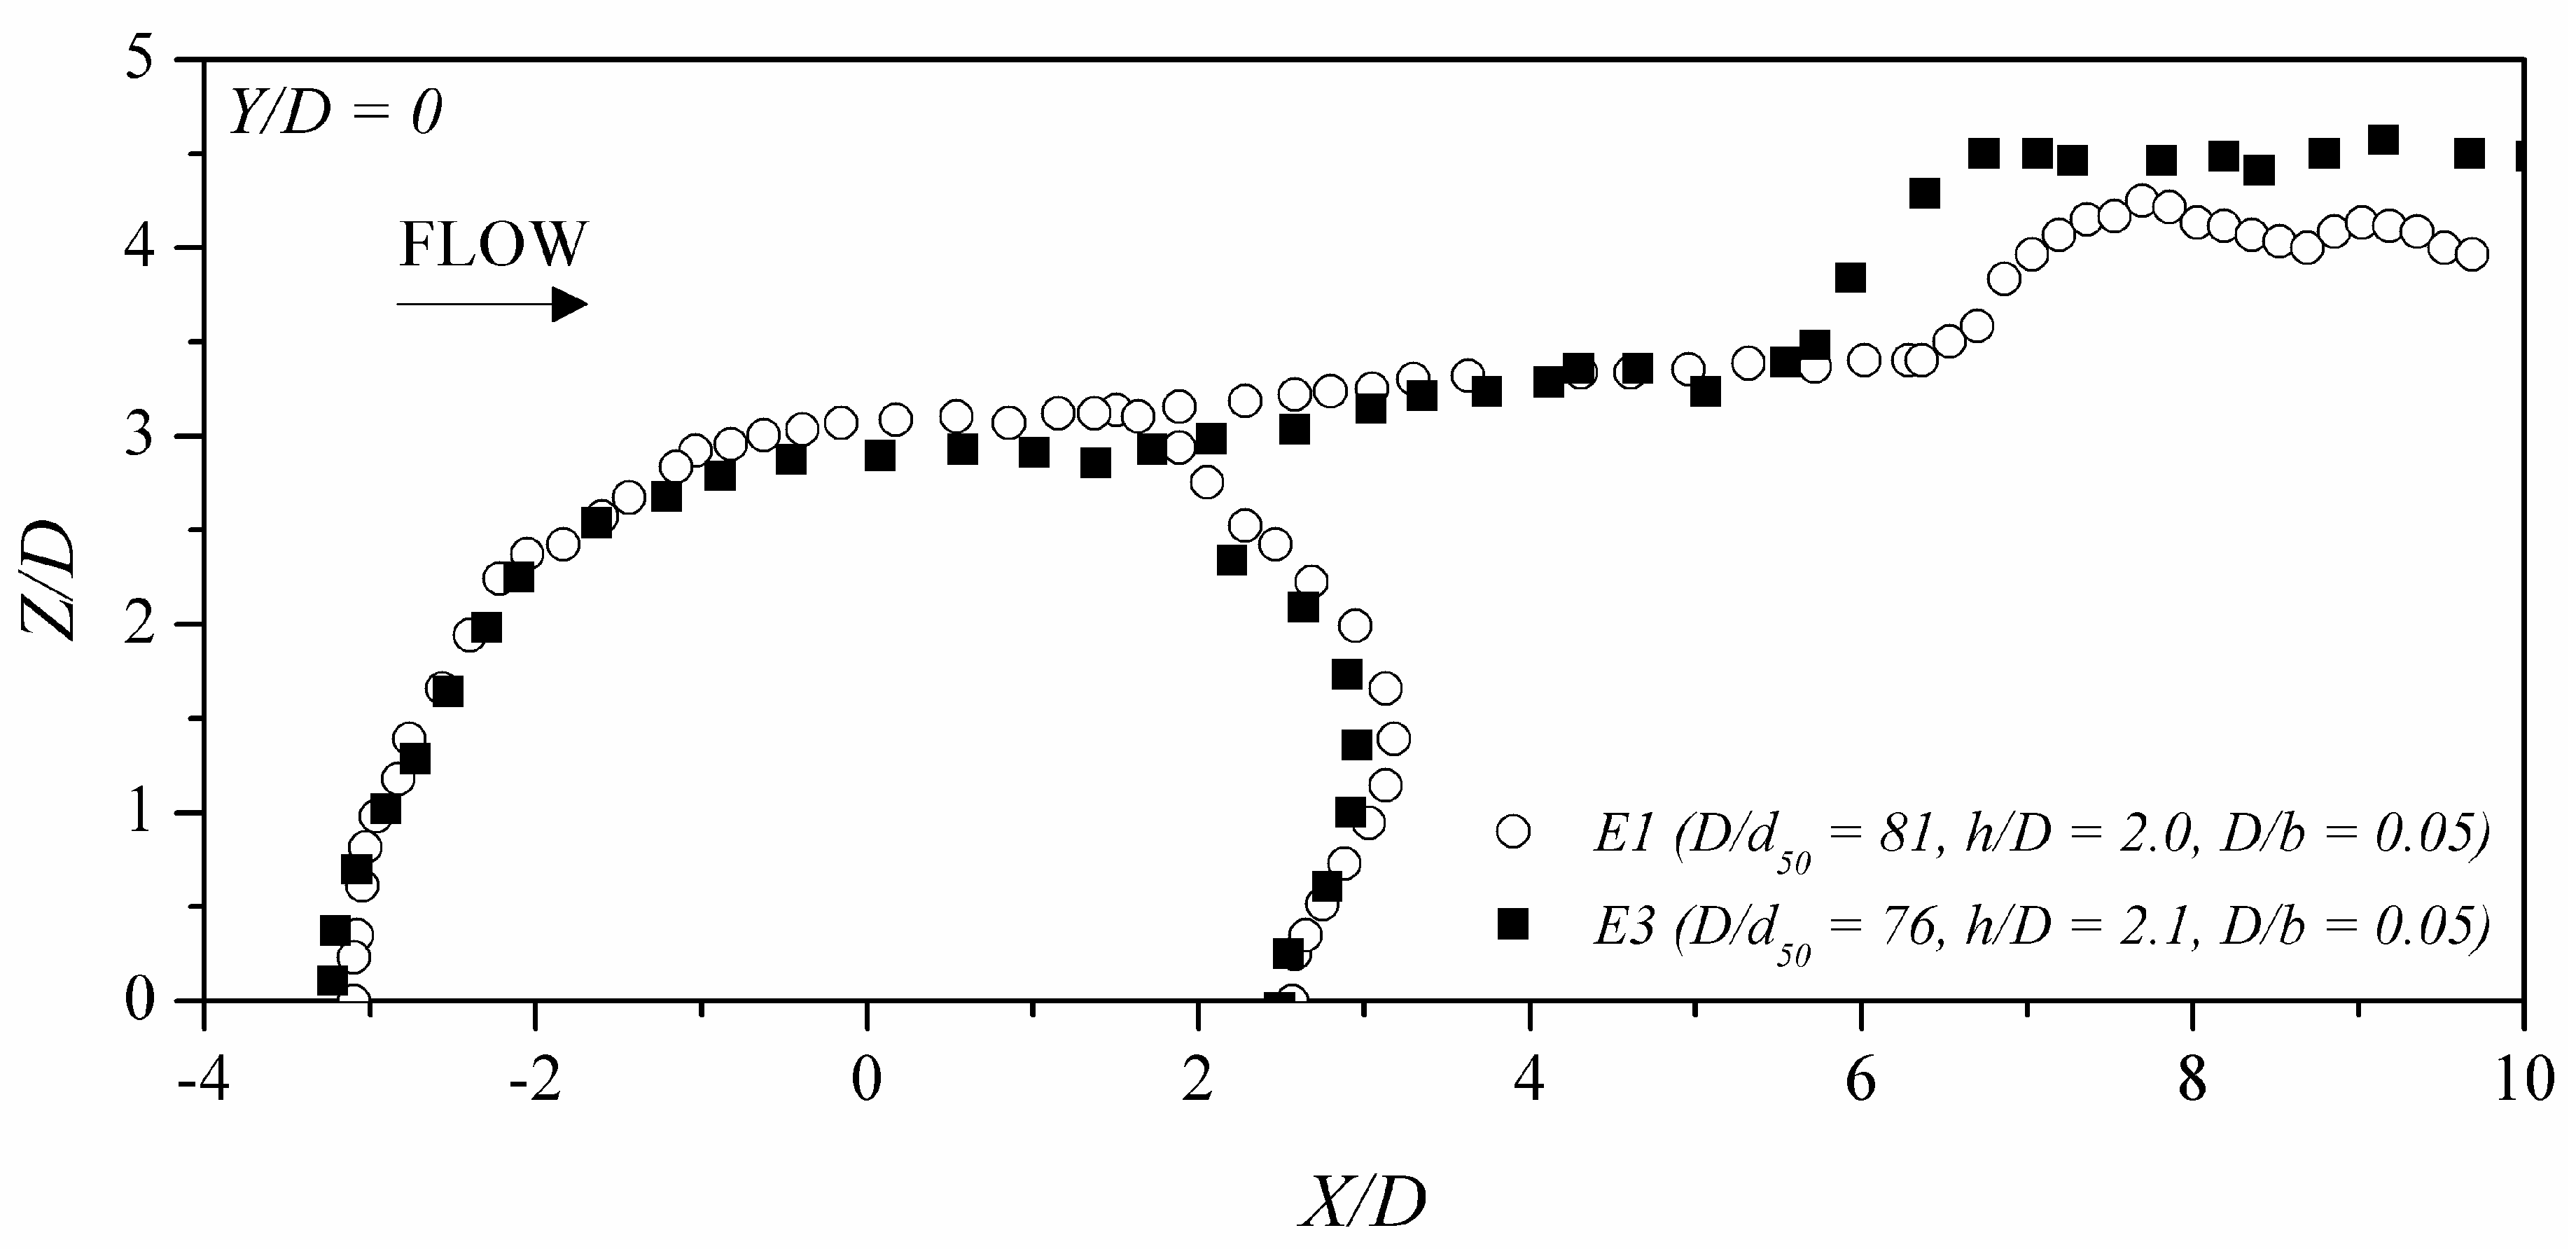
This is further indicated by comparison of the scour profiles in the XY plane between tests E1 and E3 in Figure 5 and Figure 6. For this pair of tests, the relative coarseness D/d50, flow shallowness h/D, and blockage ratio D/b were very similar (refer to Table 1); only the duration of the tests (48 h for test E1 compared with 24 h for test E3) differed among the two tests.
As was indicated by the time series shown in Figure 4, Figure 5 and Figure 6, when all other scour-governing parameters are held constant, the scour formation upstream of the cylinder does not change significantly as time progresses beyond 24 h. From the bed profiles in the XY plane, the scour hole profiles in the upstream region were very similar between tests E1 and E3. Downstream of the cylinder, the length of the dune increased, and the height of the dune decreased with time. This was also observed in the time series profiles in Figure 4.
The contour profiles of the scour formation in Figure 6 similarly show that the geometry of the scour hole did not change significantly with time upstream of the cylinder. Downstream of the cylinder, the width of the dune changed slightly. However, as previously mentioned, since changes in the downstream region do not affect design of the foundation head, the equilibrium state is evaluated primarily based on the region in which the depth of scour is at a maximum (i.e., upstream).
3.2. Effect of Blockage Ratio D/b on Equilibrium Scour Formation
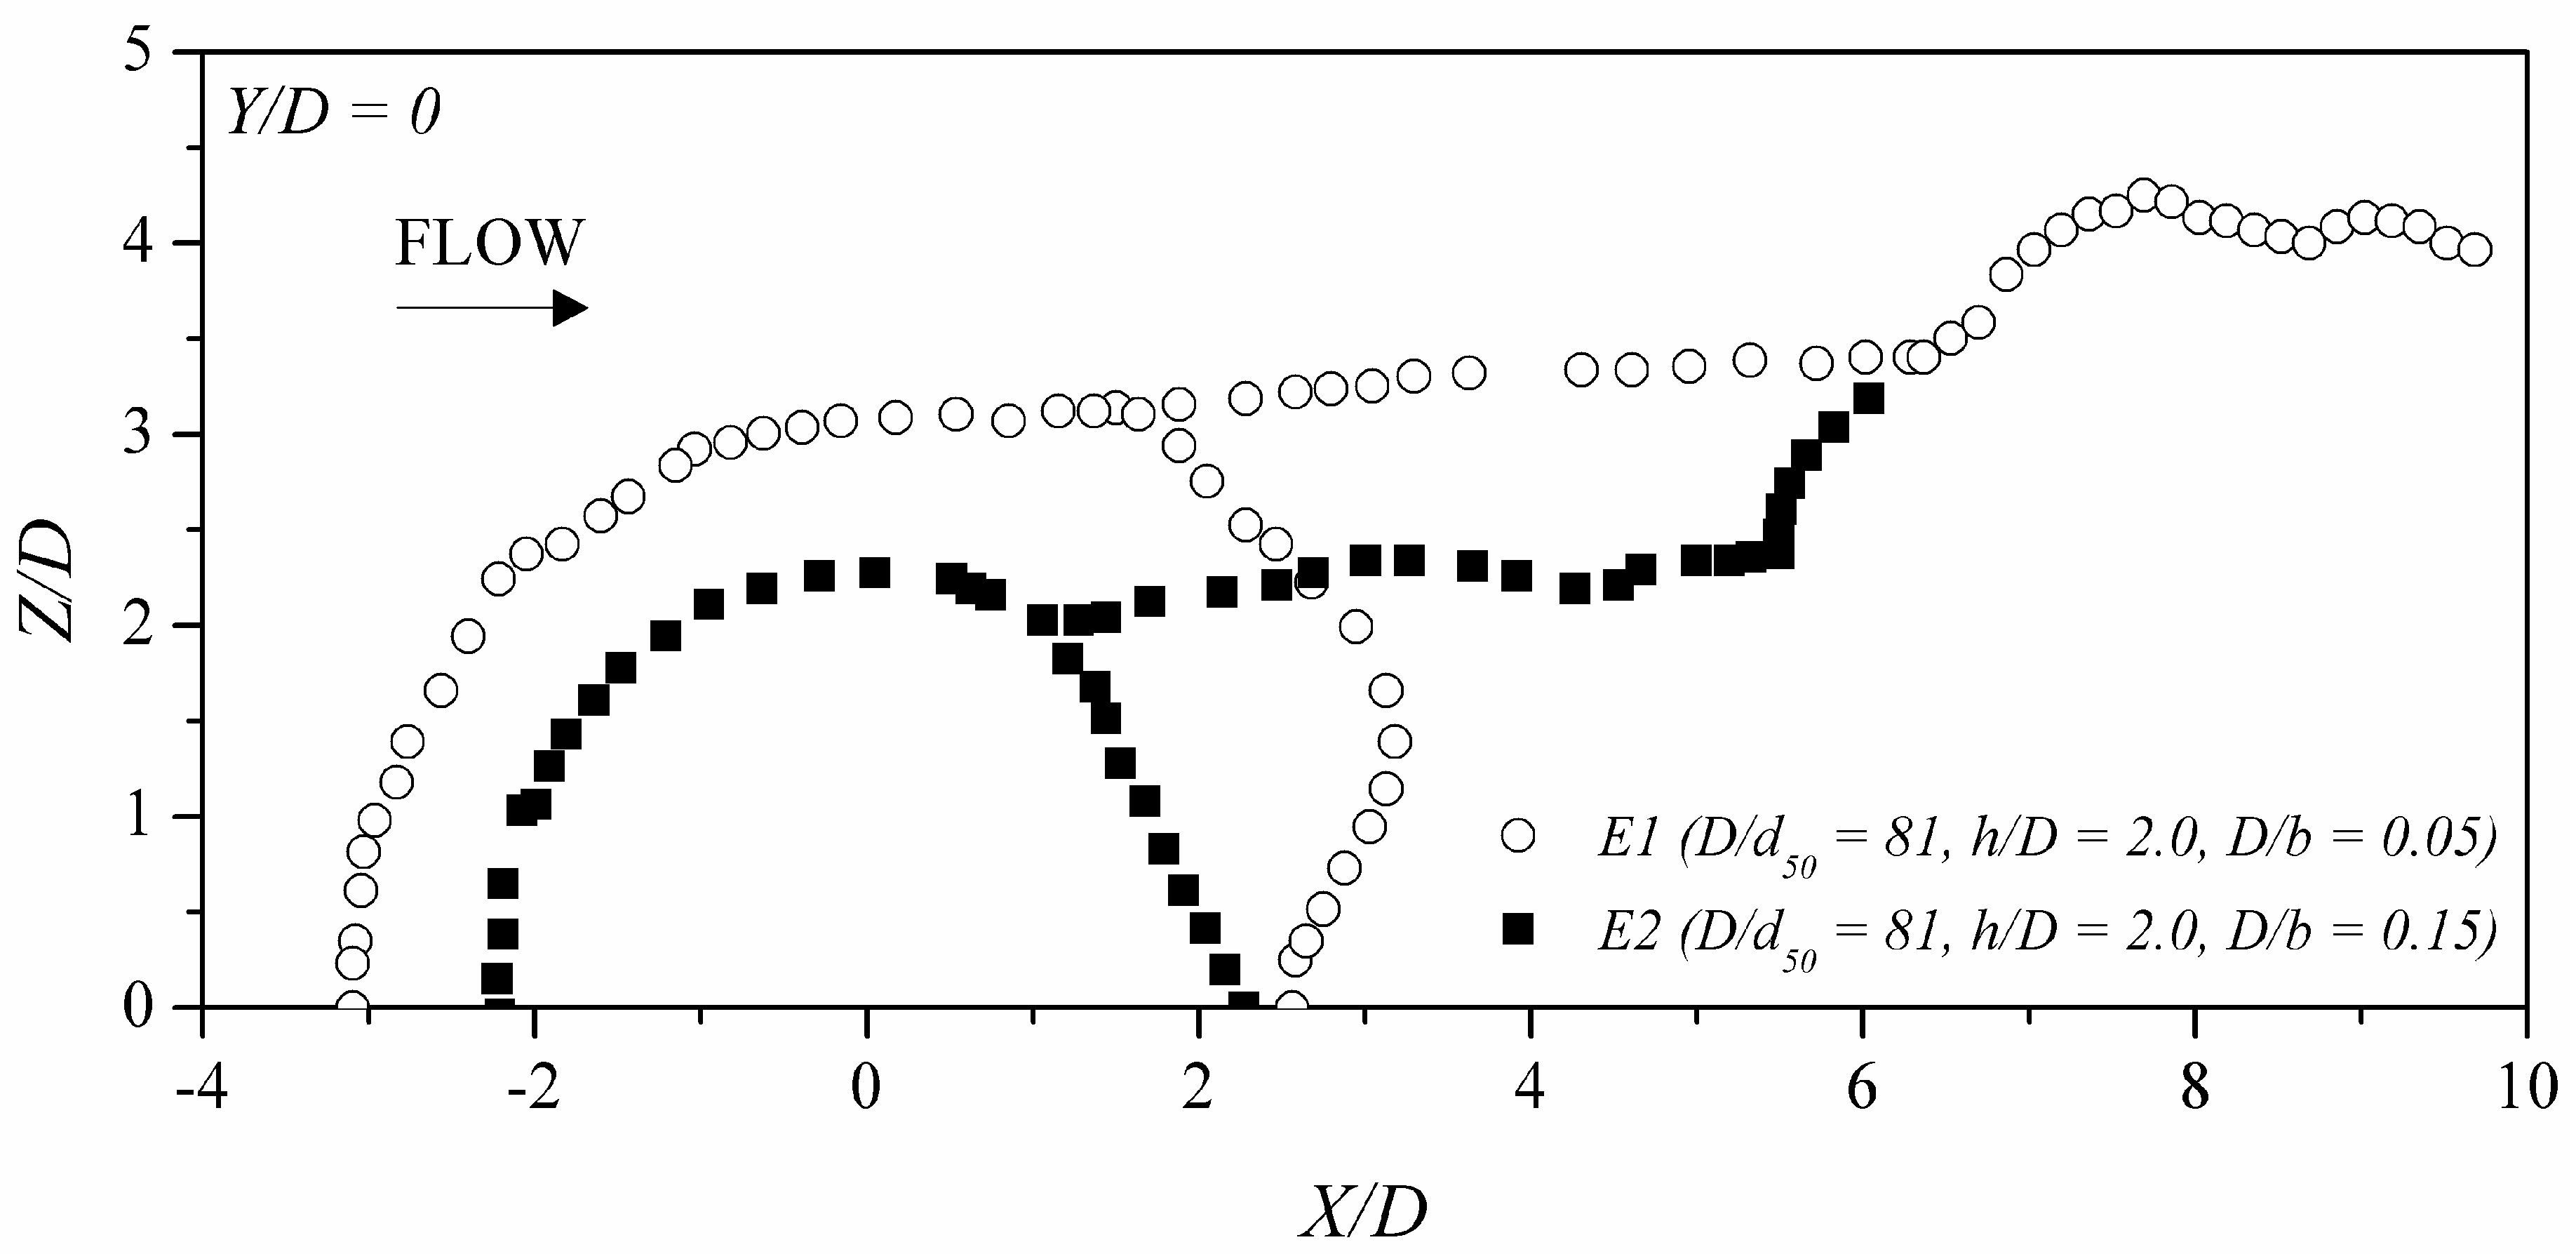
Figure 7 and Figure 8 show profiles of the equilibrium scour formations for tests E1 and E2. For this pair of tests, all scour-governing parameters (U/Uc, D/d50, and h/D) were held constant. Movable sidewalls were installed in the flume in order to alter flume width b and, therefore, blockage ratio D/b as well. Test E1 was conducted for 48 h, and test E2 was conducted for 24 h. However, the results of the previous section indicated that the scour formation in the vicinity of the cylinder was virtually unchanged beyond 24 h, and any significant changes were only observed in the downstream region. Therefore, the following discussion will pertain mainly to the scour formation upstream and close to the cylinder.
In Figure 7, the depth of the scour hole is shown to be higher for the test with the lower blockage ratio. This is indicative of the strong effect of sidewall proximity on the mechanism of local scour. In test E1, the channel was significantly wide (b = 1.22 m) such that the spanwise pressure gradient imposed by the sidewalls did not significantly affect the flow field mechanisms surrounding the cylinder (i.e., the HSV and the wake vortices). Therefore, scour was allowed to progress unimpeded.
In contrast, the width of the channel for test E2 was approximately one-third of that of test E1 (b = 0.4 m). It is then very likely that the secondary flows (boundary-induced currents at right angles to the main flow) were capable of interacting with the flow field mechanisms surrounding the cylinder, particularly the wake vortices. Furthermore, the aforementioned spanwise pressure gradient that is a noted feature of horizontally confined flows was more likely to influence the cylinder as the confinement increased. All of these effects of sidewall proximity served to disrupt and weaken the removal and deposition of sediment, reducing the size of the scour hole and the primary deposit.
Although the above discussion is restricted to the upstream region due to the previously mentioned time differences between tests E1 and E2, the alteration in the dune formation for test E2 can also be attributed to the effect of channel blockage. Beyond the crest of the dune for test E2, the form of the primary deposit differs from that of test E1. Since the wake region is in closer proximity to the sidewalls, it is reasonable that the effect of horizontal confinement would affect the deposition of sediment downstream of the cylinder in addition to the removal of sediment in the vicinity of the cylinder as previously discussed.
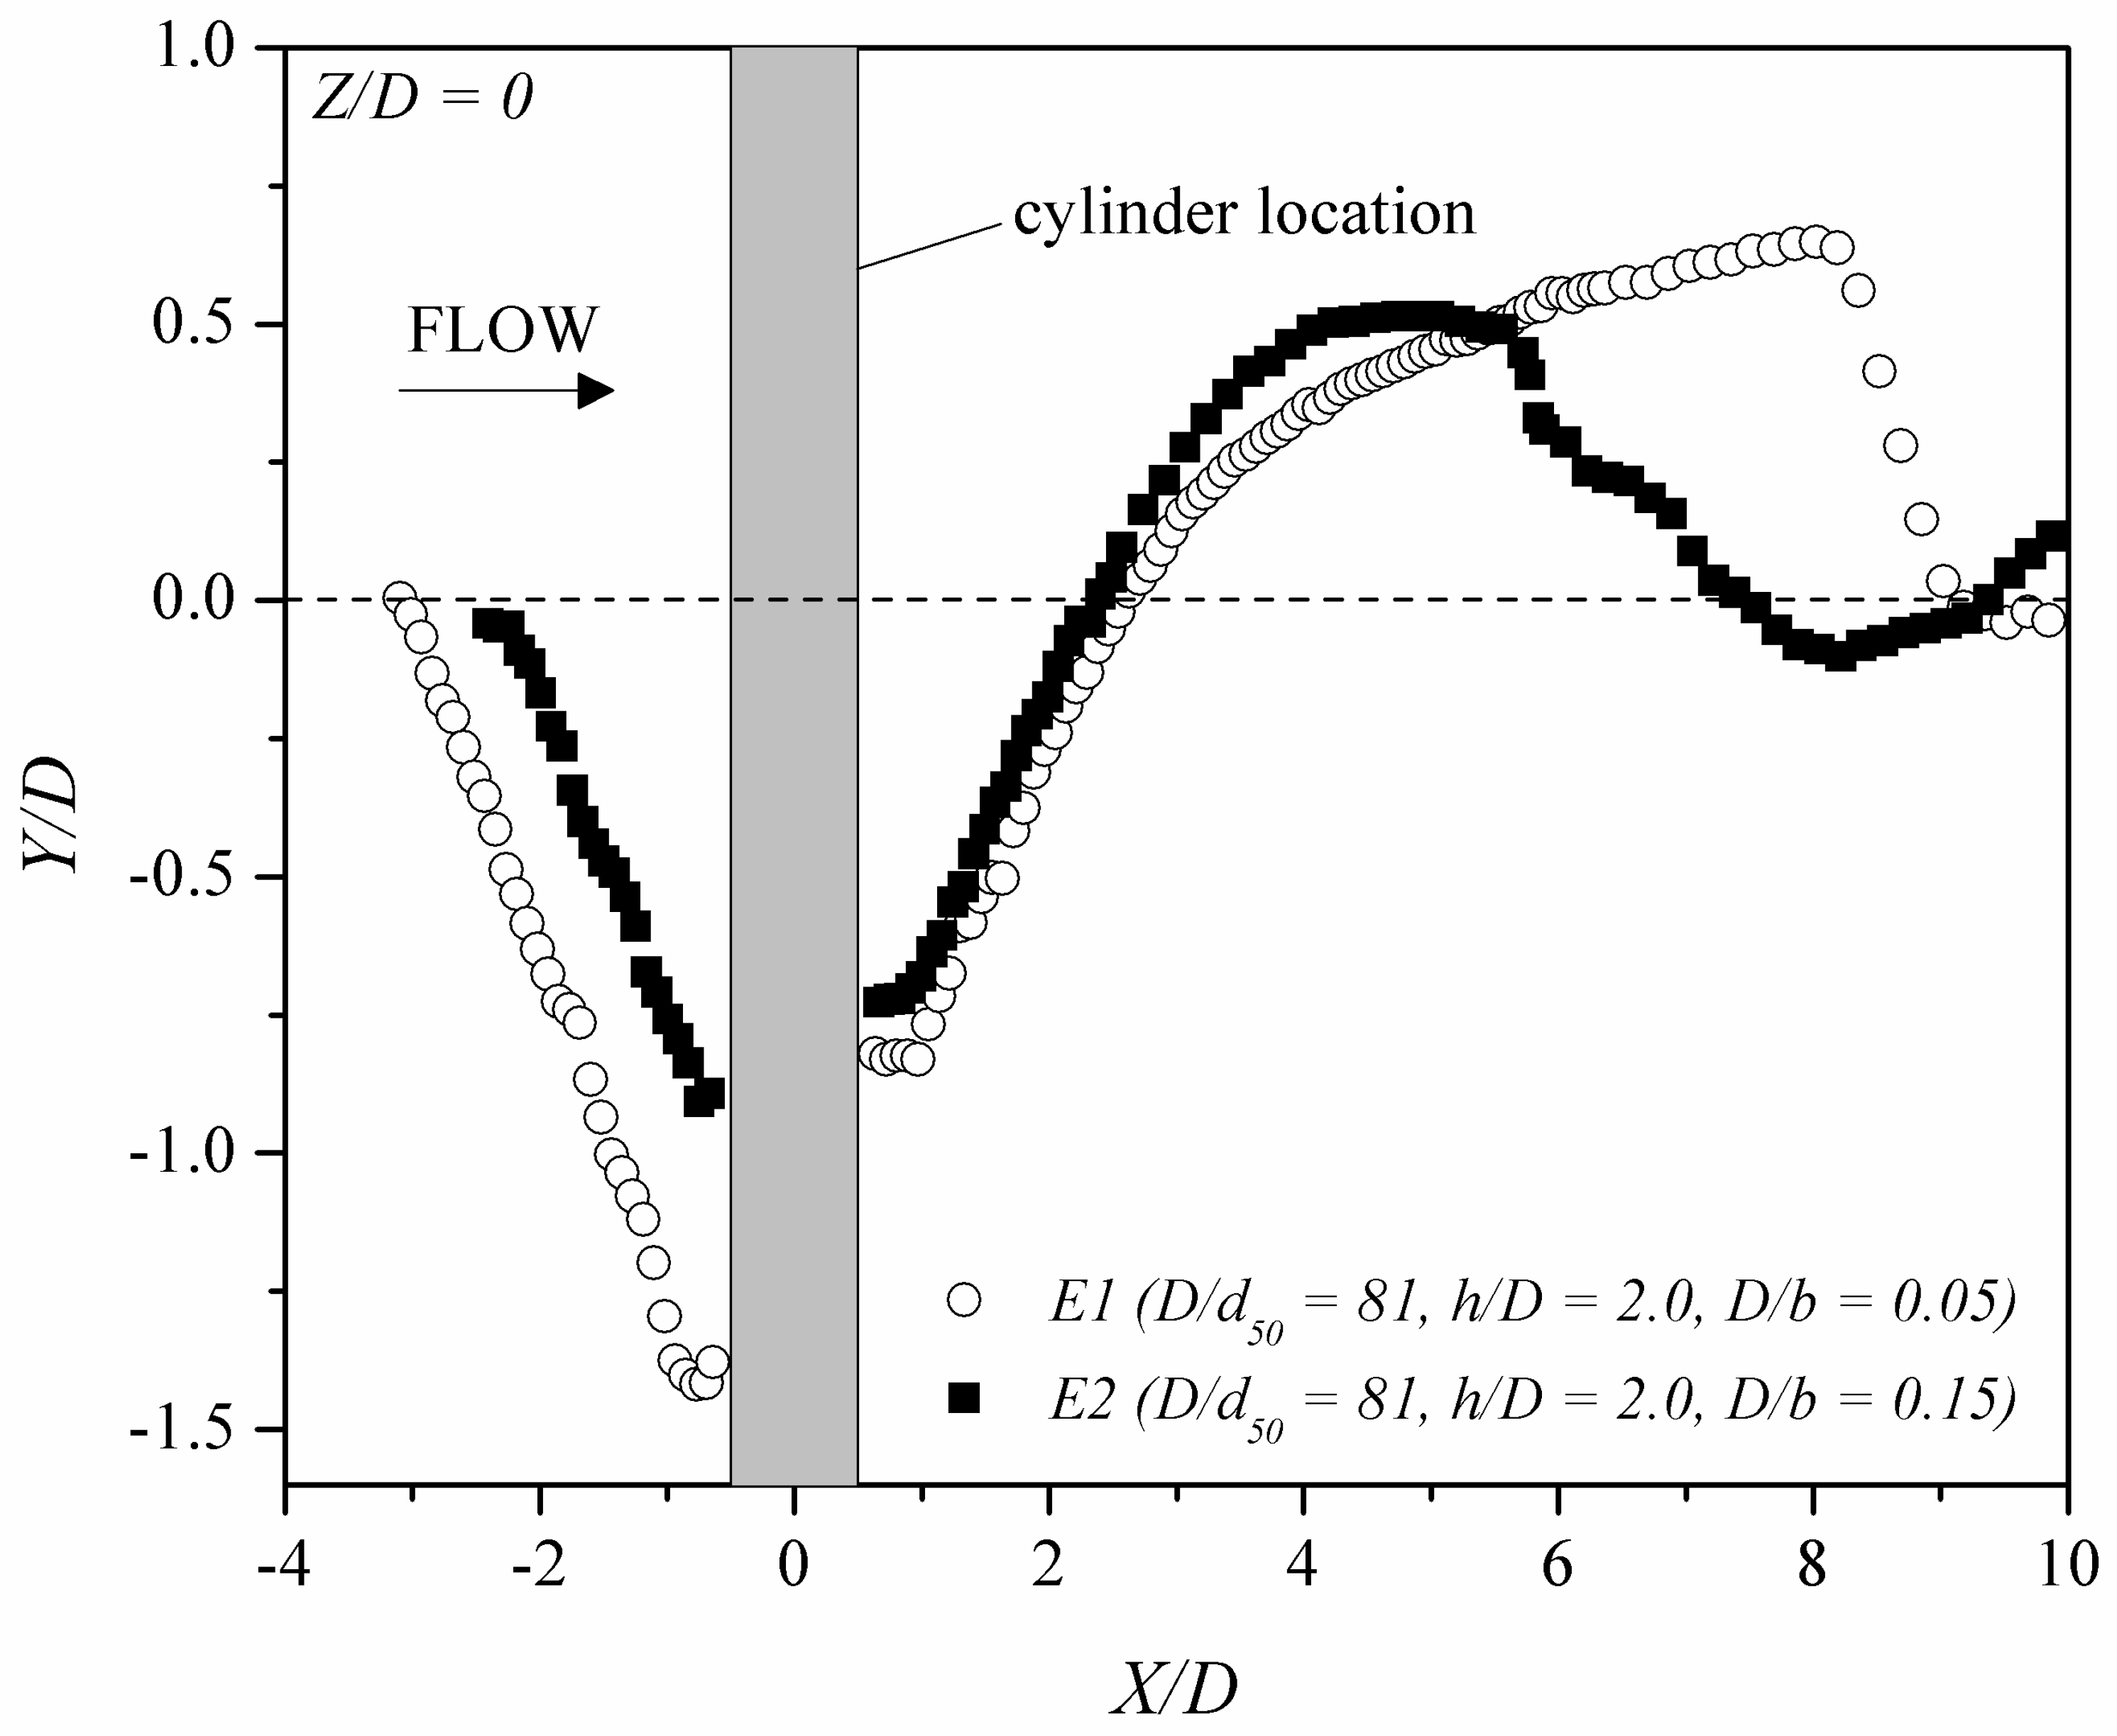
This is further illustrated in Figure 8 which shows the effect of D/b on the extents of the scour formation in the horizontal plane at Y/D = 0. It can be seen that the size of the scour hole was much smaller in plain view for test E2 with D/b = 0.15 than for test E1 with D/b = 0.05. Again, the increase in sidewall proximity appears to have suppressed the lateral progression of scour. This is also observed downstream of the scour hole, where the primary deposit became narrow as horizontal confinement increased.
3.3. Effect of Blockage Ratio D/b on the Progression of Local Scour
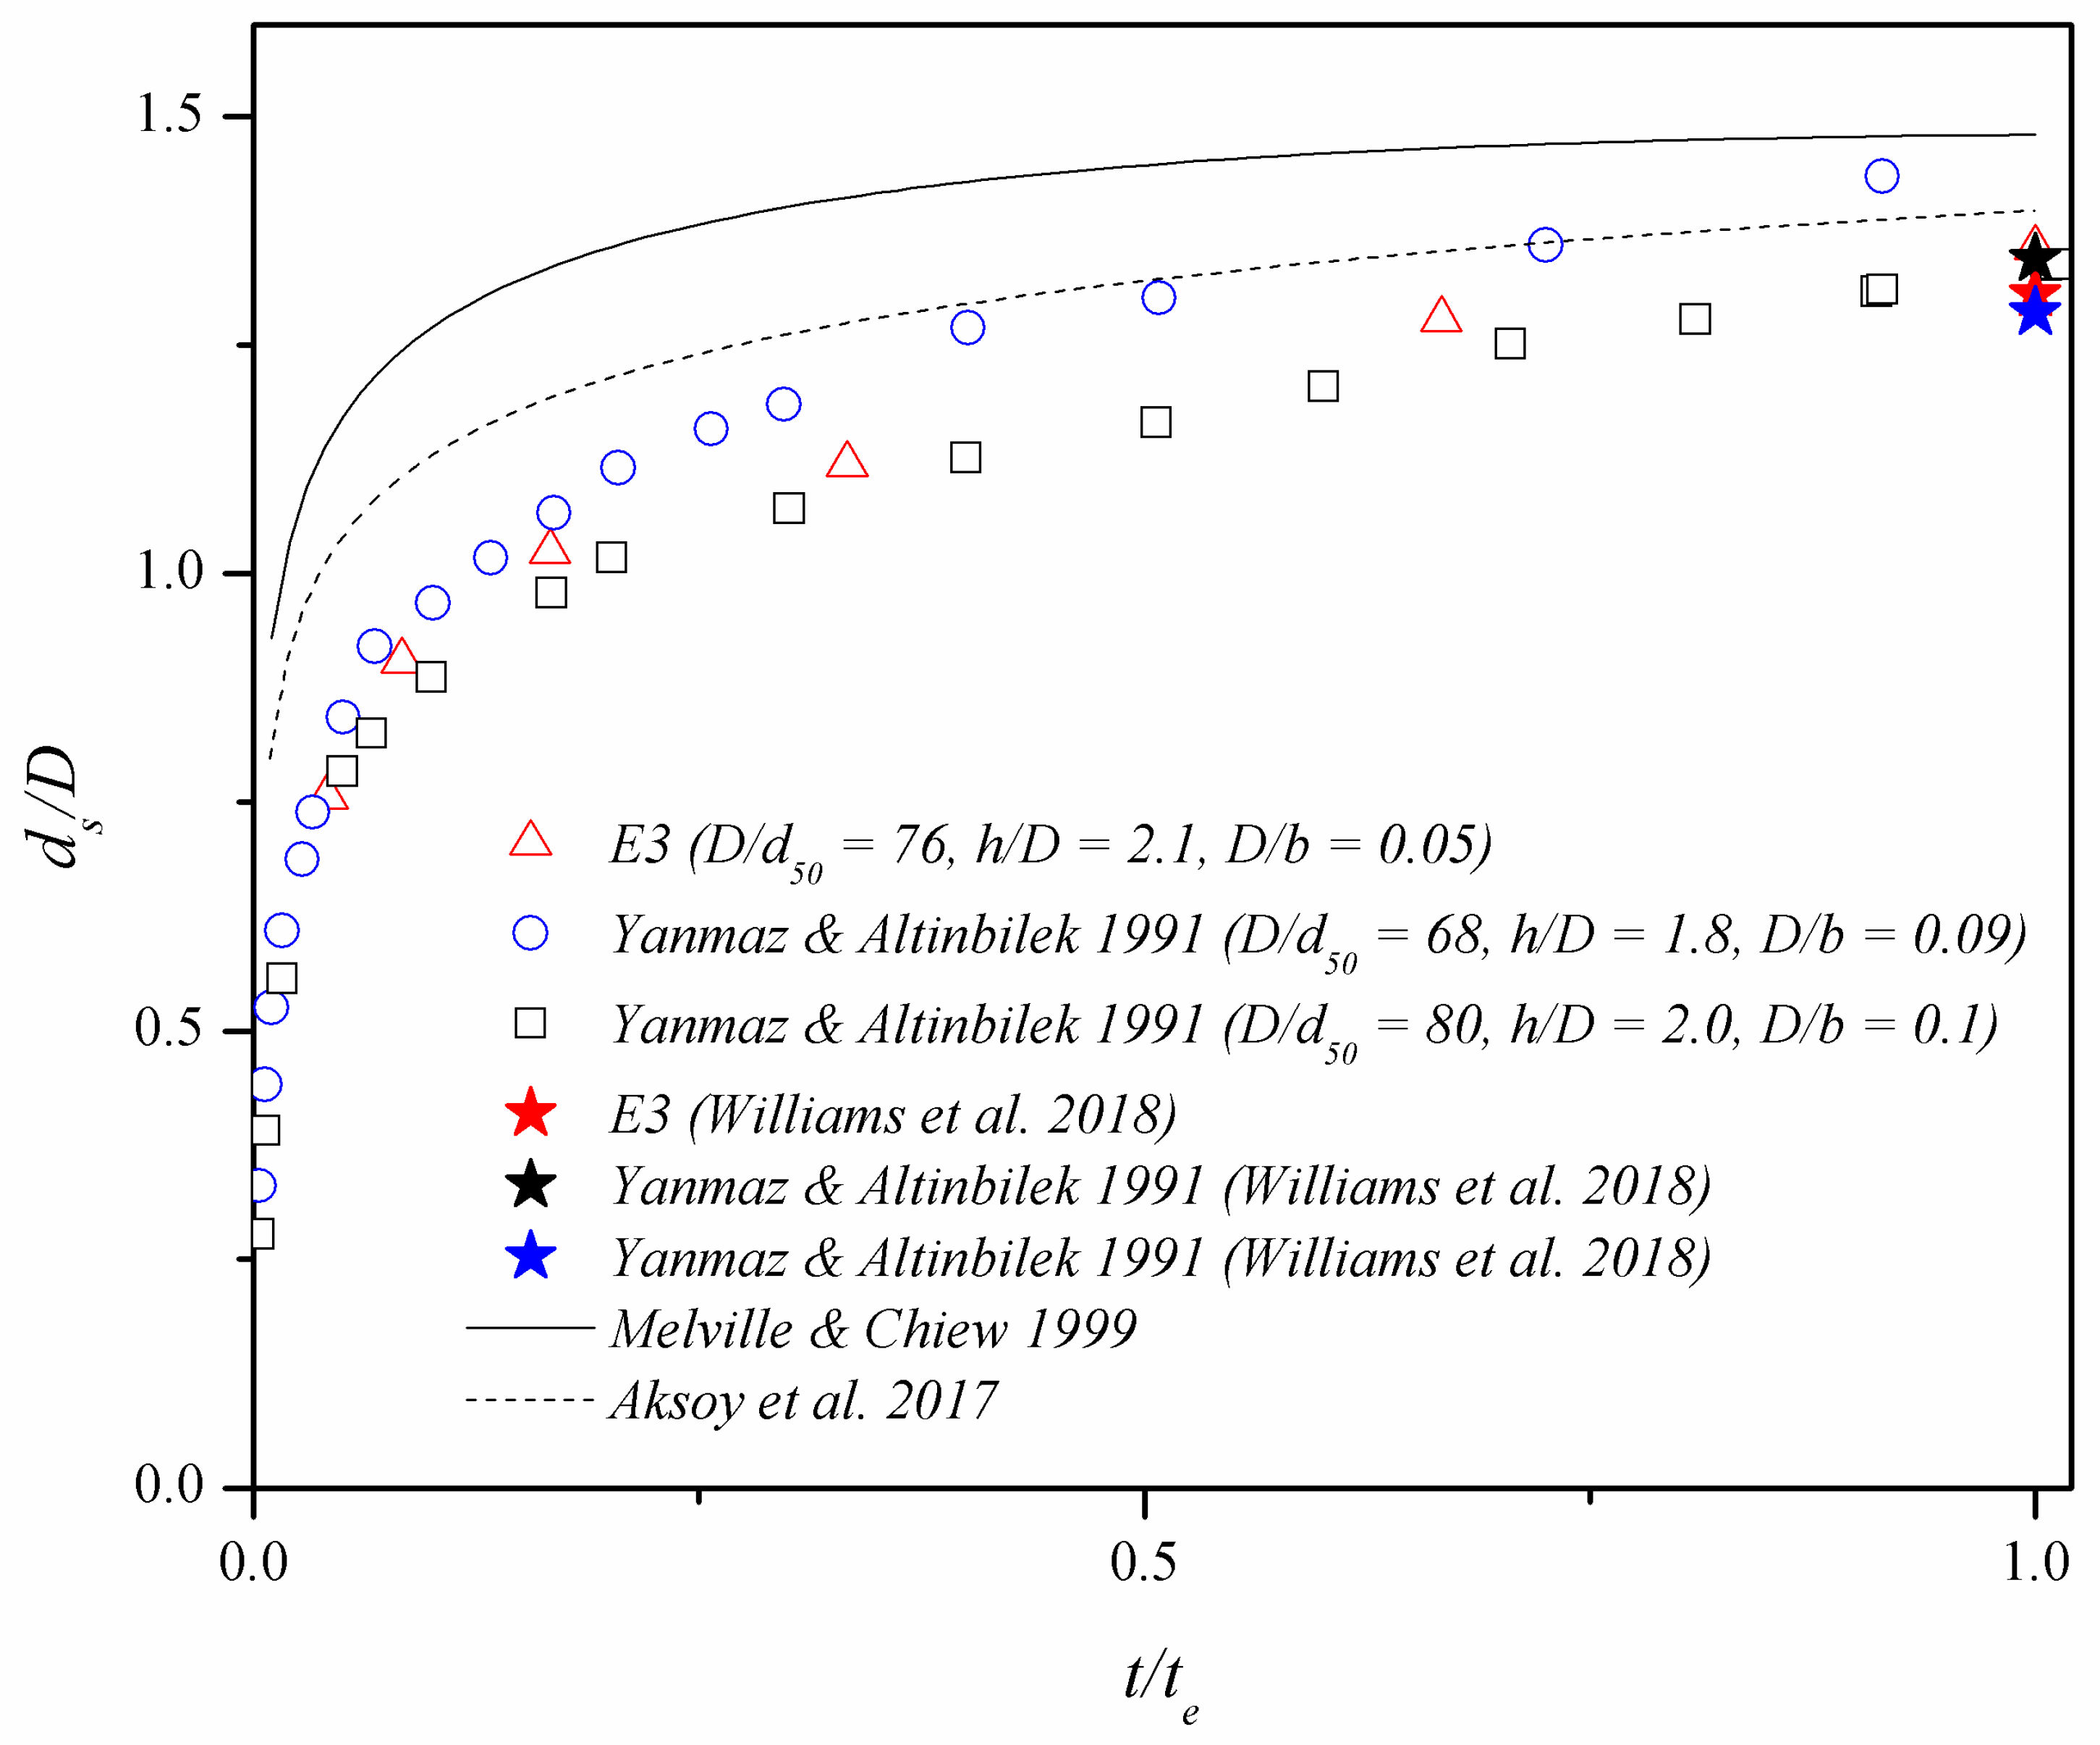
In Figure 9, a description of the progression of relative scour depth ds/D with dimensionless time t/te (where t is time and te is the time to equilibrium) is given. Test E3 of the present investigation was included as well as two tests from the investigation of Yanmaz and Altinbilek [22]. All tests had similar values of D/d50 and h/D; only D/b differed within the presented data set. For all tests, it can be seen that ds/D increased rapidly, attaining most of the maximum relative scour depth within half of the time to equilibrium. The values of the measured equilibrium scour depth (at t/te ≈ 1) are shown to be very similar among all tests as well. The figures also include curves calculated using predictive methods for the progression of ds/D with time from Melville and Chiew [21] (Equation (2)) and Aksoy et al. [23] (Equation (3)).
ds/dse = exp{−0.03|(Uc/U)ln(t/te)|1.6}
ds/D = 0.8 × (U/Uc)3/2 × (h/D)0.15 × (logTs)0.6
Ts = td50 × (Δgd50)0.5/D2
In Equation (4), Δ = (ρs − ρ)/ρ, where ρs is the density of the bed material, and ρ is the density of water. In Figure 9, the experimental parameters for test E3 were used to calculate the predictive curves. In Figure 10, the parameters for the test by D’Alessandro [17] were used for the prediction. The value of dse/D calculated using the predictive method presented in Williams et al. [19] (Equation (5)) was also included for each test as shown by the starred data points.
dse/D = 0.76kc1.69 × (h/D)0.32
In Equation (5), kc is the ratio between the velocity along the separating streamline Us and Uc. In Figure 9, it can be seen that there were small differences in dse/D observed in the middle of the scour process (i.e., approximately between 0.1 < t/te < 0.7). However, there was no specific trend which can be noted between the development of scour and blockage ration D/b. In the described middle section of the scour process, the scour depth was slightly lower for D/b = 0.1 when compared with D/b = 0.05; however, dse/D was slightly higher for D/b = 0.09 than either of the other tests. (Although unlikely, this could possibly be attributed to the small changes in D/d50 or h/D among the tests.). In general, for D/d50 < 100, it can be concluded that changes in D/b have a very small influence on both the progression of local scour as well as the equilibrium depth of scour.
The predictive method described by Equation (2) is represented by the solid curve in Figure 9 and Figure 10, and this method slightly over-predicted the depth of scour (ds) throughout the time to equilibrium. The method described by Equation (3) over-predicted the depth of scour for t/te < 0.5, beyond which the curve approached the results of Yanmaz and Altinbilek [22]. Equation (2) showed good prediction of dse/D for all tests.
However, the results presented in Figure 10 indicate that the effect of D/b was amplified as D/d50 increased. The results presented in Figure 10 had similar values of U/Uc and D/d50. The value of h/D was also altered among the tests; however, the literature indicated that the effect of flow depth on dse/D is minimal when h/D > 1.4 [3]. Therefore, in terms of influencing parameters, only D/b differed among the tests. In contrast to the data set presented in Figure 9, there were significant changes noted with changing D/b. For D/b = 0.09, the depth of scour was significantly higher throughout the progression to equilibrium when compared with D/b = 0.06. This was also in contrast to the results of the previous section which indicated that the relative scour depth increased as D/b decreased. This indicates that the effect of blockage ratio on local scour is also dependent on the value of D/d50, and the effect is amplified when D/d50 > 100.
This is in agreement with the results of Tejada [18] who conducted a series of experiments with varying sizes of bed material (d50) and similarly reported that the effect of D/b was minimal when D/d50 < 100 when compared with D/d50 > 100. This is reasonable, since larger values of relative coarseness are usually indicative of smaller sediment particles which would be more susceptible to changes in the flow field surrounding a cylinder.
Interestingly, Equation (2) provides a good estimation of the progression of scour for the results of Chabert and Engeldinger [27], while Equation (3) provides a better estimation for the test of D’Alessandro [17]. Furthermore, Equation (5) shows a much closer prediction of the test of Chabert and Engeldinger [27] than D’Alessandro [17]. This also indicates that further investigation on higher values of D/d50 is required in order to establish the role of D/b on local scour.
4. Discussion and Conclusions
The present investigation explored the progression of local scour around a circular cylinder placed in an erodible bed and the effects of channel blockage ratio D/b therein. It was established that, under the experimental conditions of this work, equilibrium of sediment removal in the vicinity of the cylinder was reached at 24 h. Beyond this period, changes in the scour formation were observed primarily in the downstream region which did not contribute significantly to the design of the foundation head for local scour.
At D/d50 < 100, the experimental results of the present investigation indicated that the size of the scour hole decreased with increasing blockage ratio which can likely be attributed to a weakening of the flow field mechanisms due to the sidewall proximity. In order to fully understand this phenomenon, detailed flow measurements in the flow field surrounding the cylinder are required in future work.
When compared with data from the literature, the progression of local scour and the relative scour depth did not appear to be significantly affected by changes in the blockage ratio for small values of relative coarseness (i.e., D/d50 < 100). However, analysis of data with high values of relative coarseness (D/d50 > 100) showed that blockage ratio had a greater effect on scour depth. Furthermore, comparison of the results of the present investigation with the literature results was particularly limited, since such analysis requires that all scour-governing parameters are identical. Future experimental design corresponding to previously published results would assist in accomplishing similar analysis for a broader range of conditions in future work. The authors recommend that further experimentation on the effect of D/b is required, particularly for a wider range of D/d50 which approaches field conditions (i.e., D/d50 > 100). In order to achieve this, use of larger-sized flumes with finer bed material is required.
Various predictive methods from the literature were used to estimate the progression of local scour to varying degrees of efficacy. The scour-predicting equation presented in Williams et al. [19] was shown to provide a better estimation of dse/D for D/d50 < 100 than for larger values of relative coarseness, indicating that a scaling factor may be required in order to implement such predictive methods in practical design.
Larger values of D/d50 are particularly desirable in this venture, since field values of relative coarseness are usually greater than 200. Once the effect of sidewall proximity on scour depth has been established at a prototype level, further evaluation can be carried out in order to incorporate this effect into scour estimation.
Author Contributions
The experimental work in the present investigation was carried out by P.W. The analysis and manuscript compilation were conducted jointly by the authors.
Funding
This research was funded by the Natural Sciences and Engineering Research Council of Canada through the Discovery Grant program to Ram Balachandar and Tirupati Bolisetti.
Conflicts of Interest
The authors declare no conflict of interest.
Notation
| ASTM | American Society for Testing and Materials |
| b | channel width |
| Cc | coefficient of sediment gradation |
| Cu | coefficient of sediment uniformity |
| D | cylinder diameter |
| D/b | blockage ratio |
| D/d50 | relative coarseness |
| dse | maximum equilibrium scour depth |
| dse/D | relative scour depth |
| d10 | sediment size of which 10 percent is finer |
| d16 | sediment size of which 16 percent is finer |
| d30 | sediment size of which 30 percent is finer |
| d50 | median sediment diameter |
| d60 | sediment size of which 60 percent is finer |
| d84 | sediment size of which 84 percent is finer |
| g | gravitational acceleration |
| h | flow depth |
| h/D | flow shallowness |
| kc | Us/Uc |
| t | time |
| te | time to equilibrium of local scour |
| Ts | dimensionless time parameter |
| U | mean streamwise velocity of approach flow |
| U/Uc | flow intensity |
| Uc | critical velocity for incipient motion of sediment |
| Us | streamwise velocity along the separating streamline |
| X | streamwise coordinate direction |
| Y | vertical coordinate direction |
| Z | spanwise coordinate direction |
| Δ | relative density, (ρs − ρ)/ρ |
| ρ | density of fluid |
| ρs | density of bed material |
| σg | standard deviation of sediment particle size |
References
- Shirhole, A.M.; Holt, R.C. Planning for a comprehensive bridge safety program. Transp. Res. Rec. 1991, 1290, 39–50. [Google Scholar]
- Wardhana, K.; Hadipriono, F.C. Analysis of recent bridge failures in the United States. J. Perform. Constr. Fac. 2003, 17, 144–150. [Google Scholar] [CrossRef] [Green Version]
- Melville, B.W.; Coleman, S.E. Bridge Scour; Water Resources Publication: Highlands Ranch, CO, USA, 2000. [Google Scholar]
- Lagasse, P.F.; Thompson, P.L.; Sabol, S.A. Guarding against Scour; Civil Engineering: New York, NY, USA, 1995; p. 56. [Google Scholar]
- LeBeau, K.H.; Wadia-Fascetti, S.J. Fault Tree analysis of schoharie creek bridge collapse. J. Perform. Constr. Fac. 2007, 21, 320–326. [Google Scholar] [CrossRef]
- Graveland, B.; Krugel, L. Train Derails In Calgary On Bridge, Carries Petroleum Product. Available online: http://www.huffingtonpost.ca/2013/06/27/train-derails-calgary-bridge_n_3509067.html (accessed on 8 March 2018).
- Government of Canada. Railway Investigation Report R13C0069–Transportation Safety Board of Canada. Available online: http://www.bst-tsb.gc.ca/eng/rapports-reports/rail/2013/r13c0069/r13c0069.html (accessed on 29 May 2019).
- Chiew, Y.M. Local Scour at Bridge Piers. Ph.D. Thesis, University of Auckland, Auckland, New Zealand, 1984. [Google Scholar]
- Ettema, R.; Melville, B.W.; Constantinescu, G. Evaluation of Bridge Scour Research: Pier Scour Processes and Predictions; Transportation Research Board of the National Academies: Washington, DC, USA, 2011. [Google Scholar]
- Nasif, G.; Balachandar, R.; Barron, R.M. Characteristics of flow structures in the wake of a bed-mounted bluff body in shallow open channels. J. Fluids Eng. 2015, 137. [Google Scholar] [CrossRef]
- Ettema, R.; Melville, B.W.; Barkdoll, B. Scale effect in pier-scour experiments. J. Hydraul. Eng. 1998, 124, 639–642. [Google Scholar] [CrossRef]
- Williams, P.; Balachandar, R.; Bolisetti, T. Evaluation of Local Bridge Pier Scour Depth Estimation Methods. In Proceedings of the 24th Canadian Congress of Applied Mechanics, Saskatoon, SK, Canada, 2–6 June 2013; pp. 2–6. [Google Scholar]
- Williams, P.; Bolisetti, T.; Balachandar, R. Evaluation of governing parameters on pier scour geometry. Can. J. Civ. Eng. 2016, 44, 48–58. [Google Scholar] [CrossRef] [Green Version]
- Ramamurthy, A.S.; Lee, P.M. Wall effects on flow past bluff bodies. J. Sound Vib. 1973, 31, 443–451. [Google Scholar] [CrossRef]
- Ramamurthy, A.S.; Balachandar, R.; Vo, D.N. Blockage correction for sharp-edged bluff bodies. J. Eng. Mech-ASCE 1989, 115, 1569–1576. [Google Scholar] [CrossRef]
- Hodi, B. Effect of Blockage and Densimetric Froude Number on Circular Bridge Pier Local Scour. Master’s Thesis, University of Windsor, Windsor, ON, Canada, 2009. [Google Scholar]
- D’Alessandro, C. Effect of Blockage on Cylindrical Bridge Pier Local Scour. Master’s Thesis, University of Windsor, Windsor, ON, Canada, 2013. [Google Scholar]
- Tejada, S. Effects of Blockage and Relative Coarseness on Clear Water Bridge Pier Scour. Master’s Thesis, University of Windsor, Windsor, ON, Canada, 2014. [Google Scholar]
- Williams, P.; Bolisetti, T.; Balachandar, R. Blockage correction for pier scour experiments. Can. J. Civ. Eng. 2018, 45, 413–417. [Google Scholar] [CrossRef]
- Mia, M.F.; Nago, H. Design method of time-dependent local scour at circular bridge pier. J. Hydraul. Eng. 2003, 129, 420–427. [Google Scholar] [CrossRef]
- Melville, B.W.; Chiew, Y.M. Time scale for local scour at bridge piers. J. Hydraul. Eng. 1999, 125, 59–65. [Google Scholar] [CrossRef]
- Yanmaz, A.M.; Altinbilek, H.D. Study of time-dependent local scour around bridge piers. J. Hydraul. Eng. 1991, 117, 1247–1268. [Google Scholar] [CrossRef]
- Aksoy, A.O.; Bombar, G.; Arkis, T.; Guney, M.S. Study of the time-dependent clear water scour around circular bridge piers. J. Hydrol. Hydromech. 2017, 65, 26–34. [Google Scholar] [CrossRef] [Green Version]
- Guan, D.; Chiew, Y.M.; Wei, M.; Hsieh, S.C. Characterization of horseshoe vortex in a developing scour hole at a cylindrical bridge pier. Int. J. Sediment Res. 2019, 34, 118–124. [Google Scholar] [CrossRef]
- Williams, P. The Role of Approach Flow and Blockage Ratio on Local Scour around Circular Cylinders with and without Countermeasures. Ph.D. Thesis, University of Windsor, Windsor, ON, Canada, 2019. [Google Scholar]
- U.S. Department of the Interior Bureau of Reclamation. Water Measurement Manual; US Government Printing Office: Washington, DC, USA, 2001. [Google Scholar]
- Chabert, J.; Engeldinger, P. Etude Des Affouillements Autour Des Piles de Points (Study of Scour at Bridge Piers); Bureau Central d’Etudes les Equipment d’Outre-Mer, Laboratoire National d’Hydraulique: Paris, France, 1956. [Google Scholar]
Figure 1.
Equilibrium scour formation for D/b = 0.05 (left) and 0.10 (right) [19].
Figure 1.
Equilibrium scour formation for D/b = 0.05 (left) and 0.10 (right) [19].

Figure 2.
Schematic of the laboratory flume used for experimentation.

Figure 3.
Schematic of the experimental setup.

Figure 4.
Bed profile measurements in the XY (symmetry) plane at Z/D = 0 for t = {1, 2, 4, 8, 16, 24} h.
Figure 4.
Bed profile measurements in the XY (symmetry) plane at Z/D = 0 for t = {1, 2, 4, 8, 16, 24} h.

Figure 5.
Bed profile measurements in the XY (symmetry) plane at Z/D = 0 for tests E1 and E3.

Figure 6.
Bed profile measurements in the XZ plane at Y/D = 0 for tests E1 and E3.

Figure 7.
Bed profile measurements in the XY (symmetry) plane at Z/D = 0 for tests E1 and E2.

Figure 8.
Bed profile measurements in the XZ plane at Y/D = 0 for tests E1 and E2.

Figure 9.
Comparison of dse/D with t/te for test E3 and data from [22] with D/d50 ≈ 76 as well as estimation curves [21,23] and points [19] from literature.

Figure 10.
Comparison of dse/D with t/te and data from [17,27] with D/d50 ≈ 137 as well as estimation curves [21,23] and points [19] from literature.


Table 1.
Experimental conditions for tests of the current investigation.
| ID | b (m) | U (m/s) | U/Uc | h/D | D/d50 | D/b | te (min) | dse/D |
|---|---|---|---|---|---|---|---|---|
| E1 | 1.22 | 0.254 | 0.83 | 2.0 | 81 | 0.05 | 2880 | 1.42 |
| E2 | 0.4 | 0.262 | 0.86 | 2.0 | 81 | 0.15 | 1440 | 0.91 |
| E3 | 1.22 | 0.254 | 0.83 | 2.1 | 76 | 0.05 | 1440 | 1.48 |
© 2019 by the authors. Licensee MDPI, Basel, Switzerland. This article is an open access article distributed under the terms and conditions of the Creative Commons Attribution (CC BY) license (http://creativecommons.org/licenses/by/4.0/).
Share and Cite
MDPI and ACS Style
Williams, P.; Balachandar, R.; Bolisetti, T. Examination of Blockage Effects on the Progression of Local Scour around a Circular Cylinder. Water 2019, 11, 2631. https://doi.org/10.3390/w11122631
AMA Style
Williams P, Balachandar R, Bolisetti T. Examination of Blockage Effects on the Progression of Local Scour around a Circular Cylinder. Water. 2019; 11(12):2631. https://doi.org/10.3390/w11122631
Chicago/Turabian StyleWilliams, Priscilla, Ram Balachandar, and Tirupati Bolisetti. 2019. "Examination of Blockage Effects on the Progression of Local Scour around a Circular Cylinder" Water 11, no. 12: 2631. https://doi.org/10.3390/w11122631
Note that from the first issue of 2016, this journal uses article numbers instead of page numbers. See further details here.