Impact of Filters to Reduce Phosphorus Losses: Field Observations and Modelling Tests in Tile-Drained Lowland Catchments


Faculty of Agricultural and Environmental Sciences, University of Rostock, 18059 Rostock, Germany
*
Author to whom correspondence should be addressed.
Water 2019, 11(12), 2638; https://doi.org/10.3390/w11122638
Submission received: 14 November 2019
/
Revised: 10 December 2019
/
Accepted: 11 December 2019
/
Published: 13 December 2019
(This article belongs to the Section Water Quality and Contamination)
Abstract
:In this study, we analyzed Dissolved Reactive Phosphorus (DRP) and Total Phosphorus (TP) concentration dynamics over two years in surface waters of five nested catchments in northeastern Germany. Based on this, we constructed a filter box filled with iron-coated sand for Phosphorus (P) removal at the edge of a tile-drained field. Results of the filter box experiment were used for a model scenario analysis aiming at evaluating the P removal potential at catchment scale. DRP and TP concentrations were generally low but they exceeded occasionally target values. Results of the filter box experiment indicated that 28% of the TP load could be retained but the DRP load reduction was negligible. We assume that DRP could not be reduced due to short residence times and high flow dynamics. Instead, particulate P fractions were probably retained mechanically by the filter material. The scenario analysis revealed that the P removal potential of such filters are highest in areas, in which tile drainage water is the dominant P source. At a larger spatial scale, in which other P (point) sources are likewise important, edge-of-field P filters can only be one part of an integrated catchment strategy involving a variety of measures to reduce P losses.
1. Introduction
Phosphorus (P) as an essential nutrient for plant production can cause eutrophication with negative ecological and economic consequences when excessively introduced into lakes, rivers and oceans [1]. P pollution of surface water bodies is considered a widespread and serious problem [2]. In Germany, 23,000 t P are discharged into surface waters every year. Although P losses have been reduced by 72% in recent decades, in particular due to technical improvements of wastewater treatment plants, the ecological status of many surface waters is still unsatisfactory [3]. Currently, only 8.2% of German water bodies achieve the “good ecological status” according to the EU Water Framework Directive [4].
Today, agriculture is to be considered the main driver of nutrient pollution in surface waters [5]. In Germany, 50% of the P inputs are attributed to agriculture [6] and artificial drainage can be one of the main P sources in tile-drained areas [7,8]. Artificial drainage as a widespread agricultural practice aims to remove excess water from the soil, promote aeration, and ultimately increase crop yield. On the other hand, there is a high risk for P leaching due to short travel times of water in the unsaturated soil zone [9]. This is evidenced by increased P concentrations in drainage water after runoff events in comparison to baseflow conditions [5,10,11]. Various factors controlling P concentrations in surface waters are discussed, including the P supply of soil [7], the proportion of agricultural land [12], the distribution of arable and grassland [13] and the type of tillage [14]. Studies on the influence of fertilization do not provide any clear dependencies [15,16], but emphasize the site specifics and the role of legacy-P for leaching [8,17].
Against the background of widespread high P inputs in coastal waters, Germany has to reduce annual P inputs into the Baltic Sea by 170 t according to the Baltic Sea Action Plan [18]. Therefore, there is an urgent need to identify P input pathways and to introduce suitable management measures to reduce P losses. A decisive starting point to approach these goals are measures in agricultural areas [19]. Good agricultural practices and land-based measures such as the reduction of P surpluses, optimum fertilizer management and the creation of riparian buffer strips are apparently not sufficient to reduce the P load in surface water bodies to an ecologically acceptable level [14]. A bundle of P removal technologies to treat drainage water exists that potentially can help to achieve the required reductions. However, there is a lack of studies in the field and the long-term performance of these technologies is often still unclear [20]. Those potential technologies in tile-drained fields include, for example, the installation of P filters at the end of drain collectors. While filter technologies and materials have been evaluated in the field in Denmark [21] or Belgium [22], those techniques have only been rarely tested to date at drainage plots in Germany [23]. Based on successful field tests, eco-hydrological models can eventually help to assess the efficiency of P removal technologies at a catchment scale and they can act as support systems for decision makers.
Today there is a basic understanding of the causes, sources and consequences of P input into surface waters and artificial drainage is widely accepted as an important pathway of P [7,8]. However, there is still a lack of long-term site-specific data with a high temporal resolution across various spatial scales. This data are crucial to better understand the spatial P transport mechanisms from the source to the sea and to derive appropriate management strategies. Based on these considerations, the aims of the present study were firstly to analyze the P concentration dynamics across different spatial scales. Secondly, we evaluated the P removal potential of a filter box filled with iron-coated sand installed at the edge of a tile-drained field. Thirdly, we estimated the reduction effect of P filters in catchments of different sizes using the Soil and Water Assessment Tool [24].
For this study, we considered the two most important P forms: Dissolved Reactive Phosphorus (DRP) and Total Phosphorus (TP). The study was conducted in an agricultural lowland river basin in northeastern Germany.
2. Materials and Methods
2.1. Study Site
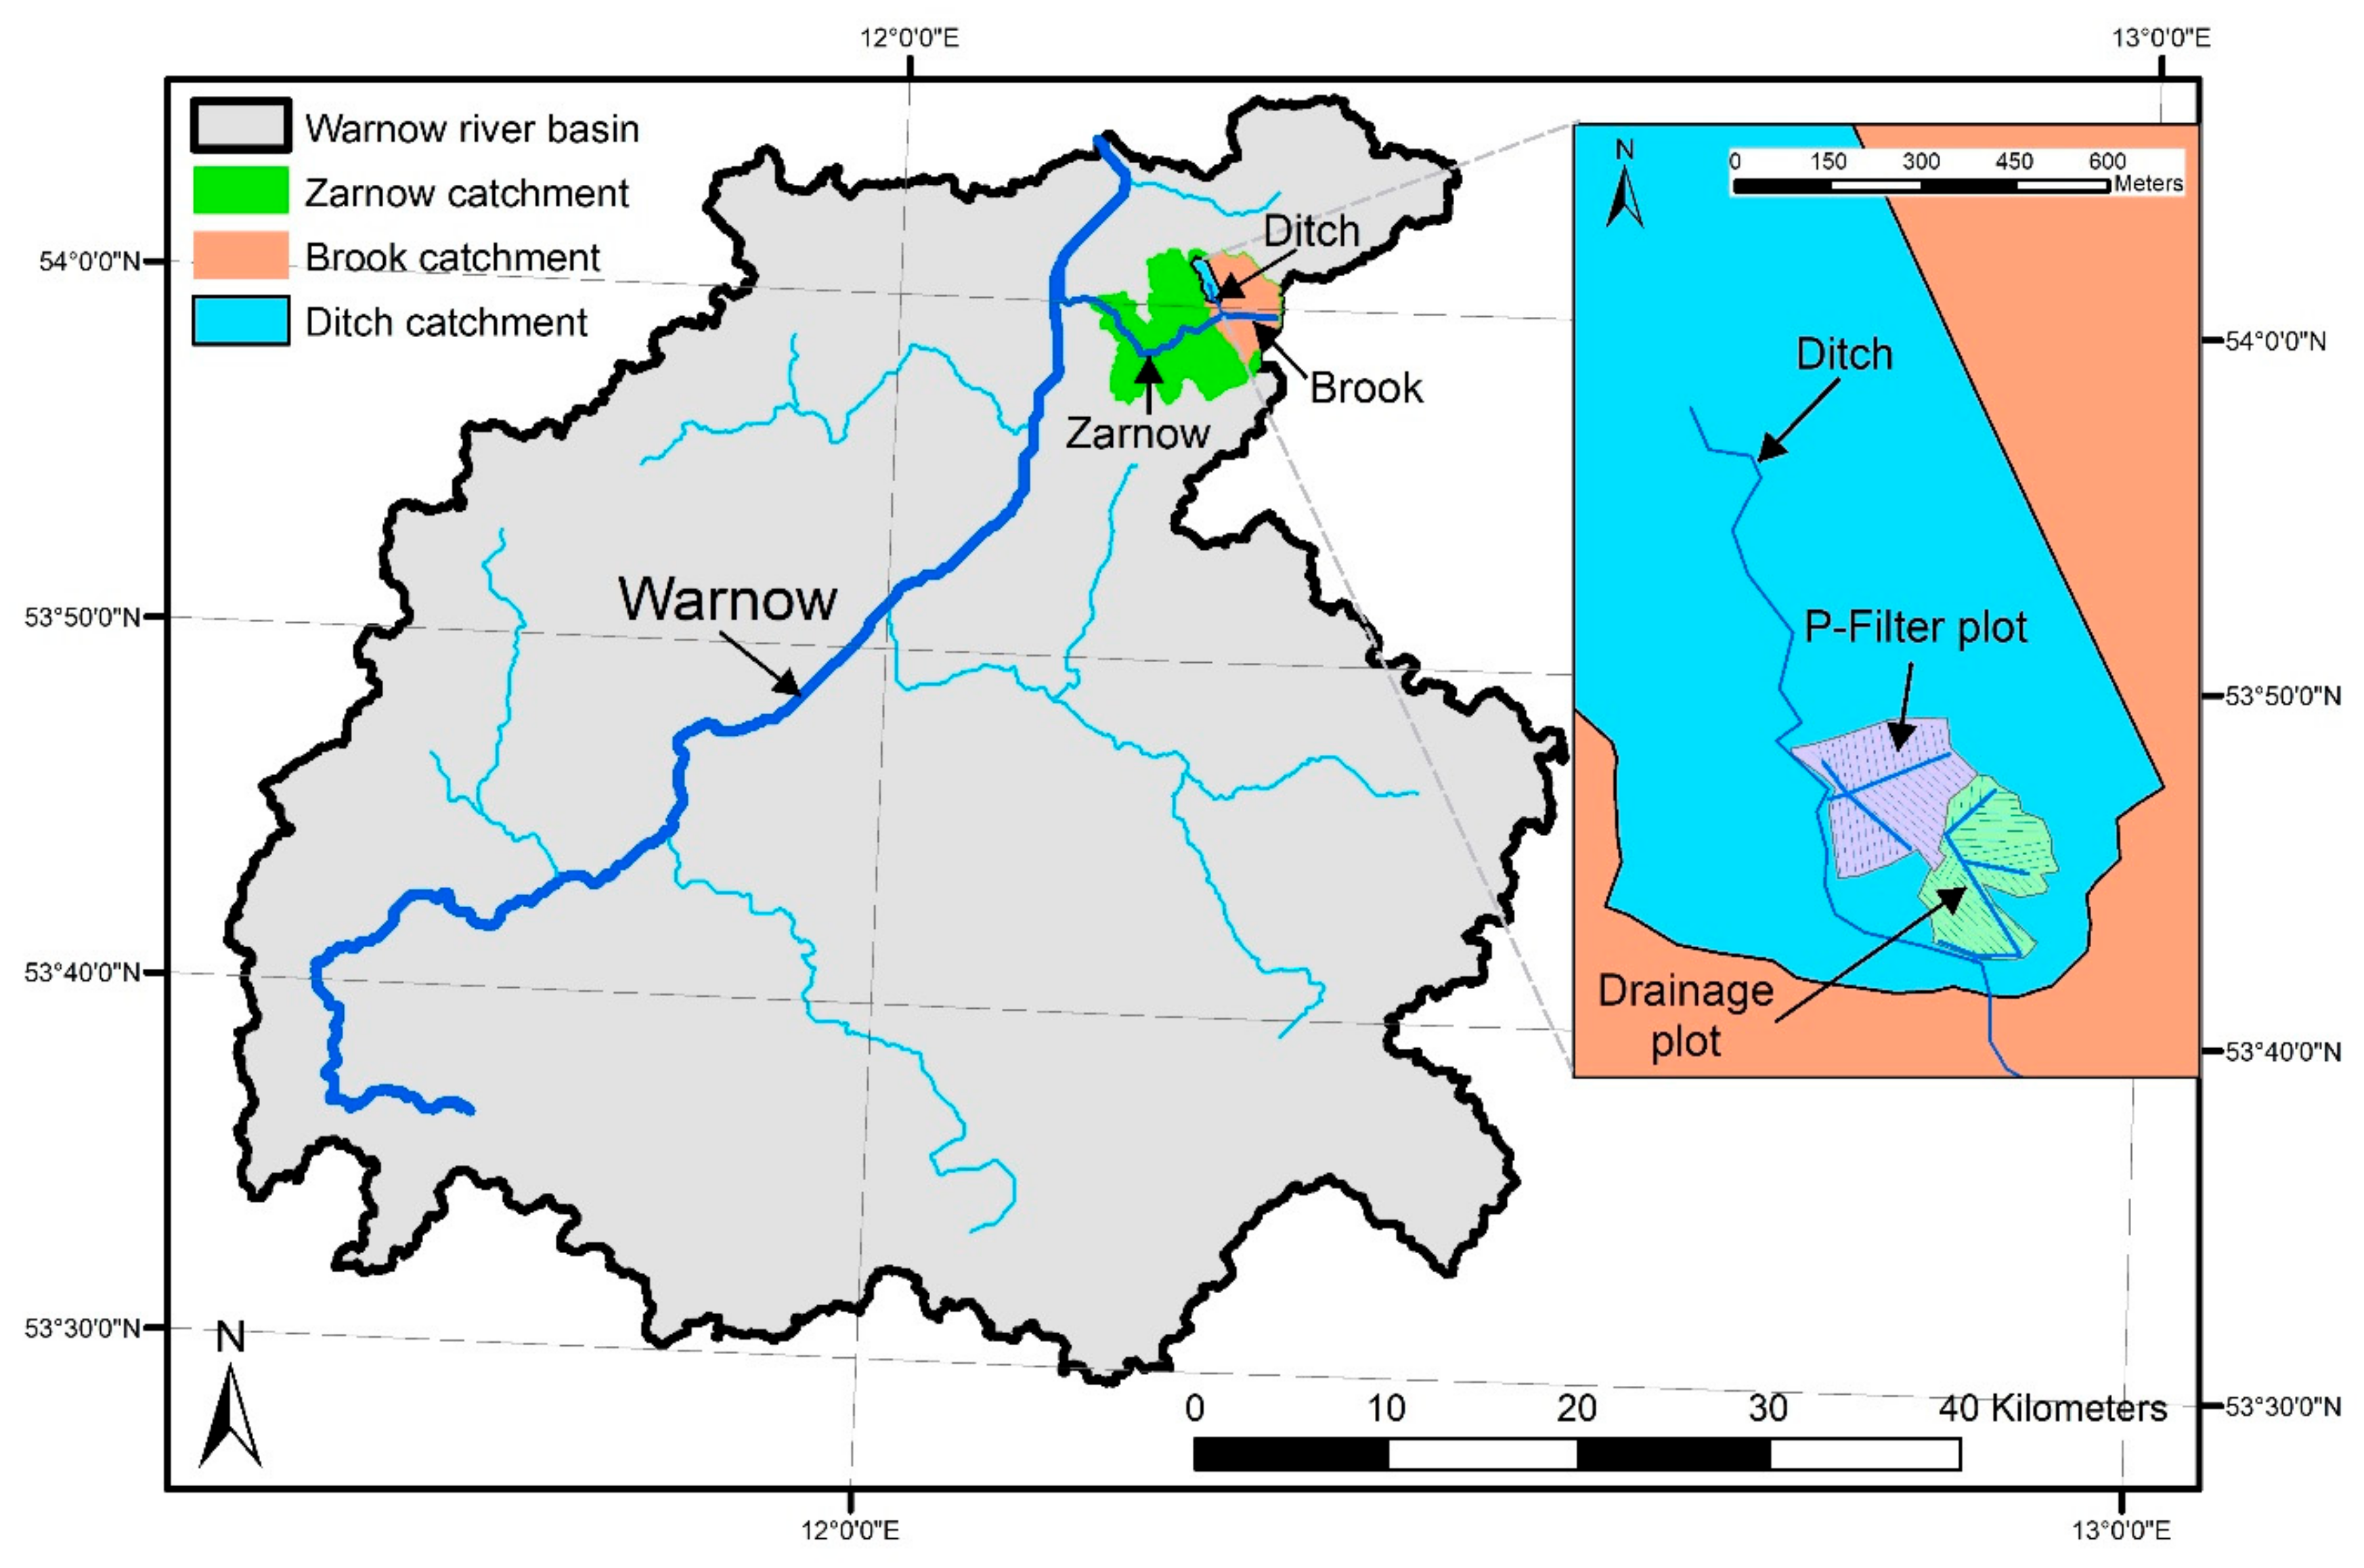
Five nested catchments in northeastern Germany were investigated (Figure 1, Table 1). The Warnow river basin (WRB) as the largest of the studied catchments is 3041 km² in size and discharges near the city of Rostock into the Baltic Sea. It is characterized by gentle slopes with elevations ranging from sea level at the outlet to 146 m a.s.l. at the basin’s boundary. The WRB is sparsely populated with villages and smaller towns. Mean annual precipitation is 647 mm and a mean annual temperature is 9.1 °C in this area. The region is occasionally covered with snow in winter. Mineral soils with a predominance of hydromorphic soils such as Gleysols and Stagnosols as well as Cambisols and Luvisols are characteristic for the basin. A typical feature of the region is the presence of subsurface tile drains to improve soil moisture conditions. 18% of the catchment is estimated to be drained by tile drainage systems. The second largest watershed is the catchment of the river Zarnow, which is a tributary of the river Warnow. This catchment is 49.6 km² large and intensively agricultural used. As in all investigated catchments, land use is dominated by arable land. The Brook catchment, which is located completely within the Zarnow catchment, is 16.2 km² in size and land use is similar to the Zarnow catchment. For those two catchments, the relatively high proportions of grassland (31%) are remarkable. The Ditch catchment, which is part the Brook catchment, covers an area of 181 ha and consists almost entirely of arable land. 87% of this catchment is tile-drained. The drainage pipes are located at a depth of 1.1 m, with a spacing of 8–22 m due to the heterogeneity of the soil. Predominant soil types in the ditch catchment are Luvisols, Stagnosols and Gleysols. The soil texture was mainly identified as sandy loam, but occasionally, loamy sands, loams, or silt loams were found as well. As expected, the soil hydraulic conductivity (ks) within this catchment varied widely (topsoil: 0.03–4.4 m/day; subsoil: 0.01–0.58 m/day) [16]. The Drainage plot that lies within the Ditch catchment is part of one field with conventional cultivation. Here, the drainage spacing is 8 m. The ks value of the topsoil of the drainage plot was approximately 0.4 m/day, while ks of the subsoil was slightly lower (0.17 m/day) [16]. The drain discharge occurs mainly during the winter period from November to April because of a precipitation surplus caused by lower temperatures and low evapotranspiration rates. During the growth period in summer, generally only small and infrequent flow events take place, and also smaller ditches frequently fall dry [25]. The P-Filter plot is similar to the Drainage plot with regard to size (4.6 ha), land use (same field) and tile-drainage specifications.
Field cards that were provided by the local farmer contain detailed information about P fertilization and P uptake by crops for the Drainage plot, the Ditch, and the Brook catchment. Since the farming practice is typical for the region, it can be assumed that the given numbers are valid for the entire Warnow river basin as well. According to the field cards, P was applied on arable land as mineral and organic fertilizers and ranged depending on agricultural crops from 11 to 75 kg/(ha year. The calculated P output by crop uptake is approximately equal to P input by the fertilizers. The P nutrition status of 50–80 mg/kg plant available P in the top soils, determined by double lactate extraction, can be described as optimal according to the German nutrient classes [26].
2.2. Experimental Setup, Sampling Strategy, and P Analysis
Streamflow data at a daily and P concentration data at a biweekly (Warnow) to monthly (Zarnow) resolution for the rivers Warnow and Zarnow were provided by the State Office for Environment, Nature Conservation and Geology Mecklenburg-Western Pomerania. For the remaining three catchments, data were collected using monitoring stations run by our working group.
At the Brook and at the Ditch, the water levels were permanently recorded using a pressure sensor (Brook) and an ultrasonic sensor (Ditch). We conducted frequent (usually once per week) discharge measurements at these two stations with an inductive flowmeter to develop the rating curves. The discharge at the collector drain outlet of the Drainage plot was recorded automatically using a Venturi flume. All three sampling stations were each equipped with an automatic water sampler (Teledyne Isco, Inc., Lincoln, NE, USA). The samplers were equipped with 24 bottles. In each bottle, a composite sample consisted of two sub-samples taken every three hours, which corresponds to six hours. To obtain a daily sample, the water of four bottles were merged into one composite sample for further analysis. During the winter discharge periods (November–April), we took on average three samples per week and station. During low flow periods (May–October) especially in summer, the sampling density was reduced to ca. two samples per week and station.
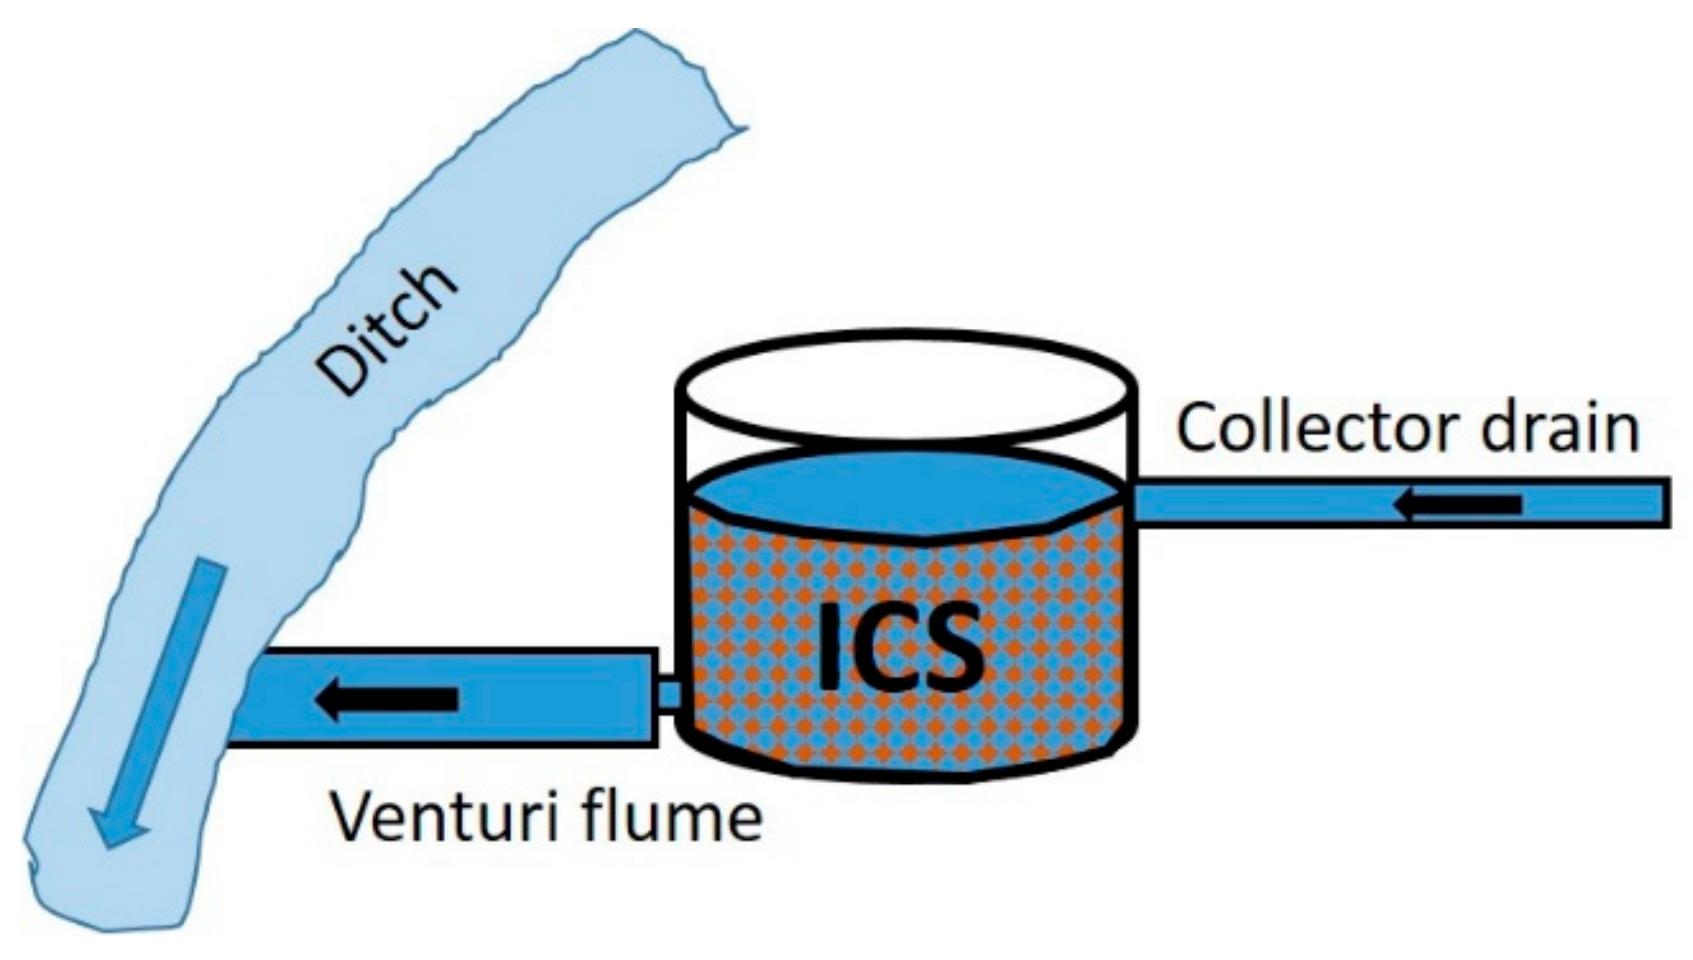
The discharge at the P-Filter plot was, identical to the Drainage plot, recorded automatically using a Venturi flume. A cylindrical filter box (height = 200 cm, radius = 45 cm) was installed at the end of the collector drain and before the Venturi flume on this site (Figure 2). The geometry of the filter box is based on discharge measurements in previous years. This box was filled with iron-coated sand (porosity: φ = 0.52), which was a byproduct from drinking water production. The iron-coated sand was washed and sieved in advance (<3.2 mm) to prevent clogging. Laboratory experiments in advance showed a very high P sorption capacity of the iron-coated sand (1247 mg/kg) confirming the suitability of this product as a P filter in the field. The hydraulic residence time (HRT), based on flow rates between 0.4 and 3.0 L/s, ranged from 54 s to 370 s (mean: 165 s) and was calculated according to the following equation:
where HRT is the hydraulic retention time (s), V is the Volume of the filter box (L), φ is the porosity of the filter material (-), and Q is the flow rate (L/s).
During the investigation period, all drainage water passed the filter material. Water samples were taken from January to April 2018 manually once a week before and after the filter box for further analysis.
The collected water samples were subdivided into two subsamples. The subsample for DRP was filtered immediately using a 0.7 μm glass microfibres filter (VWR, Germany, pre-combusted at 450 °C for 4 h). The subsample for TP analysis was unfiltered transferred into a Falcon tube, which was stored at −20 °C until measurement. TP was analyzed in the thawed sample colometrically after oxidation in alkaline medium in a microwave (CEM GmbH, Kamp-Lintfort) followed by DRP analysis using the molybdenum-blue method by colometrically measurement (Specord40 (Analytic Jena, Jena, Germany)).
Daily TP loads were calculated by multiplying streamflow and P concentrations. P concentrations were interpolated for days, at which no measured P concentrations were available. Annual P loads were calculated by summing up daily values.
2.3. Catchment Modeling
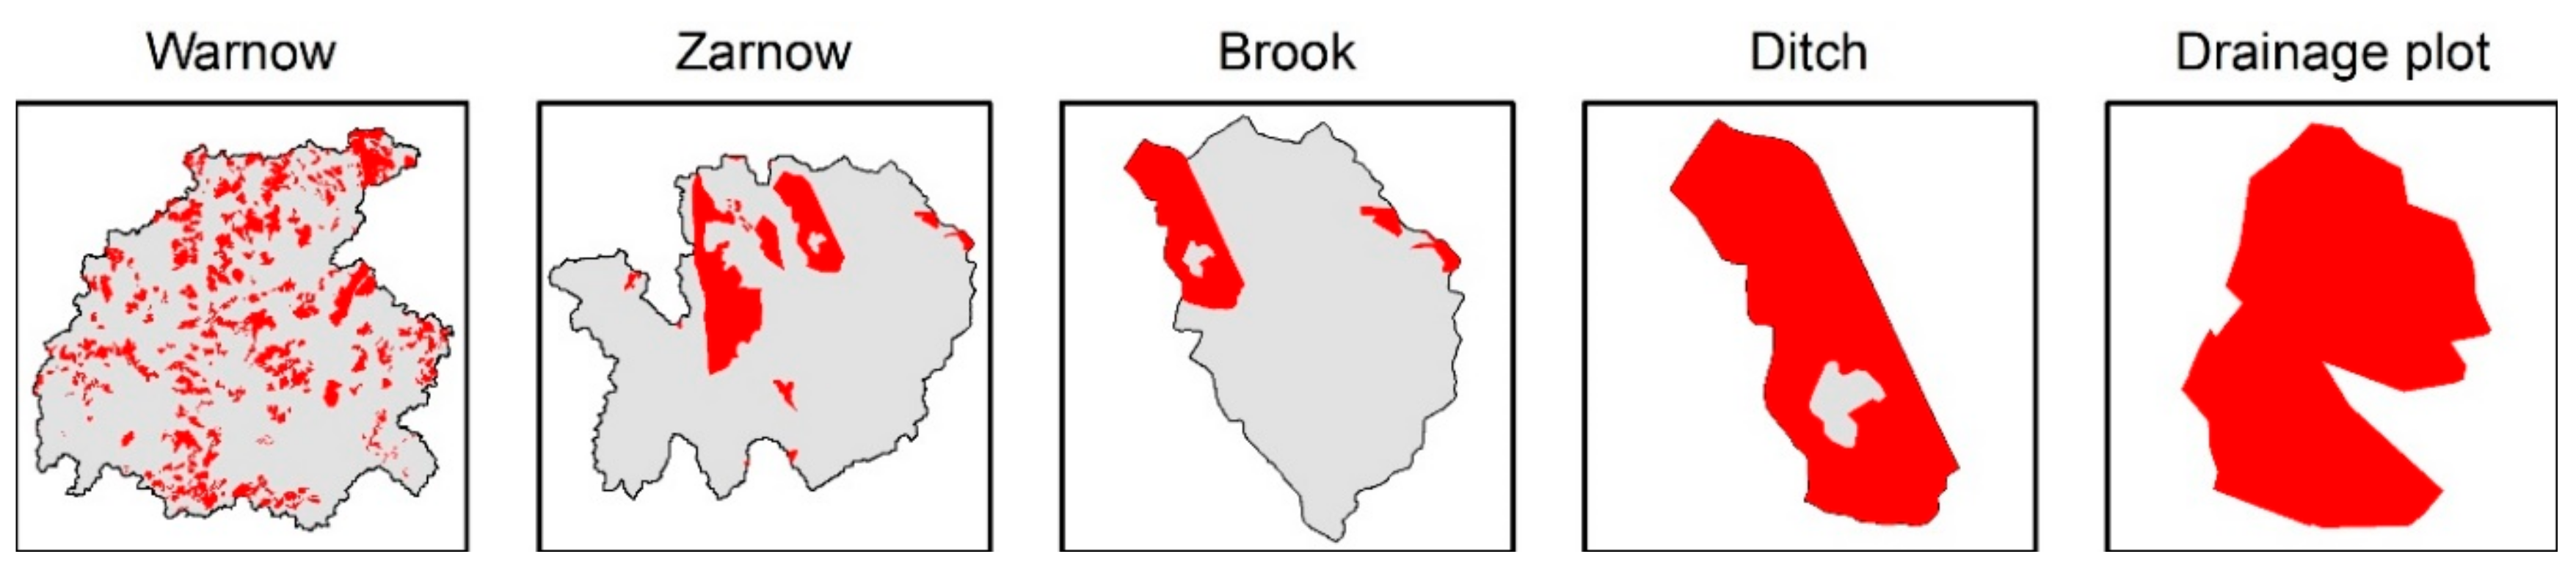
We evaluated the potential P removal efficiency of filter boxes in tile-drained areas with the help of a modeling experiment. Preconditions for such an analysis are (i) a reasonable simulation of the P loads for the respective catchments, (ii) knowledge about the P sources, and (iii) the extent of tile-drained areas (Figure 3).
The underlying basis for the simulation experiment was a calibrated eco-hydrological model by using the Soil and Water Assessment Tool (SWAT) for the Warnow river basin and its sub-basins. Details of the model development and simulation results are published in Bauwe et al. [27]. The simulated annual area-weighted TP loads for each catchment were taken from the model output and compared with measured data. The model output provides also different P sources (wastewater treatment plants, surface runoff, tile drainage water, and groundwater) that were checked for plausibility, and these were taken for further analysis.
Based on own results (Section 3.2) and results from a partner project [22], we developed three different scenarios assuming a 30%, 40% and 50% TP reduction efficiency of the filters. For this study, we assumed an extreme scenario meaning that all tile-drained areas are equipped with P filters. The results therefore describe the maximum potential to reduce the overall TP load that P filters at drainage outlets may have in the Warnow river basin.
3. Results and Discussion
3.1. P Concentrations across Different Spatial Scales
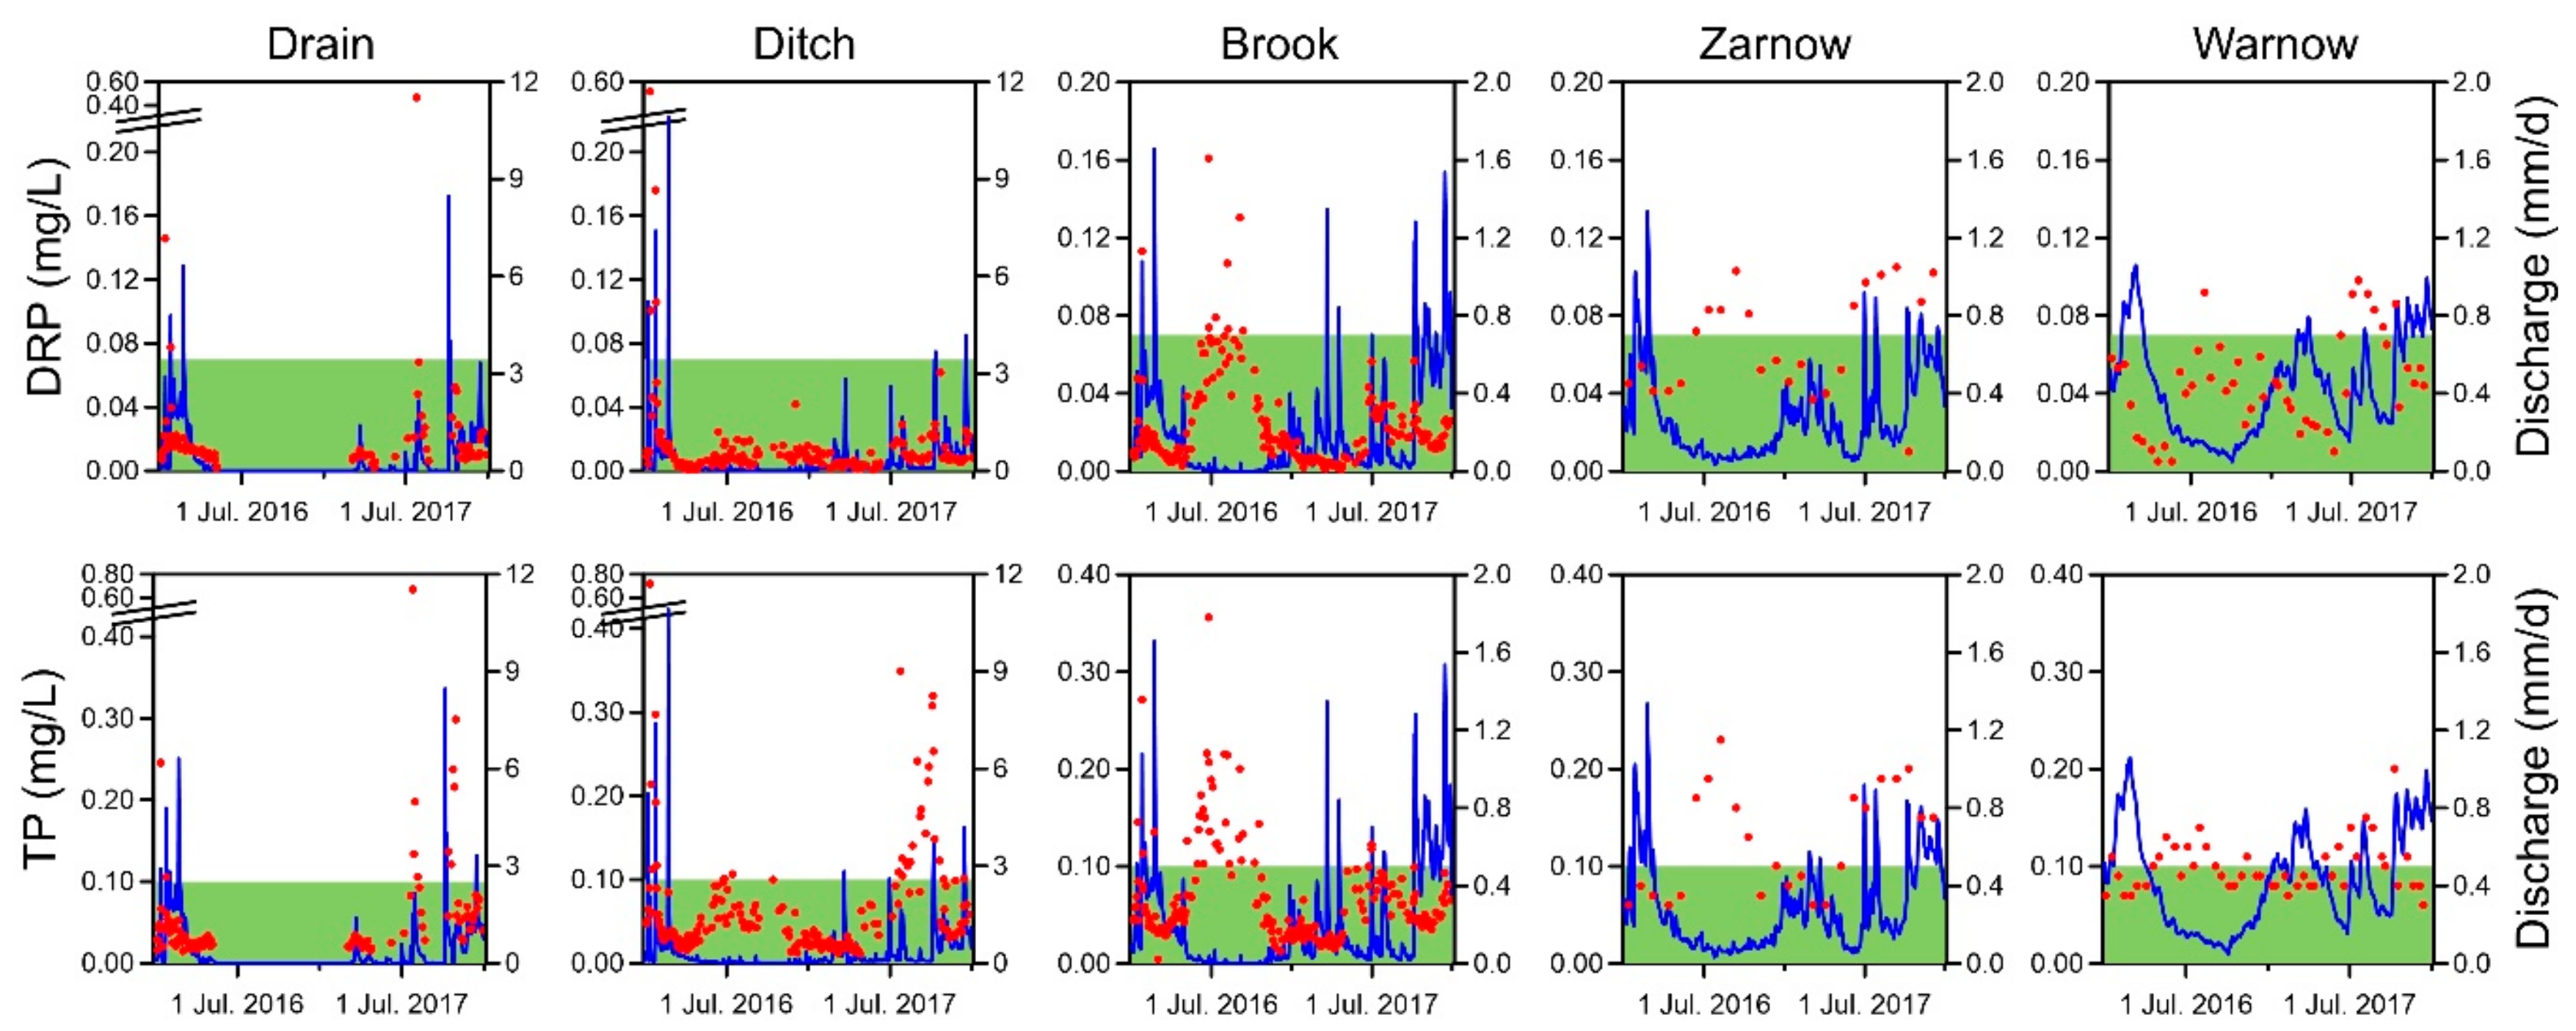
DRP and TP concentrations were relatively low in 2017 and 2018 at all scales (Figure 4). Mean DRP and TP concentrations at the Drainage plot, Ditch, Brook, Zarnow and Warnow were 0.021, 0.015, 0.022, 0.066 and 0.045 mg DRP/L and 0.056, 0.064, 0.064, 0.125 and 0.099 mg TP/L. These concentrations are typical for the catchments and have not changed during the last 15 years. An intensive monitoring at the Drainage plot, Ditch and Brook between 2003 and 2006 revealed similar DRP and TP concentrations [16]. Additionally, official monitoring data for the Zarnow and Warnow indicate comparable DRP and TP concentration since the early 2000s [28].
The sampling frequency at the Drainage plot, the Ditch and the Brook was much higher compared to Zarnow and Warnow (Figure 4). That might be the reason for capturing extraordinary high P concentrations recorded at a few days in the drainage and Ditch water. For example, at 13 January 2016, DRP and TP concentrations reached values of 0.56 and 0.72 mg/L in the Ditch. These high concentrations were probably triggered by a snowmelt event leading to surface runoff transporting notable amounts of sediments loaded with P. Another striking event occurred in 2017, which was an extremely wet year, on July 25 with DRP and TP concentrations of 0.46 and 0.67 mg/L in the drainage water. These high P concentrations were presumably triggered by a large storm event of 19.1 mm of rain during that day. In particular, P rich ochre flocs in the drainage pipes can be an important P source during storm events in this area [30]. These two examples underpin the importance of hydro-meteorological events on P losses, at least at small spatial scales and they call for an intelligent sampling design to capture extreme values. At the Zarnow and Warnow, river samples were taken either biweekly (Warnow) or once a month (Zarnow) (Figure 4). Following such a sampling design makes it difficult to capture extreme events and to calculate reasonable annual loads, since a small number of events often controls annual P loads.
The magnitude of P concentrations at the Drainage plot, at which usually no flow occurs in summer (Figure 4), is largely driven by hydrological events, which is typical for tile-drained catchments [11,15]. Instead, P concentrations are controlled to a large degree by season at the higher spatial scales. In these catchments, P concentrations increased under low flow conditions during summer and they decreased under high flow conditions in winter (Figure 4). In particular, during summer, the thresholds for a good ecological status in surface water bodies were frequently exceeded for both DRP and TP (Figure 4). Those seasonal effects in the same catchments have been described by other authors [31]. They are often associated with point sources, which will be diluted during high flows and will be amplified during low flow [32,33]. This might partly explain those effects for the entire Warnow river basin—e.g., 82 wastewater treatment plants are located within the basin—but not for the Zarnow, the Brook and the Ditch sub-catchments, at which point sources do not exist therein. Another explanation might be DRP release from sediment under anoxic conditions in summer [31]. Therefore, it can be assumed that the seasonal patterns for TP are probably controlled by the diluted P fractions. Detailed water analysis at several stations of the Warnow river basin revealed that dissolved P fractions such as DRP (due to sediment release) are dominant forms of TP in summer, whereas particulate P fractions dominate in other seasons [31]. P filters, installed at the end of drain collectors, might help to reduce P concentrations throughout a year. However, these systems need to handle the extremely dynamic flow conditions (Figure 4) in tile-drained catchments.
3.2. Filter Box to Reduce P Losses from Tile-Drained Fields
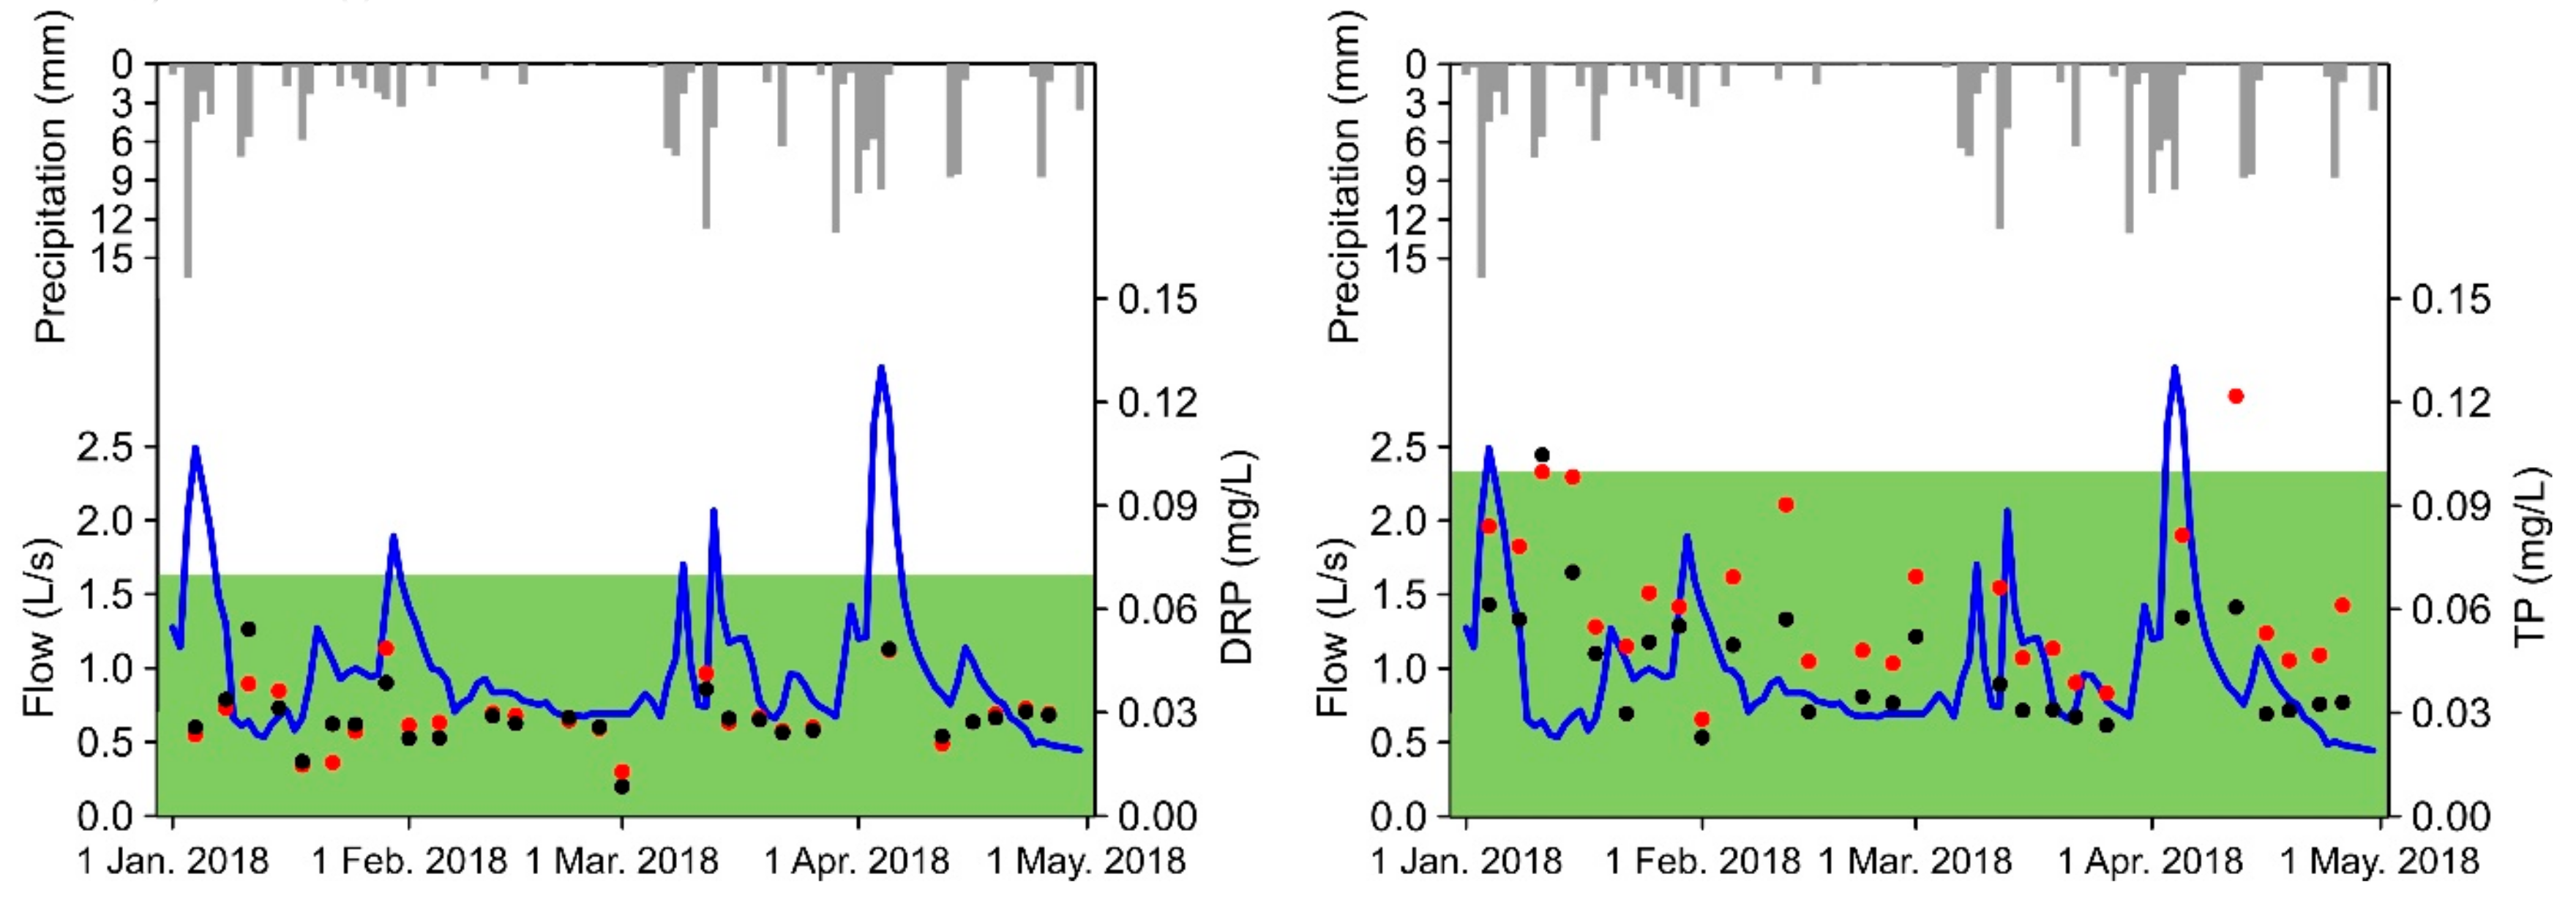
Figure 5 visualizes the temporal development of discharge and DRP and TP concentrations in front and behind the filter box. As expected, DRP concentrations were notably lower compared to TP concentrations. DRP concentrations at the inlet of the filter ranged from 0.01 to 0.05 mg/L. The range of DRP concentrations after the passage of the filter box was identical. TP concentrations at the inlet ranged from 0.03 to 0.12 mg/L, while TP concentrations were lower after the passage of the filter box and ranged from 0.02 to 0.10 mg/L. There is a very weak tendency for DRP and TP to increase with rising drainage water flow.
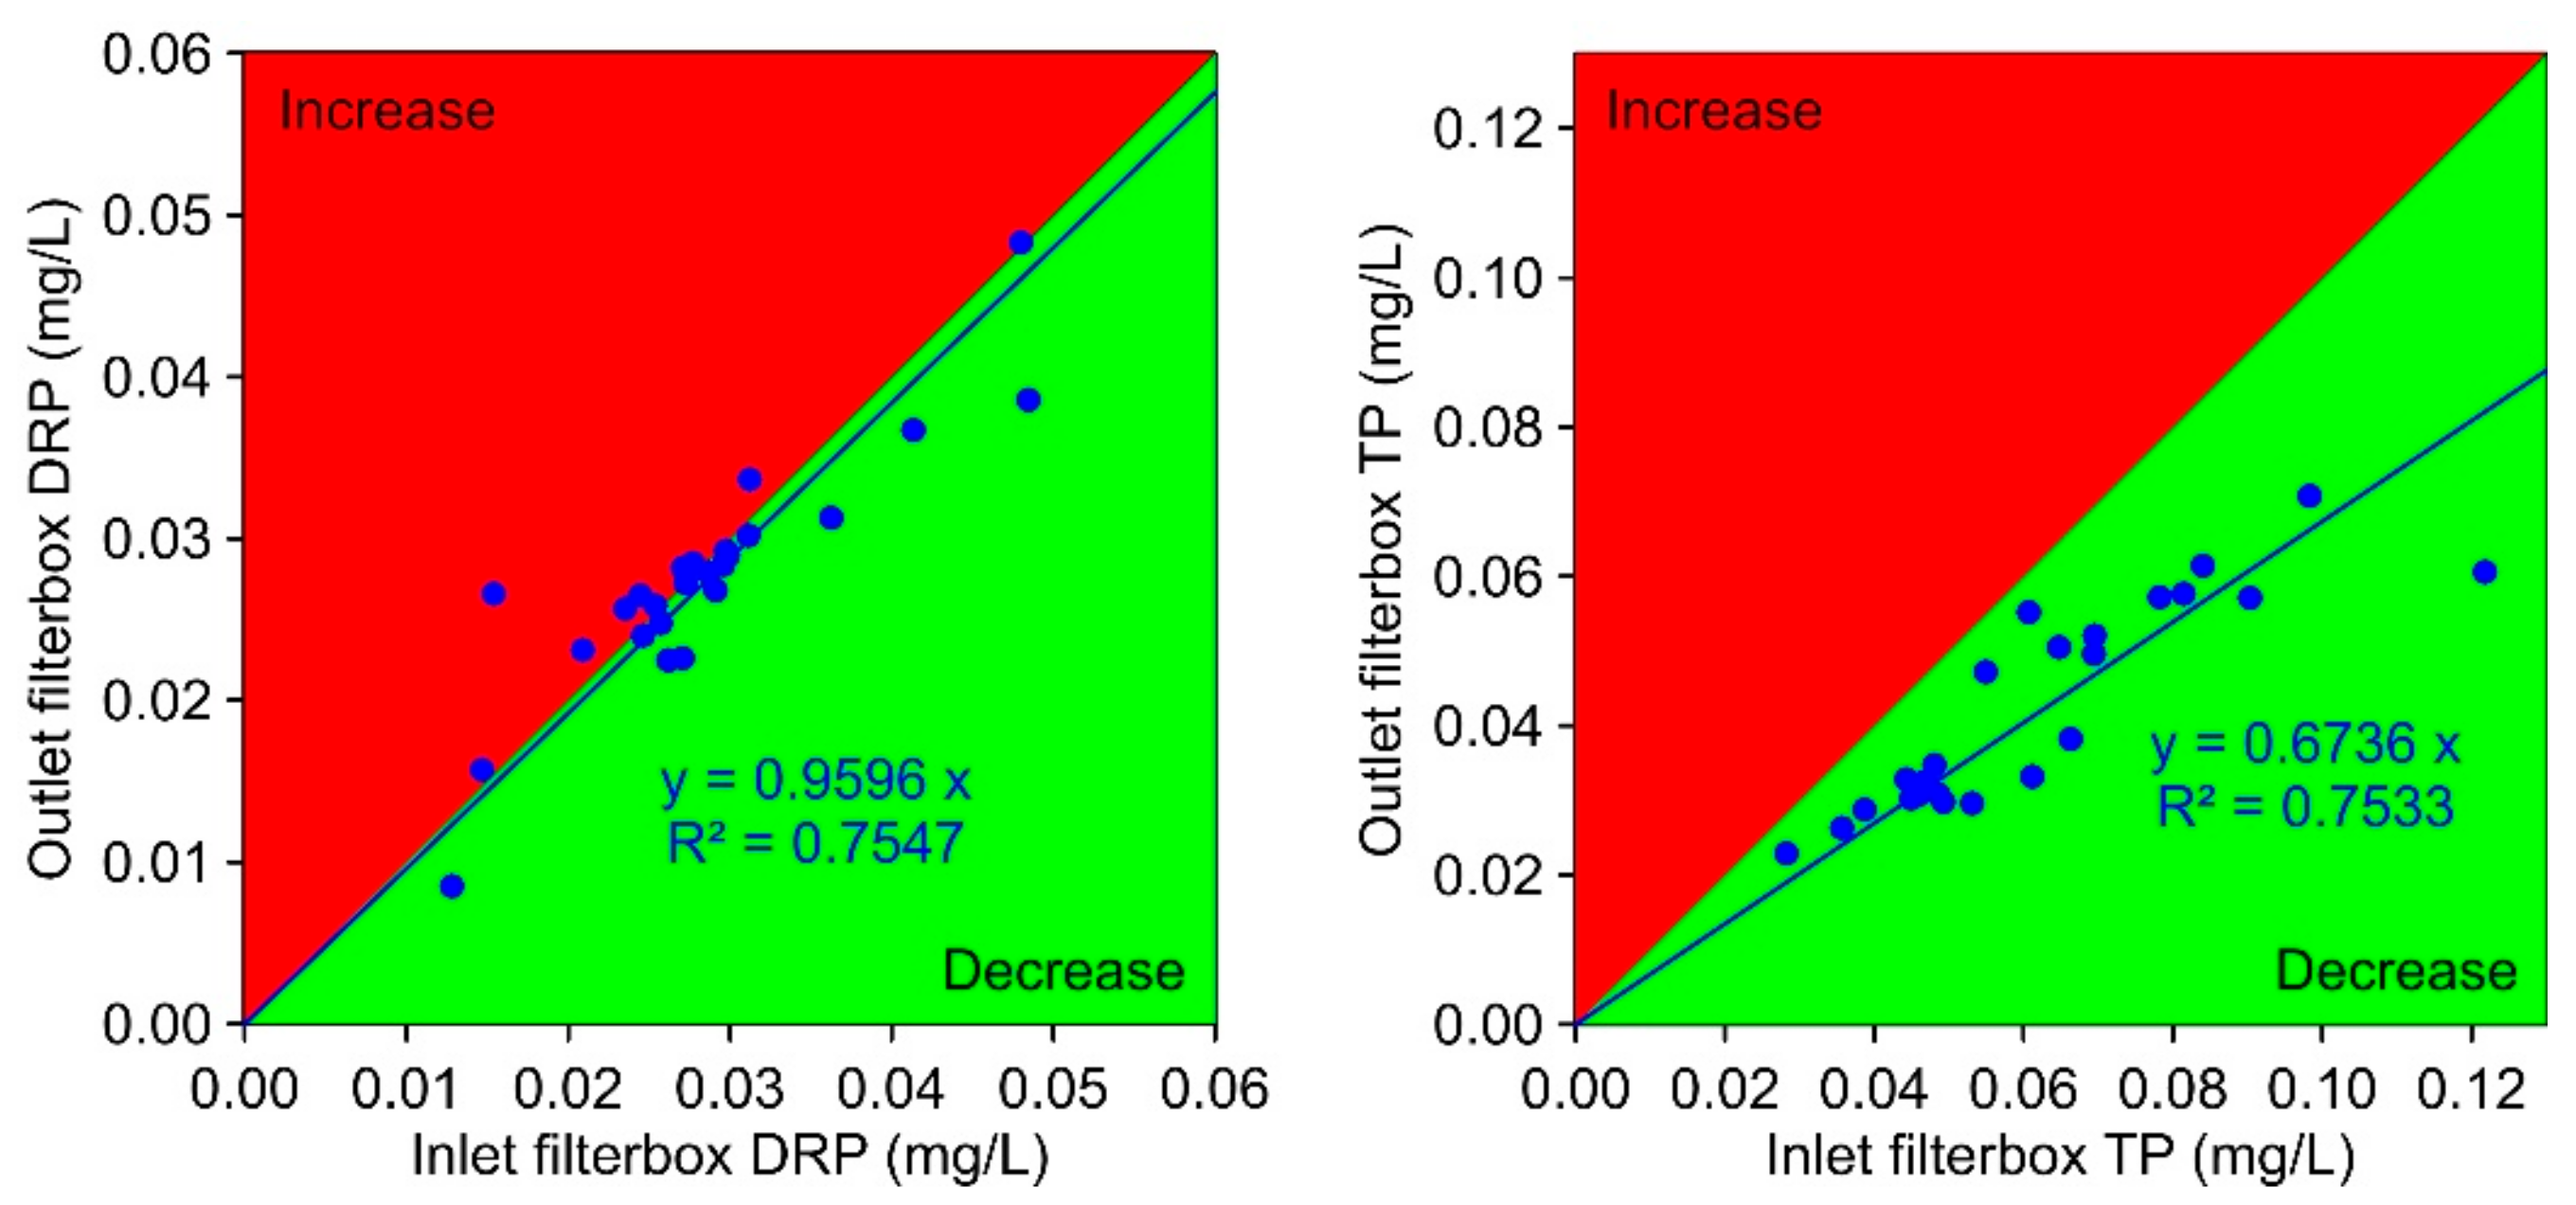
The effect of the P filter is best visible when concentrations of the outlet are plotted against concentrations of the inlet (Figure 6). The DRP concentrations at the filter inlet and filter outlet were similar and fluctuated consequently around the 1:1 line. The particulate P fractions were well retained by the filter (Figure 6 right). The TP concentrations at the filter outlet were always smaller than at the filter inlet. The trend line in Figure 6 right indicates that the larger the P concentrations at the filter inlet, the greater the P reduction.
In order to quantify the effectiveness of the P filter box, P loads were calculated for the investigation period by multiplying flow and concentrations for the filter in- and outlet. Between January and April 2018, a total of 62 g DRP/ha and 138 g TP/ha was calculated using the concentrations of the filter inlet. After the passage of the P filter, the loads summed up to 61 g DRP/ha and 99 g TP/ha result. This means constant loads for DRP but a significant load reduction of 28% for TP.
It can be concluded that due to the short residence times of the water in the filter, dissolved P fractions could not be converted into insoluble P compounds by precipitation reactions with the iron-coated sand. Particulate P fractions were probably retained mechanically by the filter material or the filter box. This was demonstrated by the deposition of sediments at the bottom of the box at the end of the runoff period. Therefore, it can be assumed that other filter materials such as sand would also be able to remove particulate P fractions [34]. Our field experiment has shown that P filter boxes at drainage outlets are in principle capable to significantly reduce P loads even at very low P concentrations. Nevertheless, P filter boxes are more efficient when P concentrations are higher. A recent study conducted in Flanders (Belgium) using the same filter material showed the great potential of P filter boxes to remove P from agricultural drainage waters, when boundary conditions are optimal [22]. DRP removal efficiencies of >73% were achieved in a field test, when discharge rates were <7 m³/day and DRP concentrations were >0.1 mg/L. In contrast, discharge rates at our Drainage plot were 86 m³/day on average and DRP concentrations were <0.1 mg/L. In addition, Vandermoere et al. [22] reported on retention times varying from 226 to 2700 s that were much higher compared to our field experiment (54 to 370 s). This leads to the conclusion that the combination of low DRP concentrations and high discharge rates resulting in low residence times were unsuitable conditions to remove DRP. DRP concentrations >0.2 mg/L for an efficient DRP removal are also suggested by other authors [35]. However, researchers still face the challenge to deal with storm events that lead to high discharge rates transporting higher P loads [22,36,37].
3.3. P Removal Potential of Filter Boxes at Catchment Scale
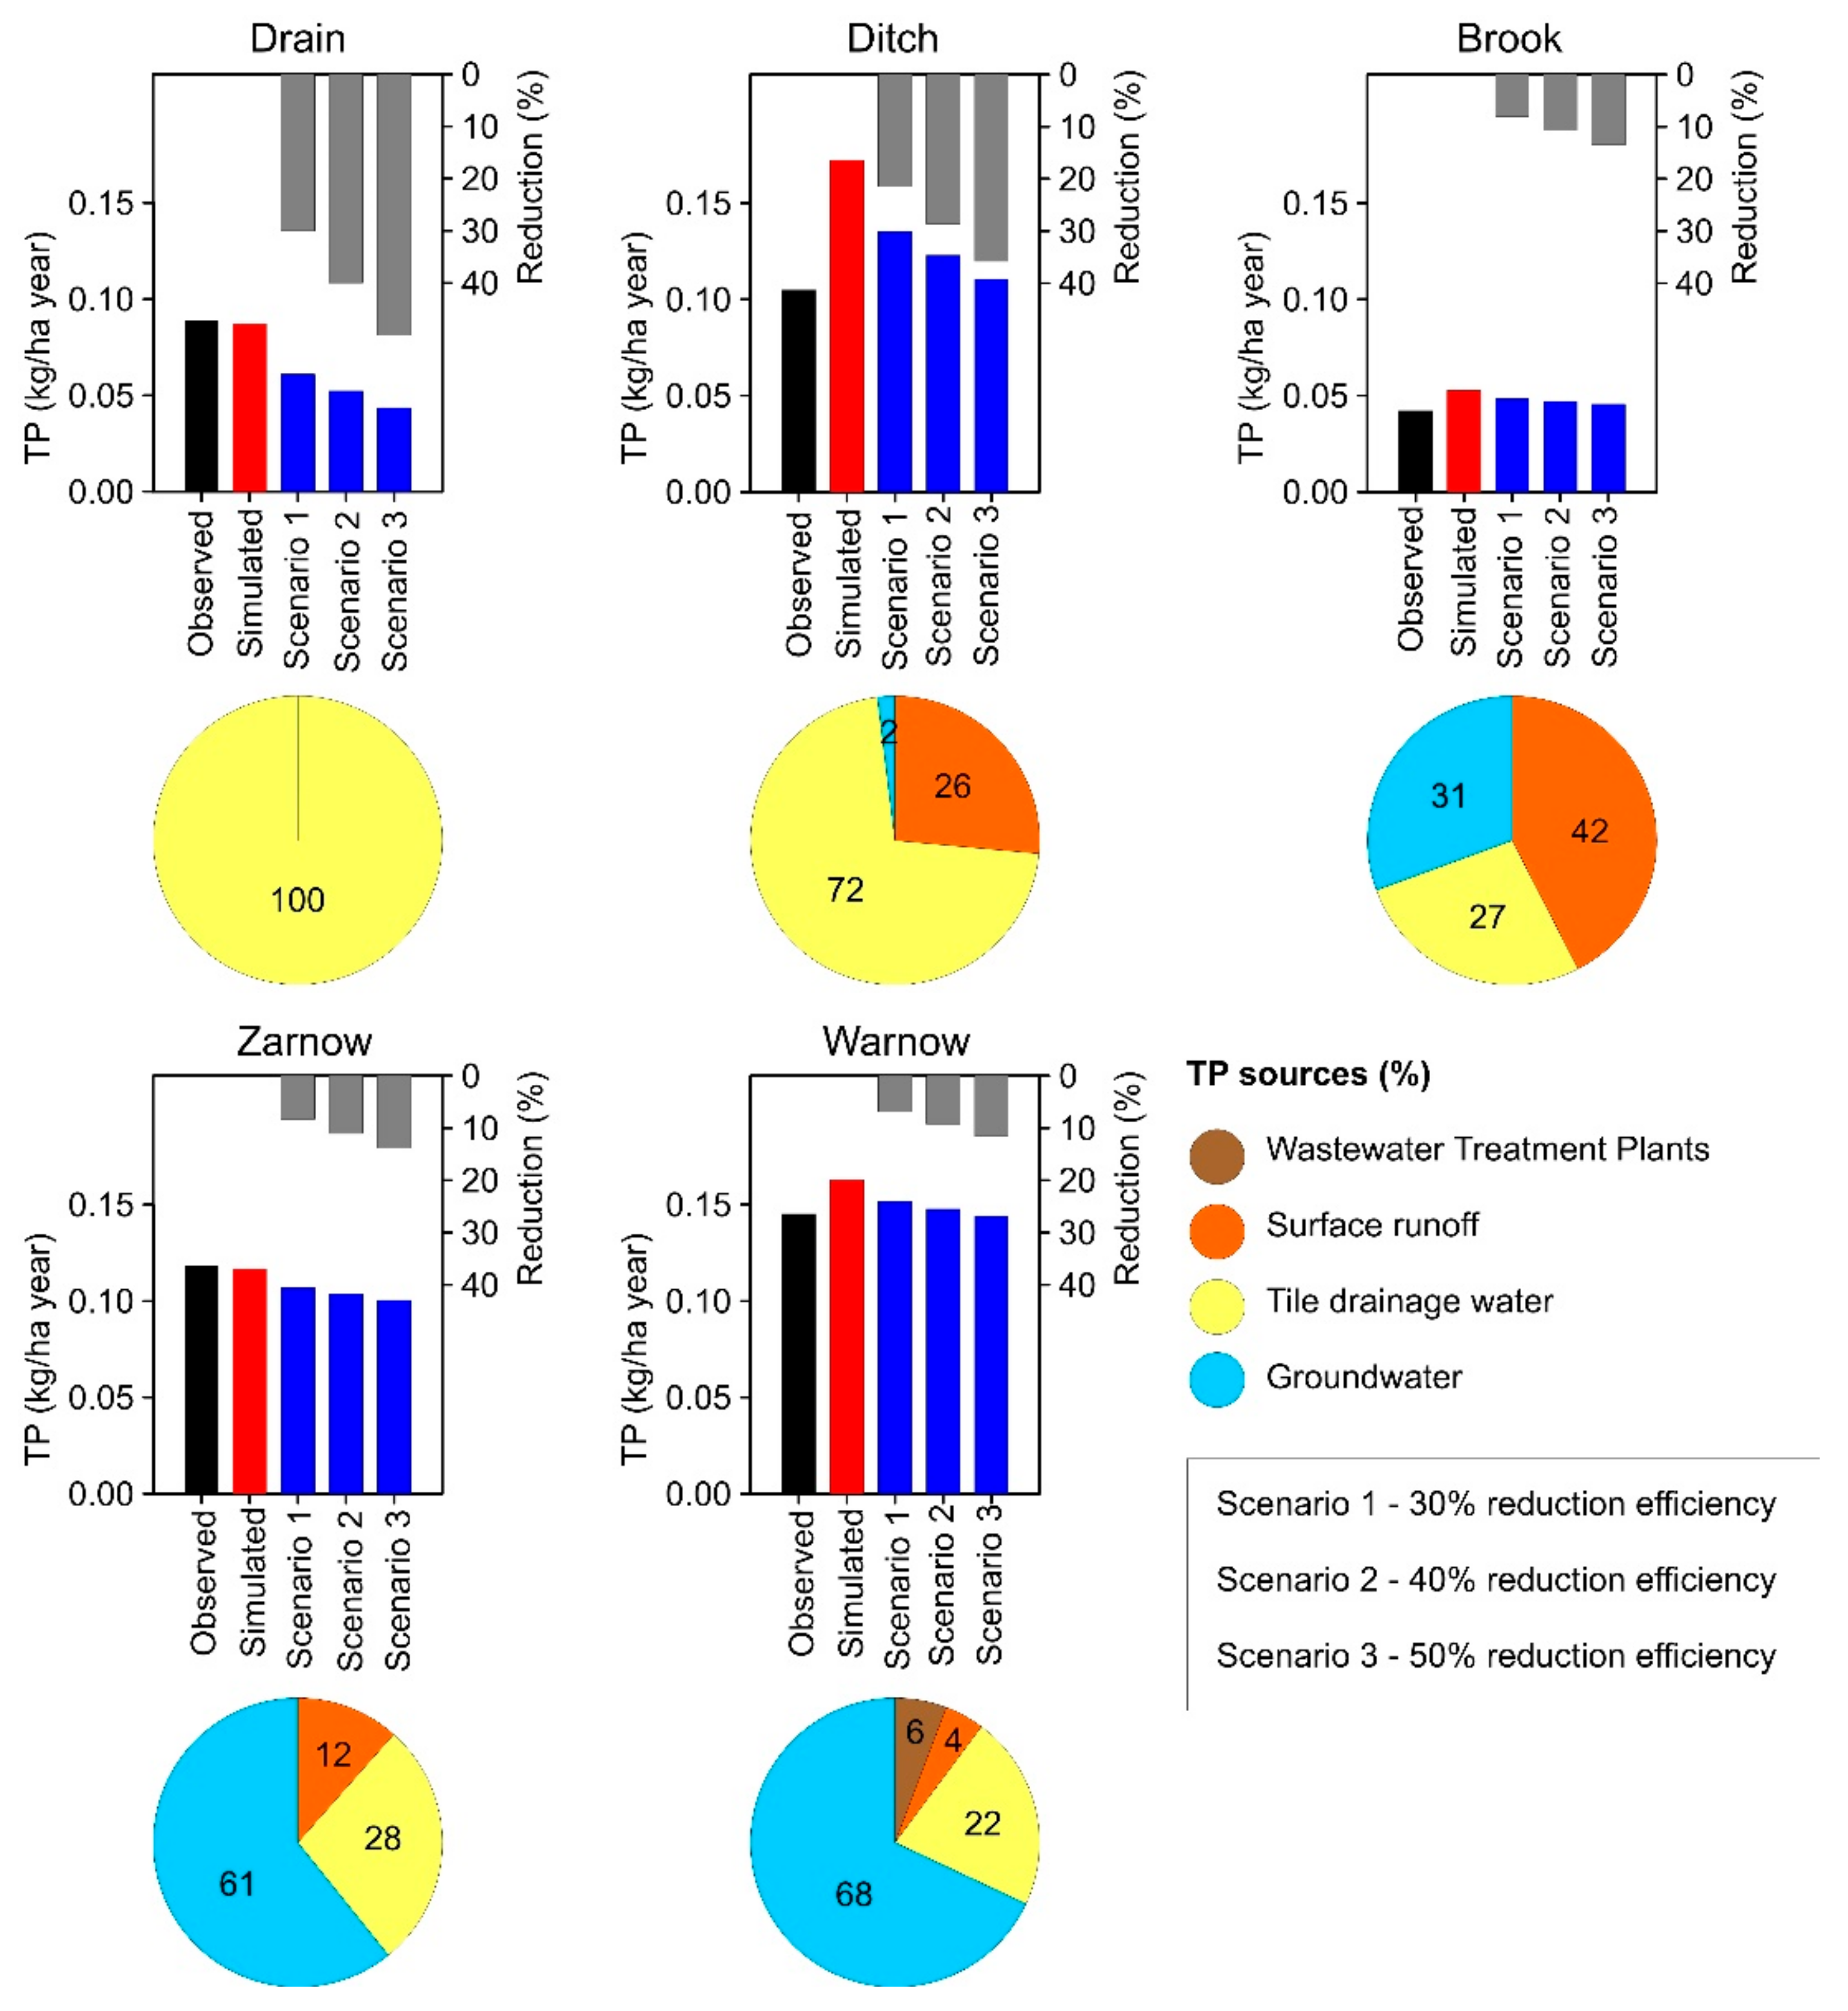
TP loads at the different spatial scales were generally reproduced well by the model (Figure 7). Annual measured and simulated TP loads accounted for 0.09 kg/ha for the Drainage plot. Annual measured TP loads for the Ditch catchment were slightly higher. For this catchment, the model clearly overestimated the annual TP loads. Annual TP loads were lowest for the Brook catchment and modeled loads (0.05 kg/ha) were similar to measured values (0.04 kg/ha). Measured annual TP loads at the Zarnow and Warnow catchment outlets accounted for 0.12 kg/ha and 0.15 kg/ha, respectively, and the modeled values nearly matched the measured ones (Figure 7). While the TP loads for the Drainage plot, Ditch, Zarnow and Warnow catchment ranged from 0.09 to 0.15 kg/ha, it is striking that they were considerably lower in the Brook catchment (0.04 kg/ha). The differences of the TP loads can be attributed to a different discharge behavior. Assuming similar TP concentrations (Figure 4), TP loads are controlled by discharge. Mean annual discharge in the Brook catchment was much lower (65 mm) compared to the other catchments (from 100 to 156 mm) (Table 1), which resulted in comparably low TP loads. At the other end of the spectrum, discharge was highest at the Warnow river basin outlet (156 mm). Together with relatively high TP concentrations (mean value 0.1 mg/L), TP loads were correspondingly higher.
The TP sources differed between the catchments (Figure 7). While TP completely originated from tile drainage water at the Drainage plot, the proportion of drainage water on the overall TP load decreased with increasing catchment size. Instead, other sources come to the fore. For example, the proportion of TP originating from groundwater increased from 2% in the Ditch catchment to 68% for the entire Warnow river basin. The proportion of TP transported via surface runoff was highly variable between the catchments and reached highest values in the Brook catchment (42%), whereas TP from surface runoff played only a minor role for the entire Warnow river basin (4%). Due to the relatively flat topography of the Warnow river basin, this low value seems reasonable, while the model probably overestimated the TP loads transported by surface runoff in the Brook catchment.
The different proportions of TP sources had implications on the removal efficiency of P filters at catchment scale. Apparently, the effect of P filters on TP loads was clearly dependent on the extent of tile-drained areas in the respective catchments (Figure 7). The TP reduction at the Drainage plot was identical with the P removal efficiency of the three filter configurations. That means that, depending on the filter, 30% to 50% TP could be removed here. TP removal for the Ditch catchment was also high, because 72% of TP load in the Ditch originated from tile drainage water. For this catchment, TP loads could be reduced between 21% and 36%. TP reduction for the other three catchments were similar and ranged between 7% and 14%.
The results indicate that under the most optimistic scenario, meaning that all tile-drained areas in the Warnow river basin are equipped with P filters and achieve a P removal efficiency of 50%, a total of 5.7 t TP/year could be retained. This reduction is still less than half of what would be required according to targets of the Baltic Sea Action Plan ([18]; estimated reduction for the Warnow river basin = ca. 13 t TP/year). Considering the economic costs for the filter box installation and manpower for maintenance of the filters, it is hard to believe that the calculated reductions will be achieved in practice. However, the scenario calculations reveal the theoretical potential of P filters in tile-drained areas that can help practitioners to evaluate the optimal setup of different P reduction measures in a catchment. Future research should focus on long-term field studies to optimize the removal efficiency of P filters. P filters should be tested with different filter configurations and materials over longer periods of time capturing varying hydro-climatic conditions to obtain best technical solutions considering the particular characteristics of individual drainage plots.
4. Conclusions
The two-year analysis in five nested catchments in northeastern Germany revealed generally low DRP and TP concentrations. Increased DRP and TP concentrations above target values, probably caused by DRP release from river sediments, were observed in summer in all catchments except at the field scale (Drainage plot). Here, extraordinary high DRP and TP concentrations were triggered by hydrological events. The experimental observations showed clearly that the official monitoring programs need to be adjusted to capture extreme concentration values at high and low flows and to correctly calculate P loads.
The filter box equipped with iron-coated sand was able to reduce substantially losses of particulate P but failed to retain dissolved P fractions such as DRP. Reasons for the limited removal efficiency of dissolved P were the overall low DRP concentrations, short residence times of water in the filter during high flow periods, and highly dynamic flow rates.
The model analysis revealed that the reduction potential of P filters is highest in areas, in which drainage water is the dominant P source such as tile-drained fields. When the catchments get larger, more P sources such as groundwater, surface runoff or point sources become important. In the Warnow river basin with its outlet at the Baltic Sea coastline, P filters in tile-drained fields can only be one part of an integrated catchment strategy involving a suite of measures to achieve the targets according to the EU Water Framework Directive and Baltic Sea Action Plan.
Author Contributions
Conceptualization, A.B.; Data curation, P.K.; Formal analysis, A.B.; Investigation, P.K.; Methodology, A.B. and P.K.; Project administration, B.L.; Validation, B.L.; Writing—original draft, A.B. and P.K.; Writing—review & editing, B.L.
Funding
The authors gratefully acknowledge the European Union for funding the Interreg-project NuReDrain (grant number 38-2-17-16) and the German Federal Ministry of Education and Research (BMBF) for funding the BonaRes research project InnoSoilPhos (No. 031A558).
Acknowledgments
We would like to thank the State Office for Environment, Nature Conservation and Geology Mecklenburg-Western Pomerania for the provision of maps and data (discharge, DRP, TP) for the Warnow river basin and the Zarnow catchment. In addition, we are grateful for Tilo Hartwig’s extensive fieldwork of and Evelyn Bolzmann’s P laboratory analysis. The laboratory analysis of the iron-coated sand conducted by Simone Tränckner is highly appreciated.
Conflicts of Interest
The authors declare no conflict of interest.
References
- Sharpley, A.N.; Bergström, L.; Aronsson, H.; Bechmann, M.; Bolster, C.H.; Börling, K.; Djodjic, F.; Jarvie, H.P.; Schoumans, O.F.; Stamm, C.; et al. Future agriculture with minimized phosphorus losses to waters: Research needs and direction. Ambio 2015, 44 (Suppl. 2), 163–179. [Google Scholar] [CrossRef] [PubMed] [Green Version]
- Sims, J.T.; Simard, R.R.; Joern, B.C. Phosphorus loss in agricultural drainage: Historical perspective and current research. J. Environ. Qual. 1998, 27, 277–293. [Google Scholar] [CrossRef] [Green Version]
- UBA (Umweltbundesamt). Gewässer in Deutschland: Zustand und Bewertung; UBA: Dessau-Roßlau, Germany, 2017. [Google Scholar]
- UBA (Umweltbundesamt). Die Wasserrahmenrichtlinie–Deutschlands Gewässer 2015; UBA: Dessau-Roßlau, Germany, 2016. [Google Scholar]
- Gentry, L.E.; David, M.B.; Royer, T.V.; Mitchell, C.A.; Starks, K.M. Phosphorus transport pathways to streams in tile-drained agricultural watersheds. J. Environ. Qual. 2007, 36, 408–415. [Google Scholar] [CrossRef] [PubMed] [Green Version]
- Fuchs, S.; Weber, T.; Wander, R.; Toshovski, S.; Kittlaus, S.; Reid, L.; Bach, M.; Klement, L.; Hillenbrand, T.; Tettenborn, F. Effizienz von Maßnahmen zur Reduktion von Stoffeinträgen–Endbericht; Texte 05/2017; Im Auftrag des Umweltbundesamtes: Dessau-Roßlau, Germany, 2017. [Google Scholar]
- Carpenter, S.R.; Caraco, N.F.; Correl, D.L.; Howarth, R.W.; Sharpley, A.N.; Smith, V.H. Nonpoint pollution of surface waters with phosphorus and nitrogen. Ecol. Appl. 1998, 8, 559–568. [Google Scholar] [CrossRef]
- King, K.W.; Williams, M.R.; Johnson, L.T.; Smith, D.R.; LaBarge, G.A.; Fausey, N.R. Phosphorus availability in Western Lake Erie Basin drainage waters: Legacy evidence across spatial scales. J. Environ. Qual. 2017, 46, 466–469. [Google Scholar] [CrossRef]
- Blann, K.L.; Anderson, J.L.; Sands, G.R.; Vondracek, B. Effects of agricultural drainage on aquatic ecosystems–A review. Crit. Rev. Environ. Sci. Technol. 2009, 39, 909–1001. [Google Scholar] [CrossRef]
- Heathwaite, A.L.; Dils, R.M. Characterising phosphorus loss in surface and subsurface hydrological pathways. Sci. Total Environ. 2000, 251, 523–538. [Google Scholar] [CrossRef]
- Salvia-Castellvi, M.; Iffly, J.F.; Borght, P.V.; Hoffmann, L. Dissolved and particulate nutrient export from rural catchments: A case study from Luxembourg. Sci. Total Environ. 2005, 344, 51–65. [Google Scholar] [CrossRef]
- Jordan, T.E.; Correl, D.L.; Weller, D.E. Relating nurient discharges from watersheds to land use and stream flow variability. Water Resour. Res. 1997, 33, 2579–2590. [Google Scholar] [CrossRef]
- Zhang, T.Q.; Tan, C.S.; Zheng, Z.M.; Drury, C.F. Tile drainage phosphorus loss with long-term consistent cropping systems and fertilization. J. Environ. Qual. 2015, 44, 503–511. [Google Scholar] [CrossRef]
- Lemke, A.M.; Kirkham, K.G.; Lindenbaum, T.T.; Herbert, M.E.; Tear, T.H.; Perry, W.L.; Herkert, J.R. Evaluating Agricultural Best Management Practices in Tile-Drained Subwatersheds of the Mackinaw River, Illinois. J. Environ. Qual. 2011, 40, 1215–1228. [Google Scholar] [CrossRef] [PubMed]
- Macrae, M.L.; English, M.C.; Schiff, S.L.; Stone, M. Intra-annual variability in the contribution of tile drains to basin discharge and phosphorus export in a first-order agricultural catchment. Agric. Water Manag. 2007, 92, 171–182. [Google Scholar] [CrossRef]
- Tiemeyer, B.; Kahle, P.; Lennartz, B. Phosphorus losses from an artificially drained rural lowland catchment in North-Eastern Germany. Agric. Water Manag. 2009, 96, 677–690. [Google Scholar] [CrossRef]
- Kronvang, B.; Vagstad, N.; Behrendt, H.; Bøgestrand, J.; Larsen, S.E. Phosphorus losses at the catchment scale within Europe: An overview. Soil Use Manag. 2007, 23 (Suppl. 1), 104–116. [Google Scholar] [CrossRef]
- HELCOM (Baltic Marine Environment Protection Commission). Summary report on the Development of Revised Maximum Allowable Inputs (MAI) and updated Country Allocated Reduction Targets (CART) of the Baltic Sea Action Plan; HELCOM: Kopenhagen, Dänemark, 2013. [Google Scholar]
- Schoumans, O.F.; Chardon, W.J.; Bechmann, M.E.; Gascuel-Odoux, C.; Hofman, G.; Kronvang, B.; Rubæk, G.H.; Ulén, B.; Dorioz, J.-M. Mitigation options to reduce phosphorus losses from the agricultural sector and improve surface water quality: A review. Sci. Total Environ. 2014, 468, 1255–1266. [Google Scholar] [CrossRef]
- Buda, A.R.; Koopmans, G.F.; Bryant, R.B.; Chardon, W.J. Emerging technologies for removing nonpoint phosphorus from surface water and groundwater: Introduction. J. Environ. Qual. 2012, 41, 621–627. [Google Scholar] [CrossRef] [Green Version]
- Kjærgaard, C.; Heckrath, G.J.; Canga, E.; Pugliese, L.; Iversen, B.V. Drainage filter technologies to mitigate site-specific phosphorus losses in agricultural drainage discharge. In Proceedings of the Abstract from ASA, CSSA and SSSA International Annual Meeting, Minneapolis, MN, USA, 15–18 November 2015. [Google Scholar]
- Vandermoere, S.; Ralaizafisoloarivony, N.A.; Van Ranst, E.; De Neve, S. Reducing phosphorus (P) losses from drained agricultural fields with iron coated sand (-glauconite) filters. Water Res. 2018, 141, 329–339. [Google Scholar] [CrossRef]
- Pfannerstill, M.; Hugenschmidt, C.; Trepel, M.; Fohrer, N. Reaktive Grabensysteme zur Reduktion des diffusen Stickstoffeintrags aus drainierten landwirtschaftlichen Flächen. Hydrol. Wasserbewirtsch. 2012, 56, 203–214. [Google Scholar] [CrossRef]
- Arnold, J.G.; Srinivasan, R.; Muttiah, R.S.; Williams, J.R. Large area hydrologic modeling and assessment part I: Model development. J. Am. Water Resour. Assoc. 1998, 34, 73–89. [Google Scholar] [CrossRef]
- Tiemeyer, B.; Kahle, P.; Lennartz, B. Nutrient losses from artificial drained catchments in North-Eastern Germany at different scales. Agric. Water Manag. 2006, 85, 47–57. [Google Scholar] [CrossRef]
- VDLUFA. Handbuch der Landwirtschaftlichen Versuchs-und Untersuchungsmethodik; Bd. 1, 4. Auflage; VDLUFA: Darmstadt, Germany, 1997. (In German) [Google Scholar]
- Bauwe, A.; Eckhardt, K.-U.; Lennartz, B. Predicting dissolved reactive phosphorus in tile-drained catchments using a modified SWAT model. Ecohydrol. Hydrobiol. 2019, 19, 198–209. [Google Scholar] [CrossRef]
- Koch, S.; Kahle, P.; Lennartz, B. Spatio-temporal analysis of phosphorus concentrations in a North-Eastern German lowland watershed. J. Hydrol. Reg. Stud. 2018, 15, 203–216. [Google Scholar] [CrossRef]
- OGewV (Oberflächengewässerverodnung). Verordnung Zum Schutz der Oberflächengewässer. Available online: https://www.gesetze-im-internet.de/ogewv_2016/OGewV.pdf (accessed on 13 October 2019).
- Zimmer, D.; Kahle, P.; Baum, C. Loss of soil phosphorus by tile drains during storm events. Agric. Water Manag. 2016, 167, 21–28. [Google Scholar] [CrossRef]
- Bitschofsky, F.; Nausch, M. Spatial and seasonal variations in phosphorus speciation along a river in a lowland catchment (Warnow, Germany). Sci. Total Environ. 2019, 657, 671–685. [Google Scholar] [CrossRef] [PubMed]
- Bowes, M.J.; House, W.A.; Hodgkinson, R.A. Phosphorus dynamics along a river continuum. Sci. Total Environ. 2003, 313, 199–212. [Google Scholar] [CrossRef]
- Abbott, B.W.; Moatar, F.; Gauthier, O.; Fovet, O.; Antoine, V.; Ragueneau, O. Trends and seasonality of river nutrients in agricultural catchments: 18 years of weekly citizen science in France. Sci. Total Environ. 2018, 624, 845–858. [Google Scholar] [CrossRef]
- Kirkkala, T.; Ventelä, A.-M.; Tarvainen, M. Long-term field-scale experiment on using lime filters in an agricultural catchment. J. Environ. Qual. 2012, 41, 410–419. [Google Scholar] [CrossRef] [Green Version]
- Penn, C.; Chagas, I.; Klimeski, A.; Lyngsie, G. A review of phosphorus removal structures: How to assess and compare their performance. Water 2017, 9, 583. [Google Scholar] [CrossRef]
- Penn, C.J.; Bryant, R.B.; Kleimann, P.J.A.; Allen, A.L. Removing dissolved phosphorus from drainage ditch water with phosphorus sorbing materials. J. Soil Water Conserv. 2007, 62, 269–276. [Google Scholar]
- Klimeski, A.; Uusitalo, R.; Turtola, E. Variations in phosphorus retention by a solid material while scaling up its application. Environ. Technol. Innov. 2015, 4, 285–298. [Google Scholar] [CrossRef]
Figure 1.
Study area.

Figure 2.
Schematic illustration of the P filter box. ICS is iron-coated sand.

Figure 3.
Extent of tile-drained areas (red) in the Warnow river basin, Zarnow, Brook and Ditch catchment, and the Drainage plot.
Figure 3.
Extent of tile-drained areas (red) in the Warnow river basin, Zarnow, Brook and Ditch catchment, and the Drainage plot.

Figure 4.
Discharge (blue lines), Dissolved Reactive Phosphorus (DRP), and Total Phosphorus (TP) concentrations (red dots) for different spatial scales from 1 January 2016 to 31 December 2017. The green areas indicate the good ecological status for DRP (0.07 mg/L) and TP (0.1 mg/L) according to German legislation [29].

Figure 5.
Tile drainage flow, precipitation, Dissolved Reactive Phosphorus (DRP) and Total Phosphorus (TP) concentrations at the inlet (red) and outlet (black) of the filter box from 1 January to 30 April 2018. The green areas indicate the good ecological status for DRP (0.07 mg/L) and TP (0.1 mg/L) according to German legislation [29].

Figure 6.
Concentrations of Dissolved Reactive Phosphorus (DRP) (left) and Total Phosphorus (TP) (right) at the inlet and outlet of the filter box from 1 January to 30 April 2018 including a linear fitted line (blue).
Figure 6.
Concentrations of Dissolved Reactive Phosphorus (DRP) (left) and Total Phosphorus (TP) (right) at the inlet and outlet of the filter box from 1 January to 30 April 2018 including a linear fitted line (blue).

Figure 7.
Phosphorus removal for the different spatial catchment scales. The pie charts indicate Total Phosphorus (TP) sources. The bar plots indicate observed and modeled area-weighted TP loads and the TP reduction efficiency of three different filter configurations.
Figure 7.
Phosphorus removal for the different spatial catchment scales. The pie charts indicate Total Phosphorus (TP) sources. The bar plots indicate observed and modeled area-weighted TP loads and the TP reduction efficiency of three different filter configurations.


Table 1.
Characteristics of the investigated catchments.
| Catchment | Size (ha) | Discharge (mm/year) | Tile-Drained Area (%) | Arable Land (%) | Grassland (%) | Forest (%) | Rest (%) |
|---|---|---|---|---|---|---|---|
| Warnow | 304,140 | 156 | 18 | 58 | 13 | 21 | 8 |
| Zarnow | 4960 | 100 | 13 | 57 | 31 | 9 | 3 |
| Brook | 1620 | 65 | 11 | 54 | 31 | 12 | 3 |
| Ditch | 181 | 118 | 94 | 94 | 0 | 6 | 0 |
| Drainage plot | 4.2 | 129 | 100 | 100 | 0 | 0 | 0 |
© 2019 by the authors. Licensee MDPI, Basel, Switzerland. This article is an open access article distributed under the terms and conditions of the Creative Commons Attribution (CC BY) license (http://creativecommons.org/licenses/by/4.0/).
Share and Cite
MDPI and ACS Style
Bauwe, A.; Kahle, P.; Lennartz, B. Impact of Filters to Reduce Phosphorus Losses: Field Observations and Modelling Tests in Tile-Drained Lowland Catchments. Water 2019, 11, 2638. https://doi.org/10.3390/w11122638
AMA Style
Bauwe A, Kahle P, Lennartz B. Impact of Filters to Reduce Phosphorus Losses: Field Observations and Modelling Tests in Tile-Drained Lowland Catchments. Water. 2019; 11(12):2638. https://doi.org/10.3390/w11122638
Chicago/Turabian StyleBauwe, Andreas, Petra Kahle, and Bernd Lennartz. 2019. "Impact of Filters to Reduce Phosphorus Losses: Field Observations and Modelling Tests in Tile-Drained Lowland Catchments" Water 11, no. 12: 2638. https://doi.org/10.3390/w11122638
Note that from the first issue of 2016, this journal uses article numbers instead of page numbers. See further details here.