Hydro-Meteorological Characterization of Major Floods in Spanish Mountain Rivers

 ,
,  , , ,
, , ,
Abstract
:
1. Introduction
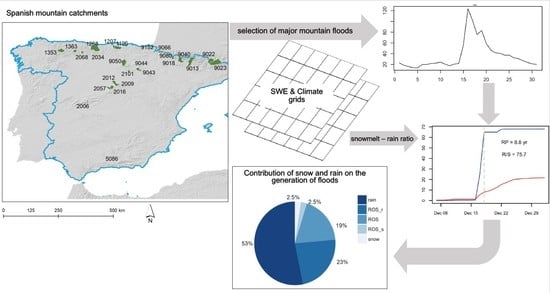
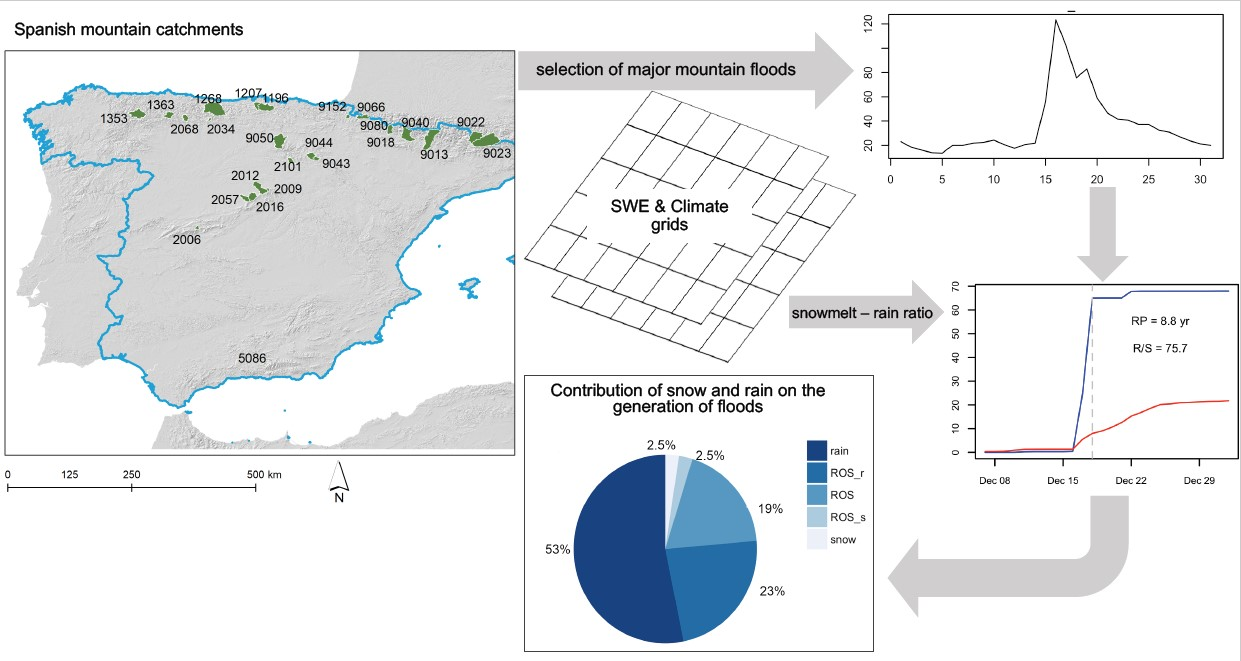
2. Methods
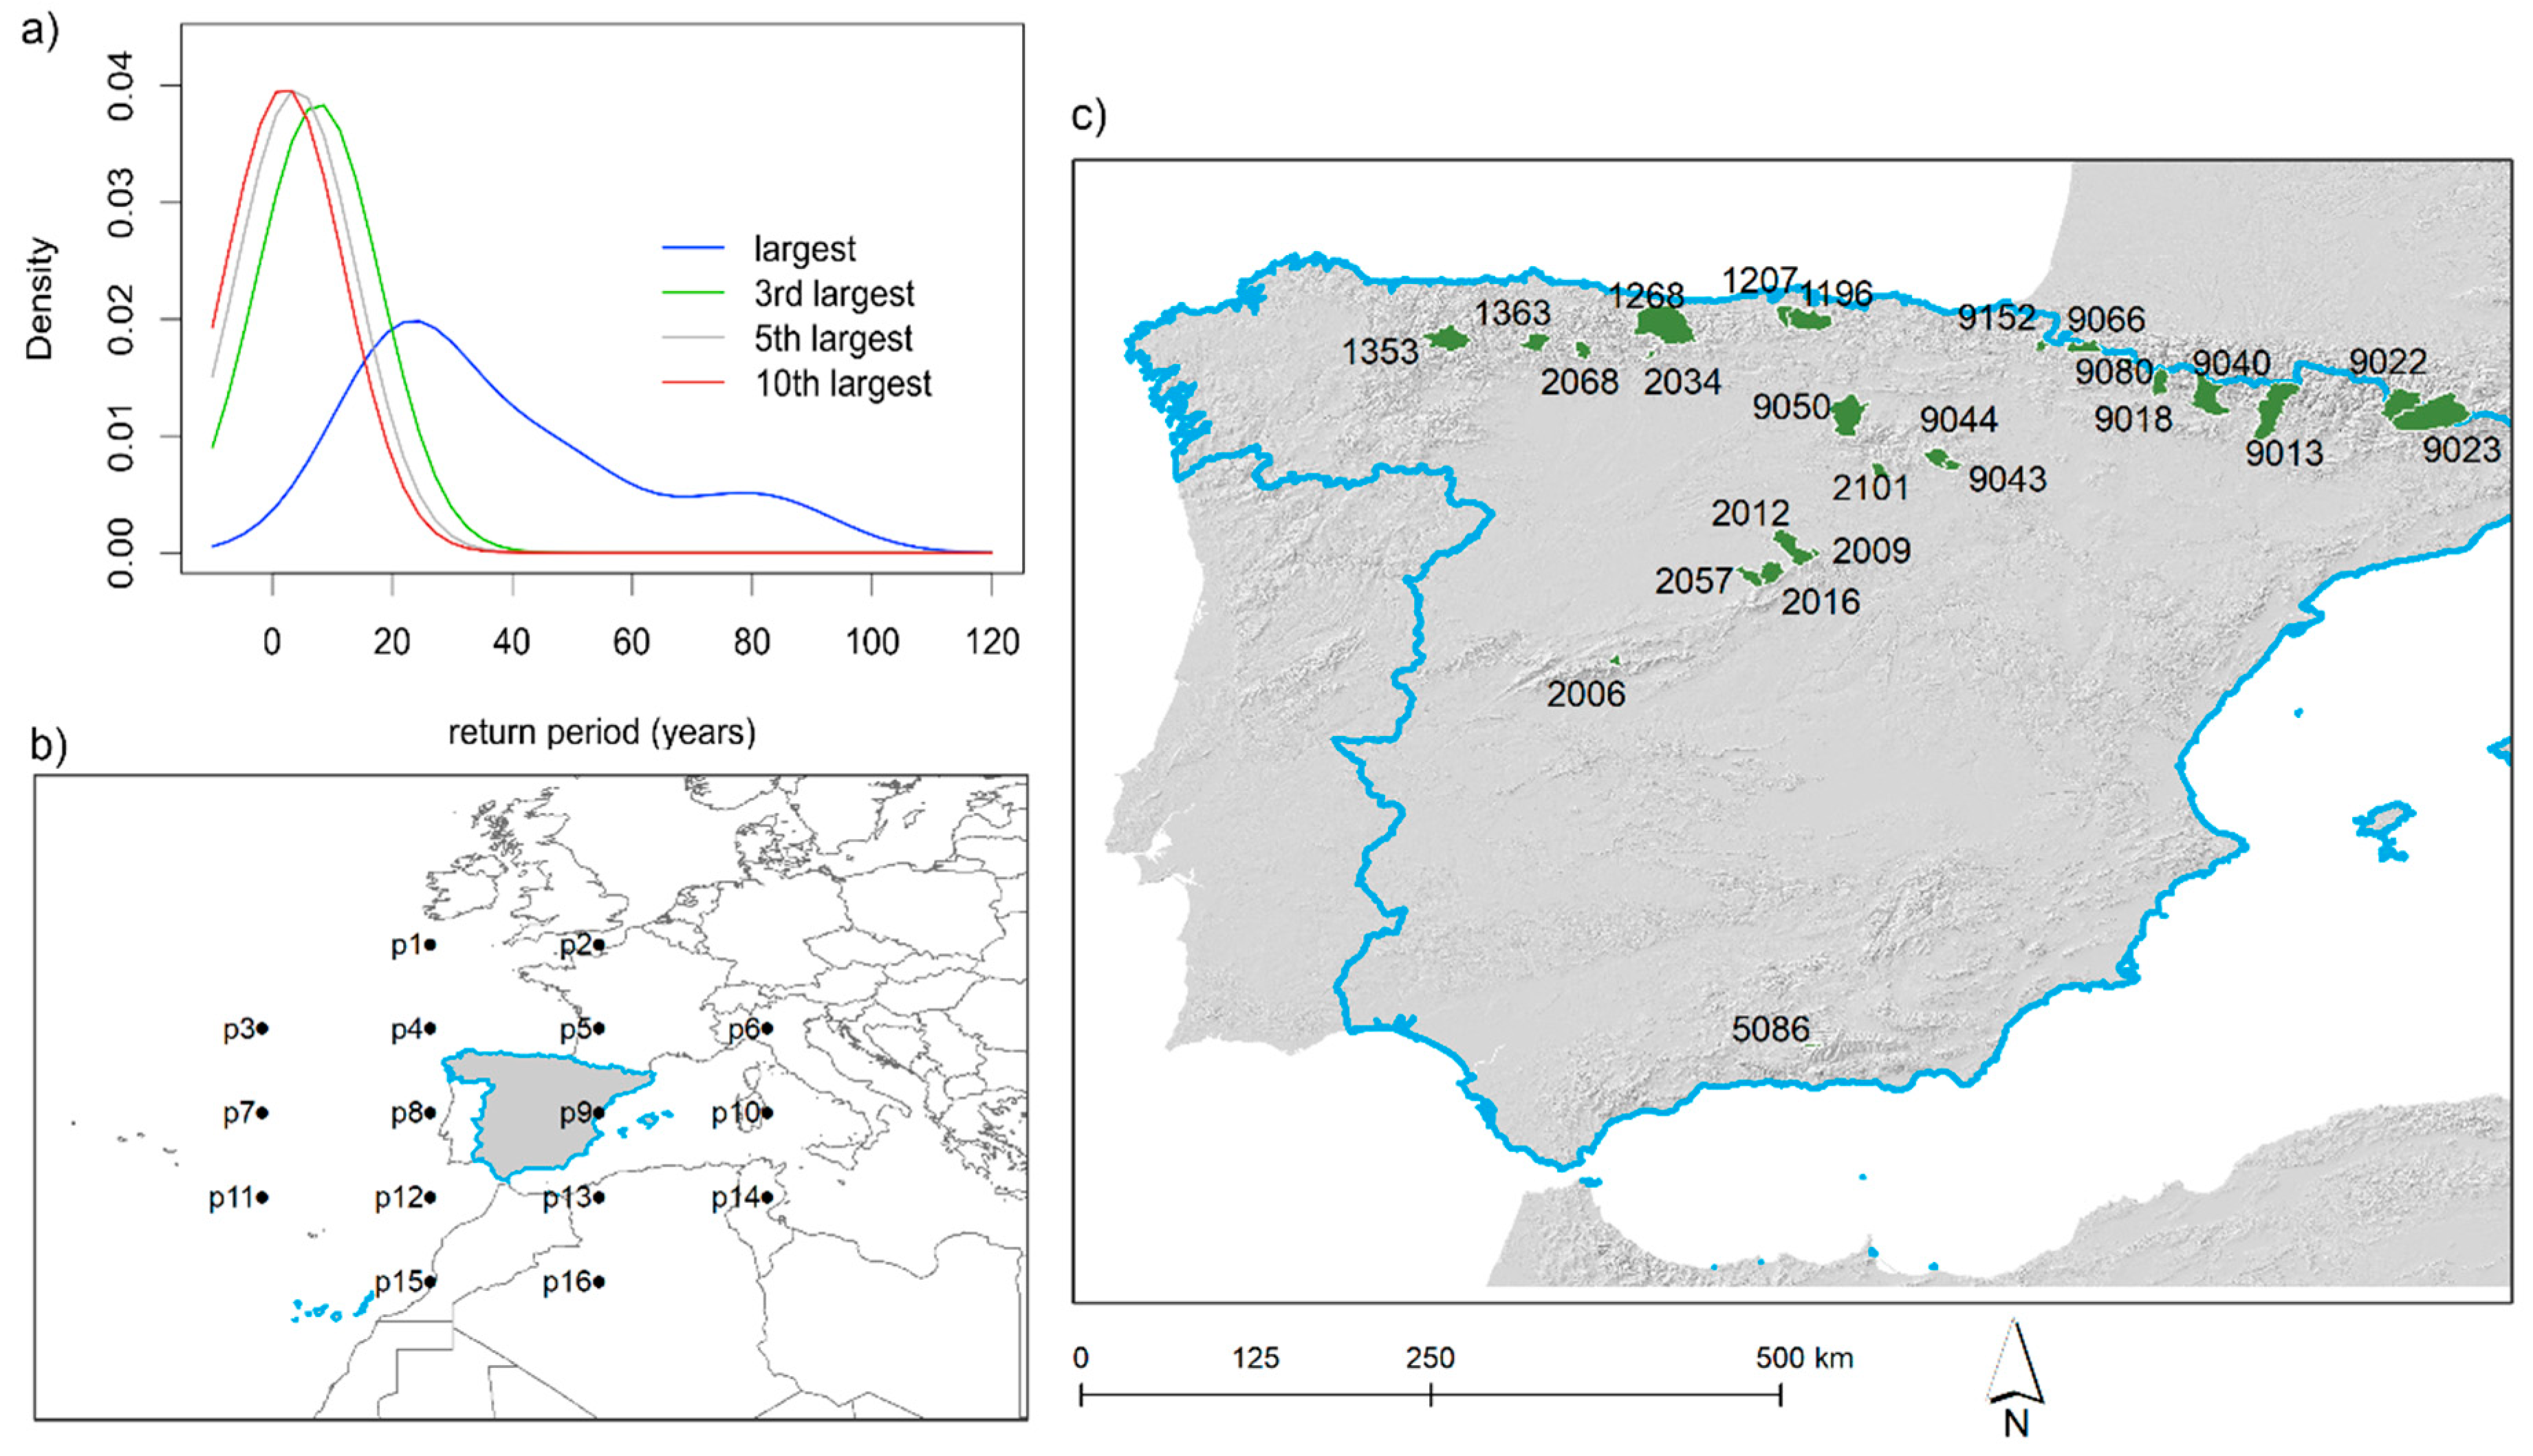
2.1. Data
2.2. Data Processing and Analysis
2.3. Weather Types
- Flow direction is given by , results in sexagesimal degrees. 180° were added if WF > 0. The corresponding direction (N, NE, E, SE, S, SW, W, NW) is then computed using an eight-point compass, allowing 45° per sector.
- If , flow is essentially straight and weather type can be considered as advective or pure directional type (eight different cases according to the compass directions).
- If , the weather type is considered as pure cyclonic when , and pure anticyclonic when .
- If , the flow is considered to be a hybrid type, characterized by both direction (rule 1) and circulation (rule 3) (8 × 2 different types).
3. Results
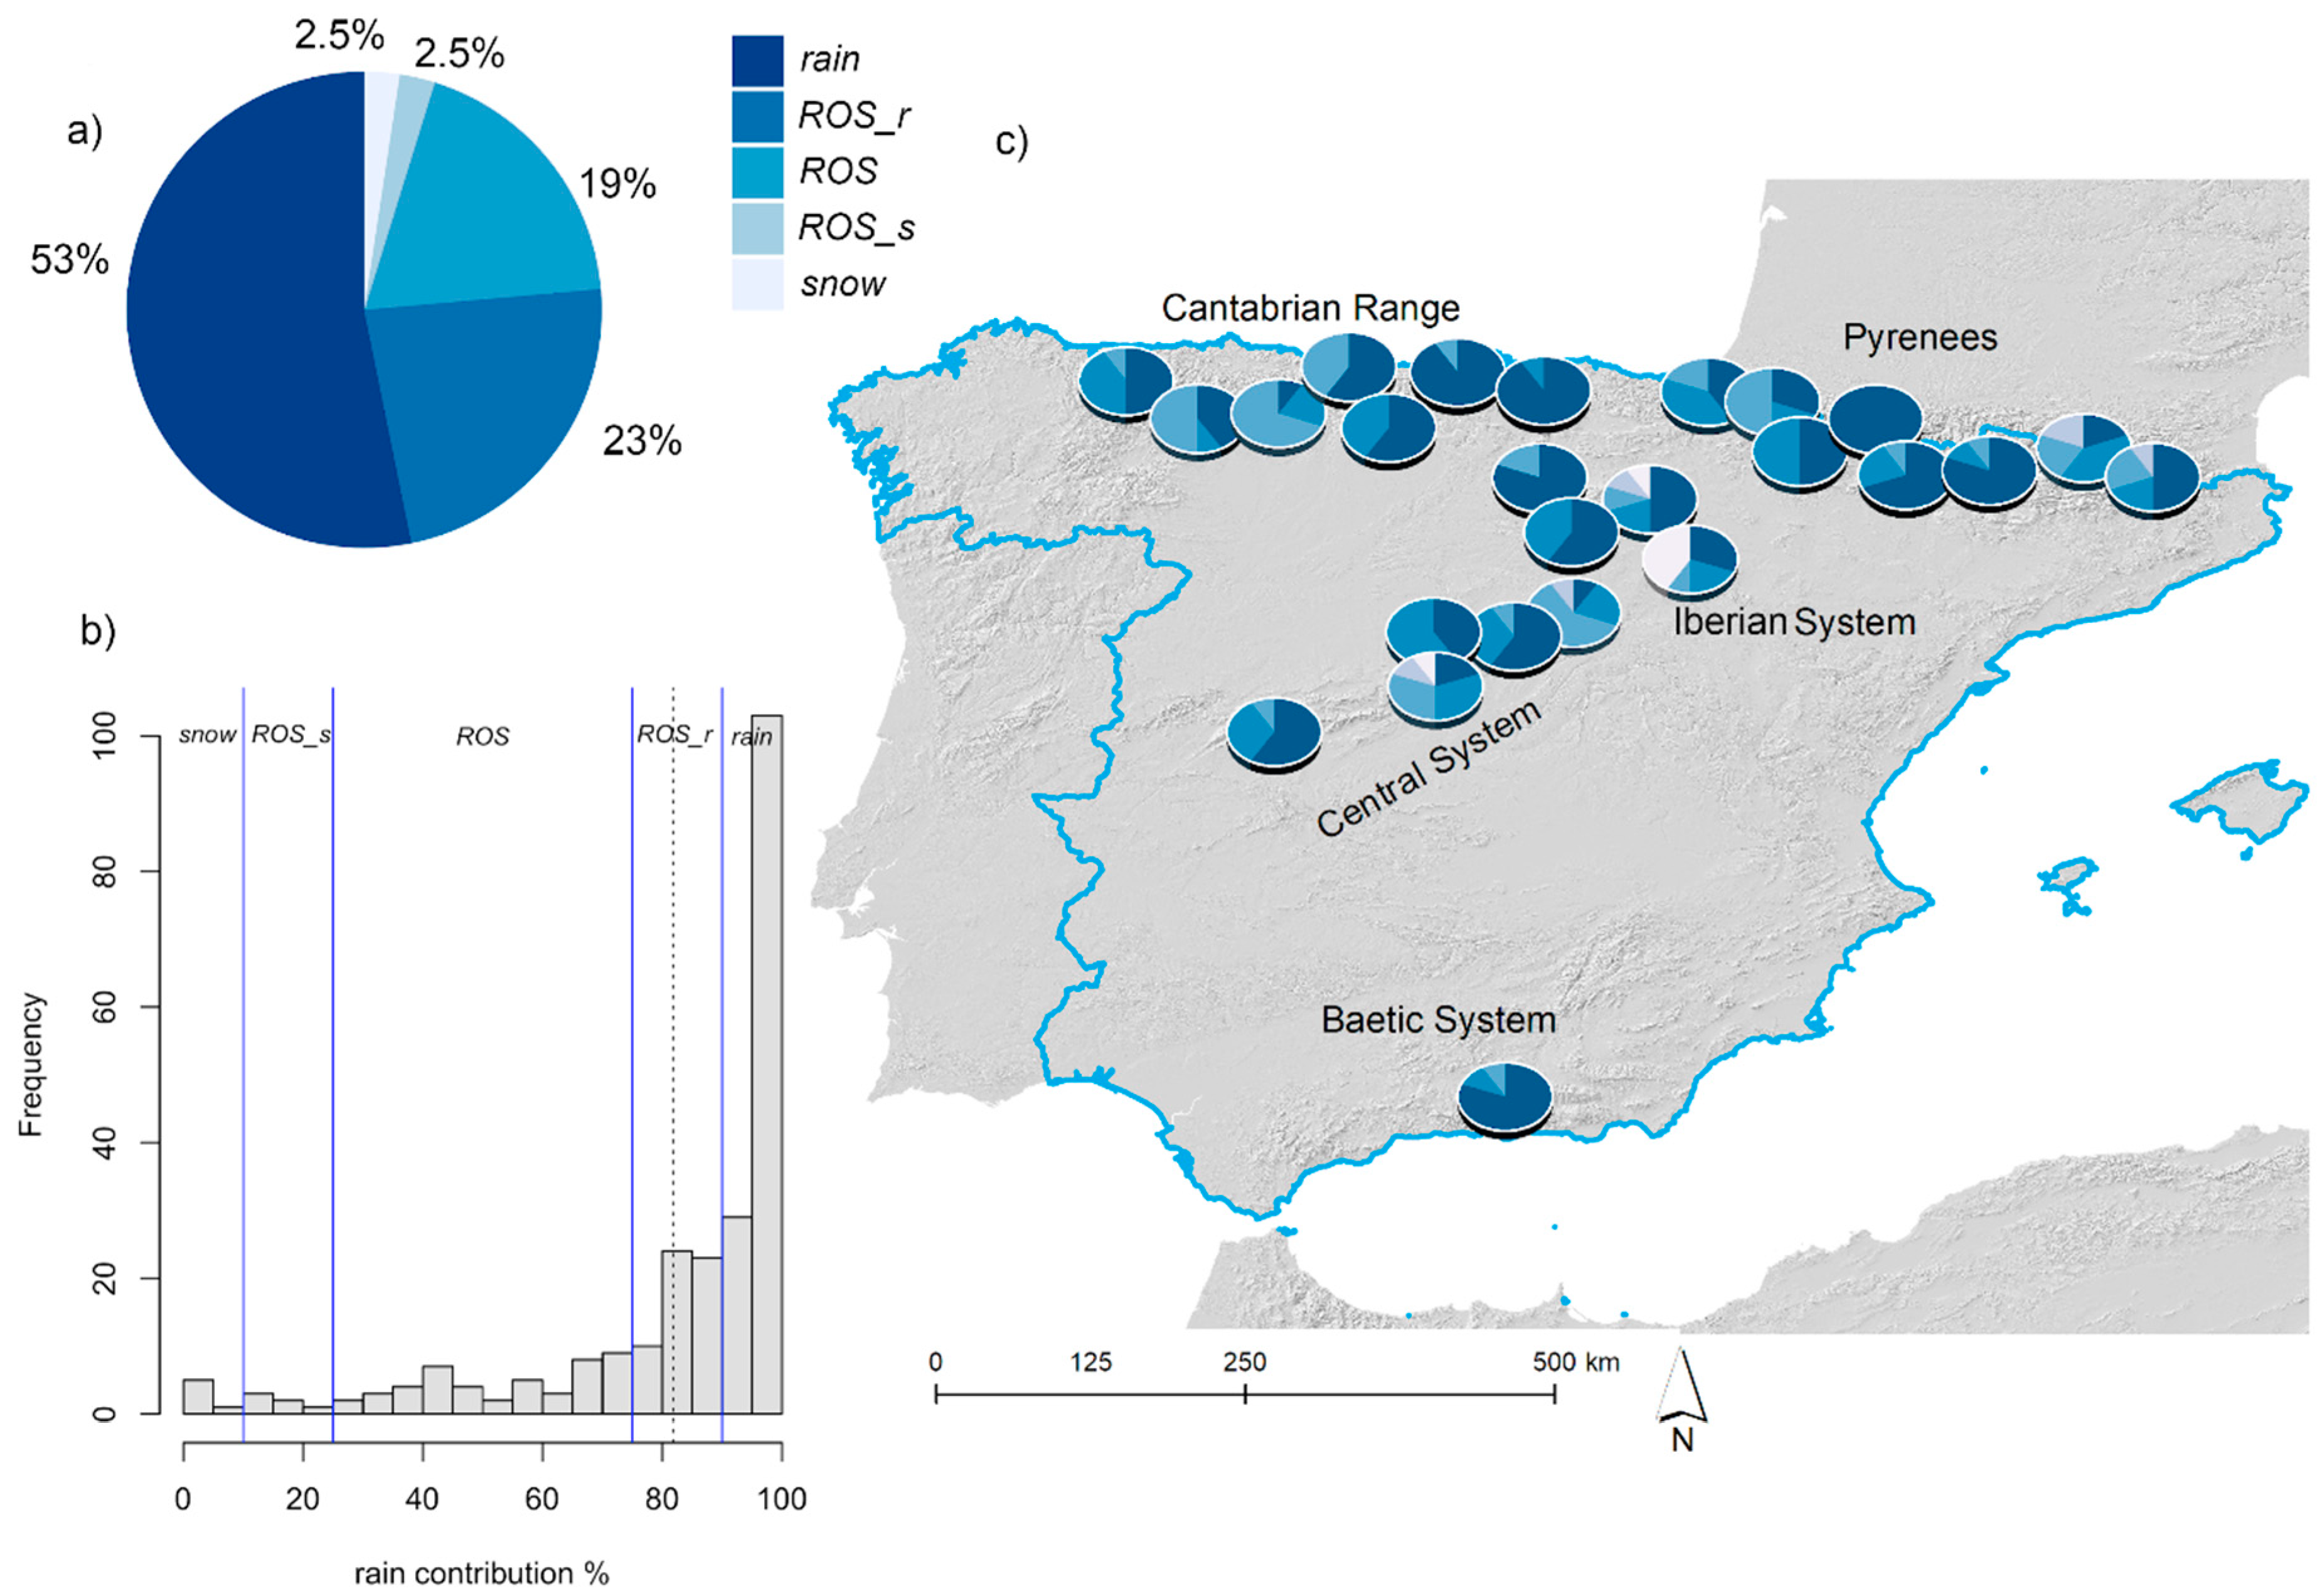
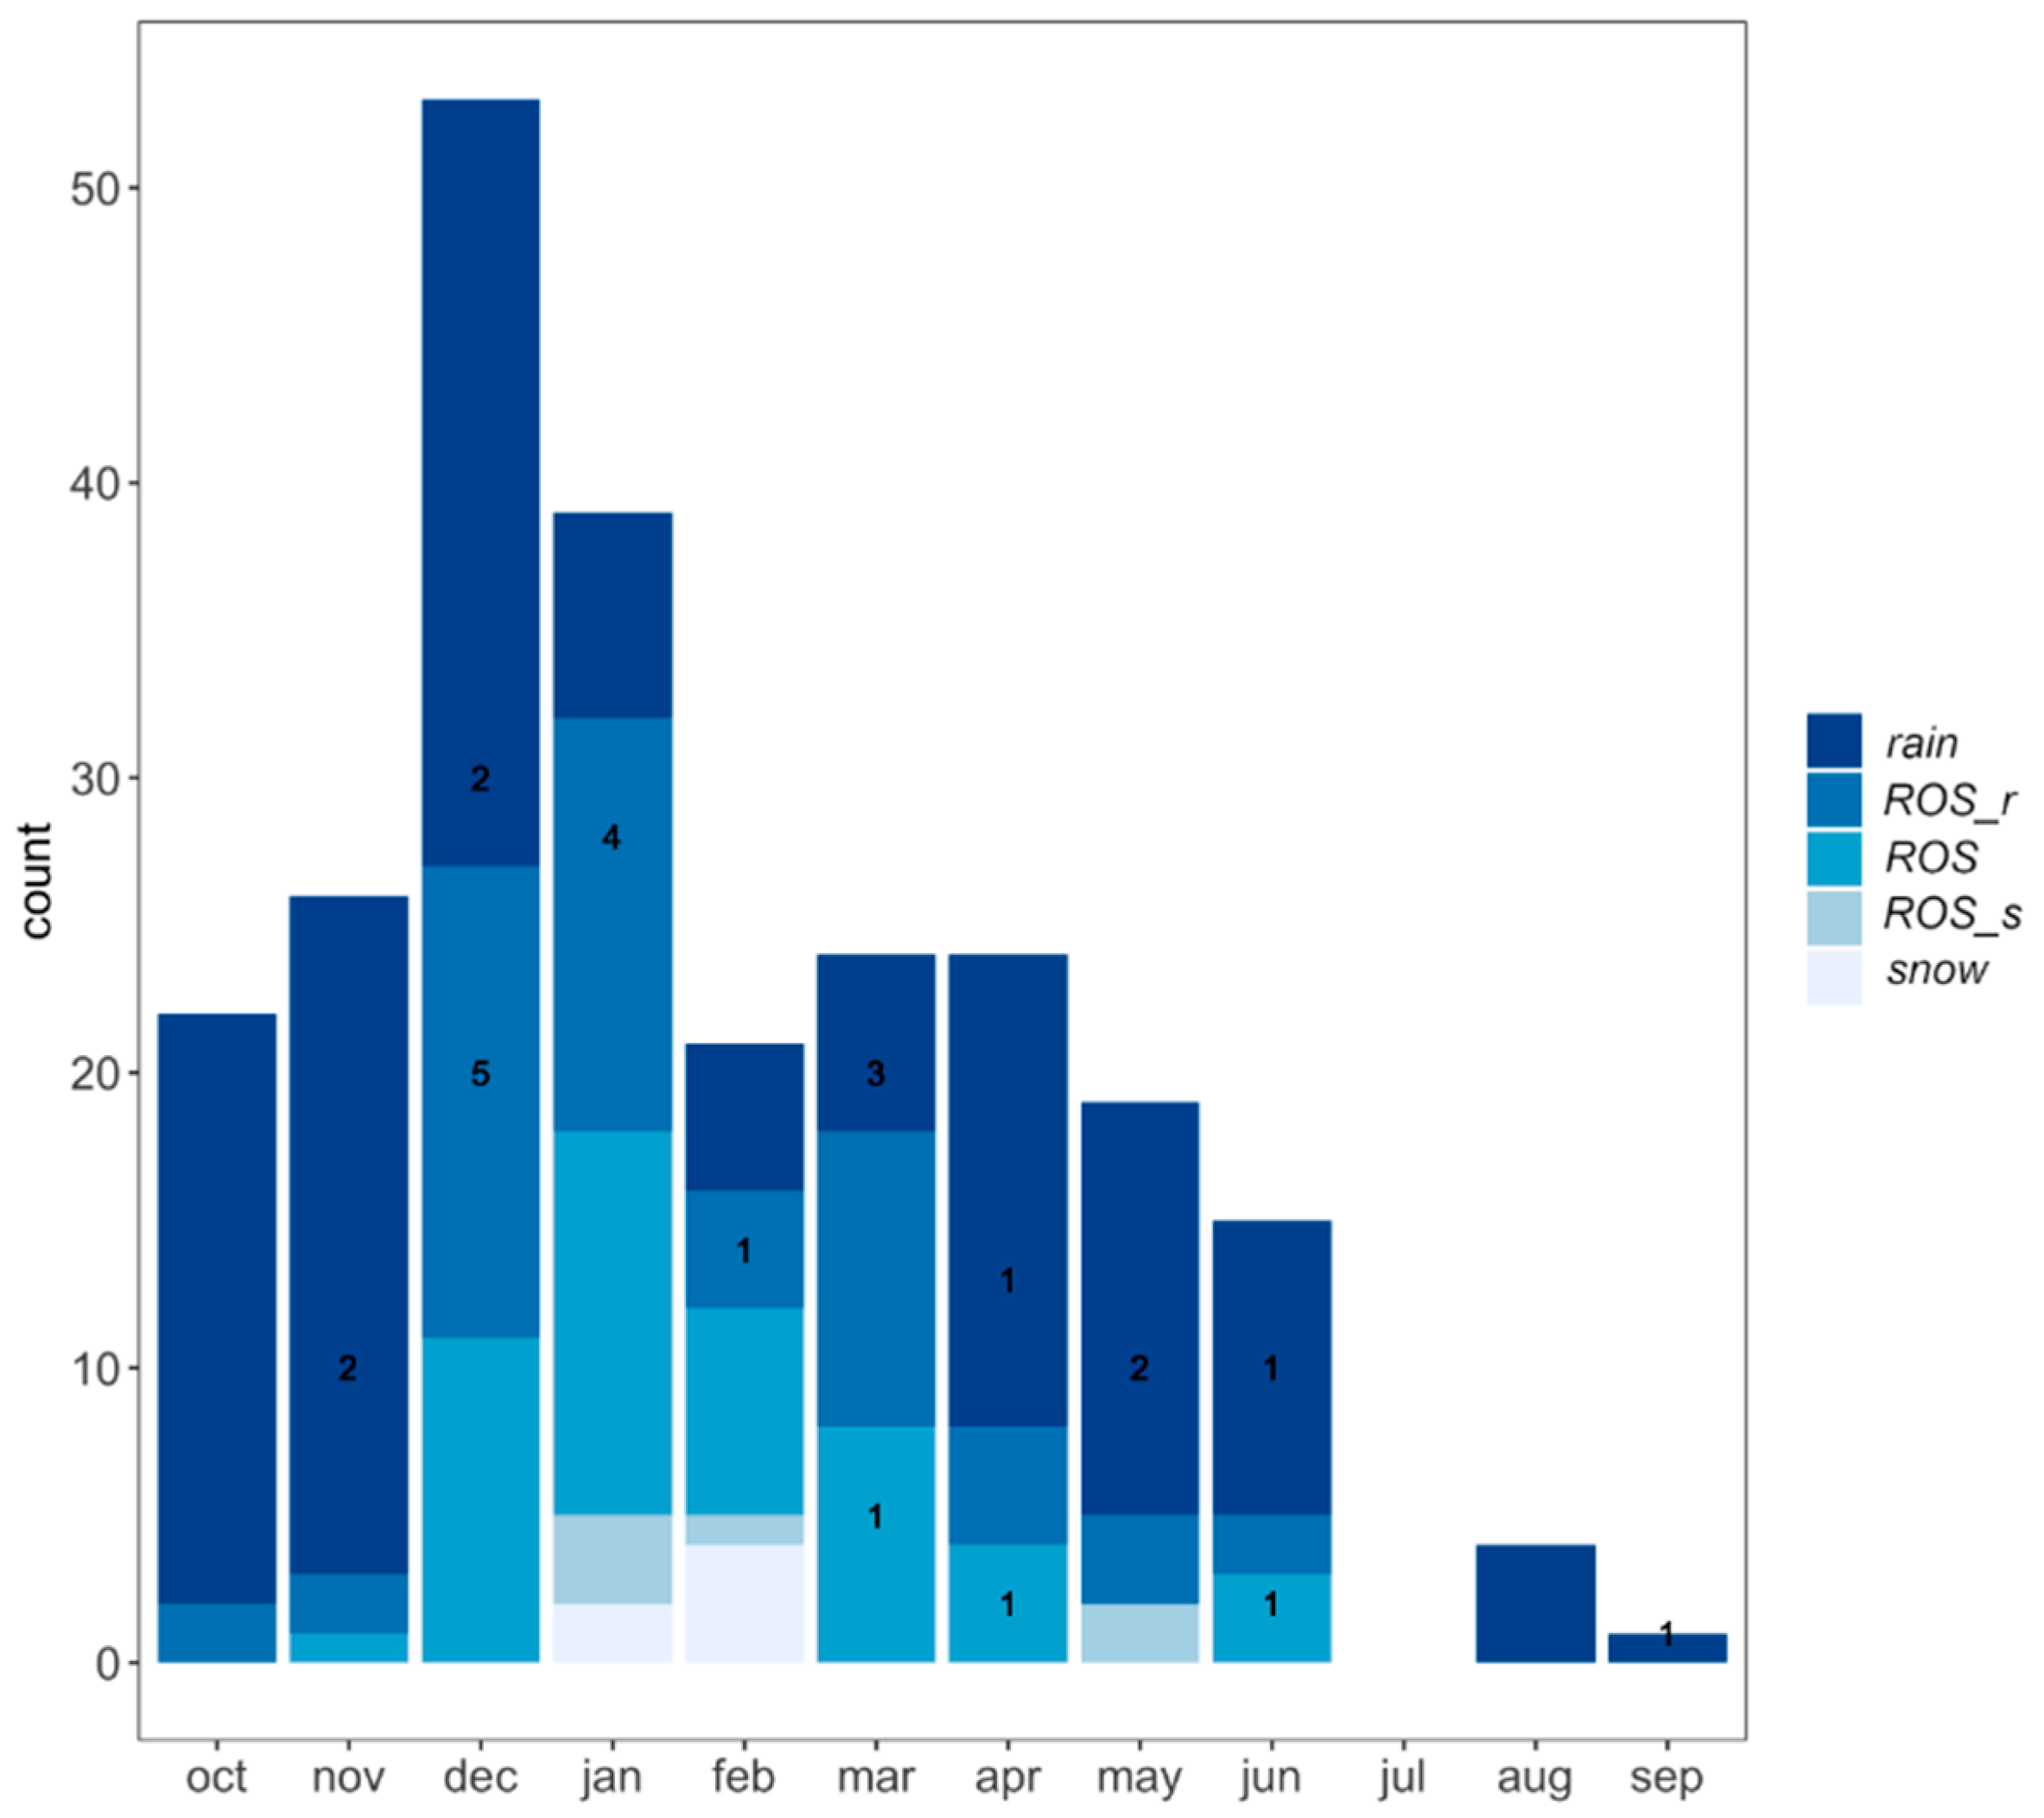
3.1. Hydrological Drivers of Flood Events
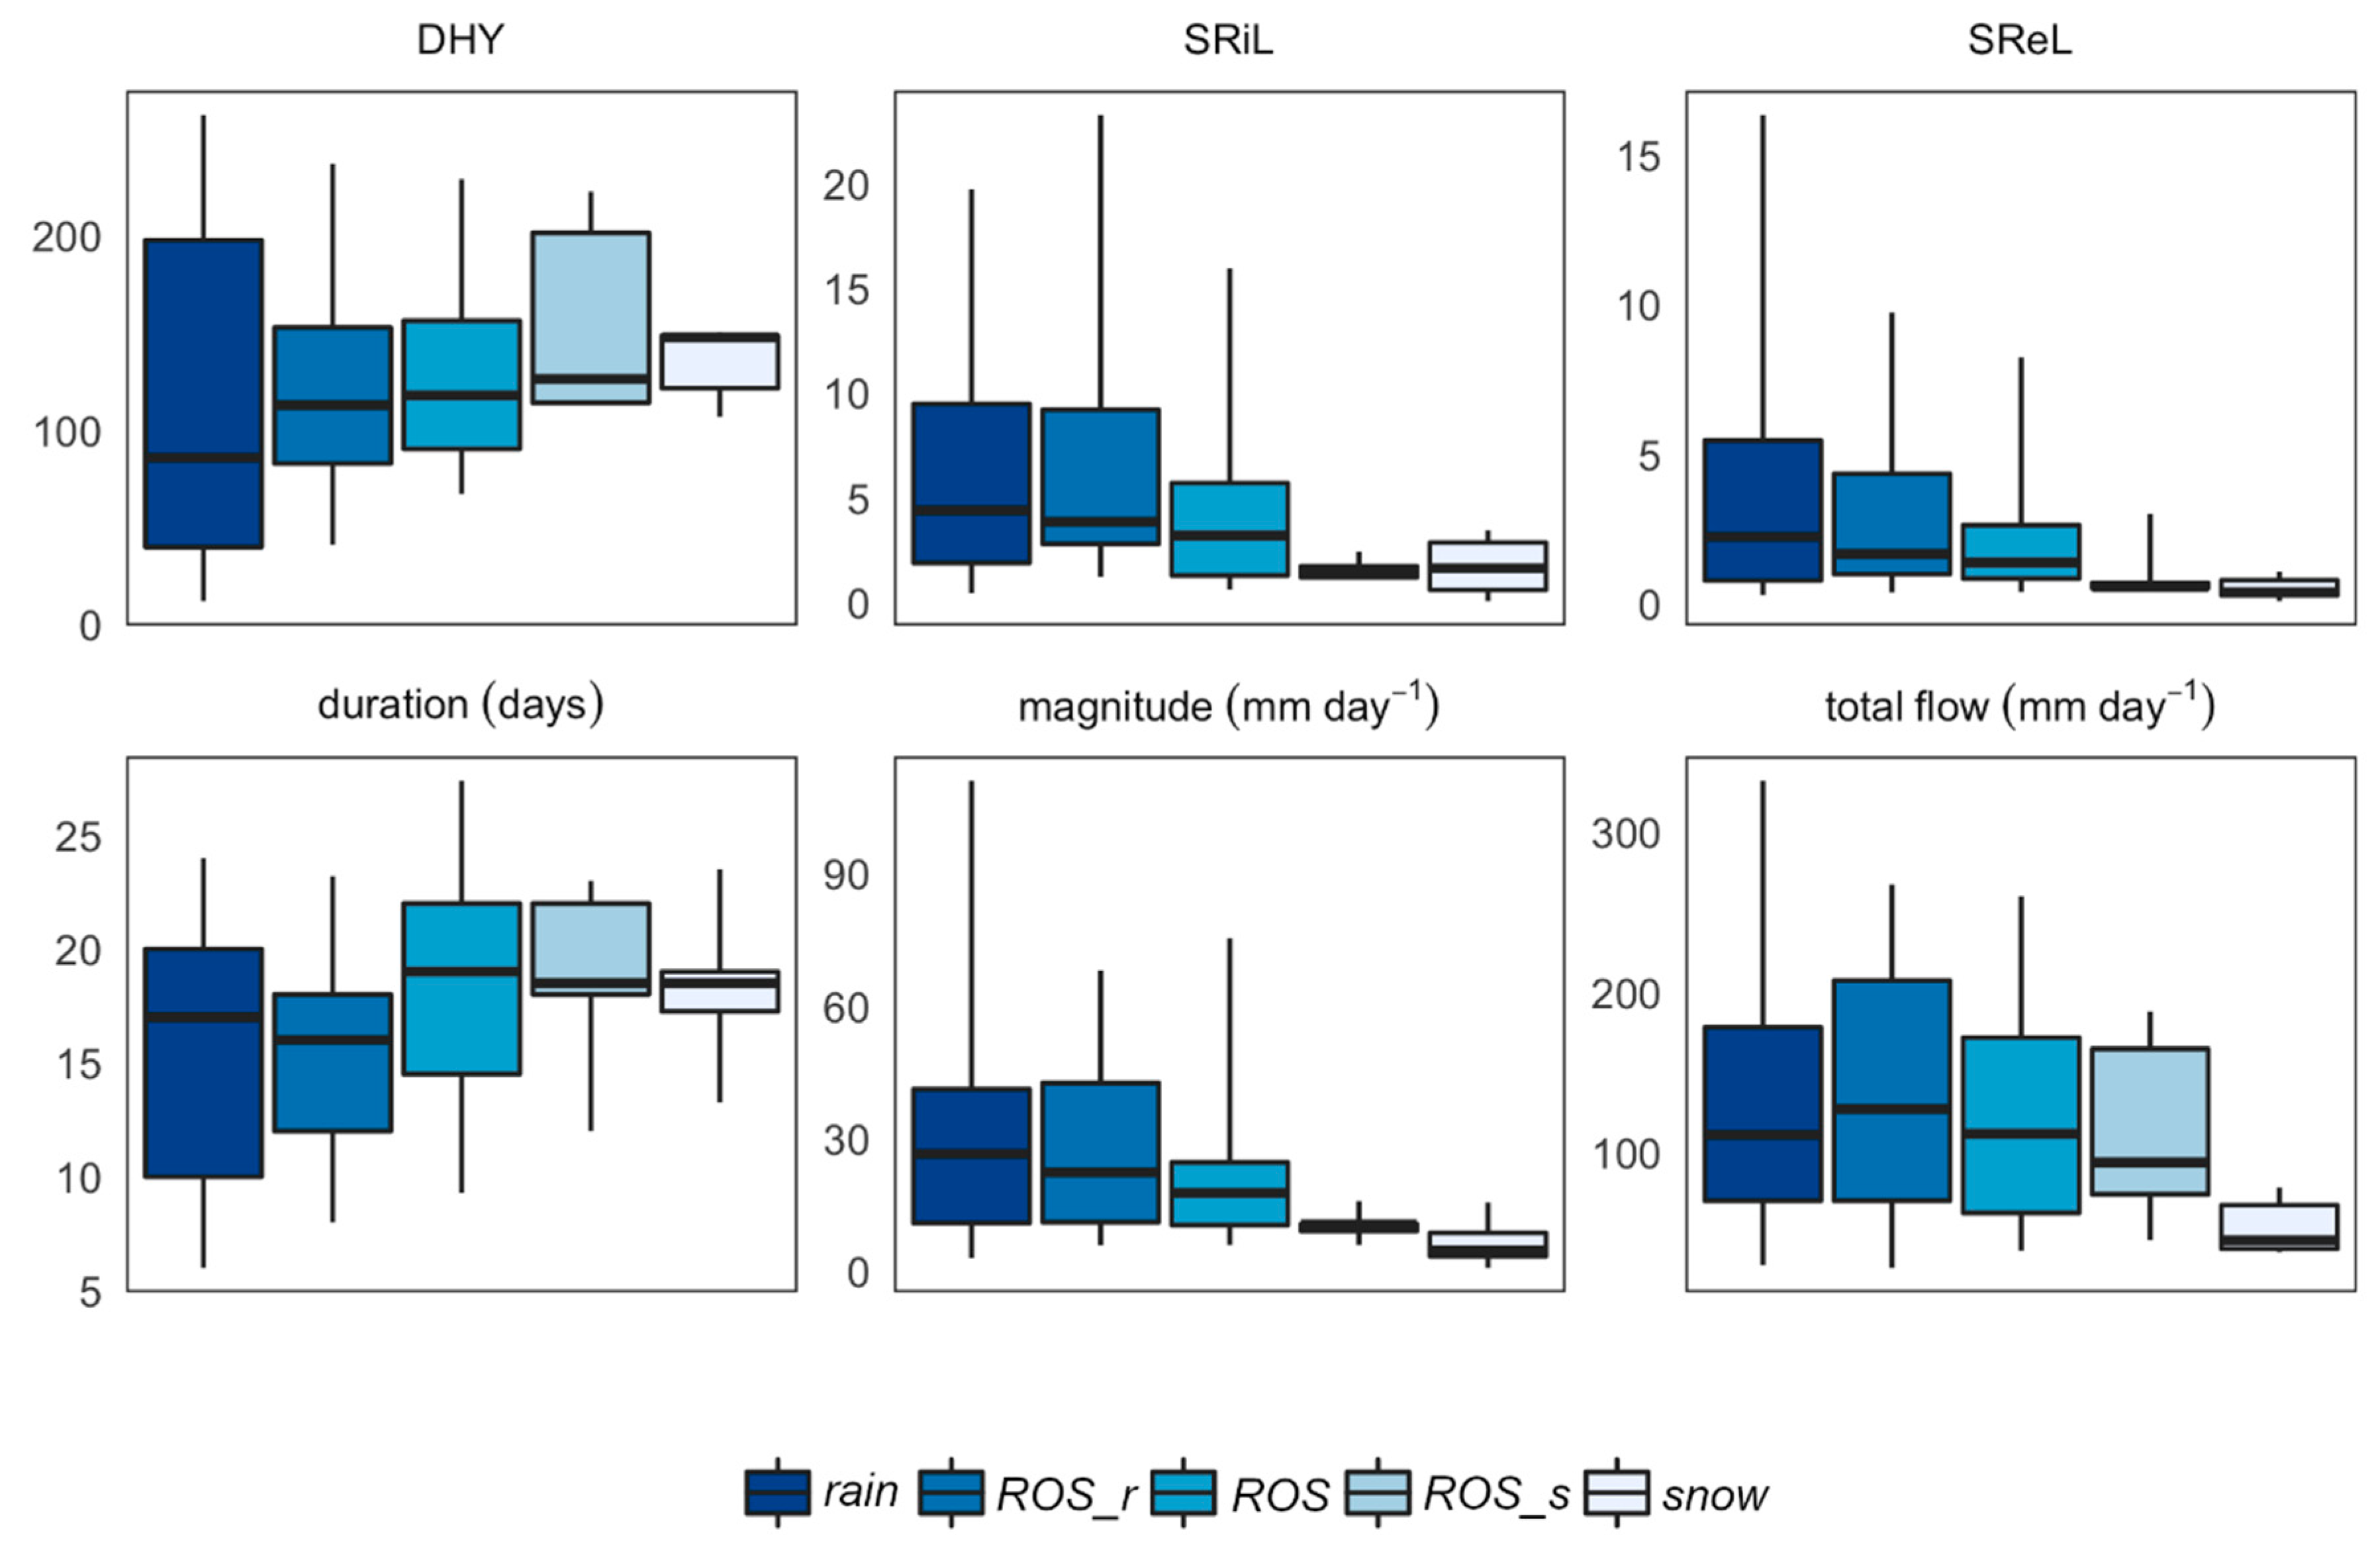
3.2. Characteristics of Hydrographs by Flood Type
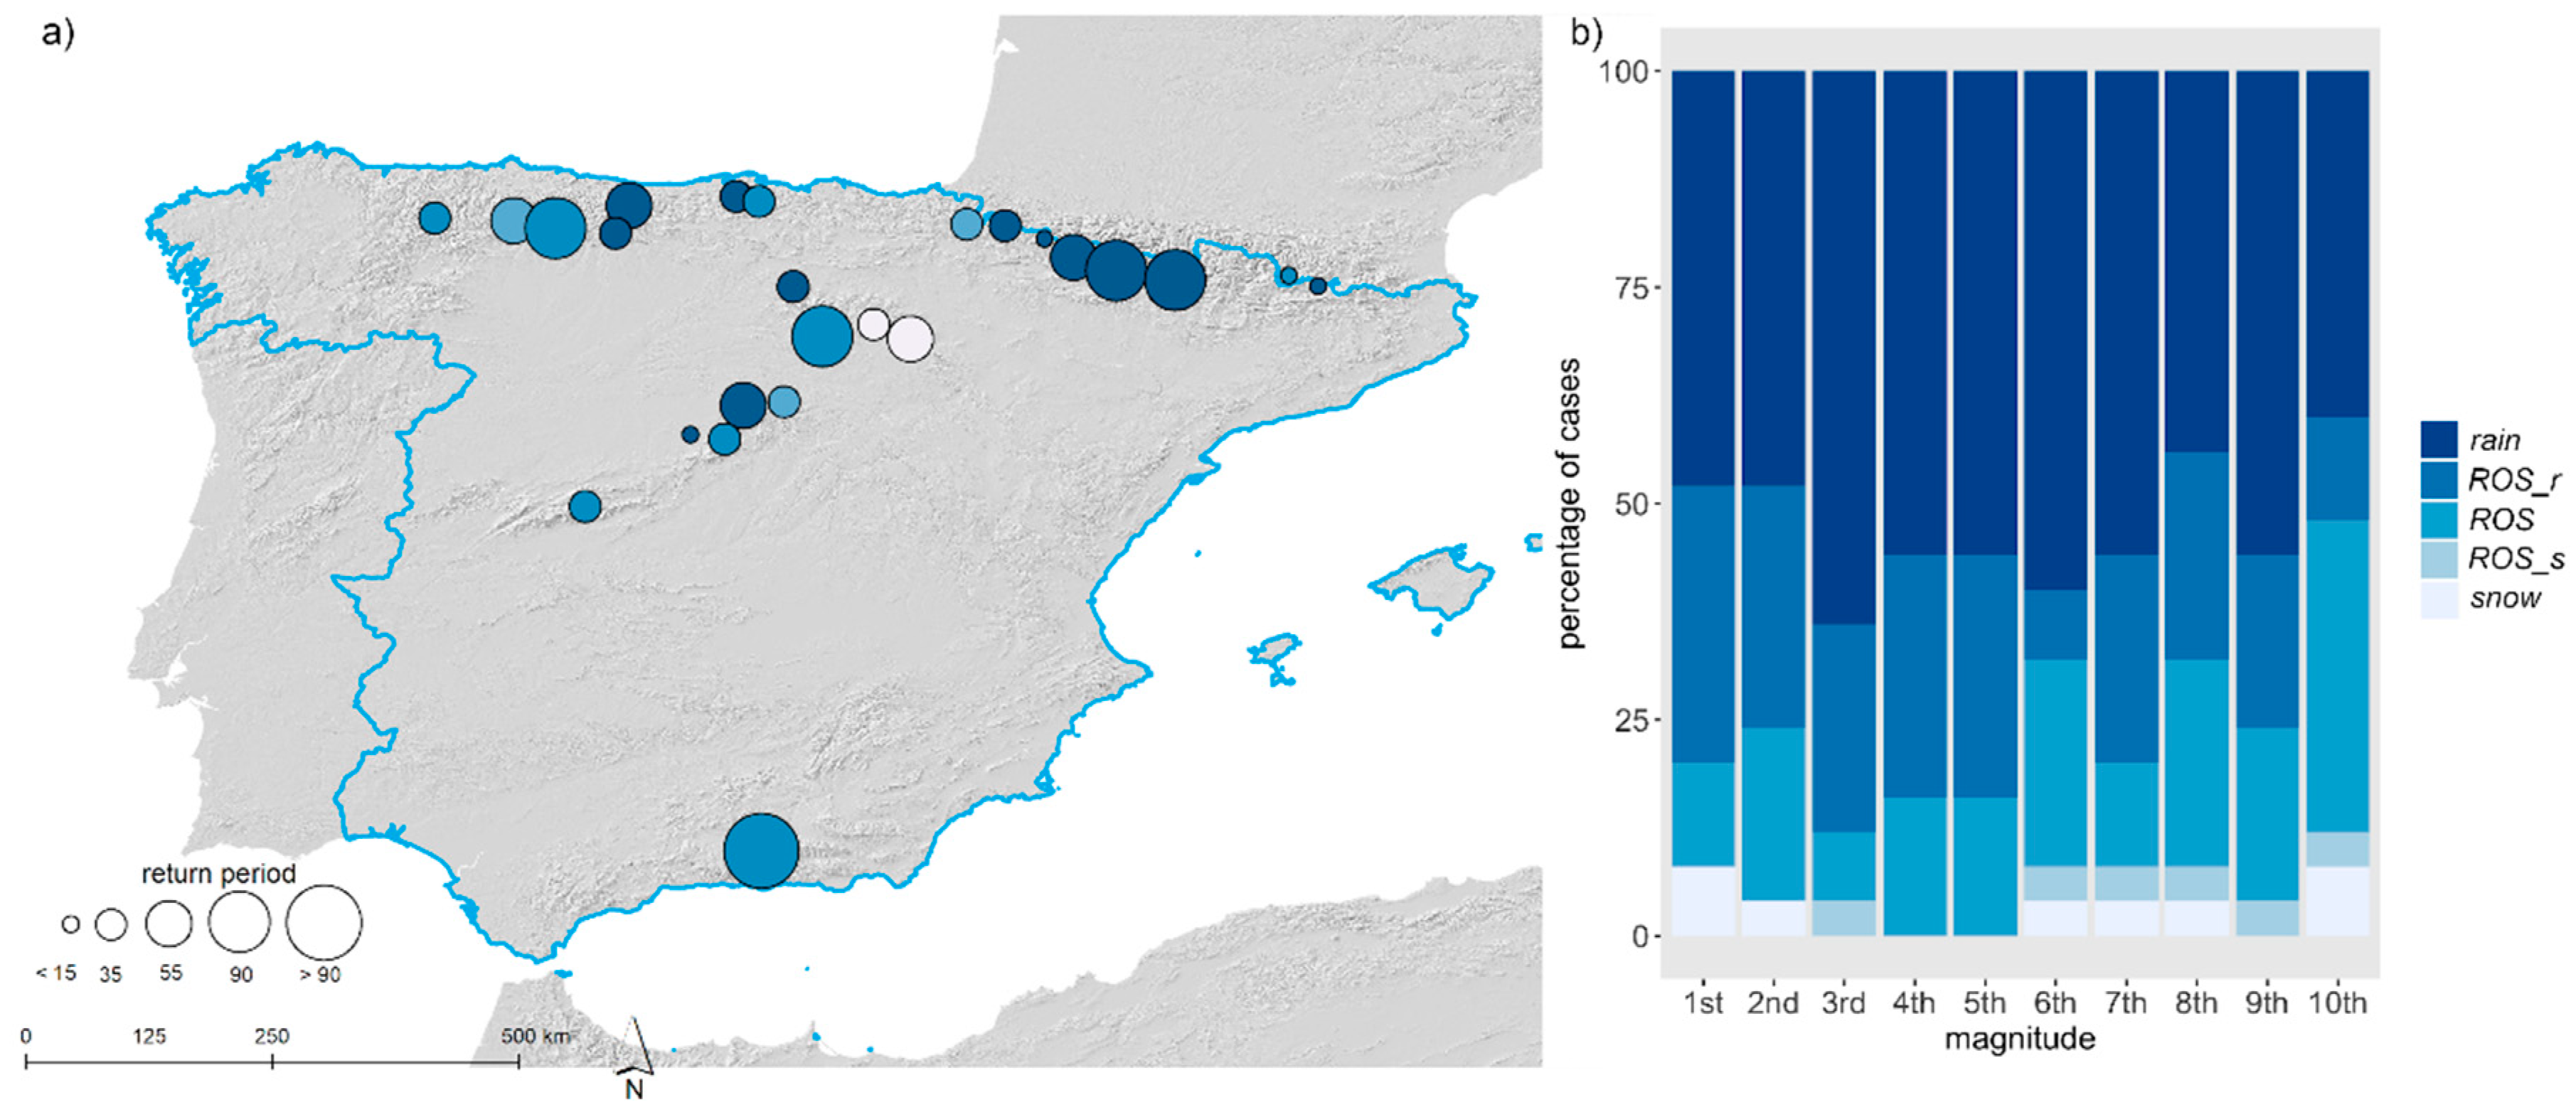
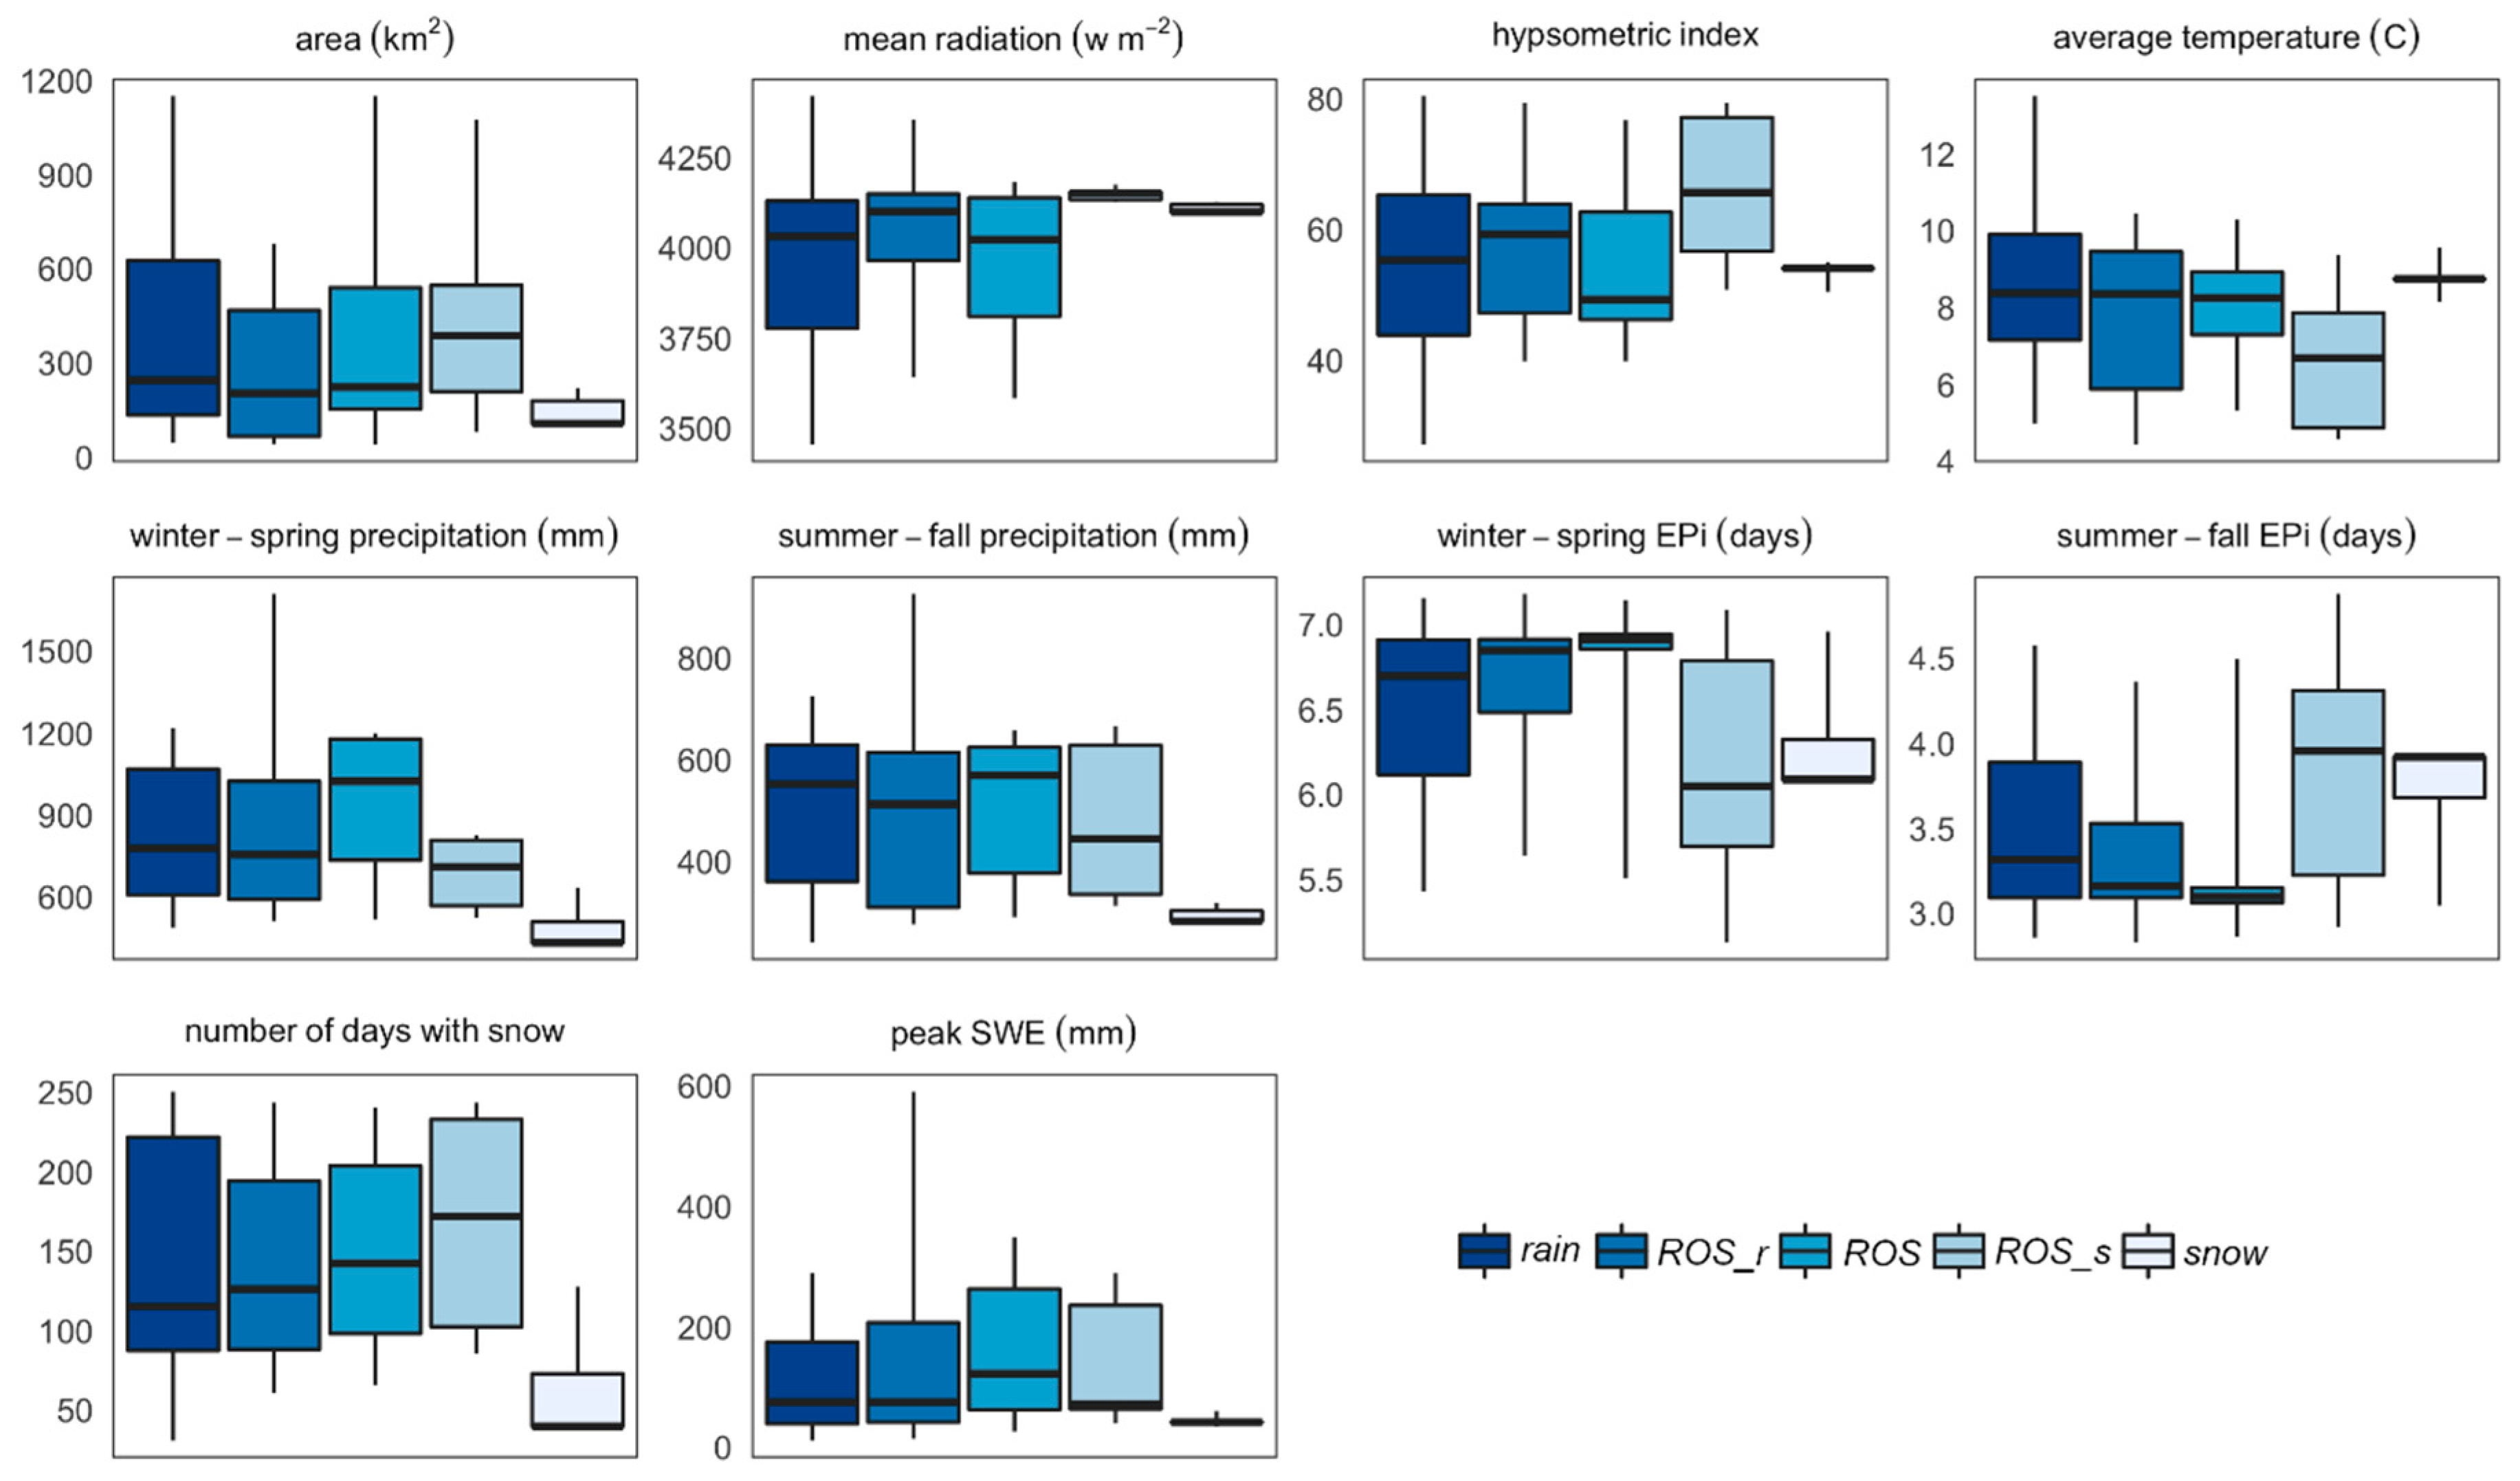
3.3. Geographical Drivers of Flood Type
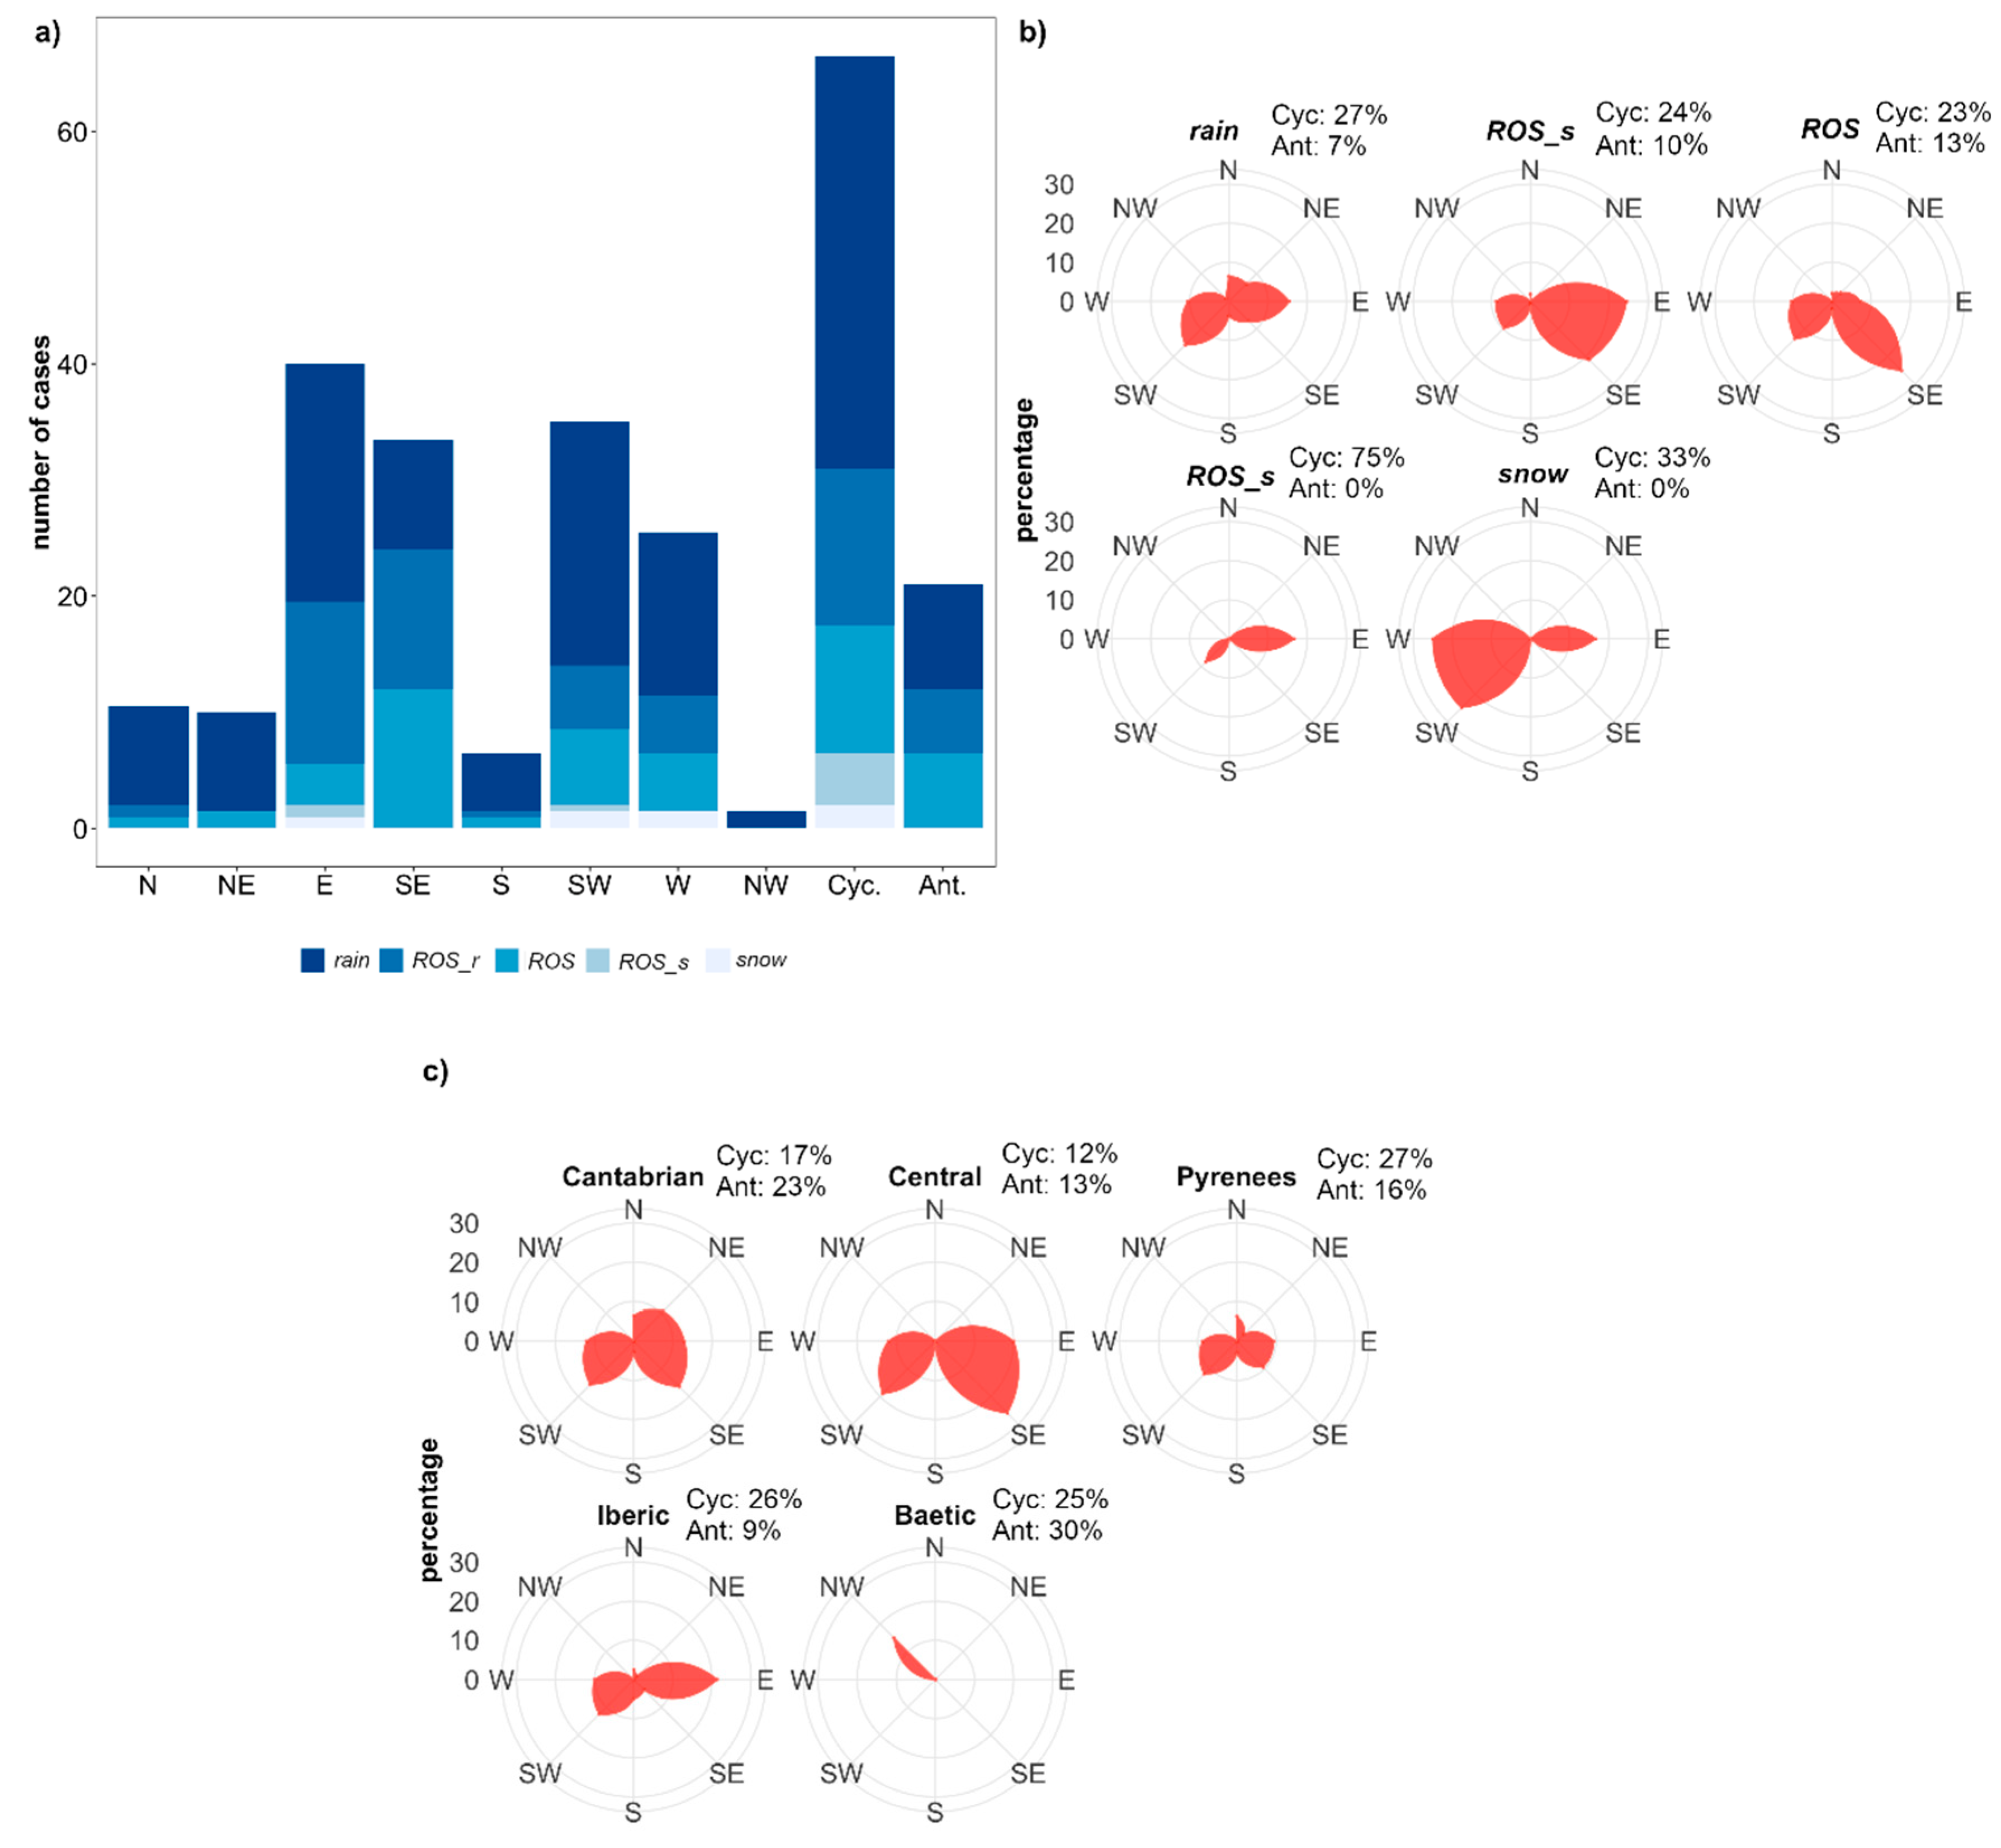
3.4. Atmospheric Circulation and Floods
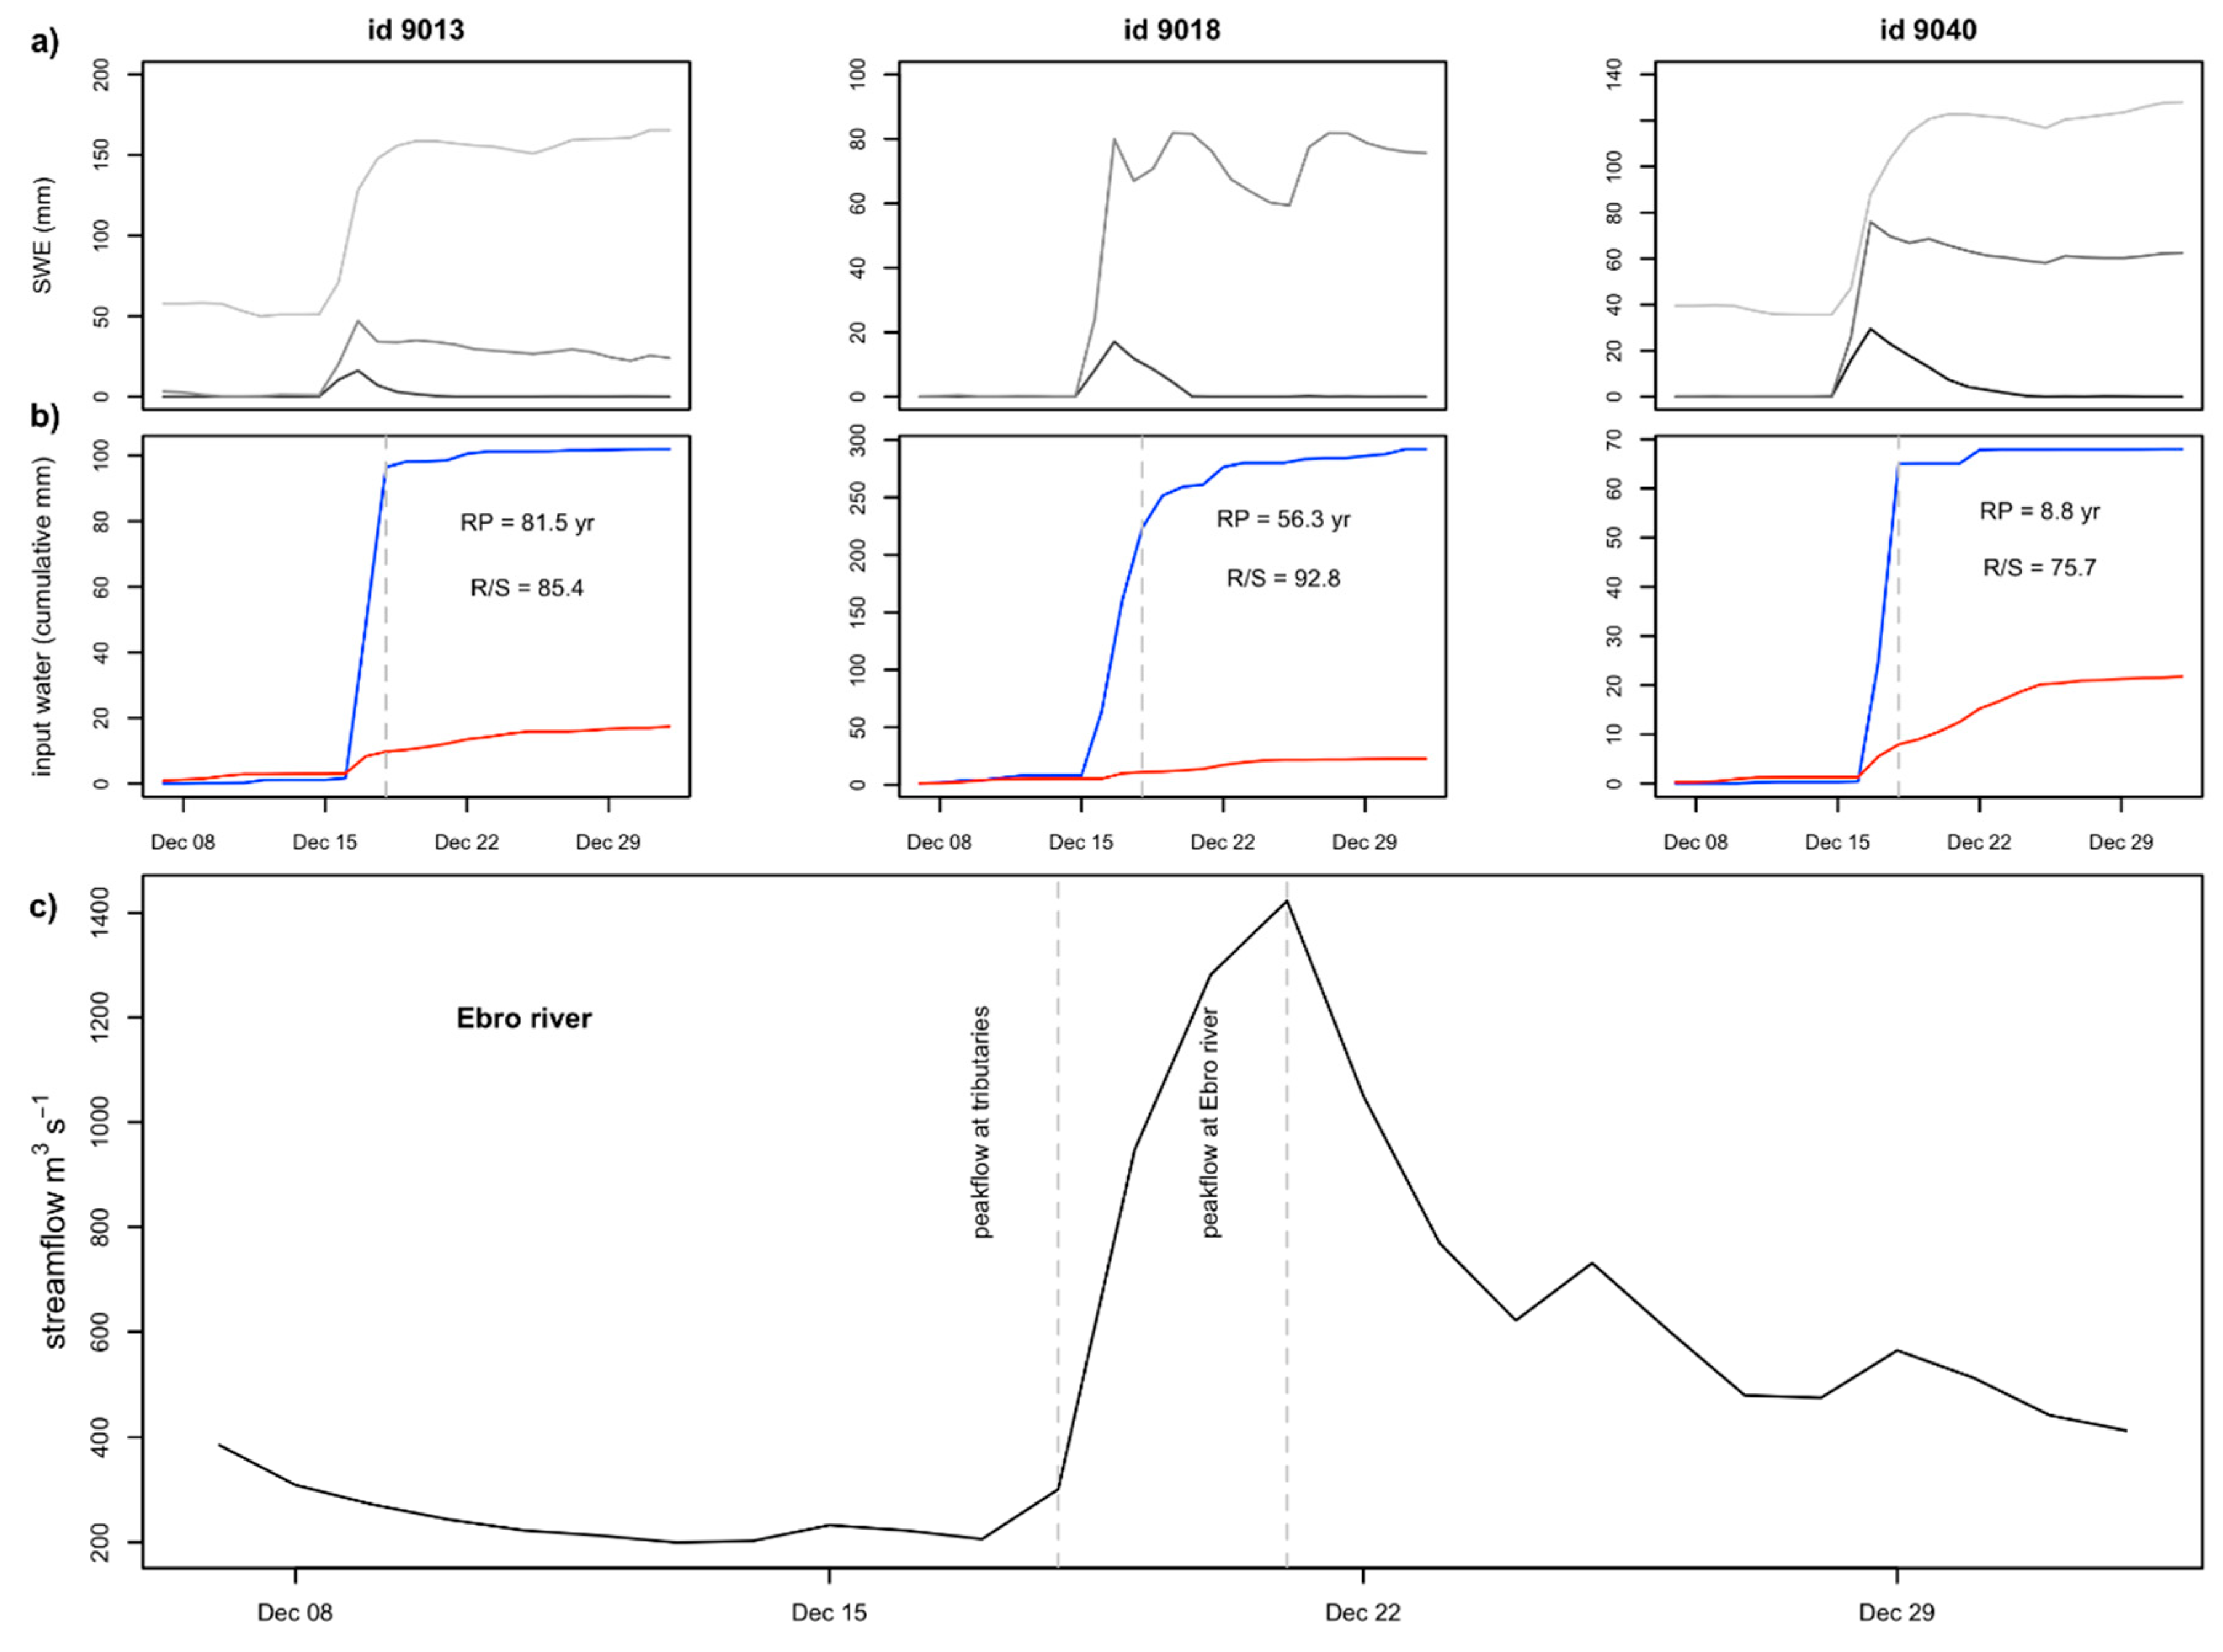
3.5. A Case Study: Floods Aggregation Downstream
4. Discussions and Conclusions
Author Contributions
Funding
Acknowledgments
Conflicts of Interest
References
- Viviroli, D.; Dürr, H.H.; Messerli, B.; Meybeck, M.; Weingartner, R. Mountains of the world, water towers for humanity: Typology, mapping, and global significance. Water Resour. Res. 2007, 43. [Google Scholar] [CrossRef] [Green Version]
- Houze, R.A. Orographic effects on precipitating clouds. Rev. Geophys. 2012, 50, RG1001. [Google Scholar] [CrossRef]
- Bodoque, J.M.; Díez-Herrero, A.; Eguibar, M.A.; Benito, G.; Ruiz-Villanueva, V.; Ballesteros-Cánovas, J.A. Challenges in paleoflood hydrology applied to risk analysis in mountainous watersheds—A review. J. Hydrol. 2015, 529, 449–467. [Google Scholar] [CrossRef] [Green Version]
- Weingartner, R.; Barben, M.; Spreafico, M. Floods in mountain areas—An overview based on examples from Switzerland. J. Hydrol. 2003, 282, 10–24. [Google Scholar] [CrossRef]
- Zeinivand, H.; De Smedt, F. Prediction of snowmelt floods with a distributed hydrological model using a physical snow mass and energy balance approach. Nat. Hazards 2010, 54, 451–468. [Google Scholar] [CrossRef]
- Cunderlik, J.M.; Ouarda, T.B.M.J. Trends in the timing and magnitude of floods in Canada. J. Hydrol. 2009, 375, 471–480. [Google Scholar] [CrossRef]
- Marks, D.; Kimball, J.; Tingey, D.; Link, T. The sensitivity of snowmelt processes to climate conditions and forest cover during rain-on-snow: A case study of the 1996 Pacific Northwest flood. Hydrol. Process. 1998, 12, 1569–1587. [Google Scholar] [CrossRef]
- McCabe, G.J.; Clark, M.P.; Hay, L.E.; McCabe, G.J.; Clark, M.P.; Hay, L.E. Rain-on-Snow Events in the Western United States. Bull. Am. Meteorol. Soc. 2007, 88, 319–328. [Google Scholar] [CrossRef]
- Kattelmann, R.F. Flooding from Rain-on-Snow Events in the Sierra Nevada. In Proceedings of the North American Water and Environment Congress & Destructive Water (ASCE); Bathala, C., Ed.; International Association of Hydrological Sciences: Wallingford, UK, 1996. [Google Scholar]
- Surfleet, C.G.; Tullos, D. Variability in effect of climate change on rain-on-snow peak flow events in a temperate climate. J. Hydrol. 2013, 479, 24–34. [Google Scholar] [CrossRef] [Green Version]
- Sui, J.; Koehler, G. Rain-on-snow induced flood events in Southern Germany. J. Hydrol. 2001, 252, 205–220. [Google Scholar] [CrossRef]
- Beniston, M.; Stoffel, M. Rain-on-snow events, floods and climate change in the Alps: Events may increase with warming up to 4 °C and decrease thereafter. Sci. Total Environ. 2016, 571, 228–236. [Google Scholar] [CrossRef] [PubMed]
- Merz, R.; Blöschl, G. A process typology of regional floods. Water Resour. Res. 2003, 39. [Google Scholar] [CrossRef]
- Corripio, J.; López-Moreno, J. Analysis and Predictability of the Hydrological Response of Mountain Catchments to Heavy Rain on Snow Events: A Case Study in the Spanish Pyrenees. Hydrology 2017, 4, 20. [Google Scholar] [CrossRef] [Green Version]
- Pomeroy, J.W.; Fang, X.; Marks, D.G. The cold rain-on-snow event of June 2013 in the Canadian Rockies—Characteristics and diagnosis. Hydrol. Process. 2016, 30, 2899–2914. [Google Scholar] [CrossRef]
- Morán-Tejeda, E.; López-Moreno, J.; Stoffel, M.; Beniston, M. Rain-on-snow events in Switzerland: Recent observations and projections for the 21st century. Clim. Res. 2016, 71, 111–125. [Google Scholar] [CrossRef]
- Pujadas-Ferrer, J. Las inundaciones en España: Impacto económico y gestión del riesgo. In Riesgos Naturales; Ayala-Carcedo, F.J., Olcina, J., Eds.; Ariel Ciencia: Barcelona, Spain, 2002; pp. 879–888. [Google Scholar]
- European Environment Agency. Flood Risks and Environmental Vulnerability Exploring the Synergies between Floodplain Restoration, Water Policies and Thematic Policies; Publications Office of the European Union: Luxembourg, 2016; ISBN 9789292137168. [Google Scholar]
- Barriendos, M.; Rodrigo, F.S. Study of historical flood events on Spanish rivers using documentary data. Hydrol. Sci. J. 2006, 51, 765–783. [Google Scholar] [CrossRef] [Green Version]
- Camarasa-Belmonte, A.M. Crecidas e inundaciones. In Riesgos Naturales; Ayala-Carcedo, F.J., Olcina, J., Eds.; Ariel Ciencia: Barcelona, Spain, 2002; pp. 859–879. [Google Scholar]
- Marchi, L.; Borga, M.; Preciso, E.; Gaume, E. Characterisation of selected extreme flash floods in Europe and implications for flood risk management. J. Hydrol. 2010, 394, 118–133. [Google Scholar] [CrossRef]
- Llasat, M.C.; Llasat-Botija, M.; Prat, M.A.; Porcú, F.; Price, C.; Mugnai, A.; Lagouvardos, K.; Kotroni, V.; Katsanos, D.; Michaelides, S.; et al. High-impact floods and flash floods in Mediterranean countries: The FLASH preliminary database. Adv. Geosci. 2010, 23, 47–55. [Google Scholar] [CrossRef] [Green Version]
- Lara, A.; Saurí, D.; Ribas, A.; Pavón, D. Social perceptions of floods and flood management in a Mediterranean area (Costa Brava, Spain). Nat. Hazards Earth Syst. Sci. 2010, 10, 2081–2091. [Google Scholar] [CrossRef] [Green Version]
- Alonso-González, E.; López-Moreno, J.I.; Navarro-Serrano, F.; Sanmiguel-Vallelado, A.; Revuelto, J.; Domínguez-Castro, F.; Ceballos, A. Snow climatology for the mountains in the Iberian Peninsula using satellite imagery and simulations with dynamically downscaled reanalysis data. Int. J. Climatol. 2019. [Google Scholar] [CrossRef]
- Herrero, J.; Polo, M.J.; Losada, M.A. Snow evolution in Sierra Nevada (Spain) from an energy balance model validated with Landsat TM data. In Remote Sensing for Agriculture, Ecosystems, and Hydrology XIII; Neale, C.M.U., Maltese, A., Eds.; International Society for Optics and Photonics: Bellingham, DC, USA, 2011; Volume 8174, p. 817403. [Google Scholar]
- López-Moreno, J.I.; García-Ruiz, J.M. Influence of snow accumulation and snowmelt on streamflow in the central Spanish Pyrenees / Influence de l’accumulation et de la fonte de la neige sur les écoulements dans les Pyrénées centrales espagnoles. Hydrol. Sci. J. 2004, 49. [Google Scholar] [CrossRef]
- Morán-Tejeda, E.; Lorenzo-Lacruz, J.; López-Moreno, J.I.; Rahman, K.; Beniston, M. Streamflow timing of mountain rivers in Spain: Recent changes and future projections. J. Hydrol. 2014, 517, 1114–1127. [Google Scholar] [CrossRef] [Green Version]
- Sanmiguel-Vallelado, A.; Morán-Tejeda, E.; Alonso-González, E.; López-Moreno, J.I. Effect of snow on mountain river regimes: An example from the Pyrenees. Front. Earth Sci. 2017, 11, 515–530. [Google Scholar] [CrossRef]
- López-Moreno, J.I.; Revuelto, J.; Fassnacht, S.R.; Azorín-Molina, C.; Vicente-Serrano, S.M.; Morán-Tejeda, E.; Sexstone, G.A. Snowpack variability across various spatio-temporal resolutions. Hydrol. Process. 2015, 29, 1213–1224. [Google Scholar] [CrossRef]
- Gil, F.E. Hacia una clasificación de las situaciones de inundación en la cuenca del Ebro, en función de sus causas atmosféricas. Geographicalia 2008, 53, 73–100. [Google Scholar]
- Serrano-Notivoli, R.; Mora Mur, D.; Ollero Ojeda, A.; Sánchez Fabre, M.; Saz Sánchez, M.Á. Respuesta hidrológica al evento de precipitación de Junio de 2013 en el Pirineo Central. Investigaciones Geográficas 2014, 62, 5–21. [Google Scholar] [CrossRef] [Green Version]
- Alonso-González, E.; López-Moreno, J.I.; Gascoin, S.; García-Valdecasas Ojeda, M.; Sanmiguel-Vallelado, A.; Navarro-Serrano, F.; Revuelto, J.; Ceballos, A.; Esteban-Parra, M.J.; Essery, R. Daily gridded datasets of snow depth and snow water equivalent for the Iberian Peninsula from 1980 to 2014. Earth Syst. Sci. Data Discuss. 2018, 1–24. [Google Scholar] [CrossRef] [Green Version]
- Centro de Estudios Hidrográficos. Available online: http://ceh-flumen64.cedex.es/general/default.htm (accessed on 8 September 2018).
- García-Valdecasas Ojeda, M.; Gámiz-Fortis, S.R.; Castro-Díez, Y.; Esteban-Parra, M.J. Evaluation of WRF capability to detect dry and wet periods in Spain using drought indices. J. Geophys. Res. Atmos. 2017, 122, 1569–1594. [Google Scholar] [CrossRef]
- Singh, V.P. Generalized Extreme Value Distribution. In Entropy-Based Parameter Estimation in Hydrology; Water Science and Technology Library; Springer: Dordrecht, The Nezerlands, 1998; pp. 169–183. [Google Scholar]
- Morrison, J.E.; Smith, J.A. Stochastic modeling of flood peaks using the generalized extreme value distribution. Water Resour. Res. 2002, 38, 41. [Google Scholar] [CrossRef]
- Harder, P.; Pomeroy, J. Estimating precipitation phase using a psychrometric energy balance method. Hydrol. Process. 2013, 27, 1901–1914. [Google Scholar] [CrossRef]
- Trigo, R.M.; DaCamara, C.C. Circulation weather types and their influence on the precipitation regime in Portugal. Int. J. Climatol. 2000, 20, 1559–1581. [Google Scholar] [CrossRef]
- Jenkinson, A.F.; Collison, F.P. An initial climatology of Gales over the North Sea. In Synoptic Climatology Branch Memorandum; Meteorological Office: Bracknell, UK, 1977; Volume 62. [Google Scholar]
- Jones, P.D.; Hulme, M.; Briffa, K.R. A comparison of Lamb circulation types with an objective classification scheme. Int. J. Climatol. 1993, 13, 655–663. [Google Scholar] [CrossRef]
- Cortesi, N.; Gonzalez-Hidalgo, J.C.; Trigo, R.M.; Ramos, A.M. Weather types and spatial variability of precipitation in the Iberian Peninsula. Int. J. Climatol. 2014, 34, 2661–2677. [Google Scholar] [CrossRef]
- Paredes, D.; Trigo, R.M.; Garcia-Herrera, R.; Trigo, I.F.; Paredes, D.; Trigo, R.M.; Garcia-Herrera, R.; Trigo, I.F. Understanding Precipitation Changes in Iberia in Early Spring: Weather Typing and Storm-Tracking Approaches. J. Hydrometeorol. 2006, 7, 101–113. [Google Scholar] [CrossRef] [Green Version]
- Goodess, C.M.; Jones, P.D. Links between circulation and changes in the characteristics of Iberian rainfall. Int. J. Climatol. 2002, 22, 1593–1615. [Google Scholar] [CrossRef]
- Cortesi, N.; Trigo, R.M.; Gonzalez-Hidalgo, J.C.; Ramos, A.M. Modelling monthly precipitation with circulation weather types for a dense network of stations over Iberia. Hydrol. Earth Syst. Sci. 2013, 17, 665–678. [Google Scholar] [CrossRef] [Green Version]
- López-Moreno, J.I.; Beniston, M.; García-Ruiz, J.M. Environmental change and water management in the Pyrenees: Facts and future perspectives for Mediterranean mountains. Glob. Planet. Chang. 2008, 61, 300–312. [Google Scholar] [CrossRef] [Green Version]
- Llasat, M.C.; Marcos, R.; Llasat-Botija, M.; Gilabert, J.; Turco, M.; Quintana-Seguí, P. Flash flood evolution in North-Western Mediterranean. Atmos. Res. 2014, 149, 230–243. [Google Scholar] [CrossRef] [Green Version]
- Llasat, M.C.; López, L.; Barnolas, M.; Llasat-Botija, M. Flash-floods in Catalonia: The social perception in a context of changing vulnerability. Adv. Geosci. 2008, 17, 63–70. [Google Scholar] [CrossRef] [Green Version]
- Barnolas, M.; Llasat, M.C. A flood geodatabase and its climatological applications: The case of Catalonia for the last century. Nat. Hazards Earth Syst. Sci. 2007, 7, 271–281. [Google Scholar] [CrossRef] [Green Version]
- Llasat, M.-C.; Barriendos, M.; Barrera, A.; Rigo, T. Floods in Catalonia (NE Spain) since the 14th century. Climatological and meteorological aspects from historical documentary sources and old instrumental records. J. Hydrol. 2005, 313, 32–47. [Google Scholar] [CrossRef]
- Bull, L.; Kirkby, M.; Shannon, J.; Hooke, J. The impact of rainstorms on floods in ephemeral channels in southeast Spain. Catena 2000, 38, 191–209. [Google Scholar] [CrossRef]
- Espejo, F.; Domenech, S.; Ollero, A.; Sánchez, M. Boletín de la Asociación de Geógrafos Españoles; AGE: Madrid, Spain, 2008. [Google Scholar]
- White, S.; García-Ruiz, J.M.; Martí, C.; Valero, B.; Errea, M.P.; Gómez-Villar, A. The 1996 Biescas campsite disaster in the Central Spanish Pyrenees, and its temporal and spatial context. Hydrol. Process. 1997, 11, 1797–1812. [Google Scholar] [CrossRef]
- Morán-Tejeda, E.; López-Moreno, J.; Ceballos-Barbancho, A.; Vicente-Serrano, S.M. Evaluating Duero’s basin (Spain) response to the NAO phases: Spatial and seasonal variability. Hydrol. Process. 2011, 25, 1313–1326. [Google Scholar] [CrossRef]
- Trigo, R.M.; Pozo-Vázquez, D.; Osborn, T.J.; Castro-Díez, Y.; Gámiz-Fortis, S.; Esteban-Parra, M.J. North Atlantic oscillation influence on precipitation, river flow and water resources in the Iberian Peninsula. Int. J. Climatol. 2004, 24, 925–944. [Google Scholar] [CrossRef]
- Muñoz-Diaz, D.; Rodrigo, F.S. Spatio-temporal patterns of seasonal rainfall in Spain (1912–2000) using cluster and principal component analysis: Comparison. Ann. Geophys. 2004, 22, 1435–1448. [Google Scholar] [CrossRef]
- Romero, R.; Sumner, G.; Ramis, C.; Genovés, A. A classification of the atmospheric circulation patterns producing significant daily rainfall in the Spanish Mediterranean area. Int. J. Climatol. 1999, 19, 765–785. [Google Scholar] [CrossRef]
- Wulfmeyer, V.; Behrendt, A.; Bauer, H.-S.; Kottmeier, C.; Corsmeier, U.; Blyth, A.; Craig, G.; Schumann, U.; Hagen, M.; Crewell, S.; et al. THE CONVECTIVE AND OROGRAPHICALLY INDUCED PRECIPITATION STUDY: A Research and Development Project of the World Weather Research Program for Improving Quantitative Precipitation Forecasting in Low-Mountain Regions. Bull. Am. Meteorol. Soc. 2008, 89, 1477–1486. [Google Scholar]
- Nieto, R.; Gimeno, L.; De la Torre, L.; Ribera, P.; Barriopedro, D.; García-Herrera, R.; Serrano, A.; Gordillo, A.; Redaño, A.; Lorente, J. Interannual variability of cut-off low systems over the European sector: The role of blocking and the Northern Hemisphere circulation modes. Meteorol. Atmos. Phys. 2007, 96, 85–101. [Google Scholar] [CrossRef]
- Fassnacht, S.R.; Records, R.M. Large snowmelt versus rainfall events in the mountains. J. Geophys. Res. Atmos. 2015, 120, 2375–2381. [Google Scholar] [CrossRef]
- Mazurkiewicz, A.B.; Callery, D.G.; McDonnell, J.J. Assessing the controls of the snow energy balance and water available for runoff in a rain-on-snow environment. J. Hydrol. 2008, 354, 1–14. [Google Scholar] [CrossRef]
- Marks, D.; Link, T.; Winstral, A.; Garen, D. Simulating snowmelt processes during rain-on-snow over a semi-arid mountain basin. Ann. Glaciol. 2001, 32, 195–202. [Google Scholar] [CrossRef] [Green Version]
- Ramos, A.M.; Trigo, R.M.; Liberato, M.L.R.; Tomé, R.; Ramos, A.M.; Trigo, R.M.; Liberato, M.L.R.; Tomé, R. Daily Precipitation Extreme Events in the Iberian Peninsula and Its Association with Atmospheric Rivers*. J. Hydrometeorol. 2015, 16, 579–597. [Google Scholar] [CrossRef]
- Curry, C.L.; Islam, S.U.; Zwiers, F.W.; Déry, S.J. Atmospheric Rivers Increase Future Flood Risk in Western Canada’s Largest Pacific River. Geophys. Res. Lett. 2019, 46, 1651–1661. [Google Scholar] [CrossRef]
- Leung, L.R.; Qian, Y.; Bian, X.; Washington, W.M.; Han, J.; Roads, J.O. Mid-Century Ensemble Regional Climate Change Scenarios for the Western United States. Clim. Chang. 2004, 62, 75–113. [Google Scholar] [CrossRef]


| ID | River | Mountain System | Gauge Elevation (m a.s.l.) | Max Elevation (m a.s.l.) | Drainage Area (km2) | Mean Daily Flow (m3 s−1) | Mean Annual Specific Discharge (L s−1 km−2) | Largest Flood Flow (m3 s−1) |
|---|---|---|---|---|---|---|---|---|
| 1196 | Asón | Cantabrian Range | 16 | 1640 | 512 | 21.3 | 411.5 | 793.5 |
| 1207 | Miera | Cantabrian Range | 50 | 1707 | 166 | 4.6 | 265.0 | 306.9 |
| 1268 | Deva | Cantabrian Range | 56 | 2536 | 643 | 13.0 | 201.8 | 540.0 |
| 1363 | Caudal | Cantabrian Range | 352 | 2386 | 232 | 5.6 | 226.9 | 183.4 |
| 1353 | Narcea | Cantabrian Range | 352 | 2007 | 531 | 15.8 | 290.1 | 241.4 |
| 9013 | Ésera | Pyrenees | 450 | 3404 | 893 | 17.1 | 186.6 | 330.8 |
| 9050 | Tirón | Iberic System | 526 | 2085 | 698 | 3.8 | 54.4 | 119.7 |
| 9022 | Valira | Pyrenees | 559 | 2865 | 559 | 8.6 | 150.8 | 123.4 |
| 9152 | Arga | Pyrenees | 582 | 1459 | 69 | 2.5 | 354.4 | 74.6 |
| 9023 | Segre | Pyrenees | 670 | 2921 | 1233 | 12.0 | 92.1 | 213.4 |
| 9040 | Ara | Pyrenees | 680 | 3355 | 626 | 16.1 | 250.8 | 651.6 |
| 9066 | Irati | Pyrenees | 700 | 2021 | 236 | 9.7 | 403.0 | 293.6 |
| 9018 | Aragón | Pyrenees | 793 | 2886 | 238 | 5.4 | 227.1 | 206.0 |
| 2057 | Pirón | Cantabrian Range | 869 | 2200 | 172 | 0.7 | 35.0 | 34.0 |
| 2012 | Duratón | Central System | 920 | 2262 | 480 | 1.9 | 37.5 | 57.2 |
| 2016 | Cega | Cantabrian Range | 938 | 2209 | 280 | 2.5 | 88.6 | 67.6 |
| 9044 | Cidacos | Iberian System | 940 | 1792 | 223 | 1.2 | 51.7 | 48.9 |
| 5086 | Dilar | Baetic System | 957 | 3392 | 41 | 1.1 | 267.7 | 31.5 |
| 9043 | Linares | Iberian System | 1060 | 1709 | 105 | 0.4 | 41.6 | 9.2 |
| 2068 | Curueño | Cantabrian Range | 1094 | 2067 | 154 | 4.4 | 276.2 | 109.0 |
| 2101 | Duero | Iberian System | 1100 | 2015 | 135 | 2.4 | 176.5 | 166.7 |
| 2009 | Riaza | Central System | 1139 | 2036 | 36 | 0.5 | 141.8 | 10.5 |
| 9080 | Veral | Pyrenees | 1187 | 2366 | 47 | 1.5 | 316.6 | 28.5 |
| 2034 | Besandino | Central System | 1270 | 1820 | 32 | 1.3 | 401.2 | 23.3 |
| 2006 | Tormes | Central System | 1377 | 2592 | 88 | 1.5 | 158.3 | 45.2 |
| Index | Definition | Unit |
|---|---|---|
| magnitude | difference between the peak flow value and the flow value at the beginning of the event | mm day−1 |
| total flow | area under the flow curve between the beginning and end of the event | mm day−1 |
| duration | number of days between the beginning and end of the event | number of days |
| SRiL | slope of the flow between the beginning day and the day of peak flow | Δ flow/Δ time |
| SReL | slope of the flow between the day of peak flow and the ending day | Δ flow/Δ time |
| DHY | day of the hydrological year (from 1 October to 30 September) when the peak flow occurred | day of year |
| Index | Definition | Unit |
|---|---|---|
| area | drainage area extension | km2 |
| mean radiation | mean daily solar radiation values, averaged from 10 × 10 m pixels | w m2 |
| hypsometric index * | relative measure of area vs elevation | - |
| average T | long-term annual mean temperatures | °C |
| winter–spring P | long-term average of cumulative precipitation for December-to-May | mm |
| summer–fall P | long-term average of cumulative precipitation for June-to-November | mm |
| extreme precipitation index–EPi | number of days with precipitation larger than the 90th percentile relative to the total precipitation days | days |
| days with snow | long-term average of the number of days per year with SWE value larger than 1 mm | days |
| peak SWE | long-term average of the largest SWE value per year | mm |
| Direction And Vorticity Indices | Abbreviation | Computation |
|---|---|---|
| southerly flow | SF | 1.305 [0.25 (p5 + 2p9 + p13) − 0.25 (p4 + 2p8 + p12)] |
| westerly flow | WF | [0.5 (p12 + p13) − 0.5 (p4 + p5)] |
| southerly shear vorticity | ZS | 0.85 [0.2 (p6 + 2p10 + p14) − 0.25 (p5 + 2p9 + p13) − 0.25 (p4 + 2p8 + p12) + 0.25 (p3 + 2p7 + p11)] |
| westerly shear vorticity | ZW | 1.12 [0.5 (p15 + p16) − 0.5(p8 + p9)] − 0.91 [0.5 (p8 + p9) − 0.5 (p1 + p2)] |
| total flow | F | 0.5 (SF2 + WF2) |
| total shear vorticity | Z | ZS + ZW |
| Season | Rain | ROS_r | ROS | ROS_s | Snow |
|---|---|---|---|---|---|
| Winter | 33.6 | 28.3 | 29.2 | 3.5 | 5.3 |
| Spring | 53.7 | 25.4 | 20.9 | 0.0 | 0.0 |
| Summer | 73.7 | 10.5 | 15.8 | 0.0 | 0.0 |
| Fall | 89.8 | 8.2 | 2.0 | 0.0 | 0.0 |
© 2019 by the authors. Licensee MDPI, Basel, Switzerland. This article is an open access article distributed under the terms and conditions of the Creative Commons Attribution (CC BY) license (http://creativecommons.org/licenses/by/4.0/).
Share and Cite
Morán-Tejeda, E.; Fassnacht, S.R.; Lorenzo-Lacruz, J.; López-Moreno, J.I.; García, C.; Alonso-González, E.; Collados-Lara, A.-J. Hydro-Meteorological Characterization of Major Floods in Spanish Mountain Rivers. Water 2019, 11, 2641. https://doi.org/10.3390/w11122641
Morán-Tejeda E, Fassnacht SR, Lorenzo-Lacruz J, López-Moreno JI, García C, Alonso-González E, Collados-Lara A-J. Hydro-Meteorological Characterization of Major Floods in Spanish Mountain Rivers. Water. 2019; 11(12):2641. https://doi.org/10.3390/w11122641
Chicago/Turabian StyleMorán-Tejeda, Enrique, Steven R. Fassnacht, Jorge Lorenzo-Lacruz, Juan Ignacio López-Moreno, Celso García, Esteban Alonso-González, and Antonio-Juan Collados-Lara. 2019. "Hydro-Meteorological Characterization of Major Floods in Spanish Mountain Rivers" Water 11, no. 12: 2641. https://doi.org/10.3390/w11122641