An Assessment on Permeability and Grout Take of Limestone: A Case Study at Mut Dam, Karaman, Turkey


1
Department of Geological Engineering, Eskisehir Osmangazi University, 26480 Eskisehir, Turkey
2
Department of Geological Engineering, Hacettepe University, Beytepe, 06800 Ankara, Turkey
*
Author to whom correspondence should be addressed.
Water 2019, 11(12), 2649; https://doi.org/10.3390/w11122649
Submission received: 20 November 2019
/
Revised: 7 December 2019
/
Accepted: 11 December 2019
/
Published: 15 December 2019
(This article belongs to the Special Issue Planning and Management of Hydraulic Infrastructure)
Abstract
:The main purposes of the present study are to evaluate pilot grouting and to develop regression equations for prediction of grout intake. There are no permeability problems with the sandstone-siltstone-claystone alternations and basement clayey limestone at the dam site. Karstic limestone block is permeable due to karstification and heavy discontinuities. For the purpose of the study, Q system, geological strength index (GSI), secondary permeability index (SPI), joint spacing (JSP), joint apertures (Ap), Lugeon (Lu), and the permeability coefficient (k) were determined. Karstic limestone block rock mass properties correlated with grouting material amount. A series of simple and multiple nonlinear regression analyses was performed between grout take material amount (Gt) and average values of these rock mass properties. Significant determination coefficients were determined. Prediction capacity of the empirical equations were also examined with root mean square error (RMSE), values account for (VAF), mean absolute percentage error (MAPE), and prediction error evaluations. Considering simple regression analyses, the equation derived with Gt-SPI gives the best performance. The best prediction is determined with the equation derived with rock quality designation values (RQD), SPI, and joint aperture as input parameters with the multiple nonlinear regression analysis, in addition to this, other empirical equations also provide acceptable results.
1. Introduction
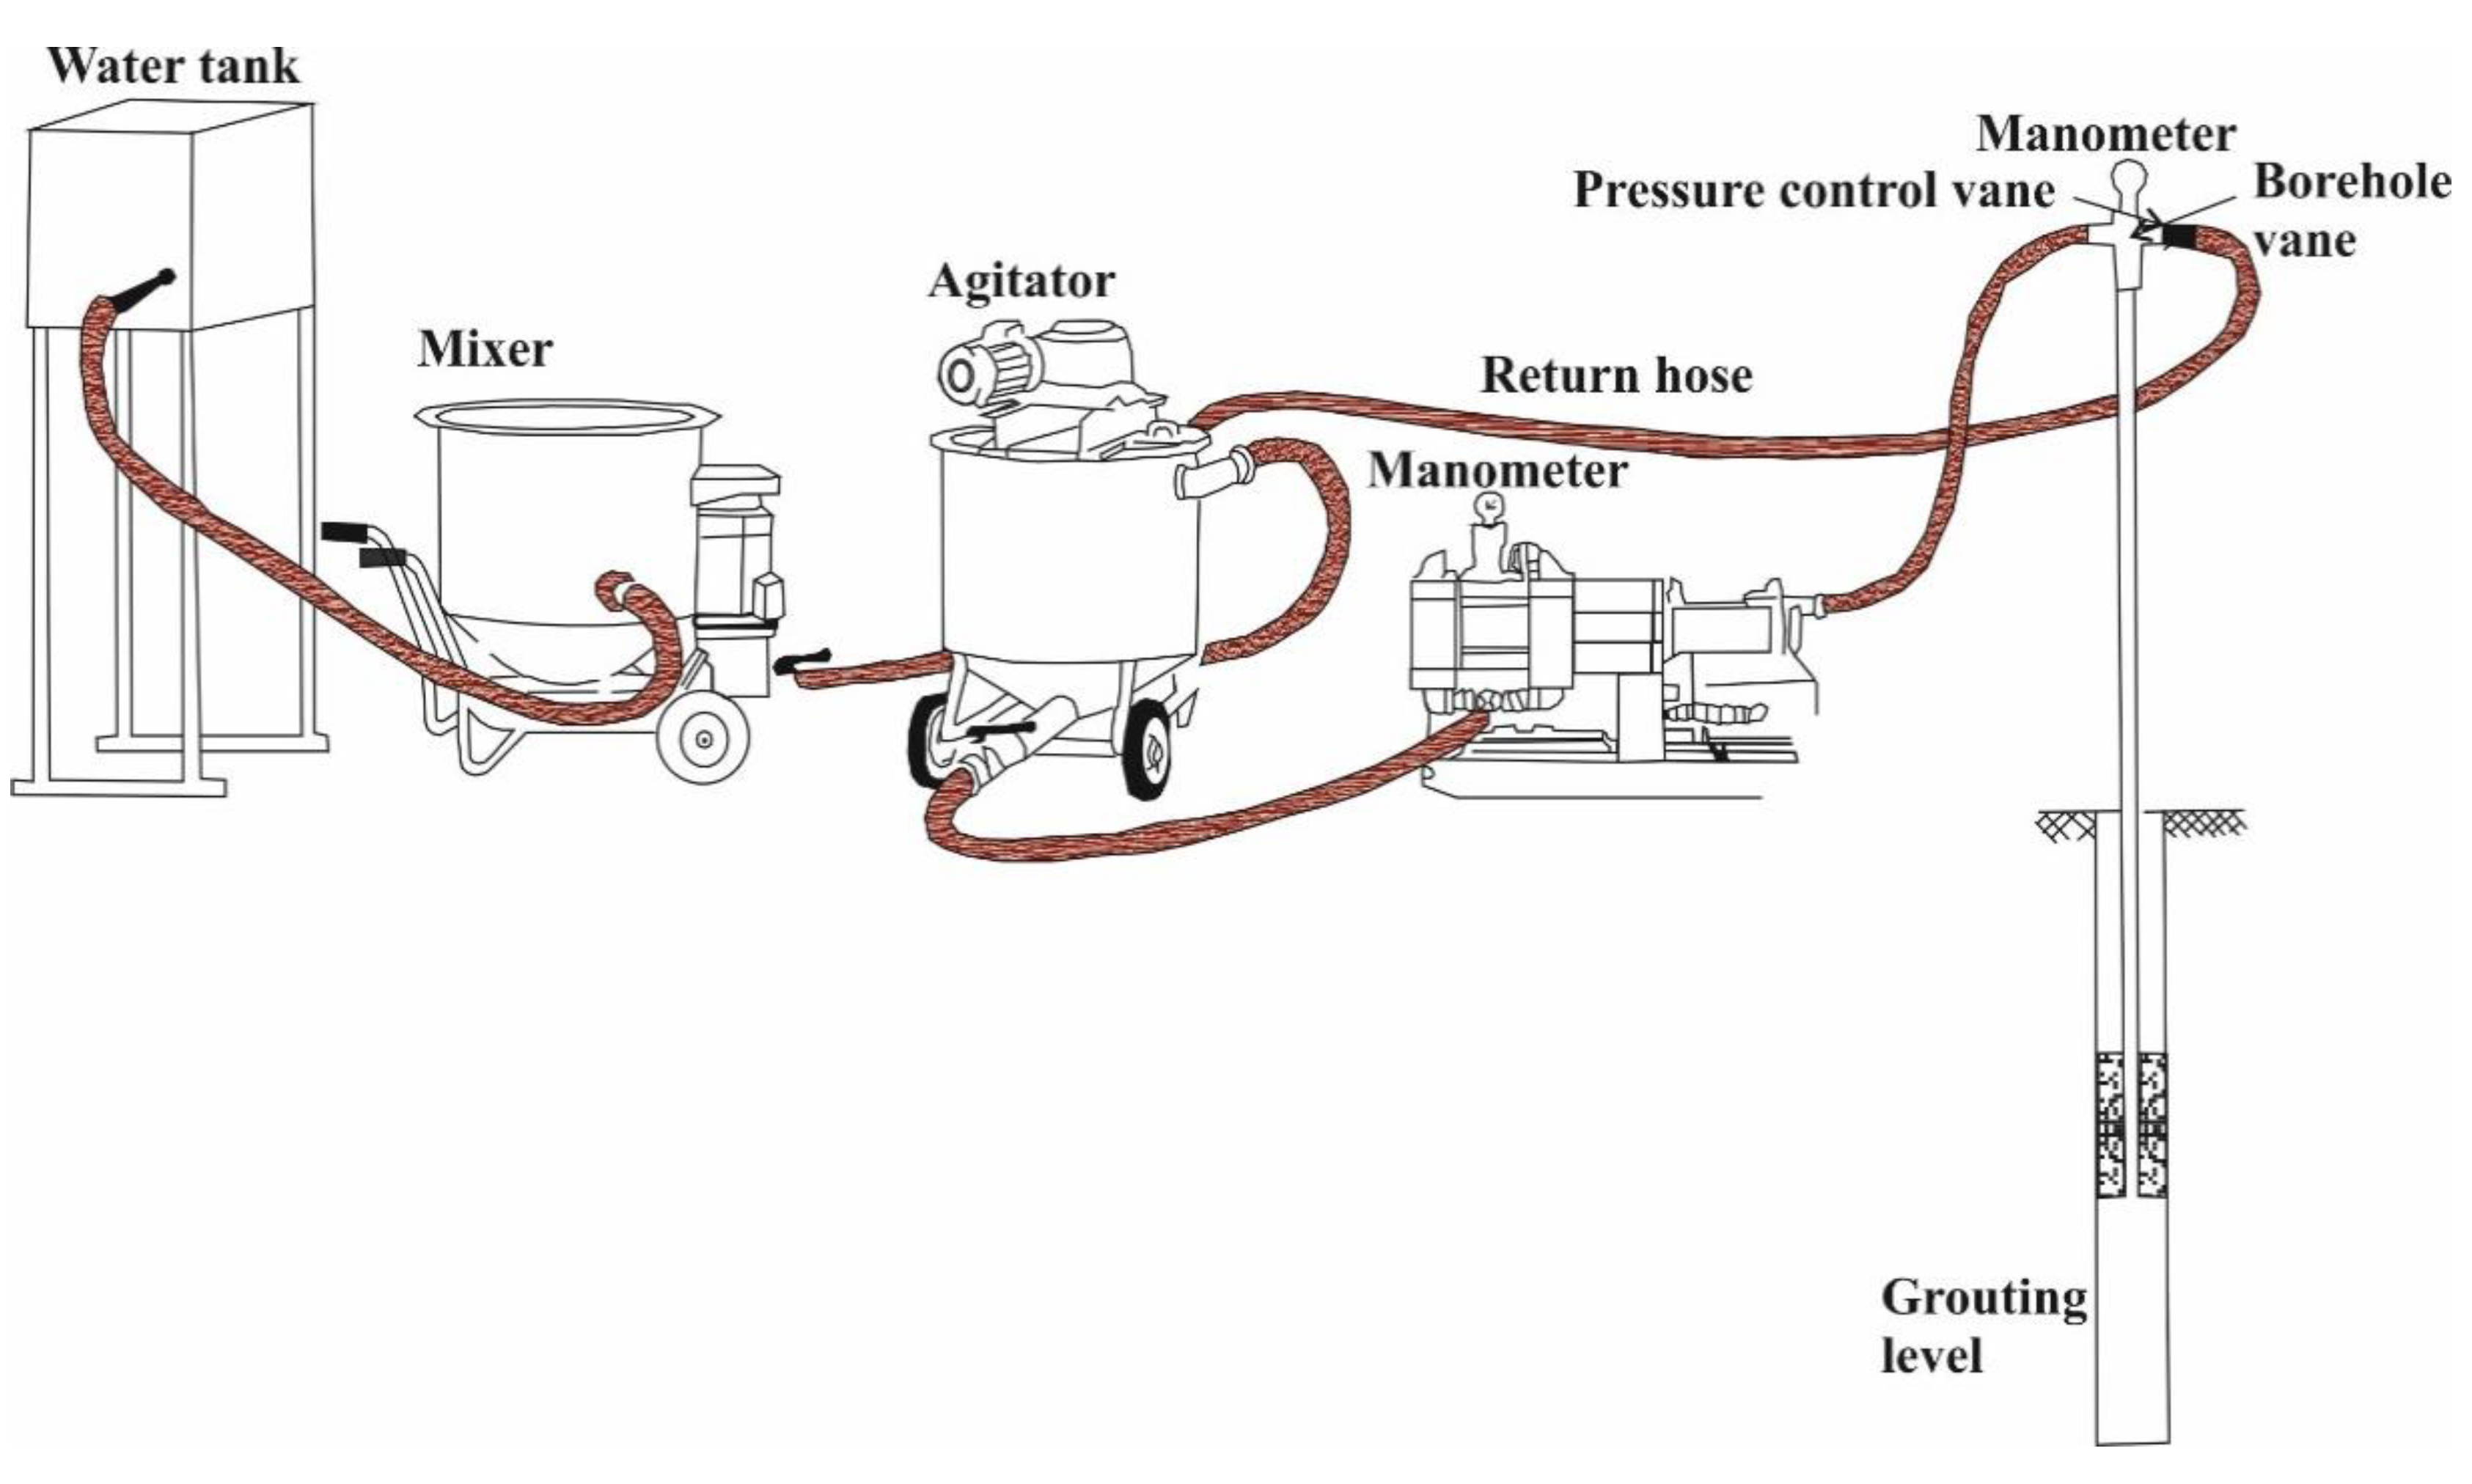
Grouting is a method of injecting cement, sand, bentonite, or chemical material with water into soil or rock masses in order to decrease permeability and increase foundation material strength. Grouting equipment are summarized as follows: water tank, mixer, agitator, grouting pump, related manometers, transmission hoses, drilling machine, and equipment (Figure 1). Increasing strength and permeability of foundation rock masses are the main purposes of grouting [1].
Rock mass permeability is an important subject for engineering projects. Lugeon [2] developed a method named the Lugeon test that determines the transmissivity of rock. Lugeon (Lu) is equal to 1 L of water per minute injected into 1 m of borehole under 10 atmosphere pressure. If the test results in less than 1 Lugeon, rock mass is impermeable, 1–5 Lugeon means rock mass is slightly permeable, 5–25 Lugeon means permeable, and >25 Lugeon means highly permeable. The relationships between rock mass properties and grouting have been studied by numerous researchers. Foyo et al. [3] suggested a rock mass quality which is defined as a Secondary Permeability Index. Gürocak et al. [4] evaluated the permeability of Atasu dam site (Trabzon—Turkey) lithologies and the maximum depth of grout injection considering the methods of [5,6,7,8] based on the values obtained from Lugeon tests. Investigators determined that the depth of the injection should be taken as 50 m for the left and right slopes and 40 m for the river bed. Uromeihy and Farrok [9] studied groutability at the Kamal-Saleh dam. They compared rock mass rating (RMR) and geological strength index (GSI) systems with Lugeon tests. They also suggested that rock quality designation values (RQD) had a direct relationship with Lugeon values. Azimian and Ajolleian [10] described relationships between Lugeon and secondary permeability index in Nargesi and Cheshmeh-Assheg dam sites and suggested an empirical equation for correlation secondary permeability index (SPI) and Lugeon methods. Sadeghiyeh et al. [11] compared permeability and groutability of the Ostur dam site rock mass for a grout curtain site. Investigators correlated secondary permeability index, rock quality designation, and cement take at the dam site and suggested that the areas with diverging trends required no treatment and that those with converging trends required heavy treatment. Qureshi et al. [12] suggested an empirical relationship between permeability and RQD discontinuous sedimentary rocks. However, the aperture, extent, and orientation of discontinuity are limiting factors for the empirical relationship. Kayabasi et al. [13] produced ANFIS (adaptive neuro-fuzzy inference system) modeling to determine rock mass permeability. A dataset including 453 cases with Lugeon test results and corresponding rock quality designation (RQD), spacing of discontinuities and surface condition rating (SCR) properties is employed. The results of Kayabasi et al. [13] show that the models developed are reliable enough and, if there is no direct test result, these models can be used in engineering projects. Sohrabi et al. [14] correlated the grout volume with the Q-value, Lugeon number, SPI value, and joint apertures in Bakhtiri dam site in Iran. They defined a general correlation with mentioned parameters and grout take (Gt). Farid and Rizvan [15] obtained correlations between the values of the RQD and in-situ permeability of limestone rocks of different sites spread all over the Riyadh region of Saudi Arabia. Their study had showed that good quality limestone rock masses have very low permeability.
Estimation of grouting material is extremely important. For this purpose, some empirical equations were used. However, the validity of empirical equations depends on several factors, especially engineering properties of rock mass. For this reason, the main targets of the study are to develop new empirical equations for the estimation of amount of grout intake and to discuss uncertainties sourced from the complexity of rock masses and validity of the empirical equations for engineering purposes. For the purposes of the study, permeability of lithologies outcropping at Mut dam site was studied with a pilot grouting at first. Results obtained from seven boreholes opened in the area were used. RQD, Q system classification, GSI, joint spacing, joint aperture, SPI, and permeability of lithologies was investigated in pilot grouting. A karstic limestone block was determined as highly permeable. All data were evaluated for each 5 m range. Then Gt and determined these rock mass properties correlated with simple and multiple nonlinear regression analyses and a series of empirical equations were derived.
2. Geographical and Geological Characteristics
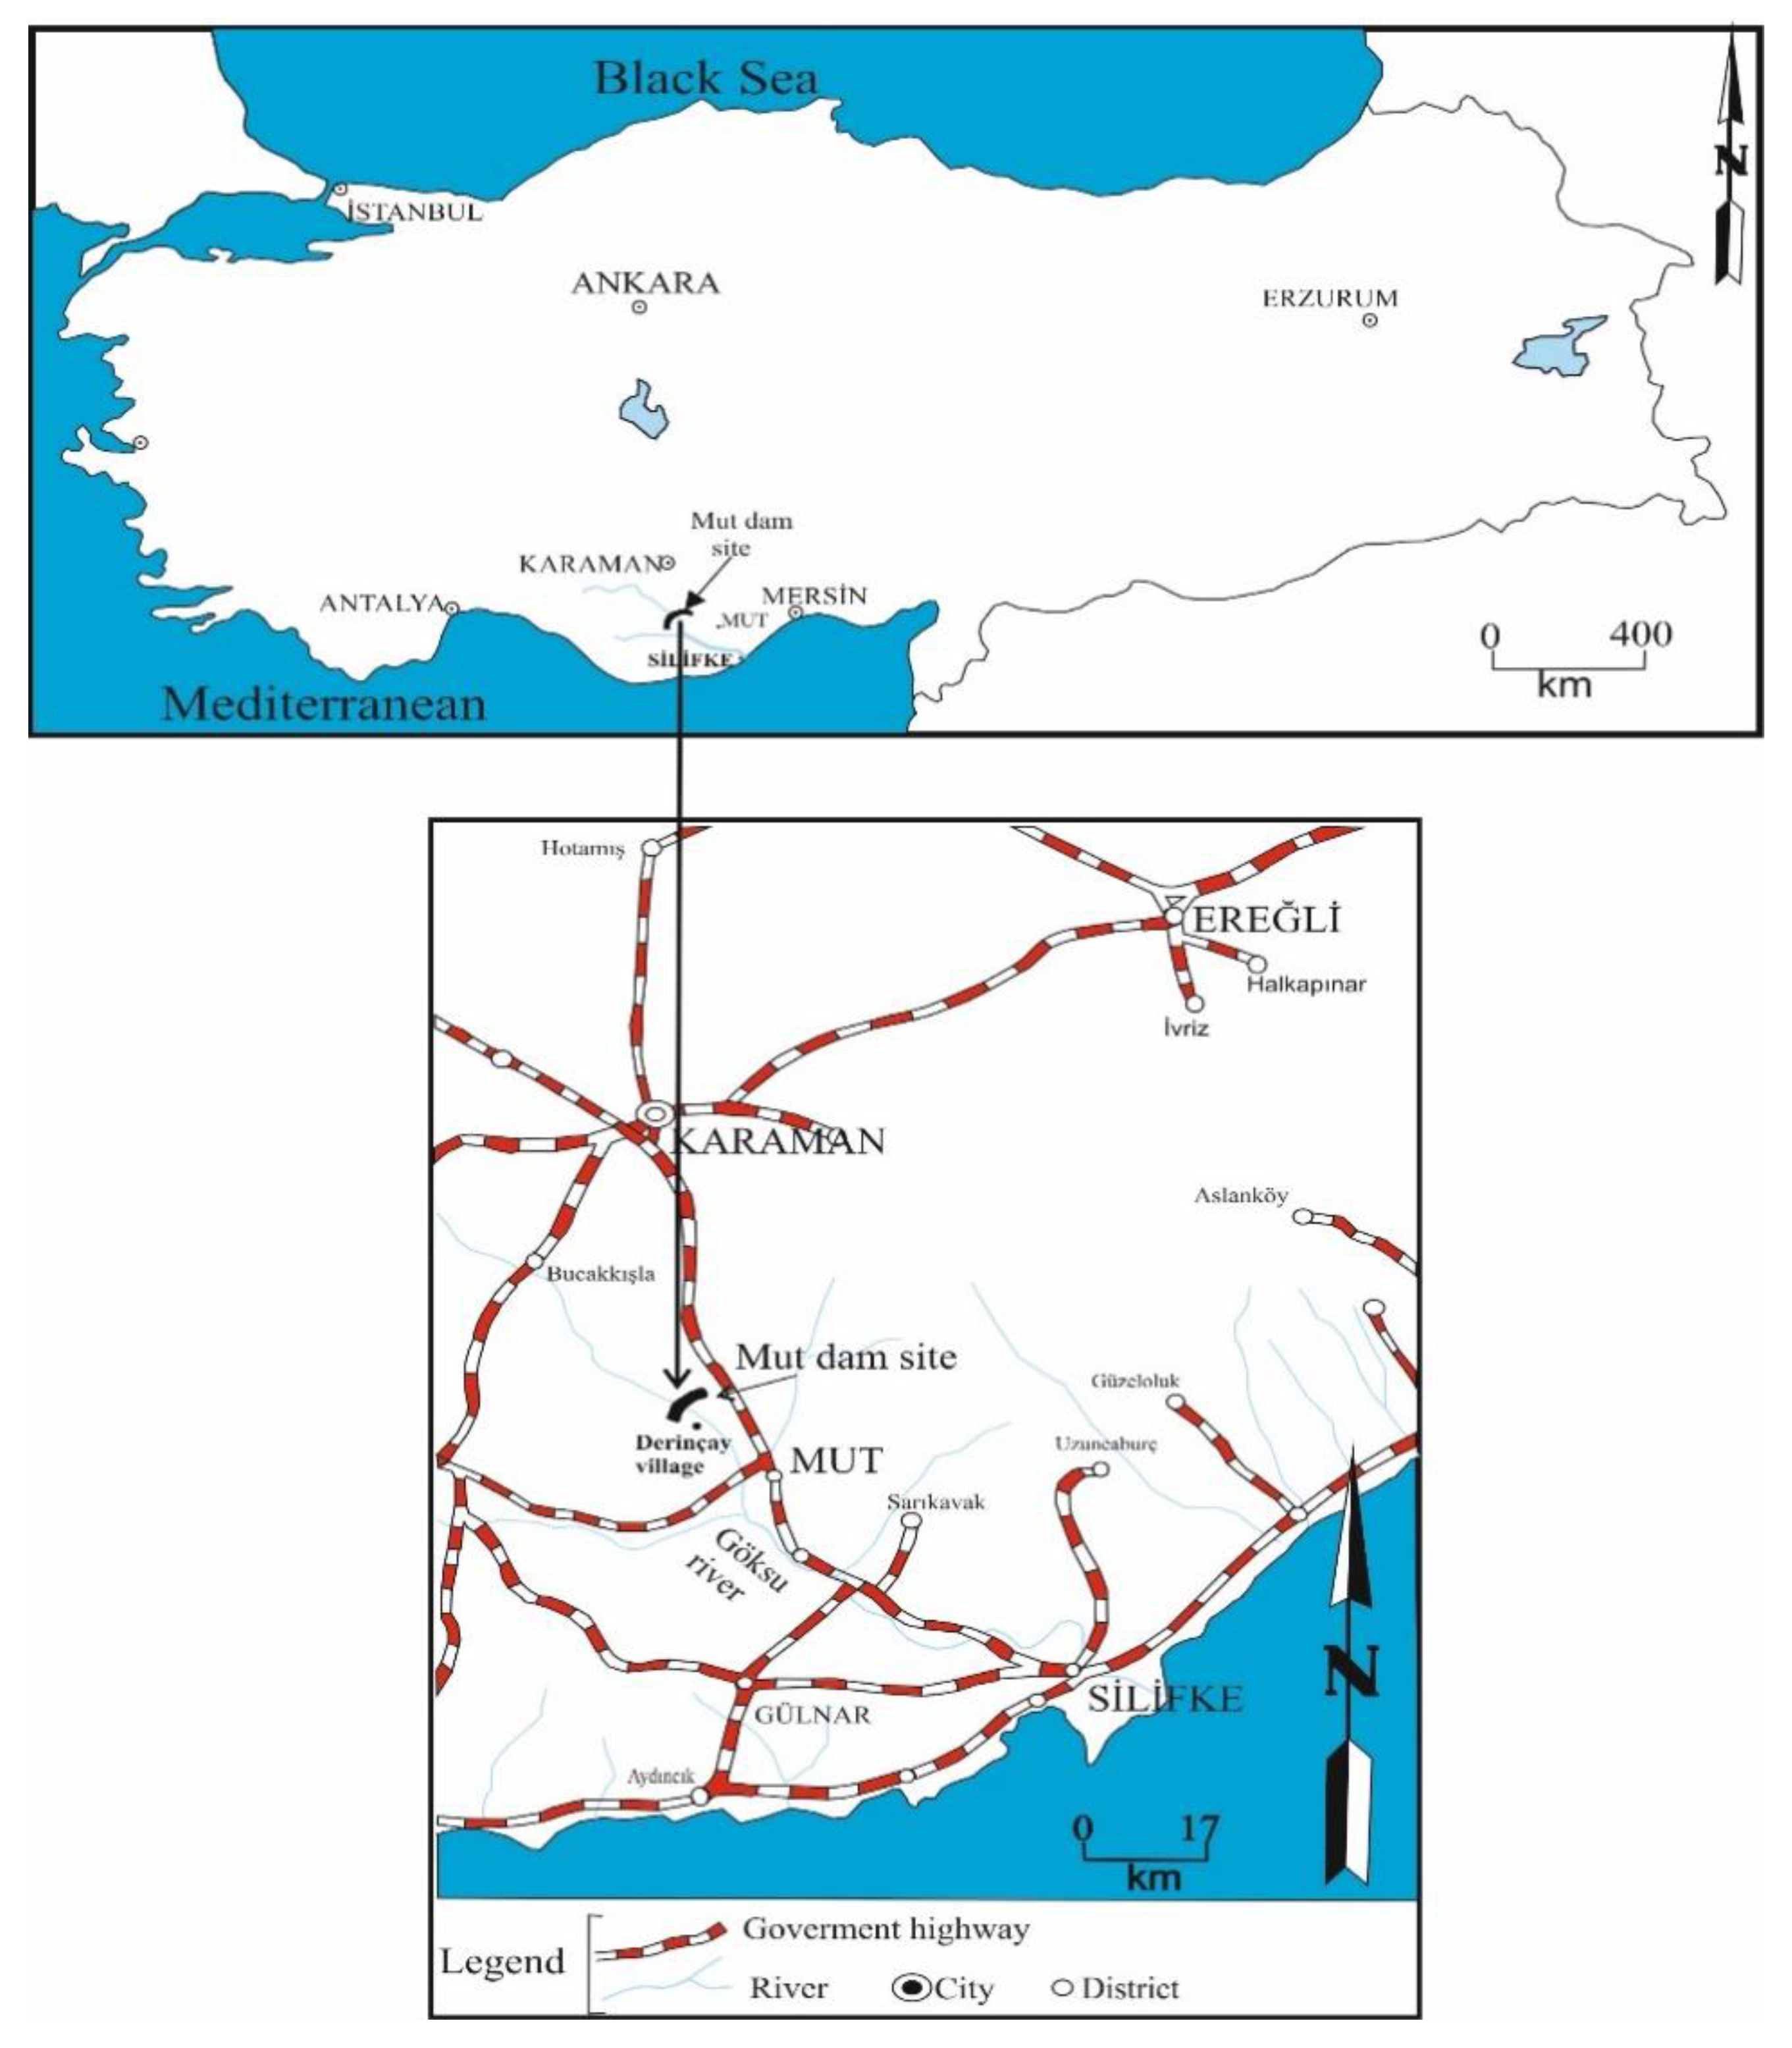
The dam site that is the focus of this study is located near Derinçay village in the Mut district of Mersin city in Turkey. Mut district is located 160 km southwest of Mersin city. Derinçay village is located 18 km northwest of the Mut district. Mut dam is 6 km northwest of Derinçay village. The dam site can be accessed via a stabilized road from Derinçay village (Figure 2).
The Mersin-Mut region has a typical Mediterranean climate that is hot with little rain in the summer and cold and rainy in the winter. According to measurement between 1940 and 2018, the total highest precipitation average occurs in December at 136.6 kg/m2 and the driest month is August, with an average precipitation of 4.1 kg/m2 [16].
The Mut dam is projected on the Göksu river. The source of the Göksu river of 260 km length is the Taurus mountains and discharges into the Mediterranean Sea, 16 km southwest of the Silifke (in Mersin province). The Mut dam is designed as a rockfill type dam. The height of the dam is 113 m from talveg elevation. Planned power capacity of the Mut dam is 91 MW. Detailed information about the Mut dam project is given in Table 1 [17].
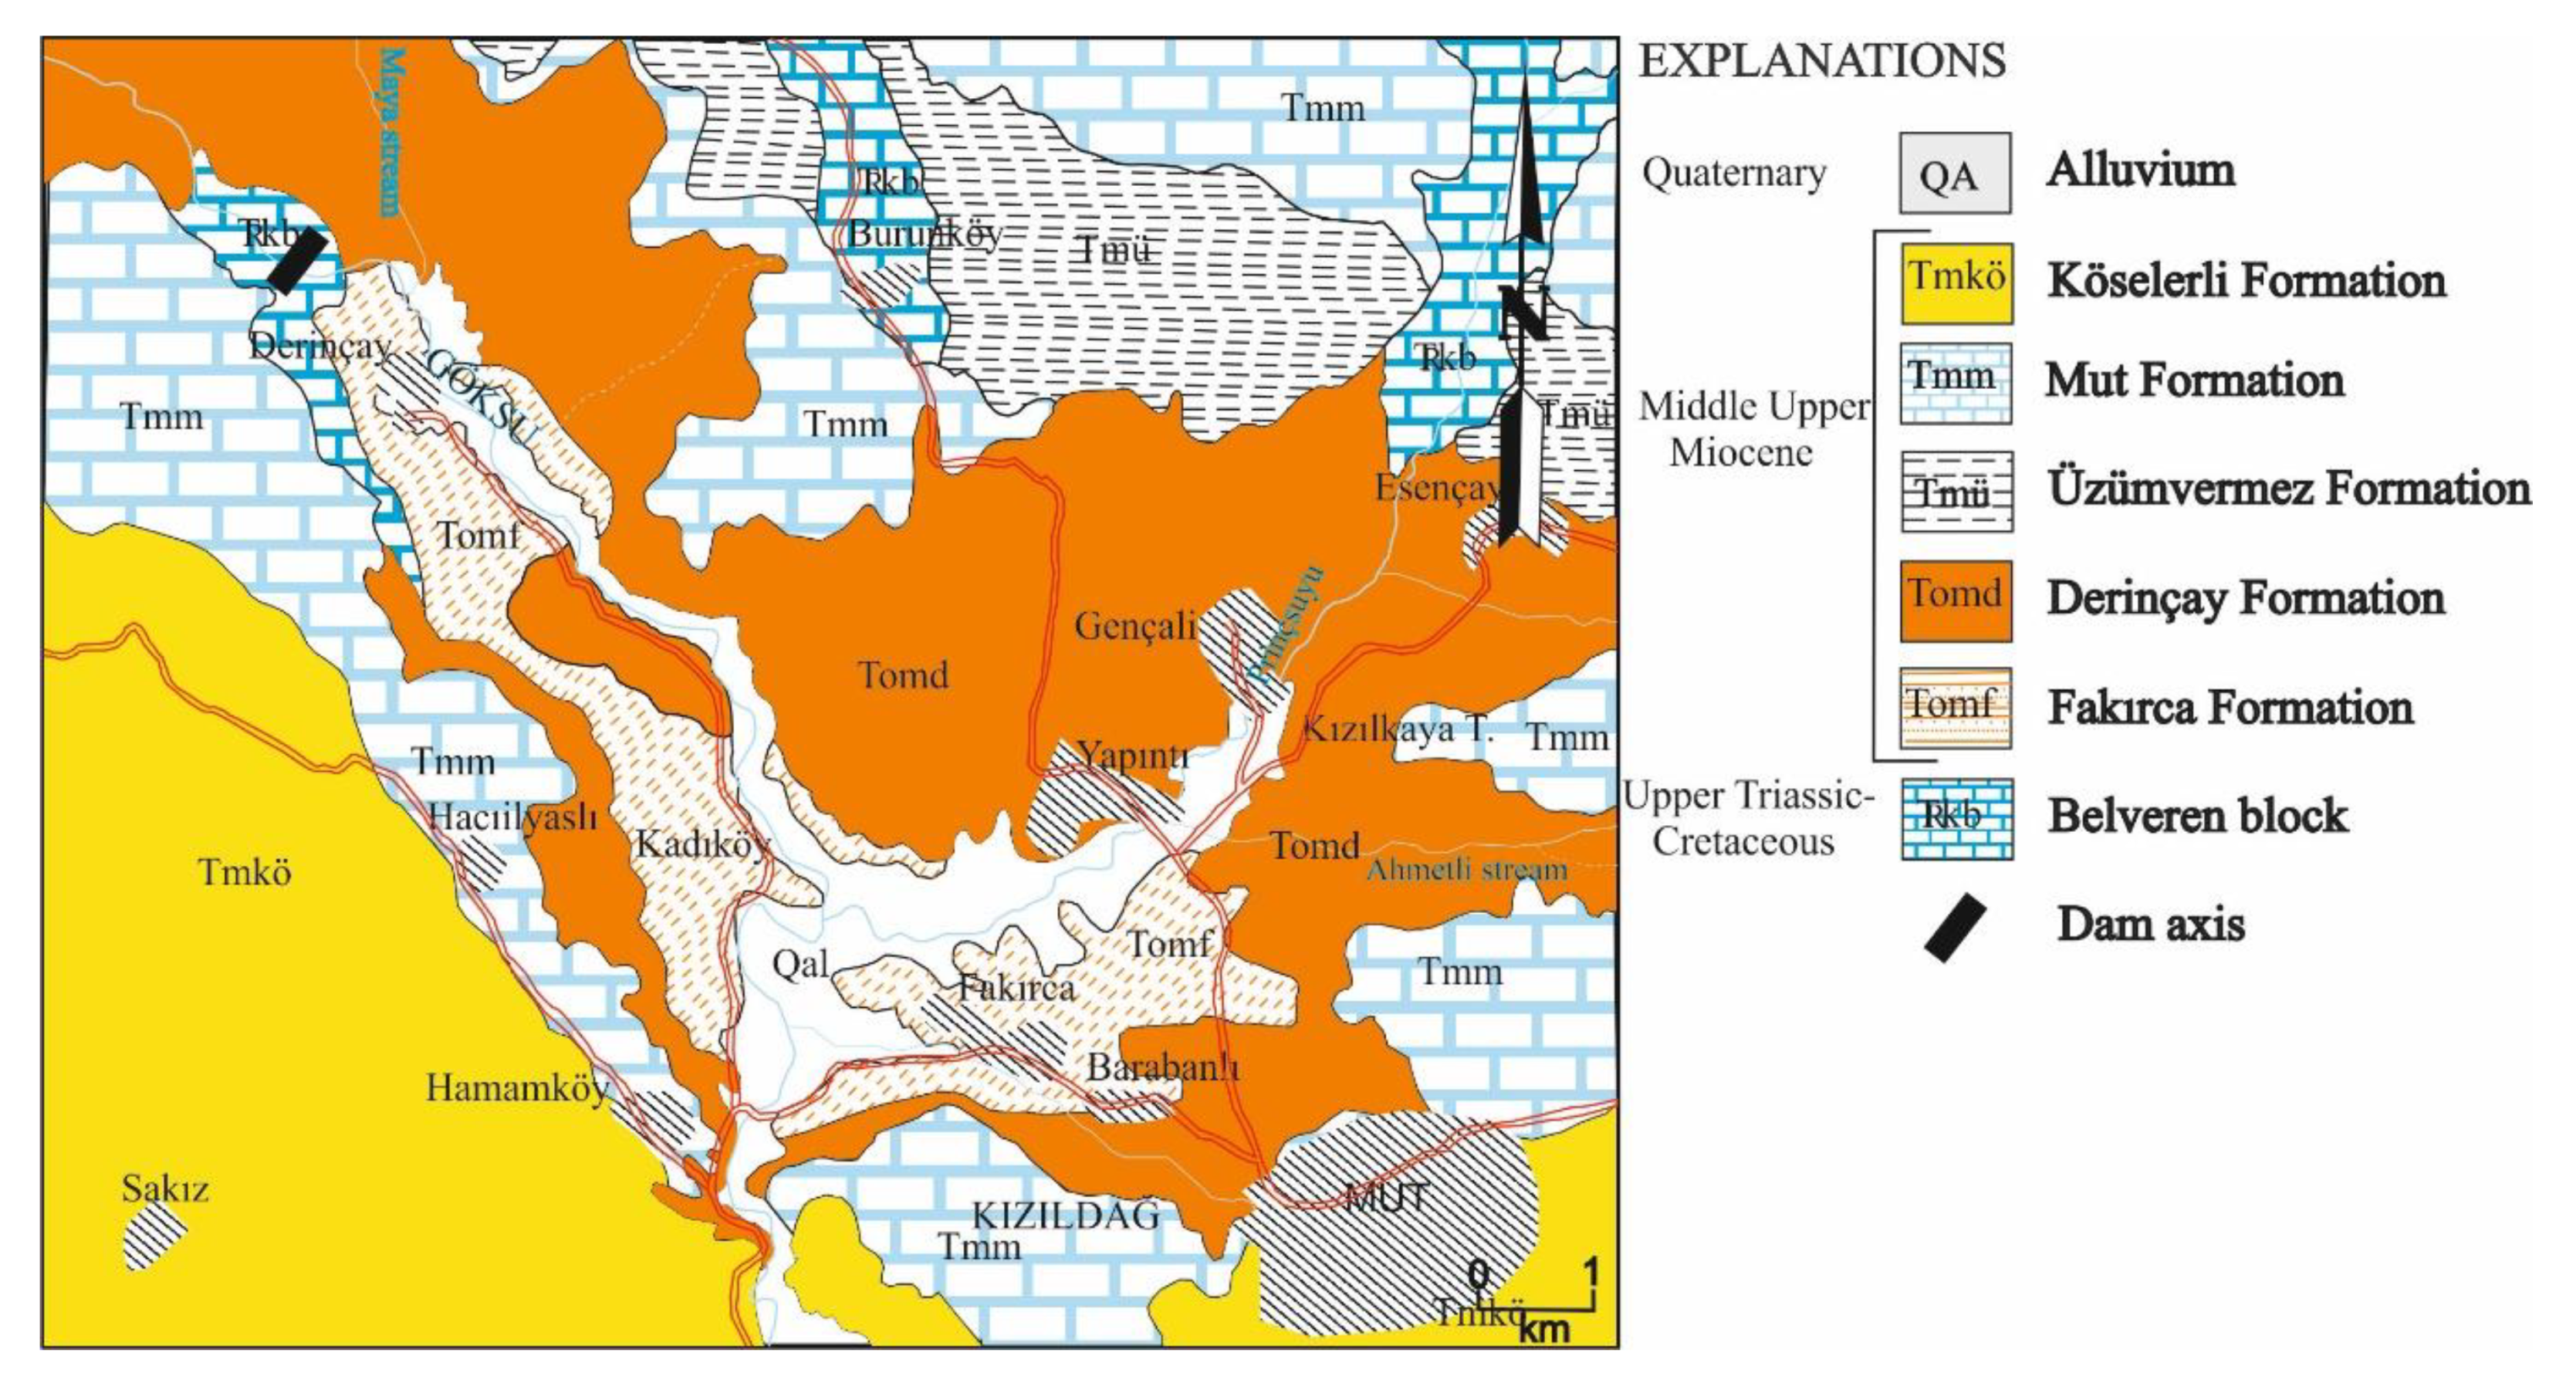
Previous studies identified three formations at the dam site. These formations from top to bottom are Belveren limestone block, Derinçay formation, and Fakırca Formation. The generalized description and the depth of the lithological units cut along the boreholes could be summarized as follows: 0.00–16.00 m: Slope debris, 16.00–72.50 m: Karstic limestone (Ʀkb: Belveren limestone block), 72.50–147.45 m: Sandstone-siltstone-claystone alternations (Tomd: Derinçay Formation), 147.45–170.00 m: Clayey limestone (Tomf: Fakırca Formation). The oldest rock mass at the Mut dam site is the Middle-Upper Miocene aged clayey limestone named Fakırca Formation [18]. Fakırca Formation underlies the ophiolitic melange. Fakırca Formation thickness is about 50–150 m. This clayey limestone rock mass is massive, thinly bedded, yellowish white colored, and outcrops along the Göksu river banks (Figure 3). The clayey limestone that is the basement lithology drilled at boreholes has a fine crystallized structure, thinly bedded, discontinuity spacing is between 15 and 20 cm, joints are tight, and the average RQD value is 70%. Fakırca Formation is impermeable.
Sandstone-siltstone-claystone alternations (Tomd) were deposited over the Fakırca Formation (Tomf) concordantly. Sandstone-siltstone-claystone alternation was named as the Derinçay Formation (Tomd) by Gedik et al. [19]. This formation is impermeable and about 150–200 m thick. This unit outcrops at the reservoir area and downstream side of the Mut dam site. The exploration boreholes showed that this formation has a thickness of approximately 40–50 m along the dam axis and lies horizontally and thinly bedded, brownish gray, dark greenish gray colored, and bears ophiolitic grains (Figure 4). Discontinuity spacings of this unit vary between 5 and 10 cm and discontinuity surfaces are iron oxidized, very thinly bedded, the average RQD value is 30%, and they are highly weathered.
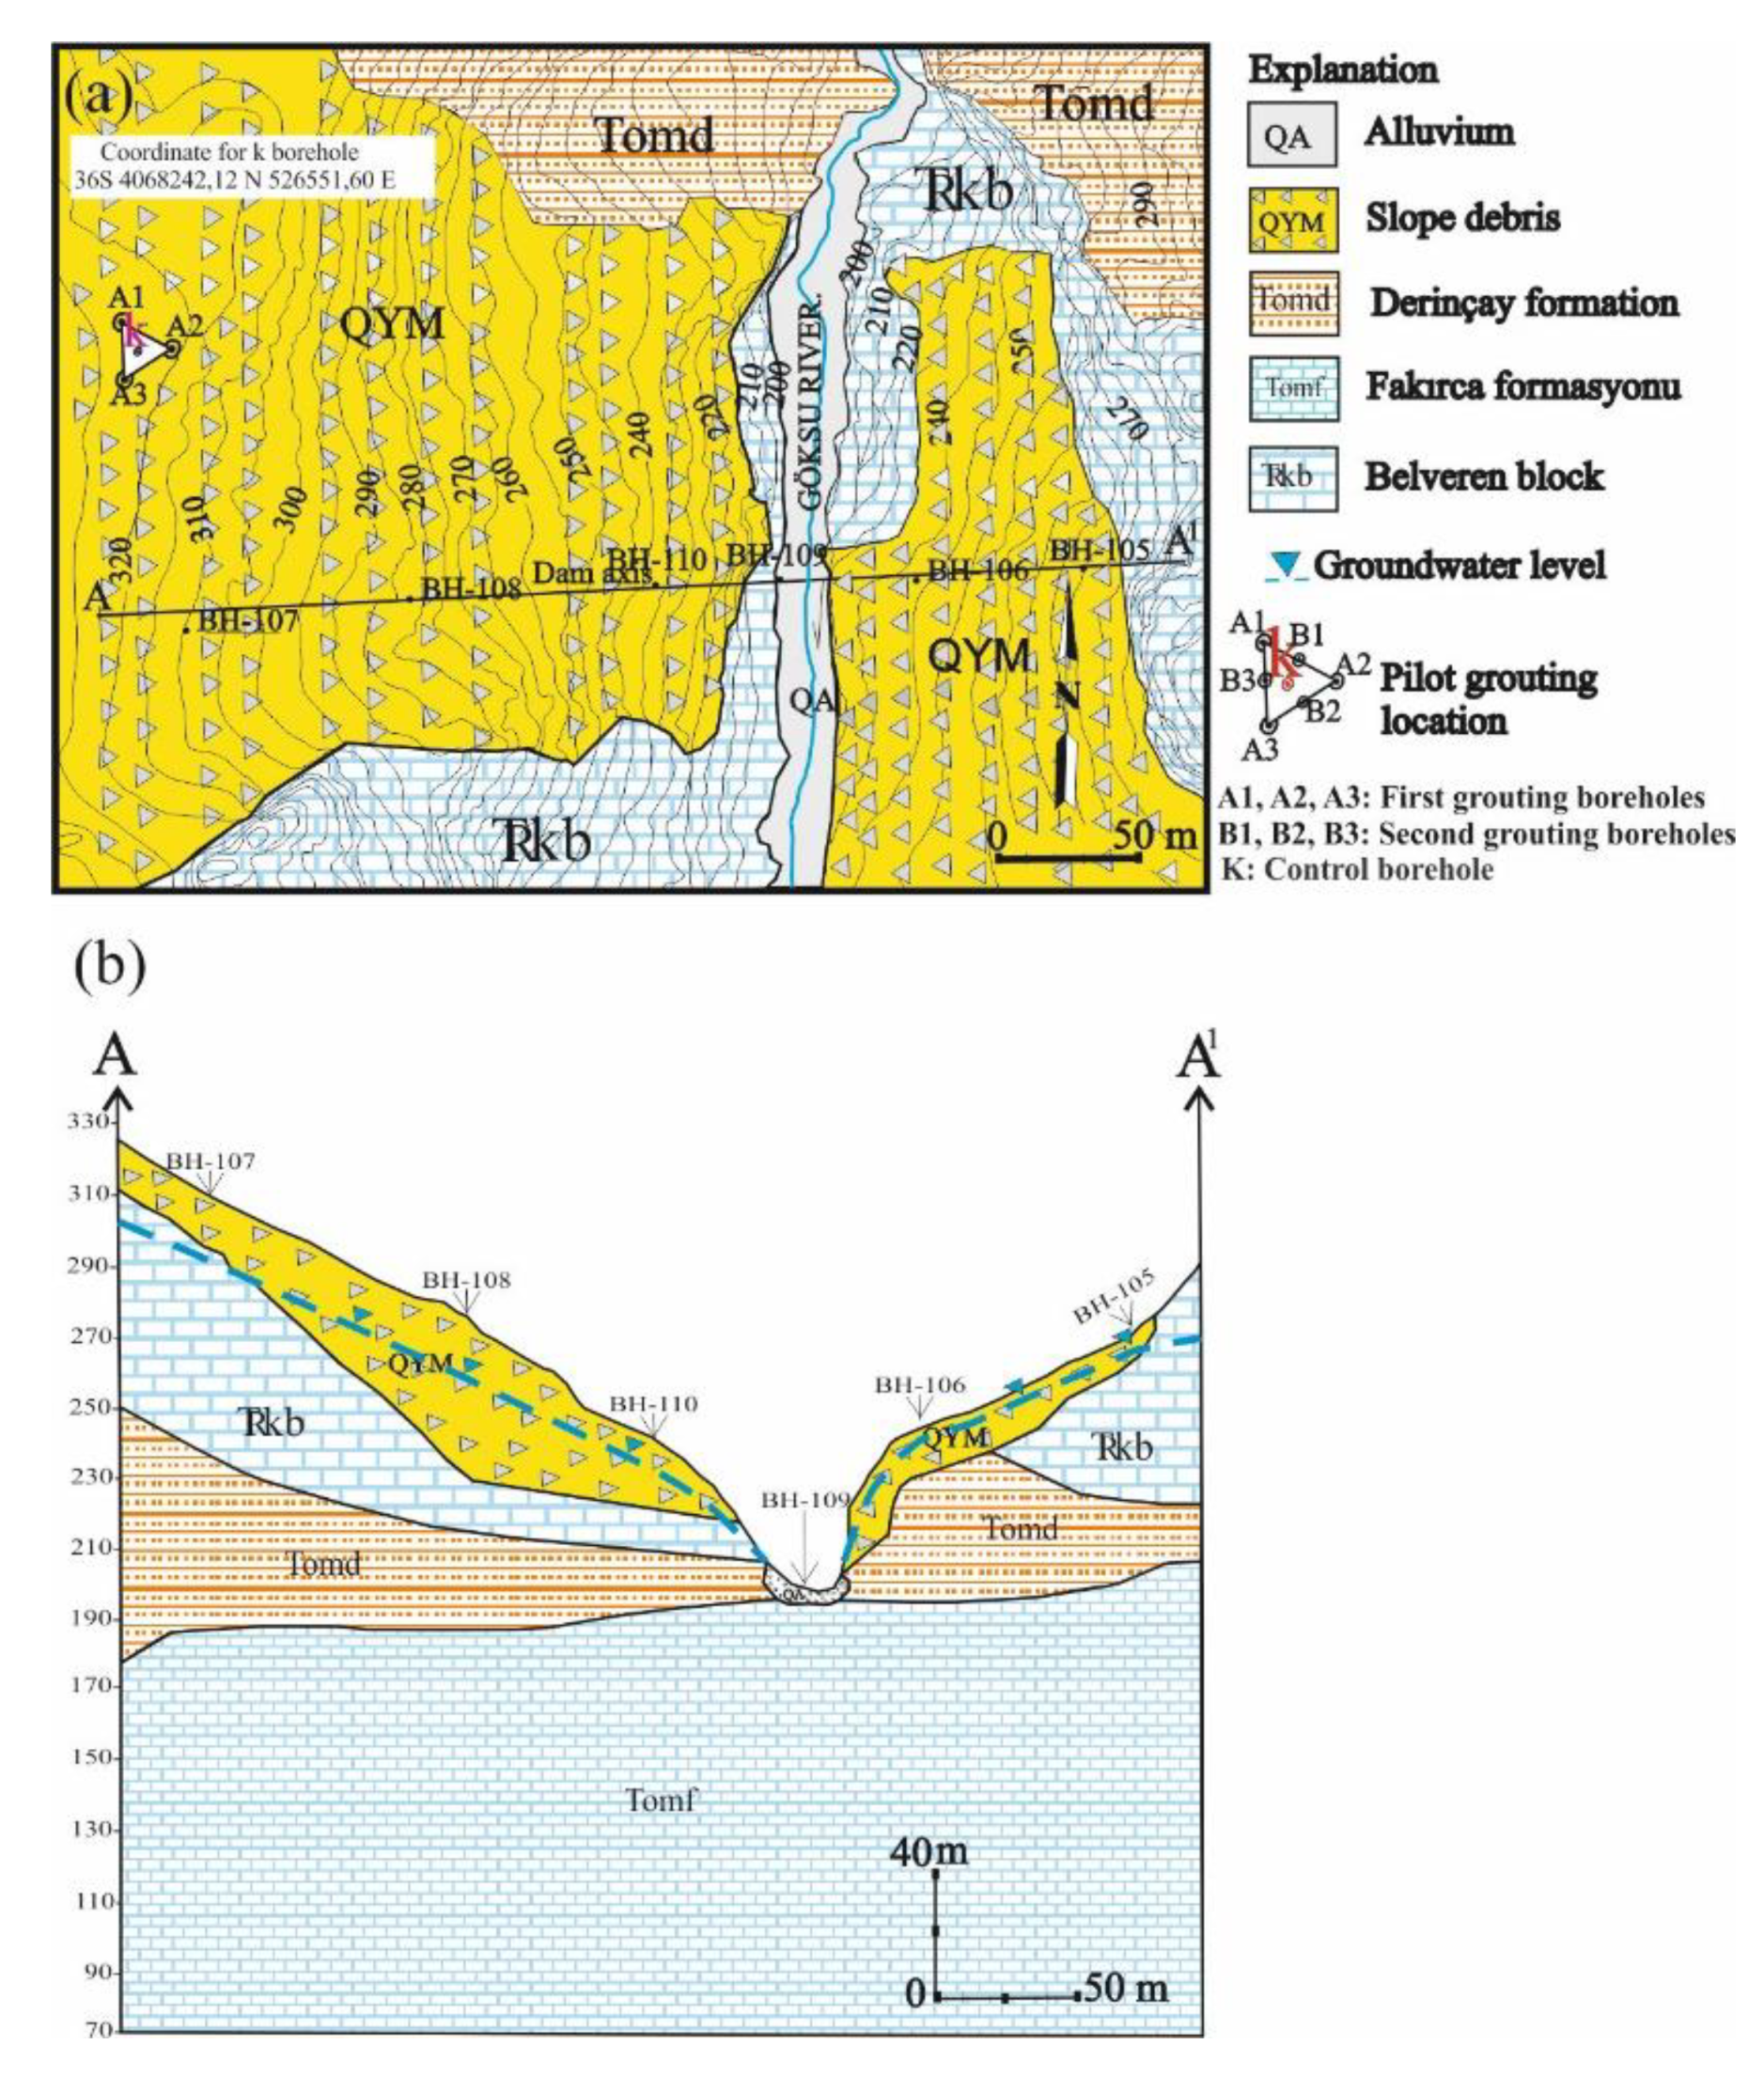
Jurassic-Lower Cretaceous aged, dirty white-cream colored limestone block lies over the Sandstone-siltstone-claystone alternation tectonically and allocthonous. This limestone block was named as the Belveren Block by Dalkılıç and Balci [19]. According to previous studies these types limestone blocks were transported by gravitational forces at Miocene age. These limestone blocks underlines paleogene aged deposits but surrounded by Miocene aged units [18,19,20]. One of these limestone blocks outcrops extensively at the dam site. Limestone block is karstic and permeable. The thickness of this limestone block is about 100 m along the region. The exploration boreholes (BH-105, BH-106, BH-107, BH-108, BH-109, BH-110) drilled at the dam axis show that the Belveren limestone thickness is changing between 20 and 60 m. It is light gray, pinkish colored. The discontinuities are very closely spaced, iron oxidized, and clay plastered. Discontinuity surfaces are roughly surfaced (RS) and very roughly surfaced (VRS). Poor to good quality RQD is observed, mainly slightly weathered. The investigation of the Belveren limestone block permeability is the main subject of this paper.
Slope debris at the dam site and alluvium along the Göksu river are Quaternary deposits. Slope debris is about 30–40 m thick at the right side of the dam site. Slope debris consists of white, gray, and yellowish colored limestone blocks and gravel. The maximum block size is 17 cm but gravel and fine grained sized materials are dominant. Grains are rounded-subrounded. Alluvial deposits of the Göksu river are about 5–6 m thick and particles originate from limestone.
3. Methodology
Location of the pilot grouting boreholes was selected according to dam site topography, geological and geotechnical structure, and easiness of transportation of the grouting system. Considering these factors, the right dam embankment of the dam axis was selected for pilot grouting. Location of pilot grouting boreholes is given in Figure 4. The length of triangle sides was selected as 2.5 m. First, control borehole K was drilled at the center of the equilateral triangle and Lugeon tests were performed. K borehole was filled with clean sand. A1, A2, and A3 boreholes were drilled at the corner of the equilateral triangle. A series boreholes and the K borehole depth were 170 m. First grouting was performed in A series boreholes. Grouting performance was not accessed in A series boreholes, hence a second series of boreholes were drilled and labelled as B1, B2, and B3 boreholes. The depth of B series boreholes was 80 m. In total, 895 m were drilled for pilot grouting. The distance of the A series of boreholes from K borehole was 1.45 m whereas the distance of the B series borehole from K borehole was 0.70 m. In total, seven boreholes were drilled.
4. Lugeon Tests
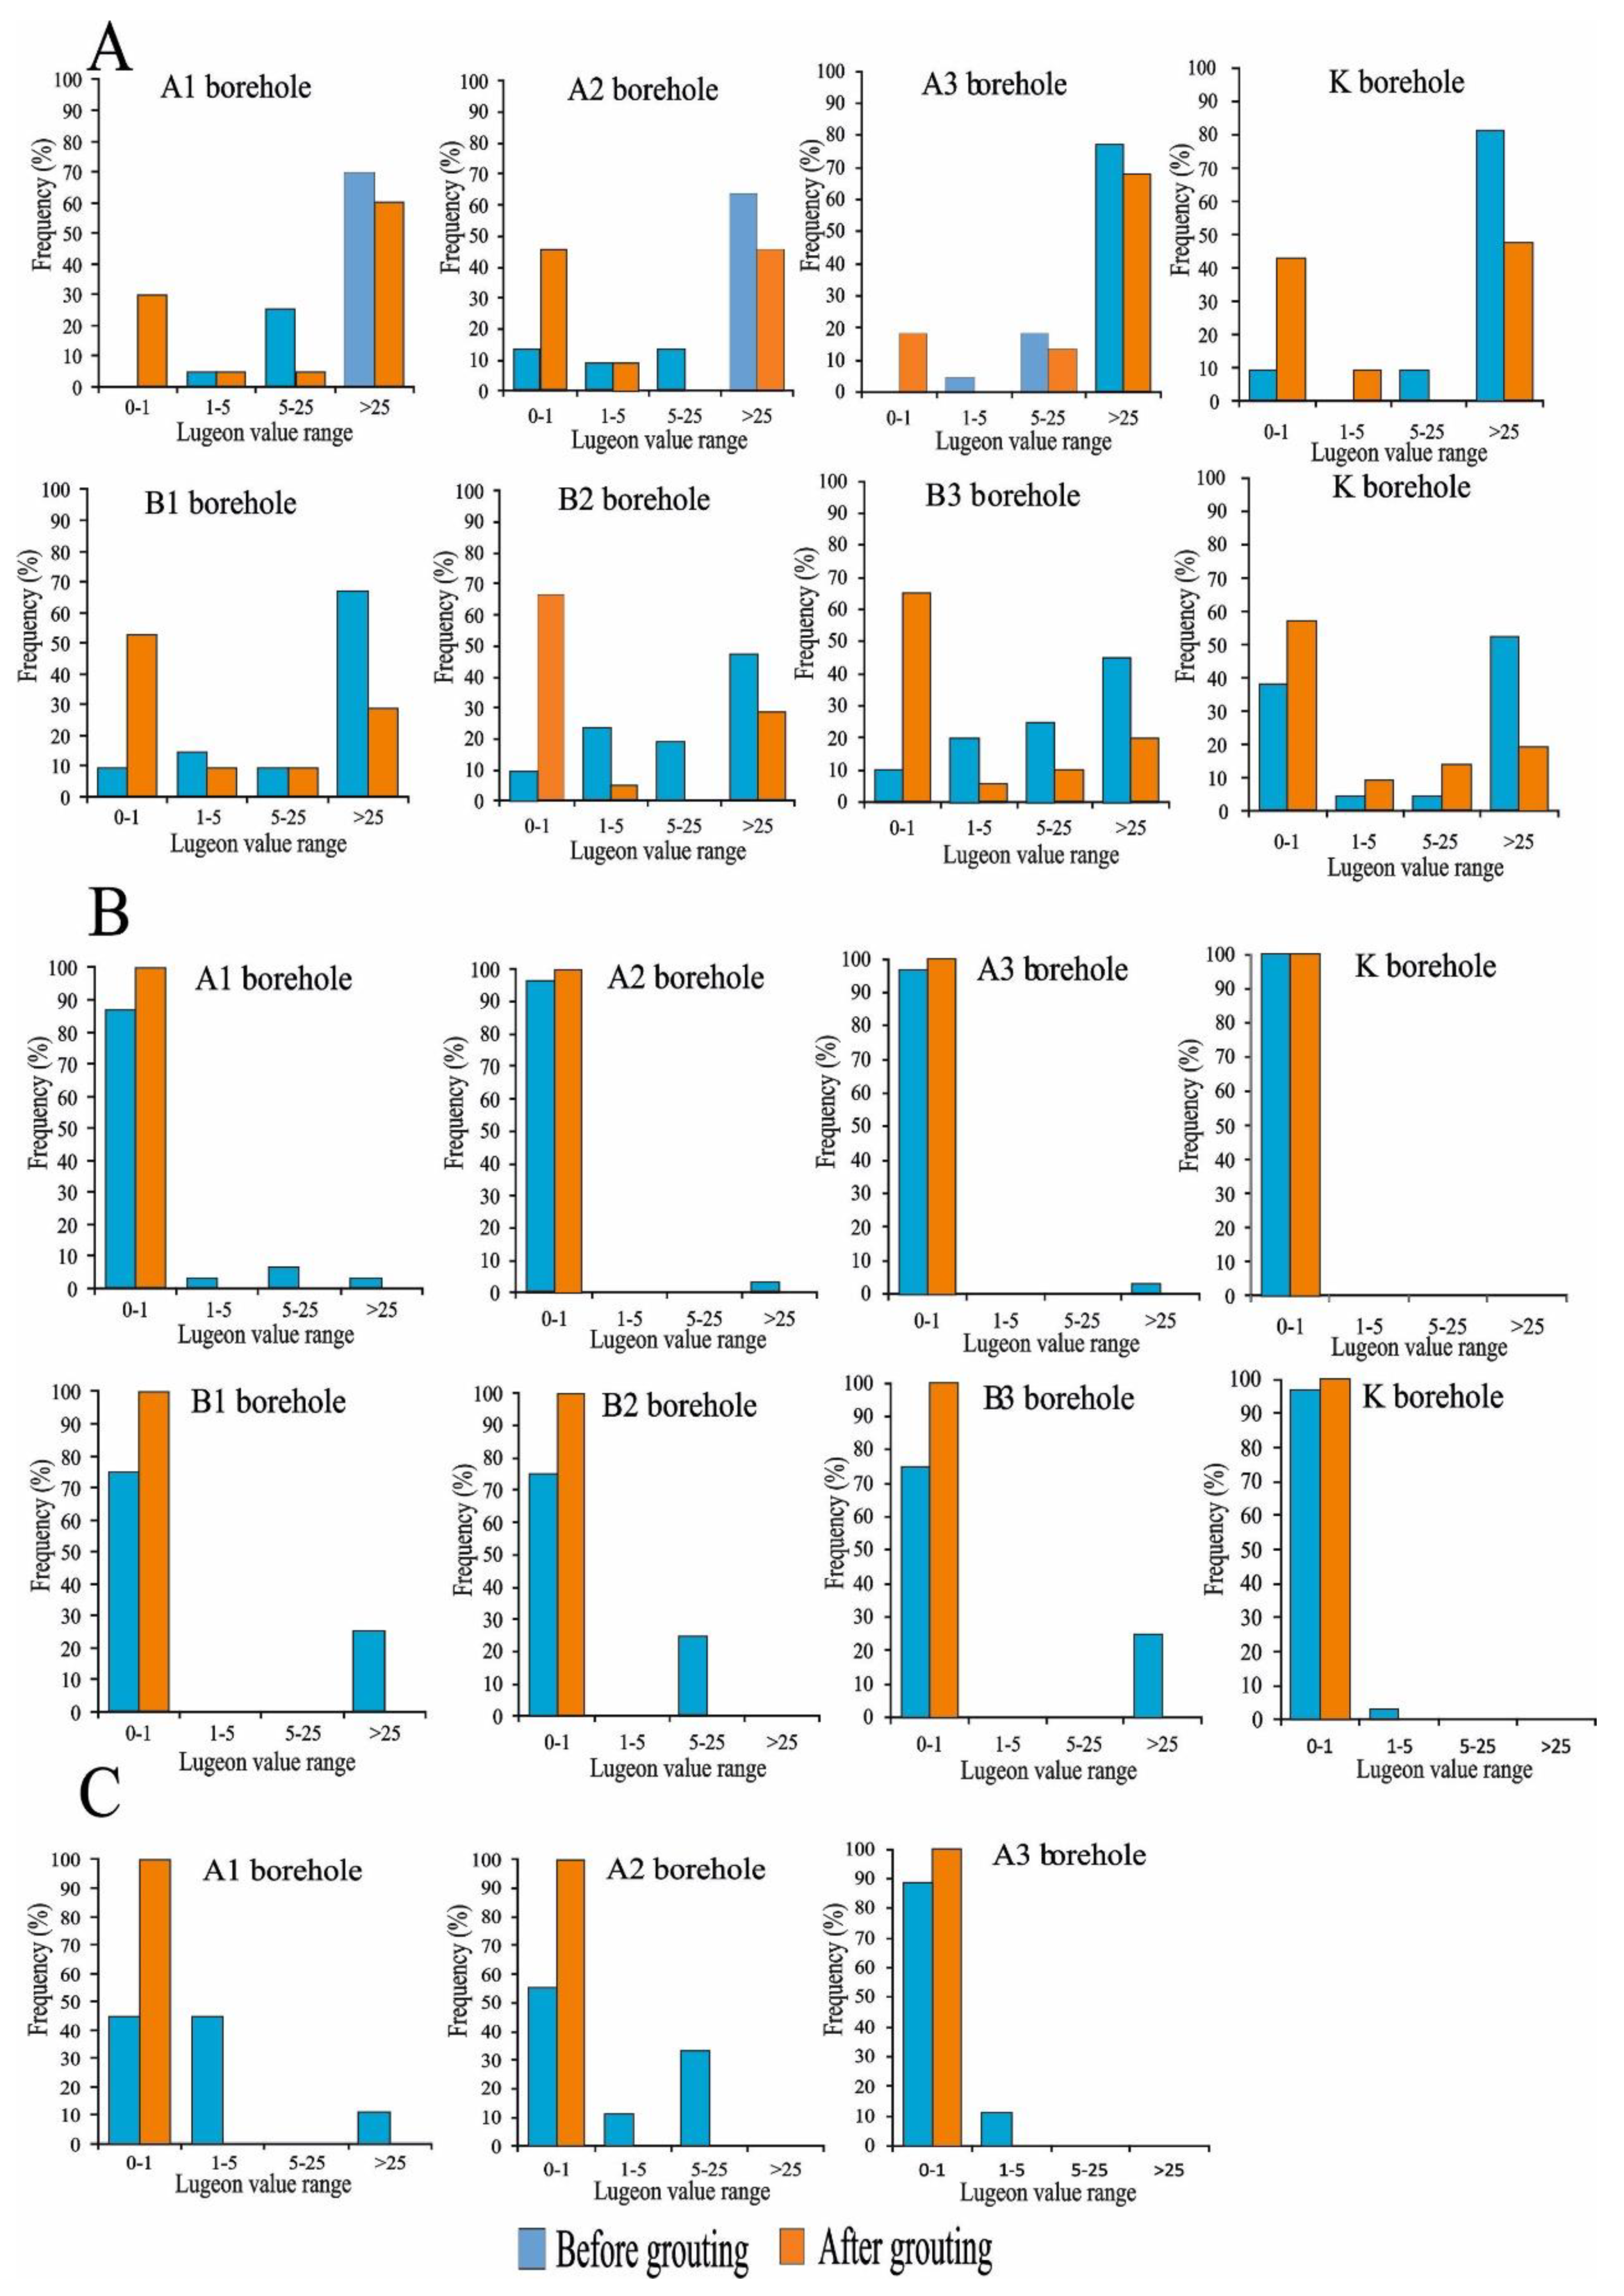
The Lugeon tests were performed in boreholes at 5 m testing intervals. Testing pressures were applied 3-6-8-6-3 atm under 10 m depth and 3-6-10-6-3 atm over 10 m depth. First Lugeon tests were performed during drilling with a single packer test method. After test levels were drilled, the borehole was washed, and the packer swelled with a hydraulic pump at the top of the test level. Refusal condition was 1 L or less amount of grout material injection in 1 min under anticipated grouting pressure. After grouting, all the Lugeon tests were performed without discrimination of refuse levels. If the Lugeon test result was lower than 2 Lugeon, grouting was not repeated, but if the Lugeon test result was higher than 2 Lugeon, grouting of this depth was repeated. The Lugeon tests were performed before and after grouting in order to determine performance of grouting. A total of 46.4% of the total tests were performed in karstic limestone, 46.1% were performed in sandstone-siltstone-claystone alternations, and 7.5% of the total tests were performed in clayey limestone before and after grouting. Figure 5A shows the frequency distribution of permeability results of karstic limestone block in A series boreholes and control borehole K. All of the test results performed before grouting are greater than 1 Lugeon in A1 borehole, whereas after grouting 30% of the test results are lower than 1 Lugeon. A total of 13.6% of the Lugeon tests results are lower than 1 Lugeon before grouting, whereas after grouting the percentage of tests greater than 1 Lugeon increased to 45.5% in borehole A2. None of the Lugeon test results were lower than 1 Lugeon in A3 boreholes before grouting. After grouting in A3 boreholes, the test result percentage lower than 1 Lugeon is 18.2%. The 9.5% of the Lugeon tests are lower than 1 Lugeon in control K borehole before grouting. After grouting, the tests result percentage lower than 1 Lugeon increased to 42.9% in control K borehole. The frequency distribution of permeability results of karstic limestone in B series boreholes and control borehole K are summarized as follows: 9.5% of the tests are lower than 1 Lugeon before grouting in borehole B1. After grouting, 52.4% of the Lugeon test results are lower than 1 Lugeon. A total of 9.5% of the tests are lower than 1 Lugeon before grouting and after grouting, and 66.7% of the test results are lower than 1 Lugeon in B2 borehole. Additionally, 10% of the tests are lower than 1 Lugeon before grouting in B3 borehole. After grouting, 65% of the test results are lower than 1 Lugeon in B3 borehole. A total of 38.1% of the total tests are lower than 1 Lugeon in control K borehole. After grouting, 57.1% of the total tests are lower than 1 Lugeon in control borehole K.
Figure 5B summarizes the Lugeon tests results in sandstone-siltstone-claystone alternations in A series and control borehole K, B series boreholes and control borehole K. All the tests results were lower than 1 Lugeon after grouting. Impermeability of sandstone-siltstone-claystone alternations formation was accessed with grouting. Figure 5C summarizes the Lugeon test result of the clayey limestone lithology in A series boreholes. After grouting all the test results are lower than 1 Lugeon. Hence, B series boreholes were not drilled for this lithology.
As a summary, evaluation of Lugeon test results showed that the impermeable levels were 53.3% before grouting and these impermeable levels were increased to 75.4% after grouting. High permeable zones are accumulated between 15 m and 75 mm in all boreholes. Karstic limestone block was drilled along this depth interval.
5. Grouting
Grouting was performed mainly from top to bottom of the borehole. Grouting pressures were applied depending on depth level as follows; 12 atm pressure was applied between 12.5 and 15.0 m depth, 15 atm pressure was applied between 15.0 and 17.0 m depth, and 20 atm pressure was applied greater than 17.0 m depth during grouting. Grouting mixture was formed from water and cement for A series boreholes (Table 2). Mixture types were classified according to bentonite percentage in cement. Six different grouting mixtures were prepared and injected during pilot grouting. Grouting was started with most viscous A type. When injection pressure was not changed, the injected mixture types B, C, D, E, and F were injected, respectively. When 0.75% of anticipated pressure was reached, the type of mixture was applied to the refusal condition. A total of 2725 kg grouting material was injected in the first stage. When the refusal condition was not reached despite injection of F type mixture, grouting was stopped, and cement solidification was waited for 24 h. The next day second grouting was started. If the refusal condition did not occur, an additional 2725 kg material was injected for the second stage. Cement solidification was waited for 3 h. During the grouting of the A series boreholes, the refusal conditions were not reached in Karstic limestone in both first and second grouting stages.
K borehole was used for controlling grouting performance. Target impermeabilities were not achieved in A series boreholes after grouting, so the B series boreholes were drilled and borehole distances were decreased to 1.25 m.
The grouting material types at second stage grouting were changed. In order to achieve impermeability of karstic limestone, sandy mixture of grouting mixture types were applied. E type grouting mixture was revised as water/cement/sand ratio of 1/1/0.25. Sand was added in grouting mixture when the first control Lugeon test results were greater than 2 Lugeon (Table 3).
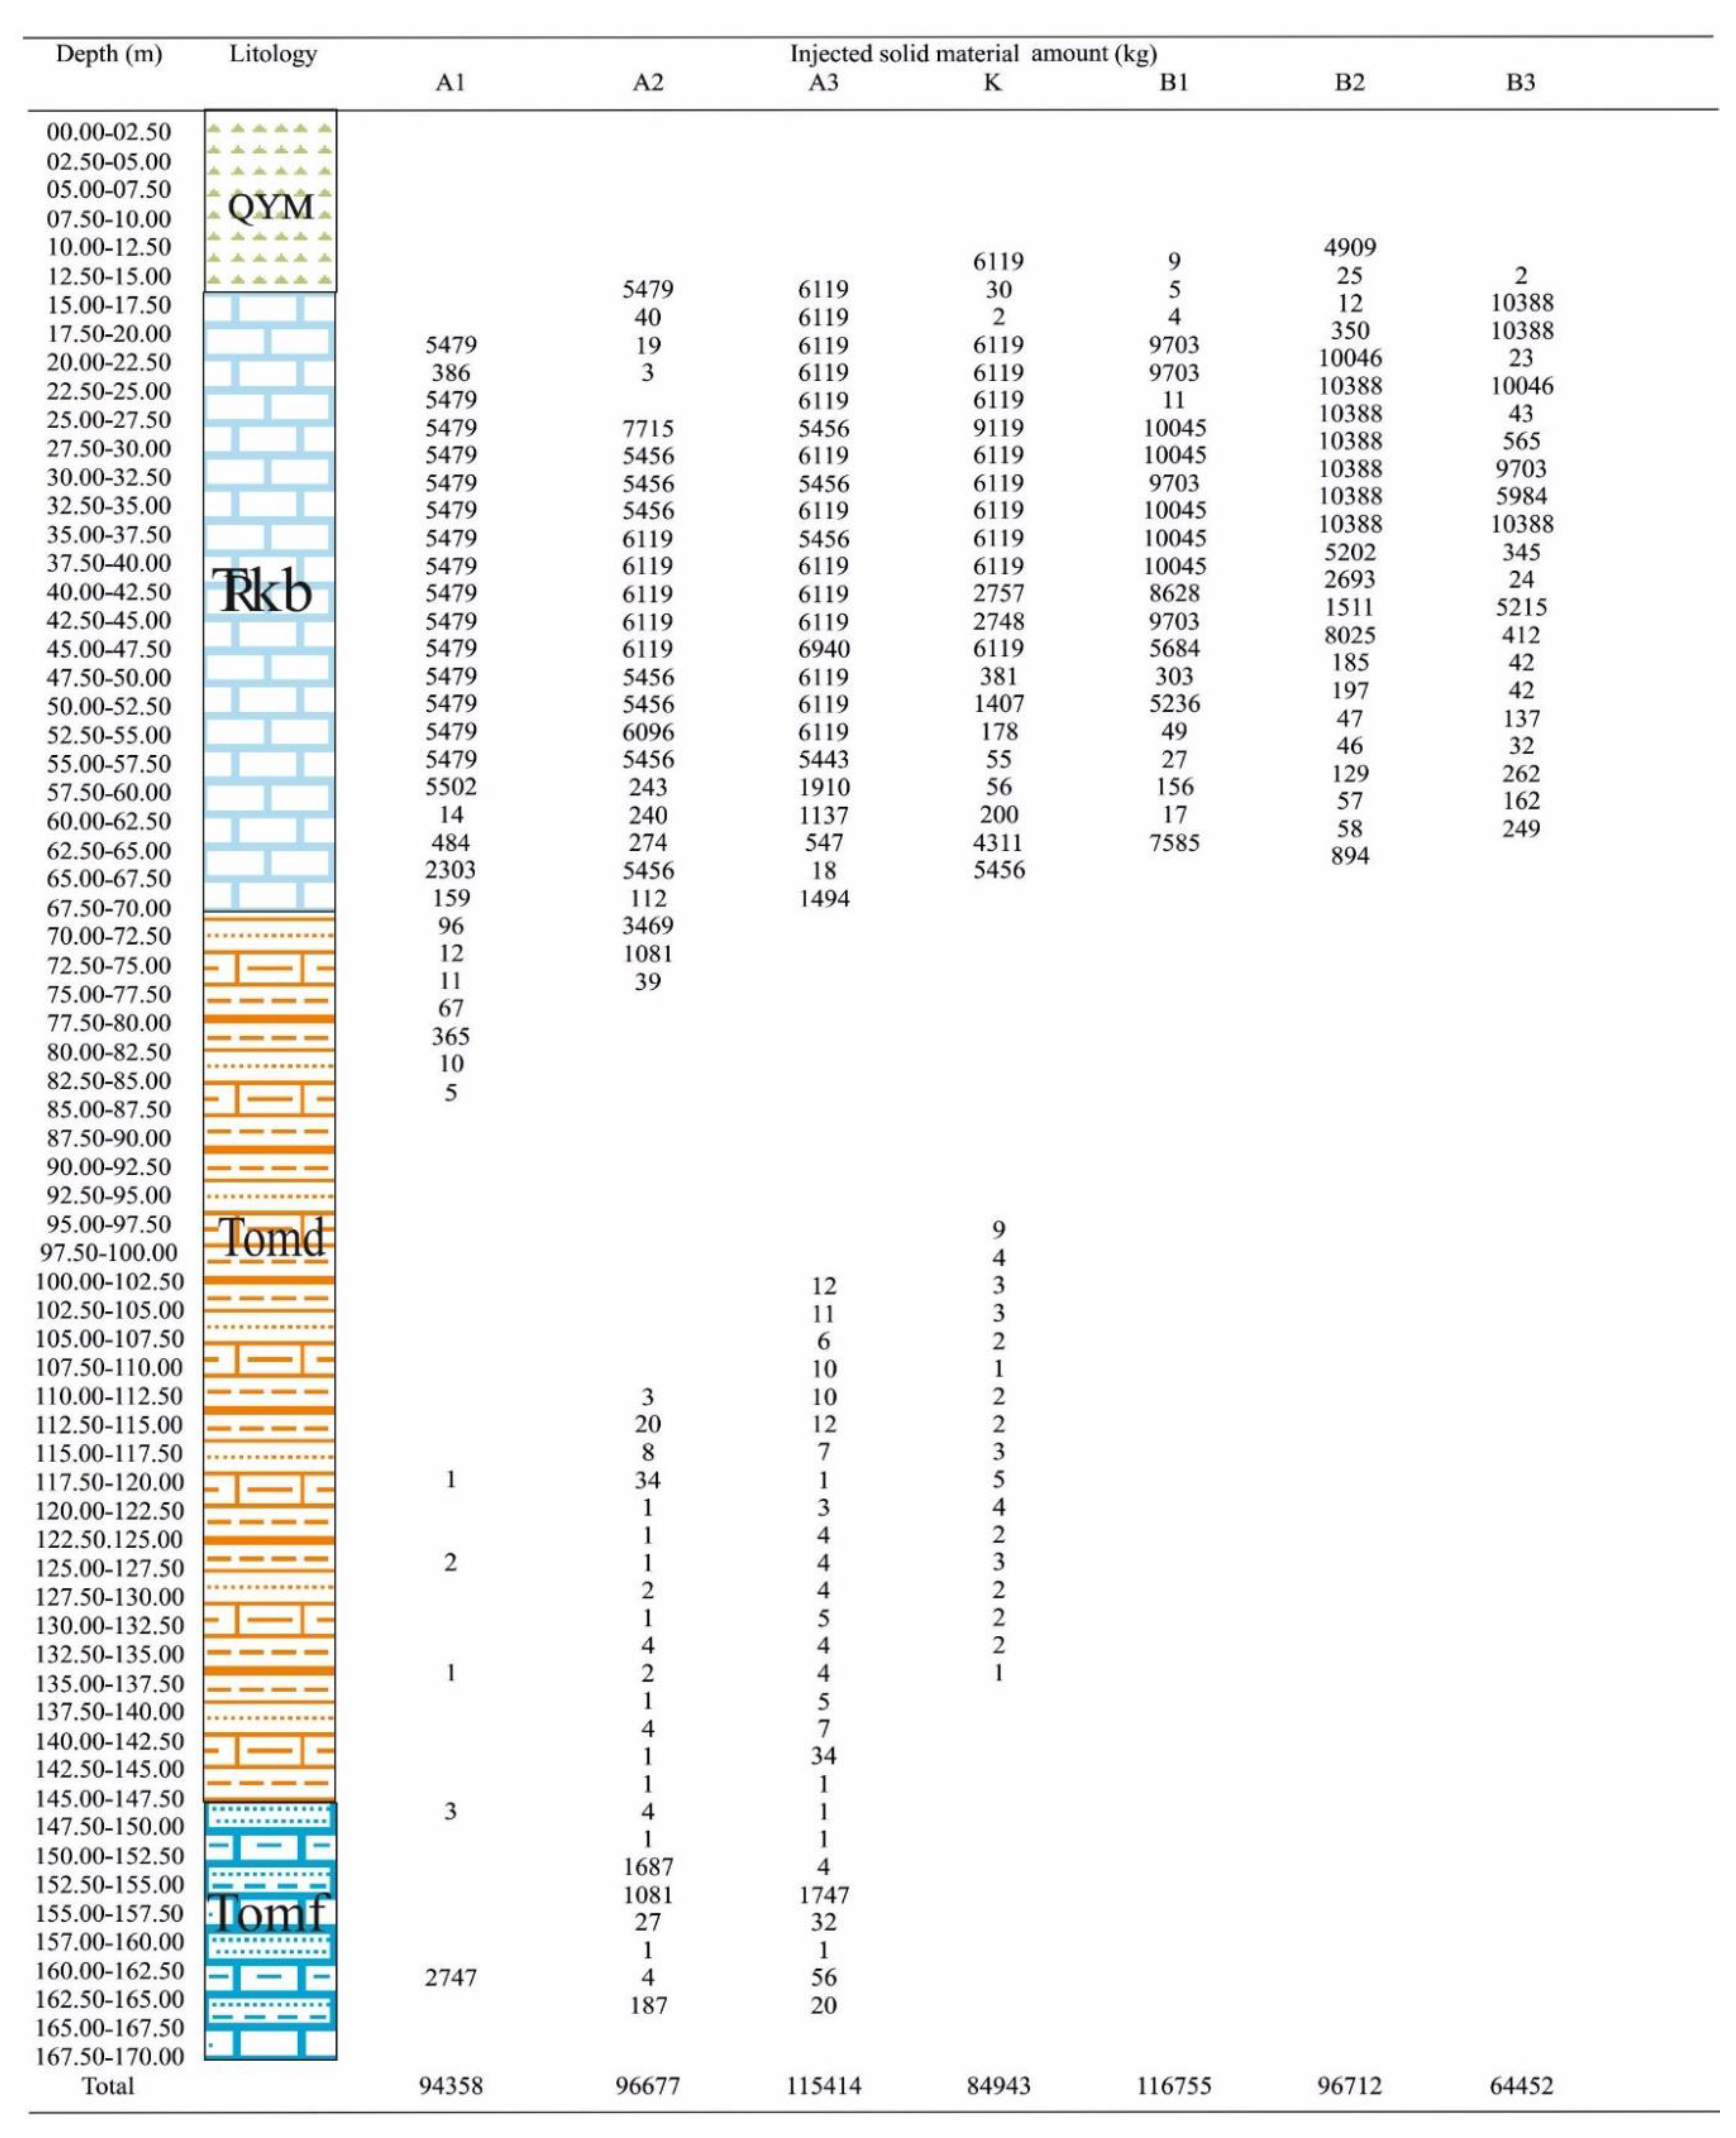
Drilling, Lugeon tests, and grouting processes in B series boreholes were conducted like A series boreholes. When anticipated impermeability was not reached, the sandy mixtures were applied as grouting injection material. F type mixture was the densest mixture applied to B type boreholes. In total, 32 mixer solid materials were injected in B series boreholes. A total of 632.5 m was grouted and 669,321 kg material was injected in all boreholes during pilot grouting. Information about borehole depths, total number of Lugeon tests, and total number of grouting and grouting lengths are summarized in Table 4. The injected solid material amount also gives valuable information about the permeability of the lithologies. Most of the grout material was injected between a 20 and 70 m depth interval. Figure 6 shows the injected grout amount along the piling grouting boreholes.
As a summary, the injected grout material amount between 20 and 70 m depth of all pilot grouting boreholes is given in Table 5. Karstic limestone was drilled along these depth intervals. A total of 607.230 kg of 669.321 kg total grout material was injected between these depths. That means 90.7% of the total grout material was injected between 20 and 70 m depths of boreholes.
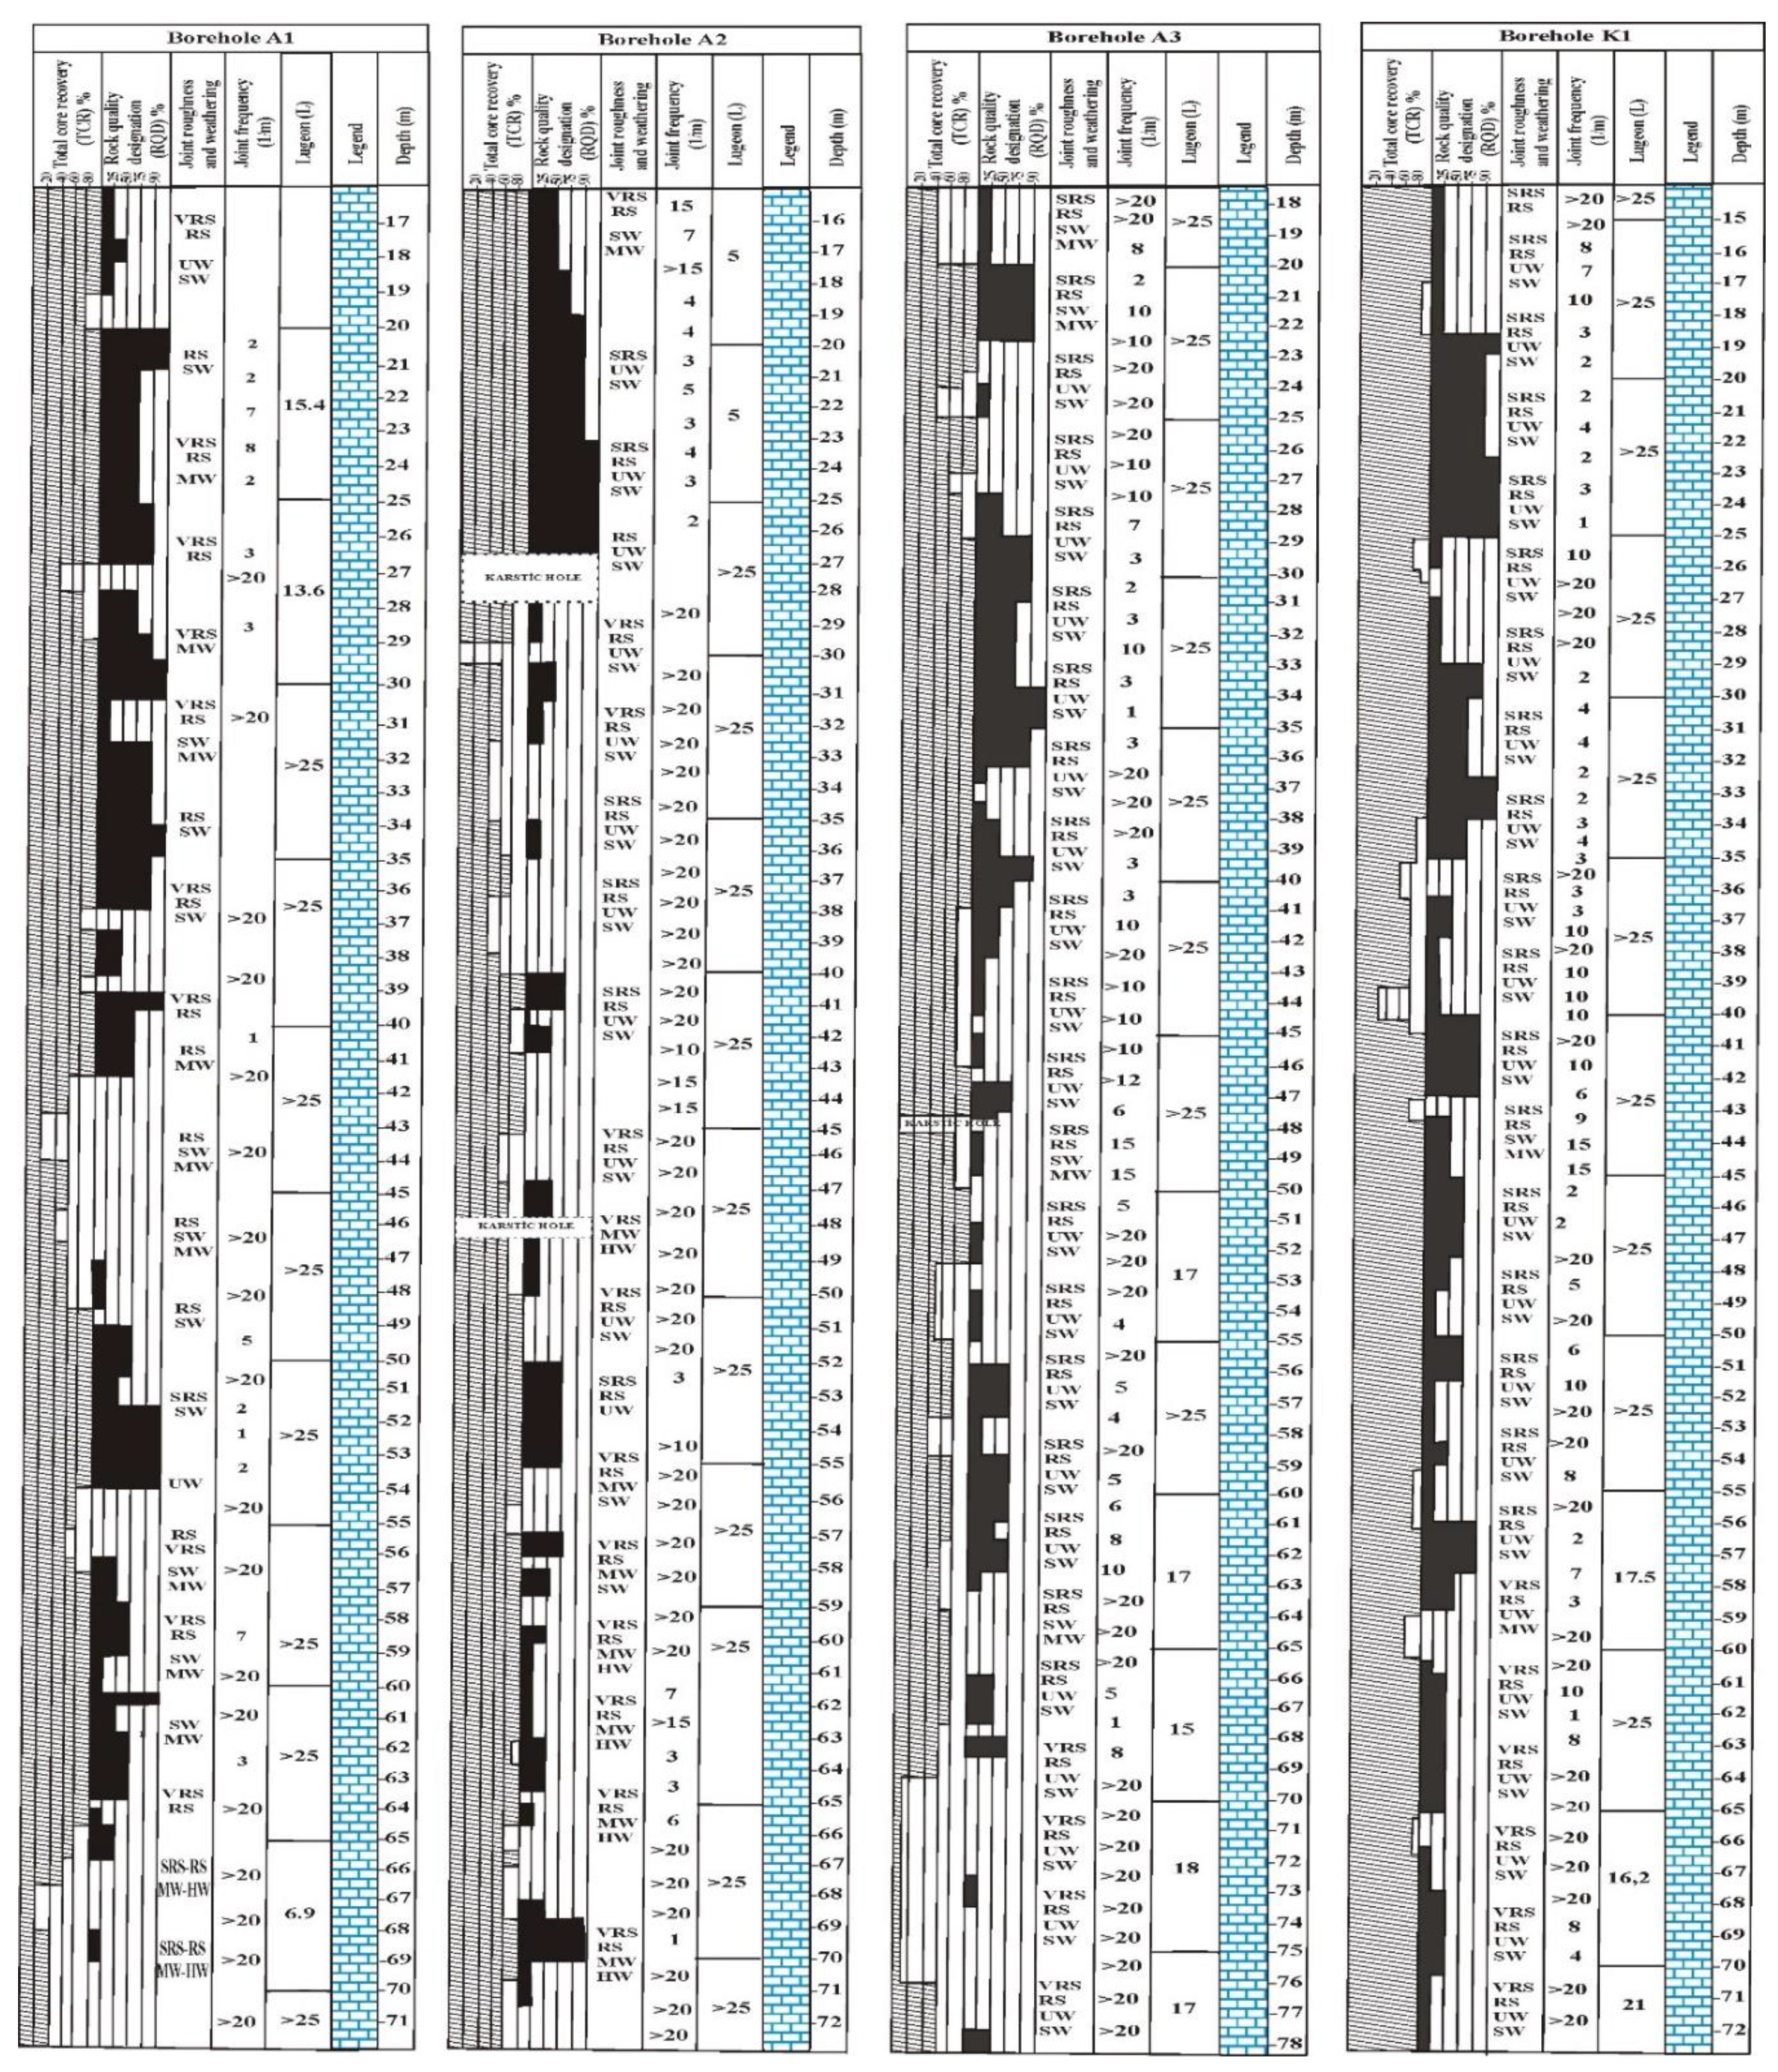
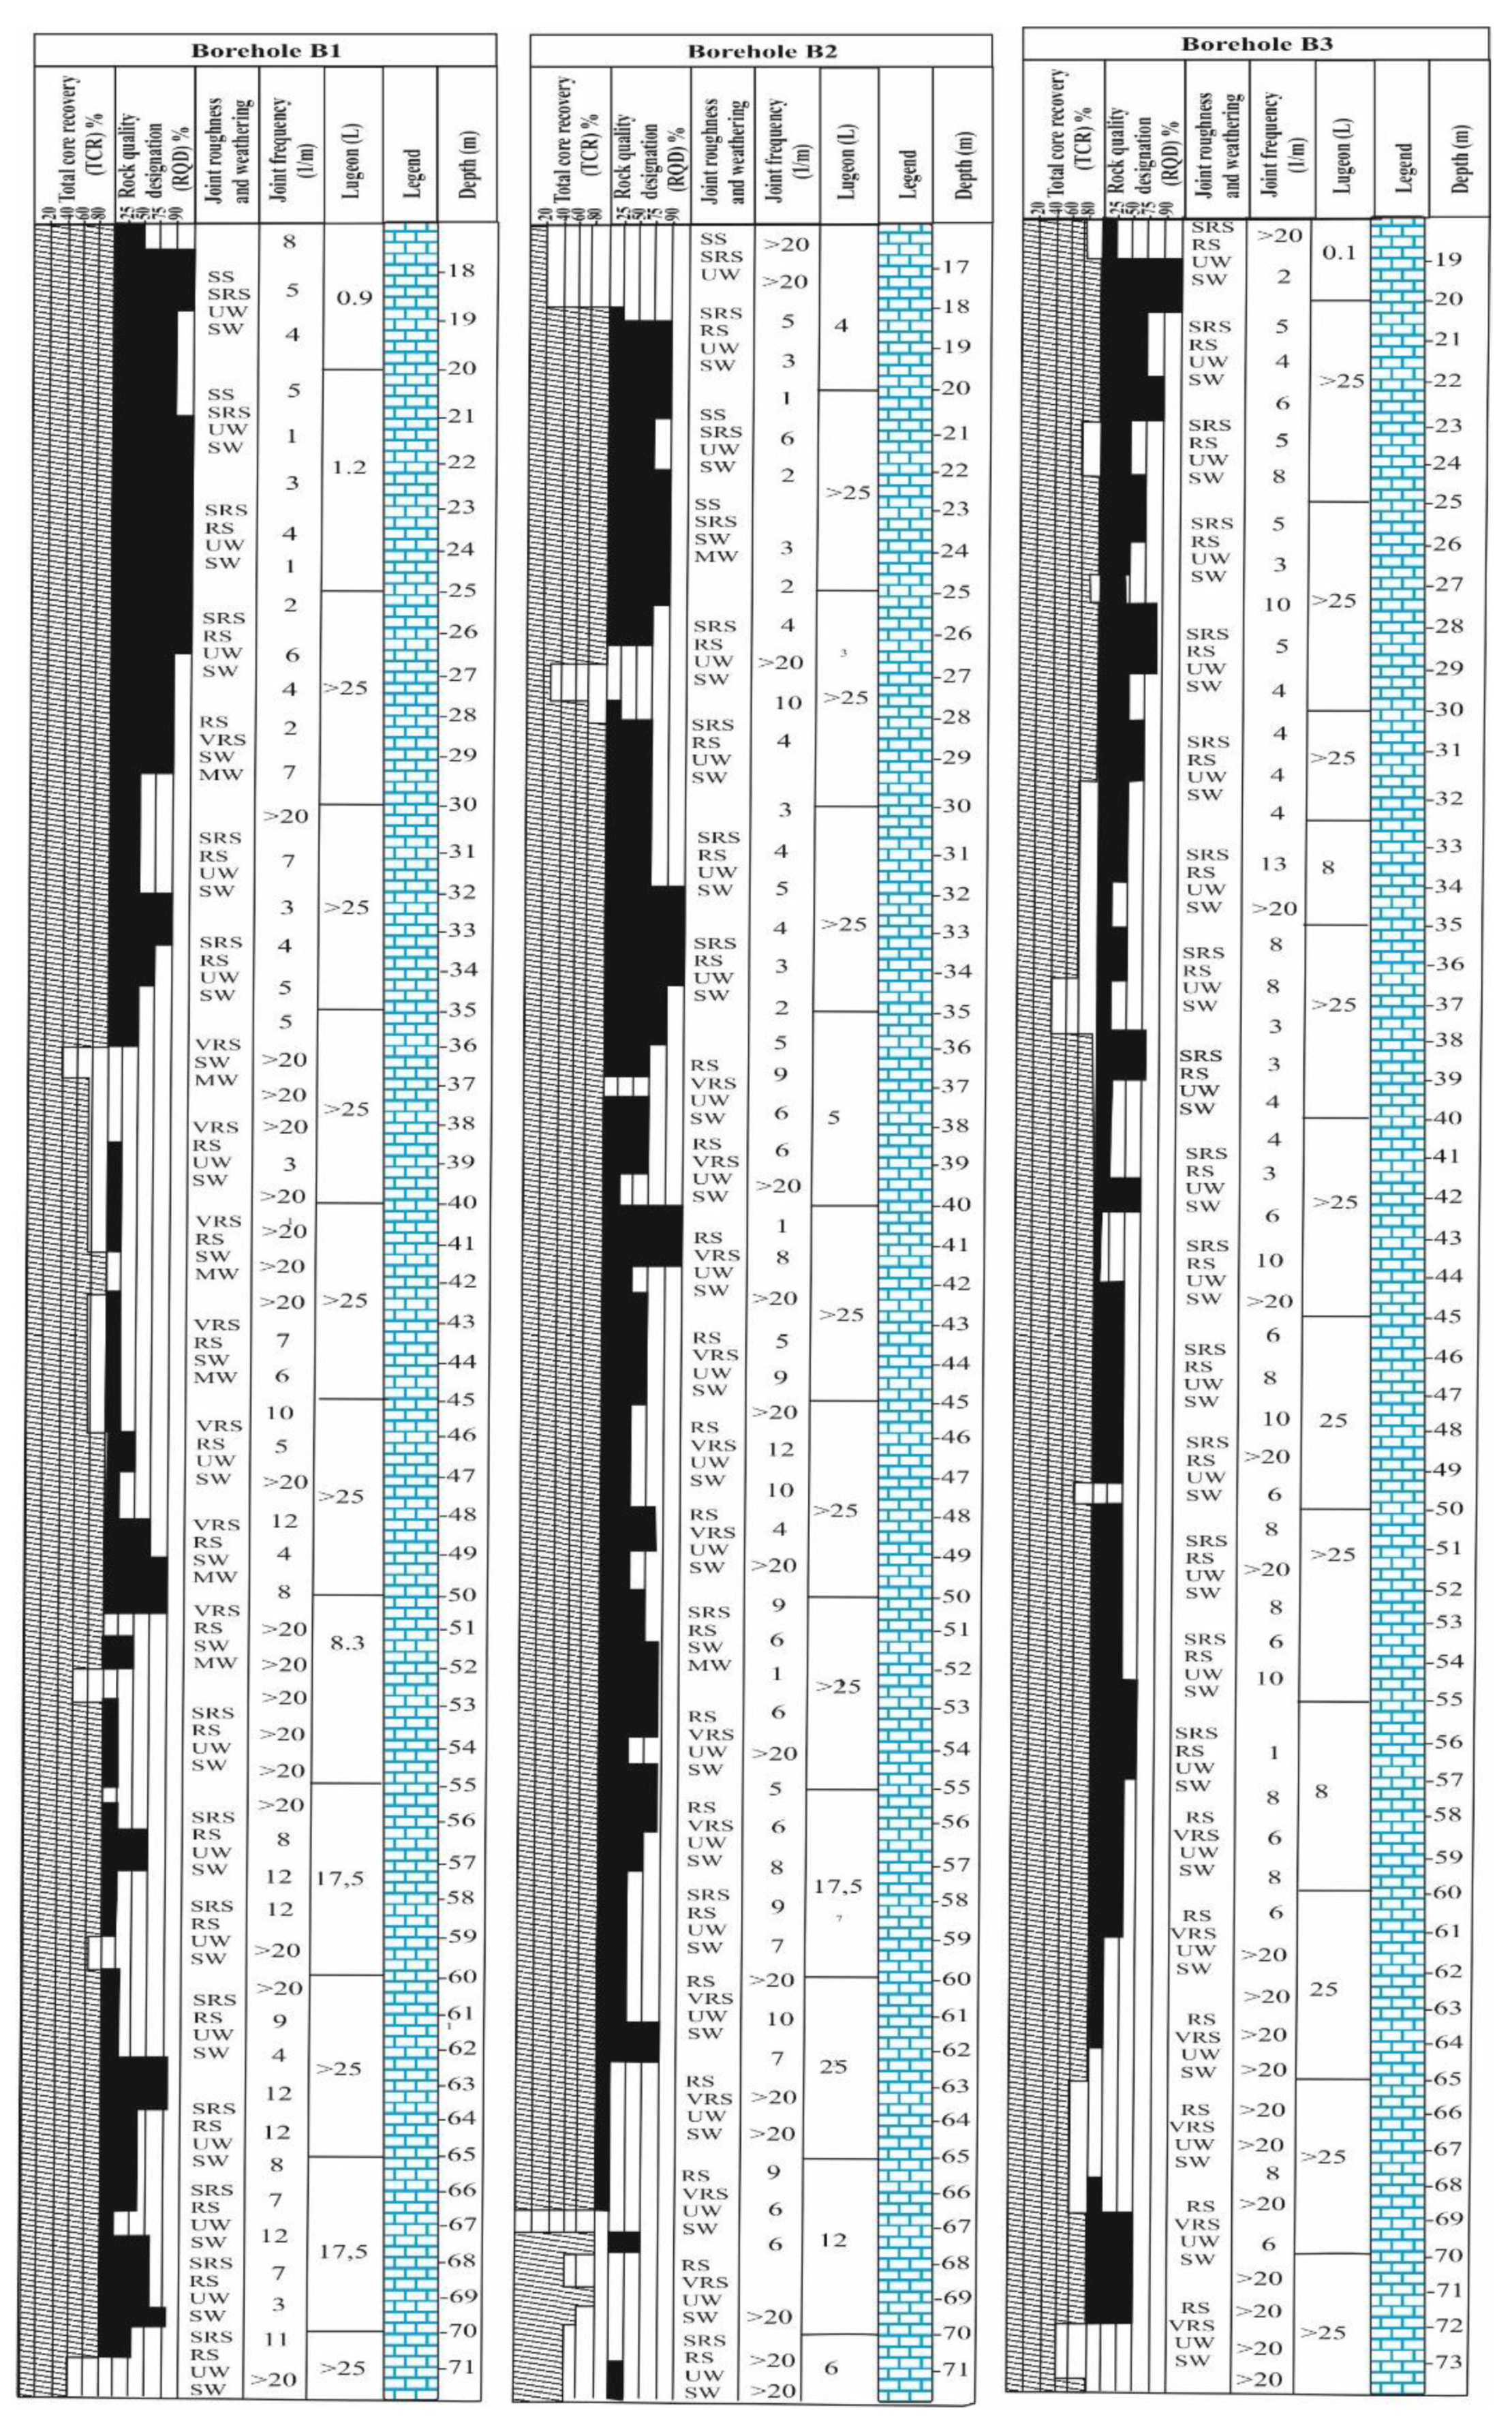
Karstic limestone block is very densely jointed. Figure 7 and Figure 8 show the drill log core description of the karstic limestone block. TCR, RQD, weathering, joint surface properties, joint frequency, and the Lugeon test results before grouting of karstic limestone block are summarized. The discontinuity surfaces are generally very rough surfaced (VRS) or rough surfaced (RS). All weathering grades exist except residual soil (RS) grade. There are generally smooth clayish infilling materials in apertures. Discontinuity surfaces are also iron oxidized. The basement lithology clayey impermeable limestone is exceeded after injecting 112.5 kg/m grout material.
6. Data Processing
Pilot grouting at the Mut dam site showed that there are no permeability problems with the sandstone-siltstone-claystone alternations (Tomd: Derinçay Formation) and basement clayey limestone (Tomf: Fakırca Formation). The rock mass properties information (RQD index, Q value, Joint spacing, Lugeon, SPI, permeability, aperture, and grout material amount per meter) of karstic limestone block (Ʀkb: Belveren limestone block) were recorded and calculated from pilot grouting boreholes for 5 m intervals. Statistical values of these rock mass properties were calculated and are summarized in Table 6. The RQD values were determined for each Lugeon test interval during drilling. This parameter has widespread use in geotechnical applications. RQD index means the percent ratio of some of rock core parts greater than or equal to 0.1 m in the core run and divided by core run length. The RQD was introduced firstly Deere [21]. The mean value of RQD was calculated to be 32.2% for karstic limestone block which is poor quality rock mass.
The Q classification system was introduced by Barton et al. [22]. The Q value is calculated with Equation (1):
where, RQD is total length of cores which is equal or greater to 10 cm in each core run, Jn is the number of the joint sets, Jr is the joint surface roughness number, Ja is the joint alteration number, Jw is the joint water condition number, SRF is the stress reduction factor. According to mean value of Q, karstic limestone block is a very poor quality rock mass.
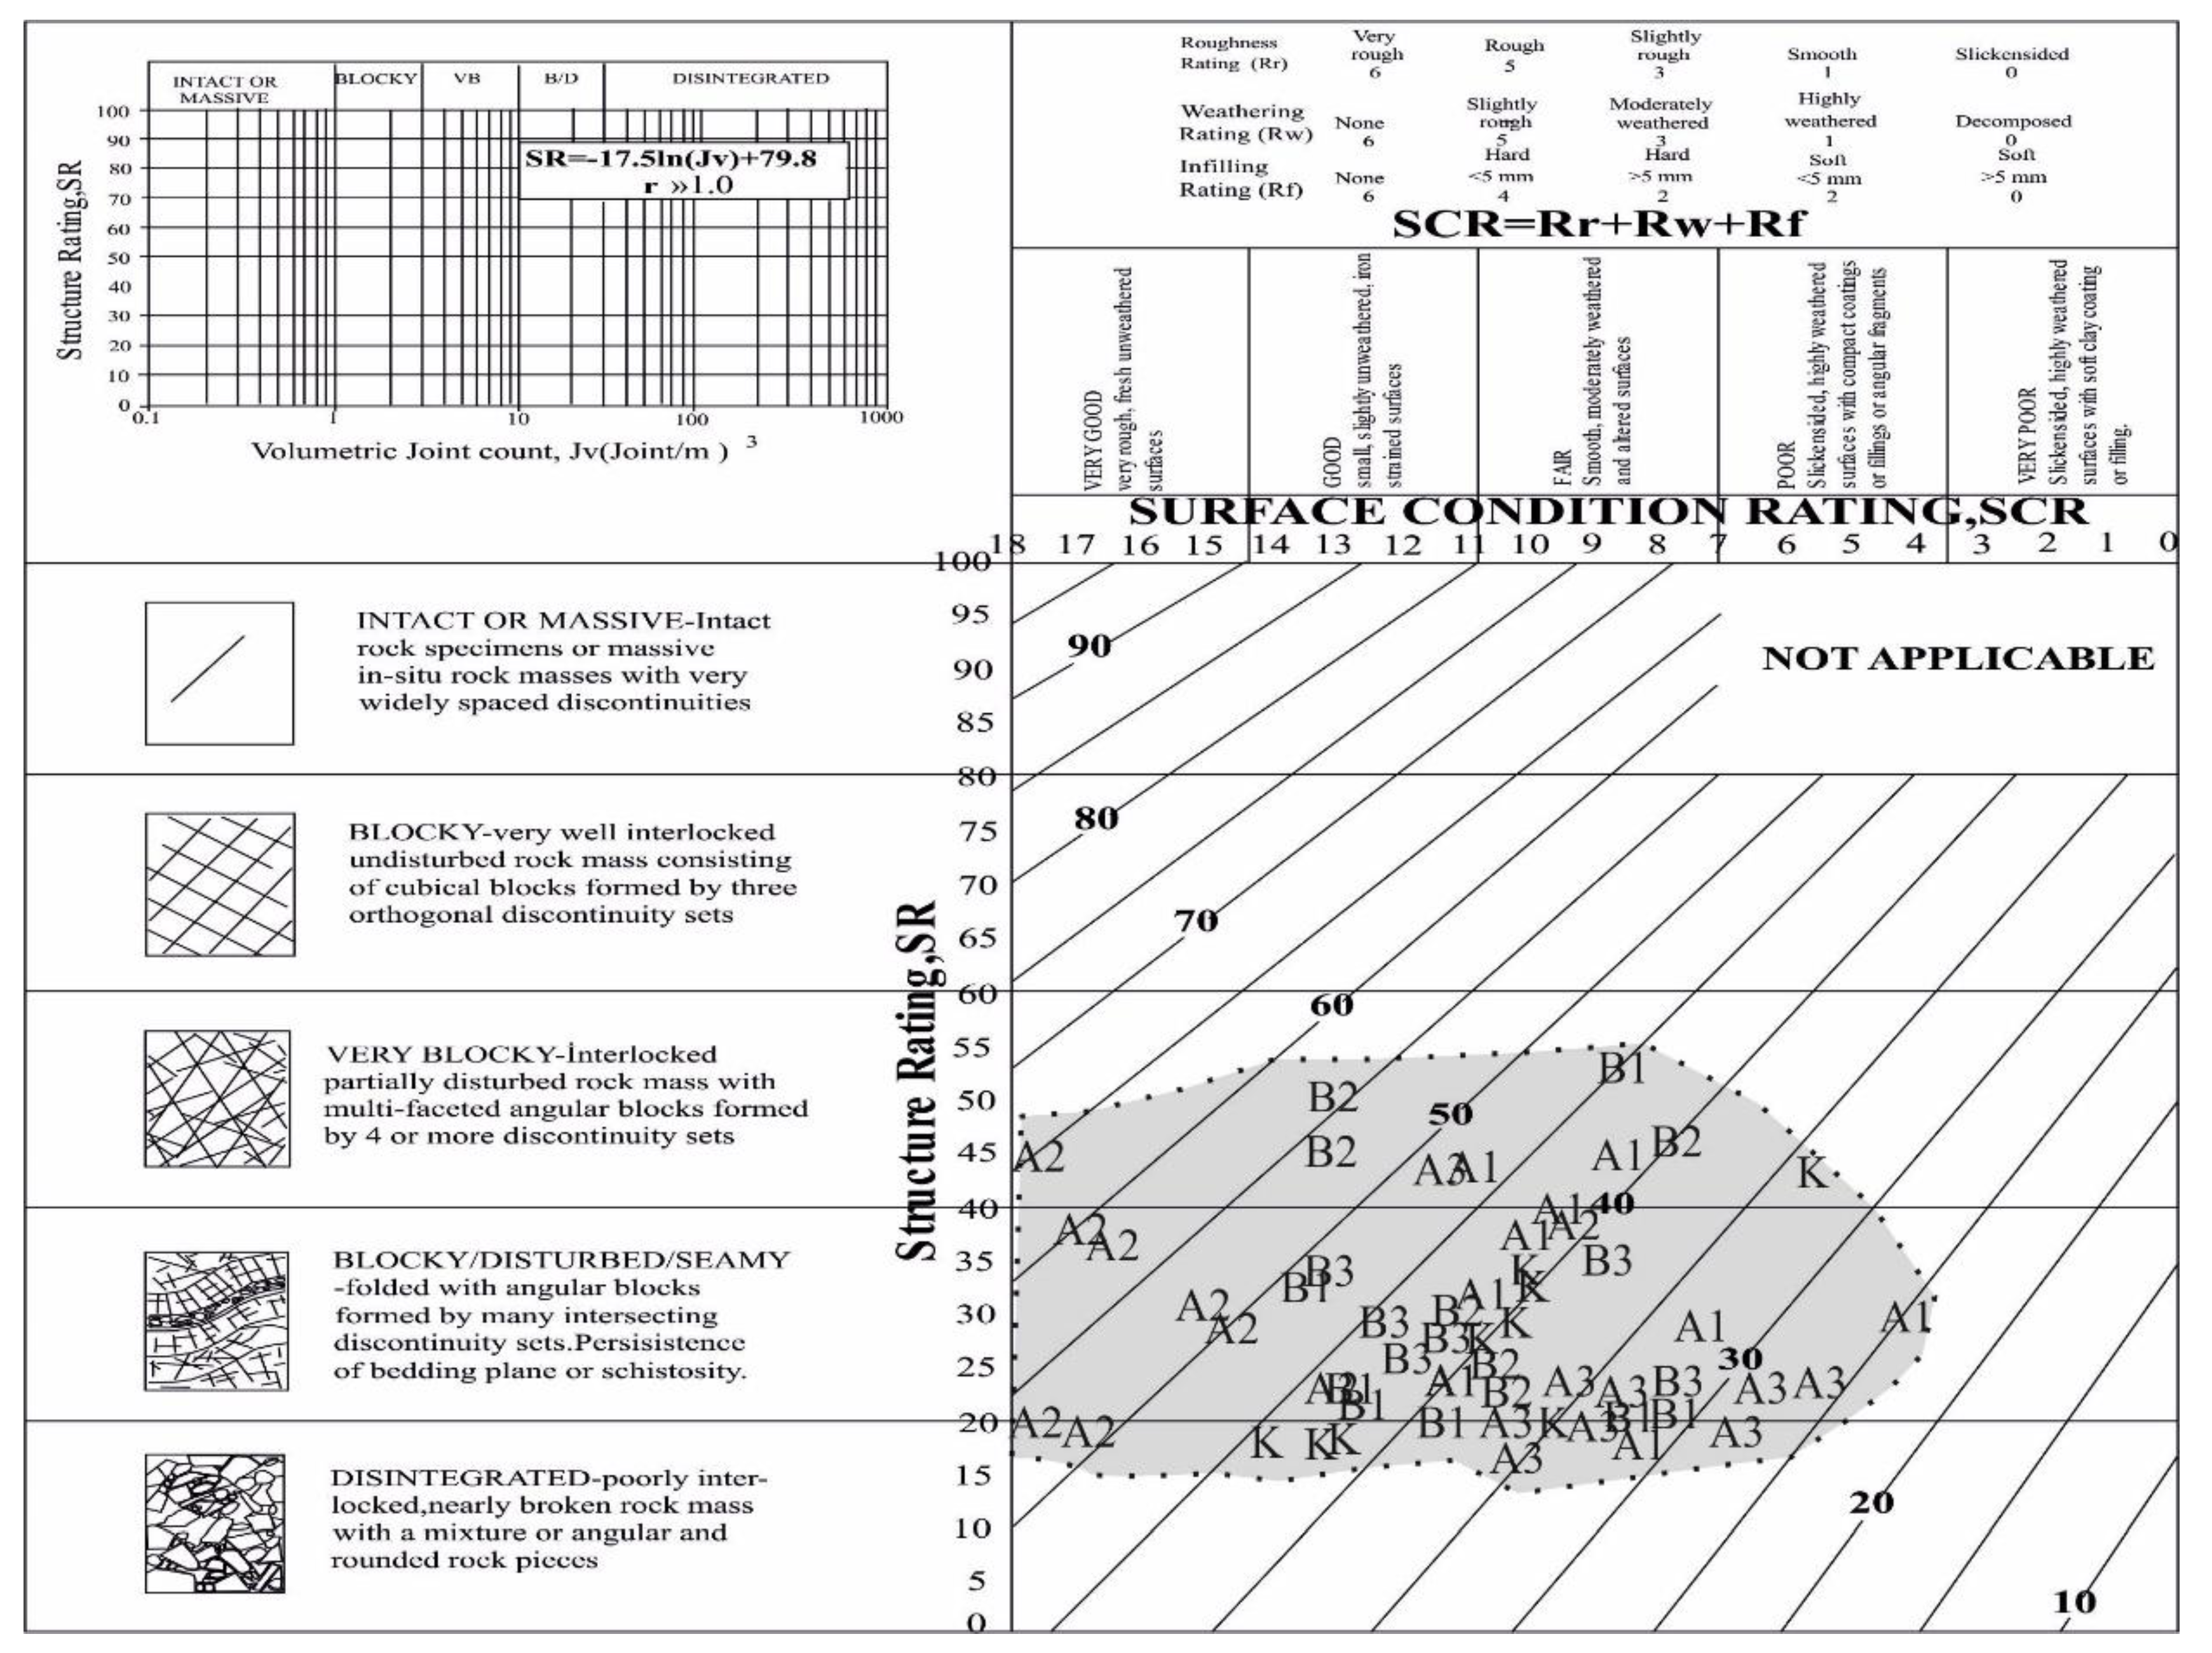
GSI is a chart that was developed for Hoek and Brown criterion and revised by Hoek and Marinos [23]. These charts are based on visual observations of researchers. Sönmez and Ulusay [24] modified the GSI chart and named it the quantitative GSI chart. In this study the quantitative GSI chart was used for evaluation (Figure 9). The mean GSI value of limestone block was calculated as 39.3.
Joint spacing is one of the factors which affects the permeability and grout penetration. The maximum joint spacing and minimum joint spacing are 344.2 and 35.3 mm, respectively. The mean joint spacing is 69.7 mm. The karstic limestone blocks joint spacings are defined as wide to narrow in range according to Barton [25].
Aperture is the normal distance of discontinuity surfaces. Aperture may also affect the rock mass permeability. In this study, joint apertures were calculated according to Equation (2) suggested by Sohrabi-Bidar et al. [14]:
where, e is the average joint aperture in cm; b is the average joint spacing (cm); and k is the permeability constant. Maximum joint aperture and minimum joint aperture are 0.112 and 0.0025 mm, respectively. Mean joint aperture is 0.019 mm. The karstic limestone blocks joint apertures are defined as tight to very tight in range according to Barton [25].
Secondary Permeability Index (SPI) (Equation (3)) was suggested by Foyo et al. [3]:
where, SPI: Secondary Permeability Index, L/s m2 of borehole test surface; C: constant coefficient controlled by a fluid viscosity in a rock equal to 1.49 × 10⁻¹⁰ in temperature of 10 °C [26]; le: length of the test section, m; r: borehole radius, m; Q: Water flow, l; t: time duration of each pressure intervals, s; H: total water pressure in hydraulic column, m.
The SPI shows the rock mass classification according to rock mass permeability and hydraulic conductivity. Absorbed water per time along the water pressure test section defines the rock mass quality of test section and gives the ground treatment methods (Table 7). SPI classes for drilled boreholes show that the karstic limestone block requires extensive grouting (Table 8).
7. Simple and Multiple Regression Analyses
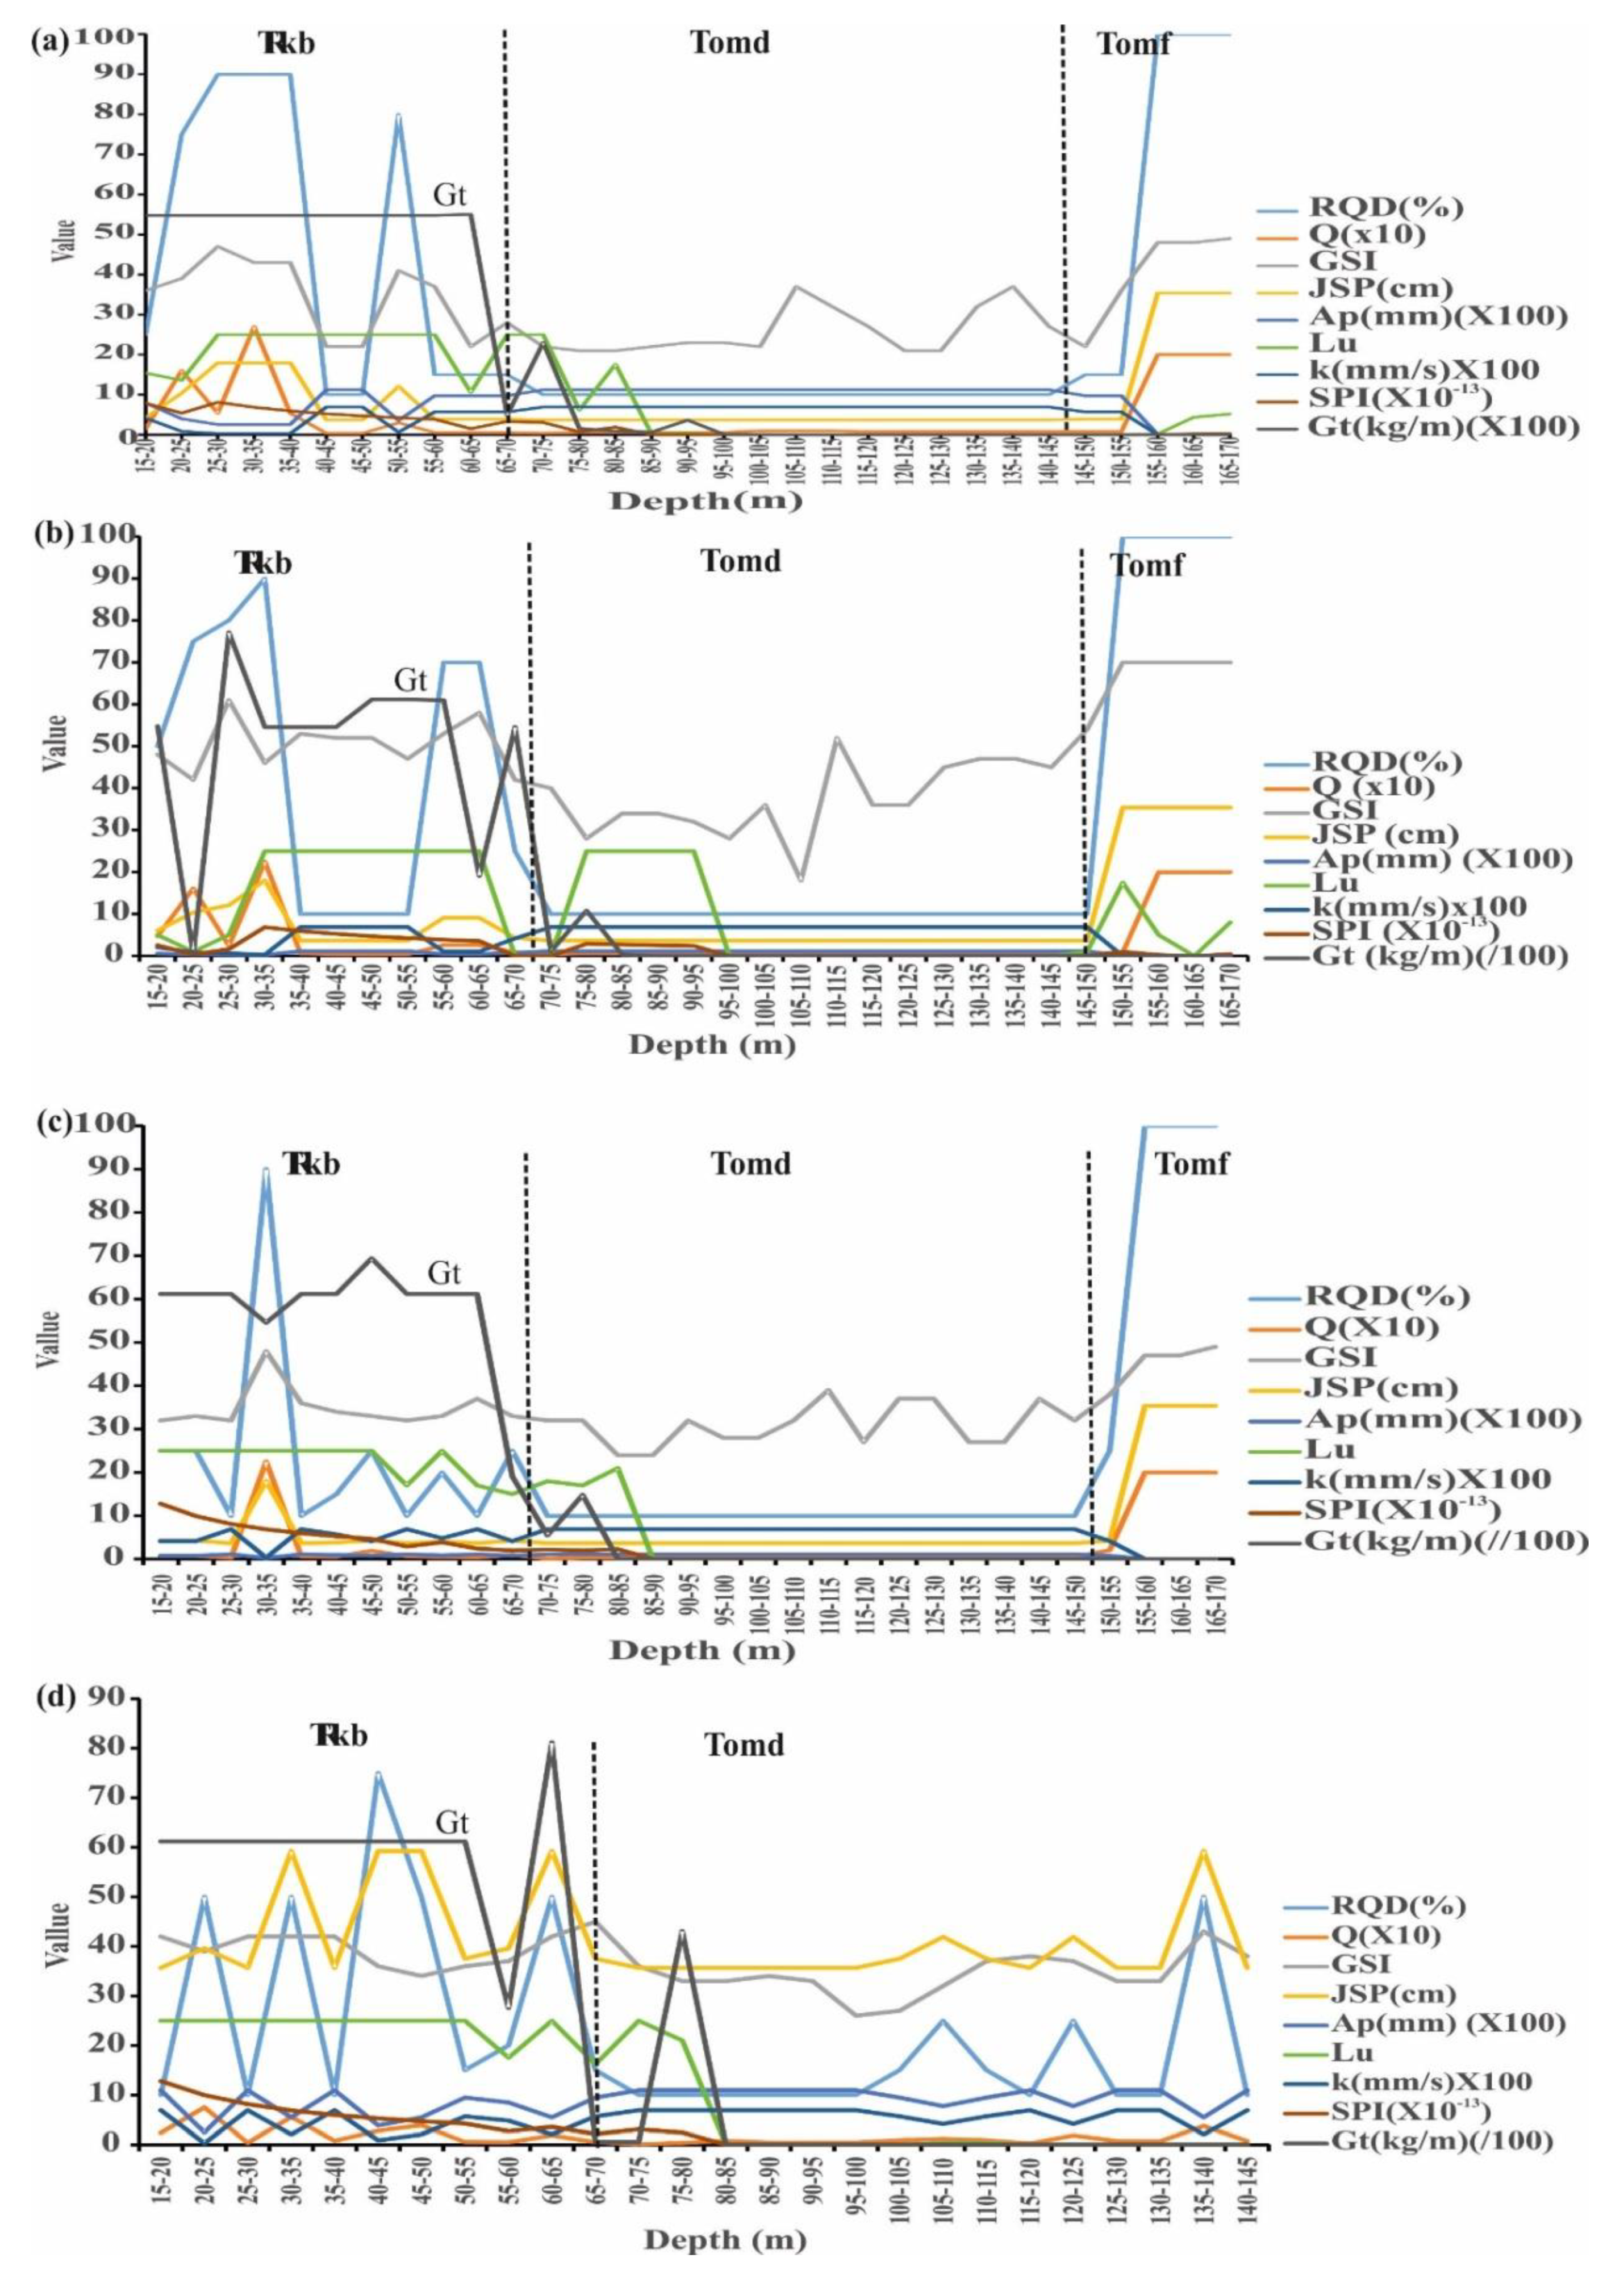
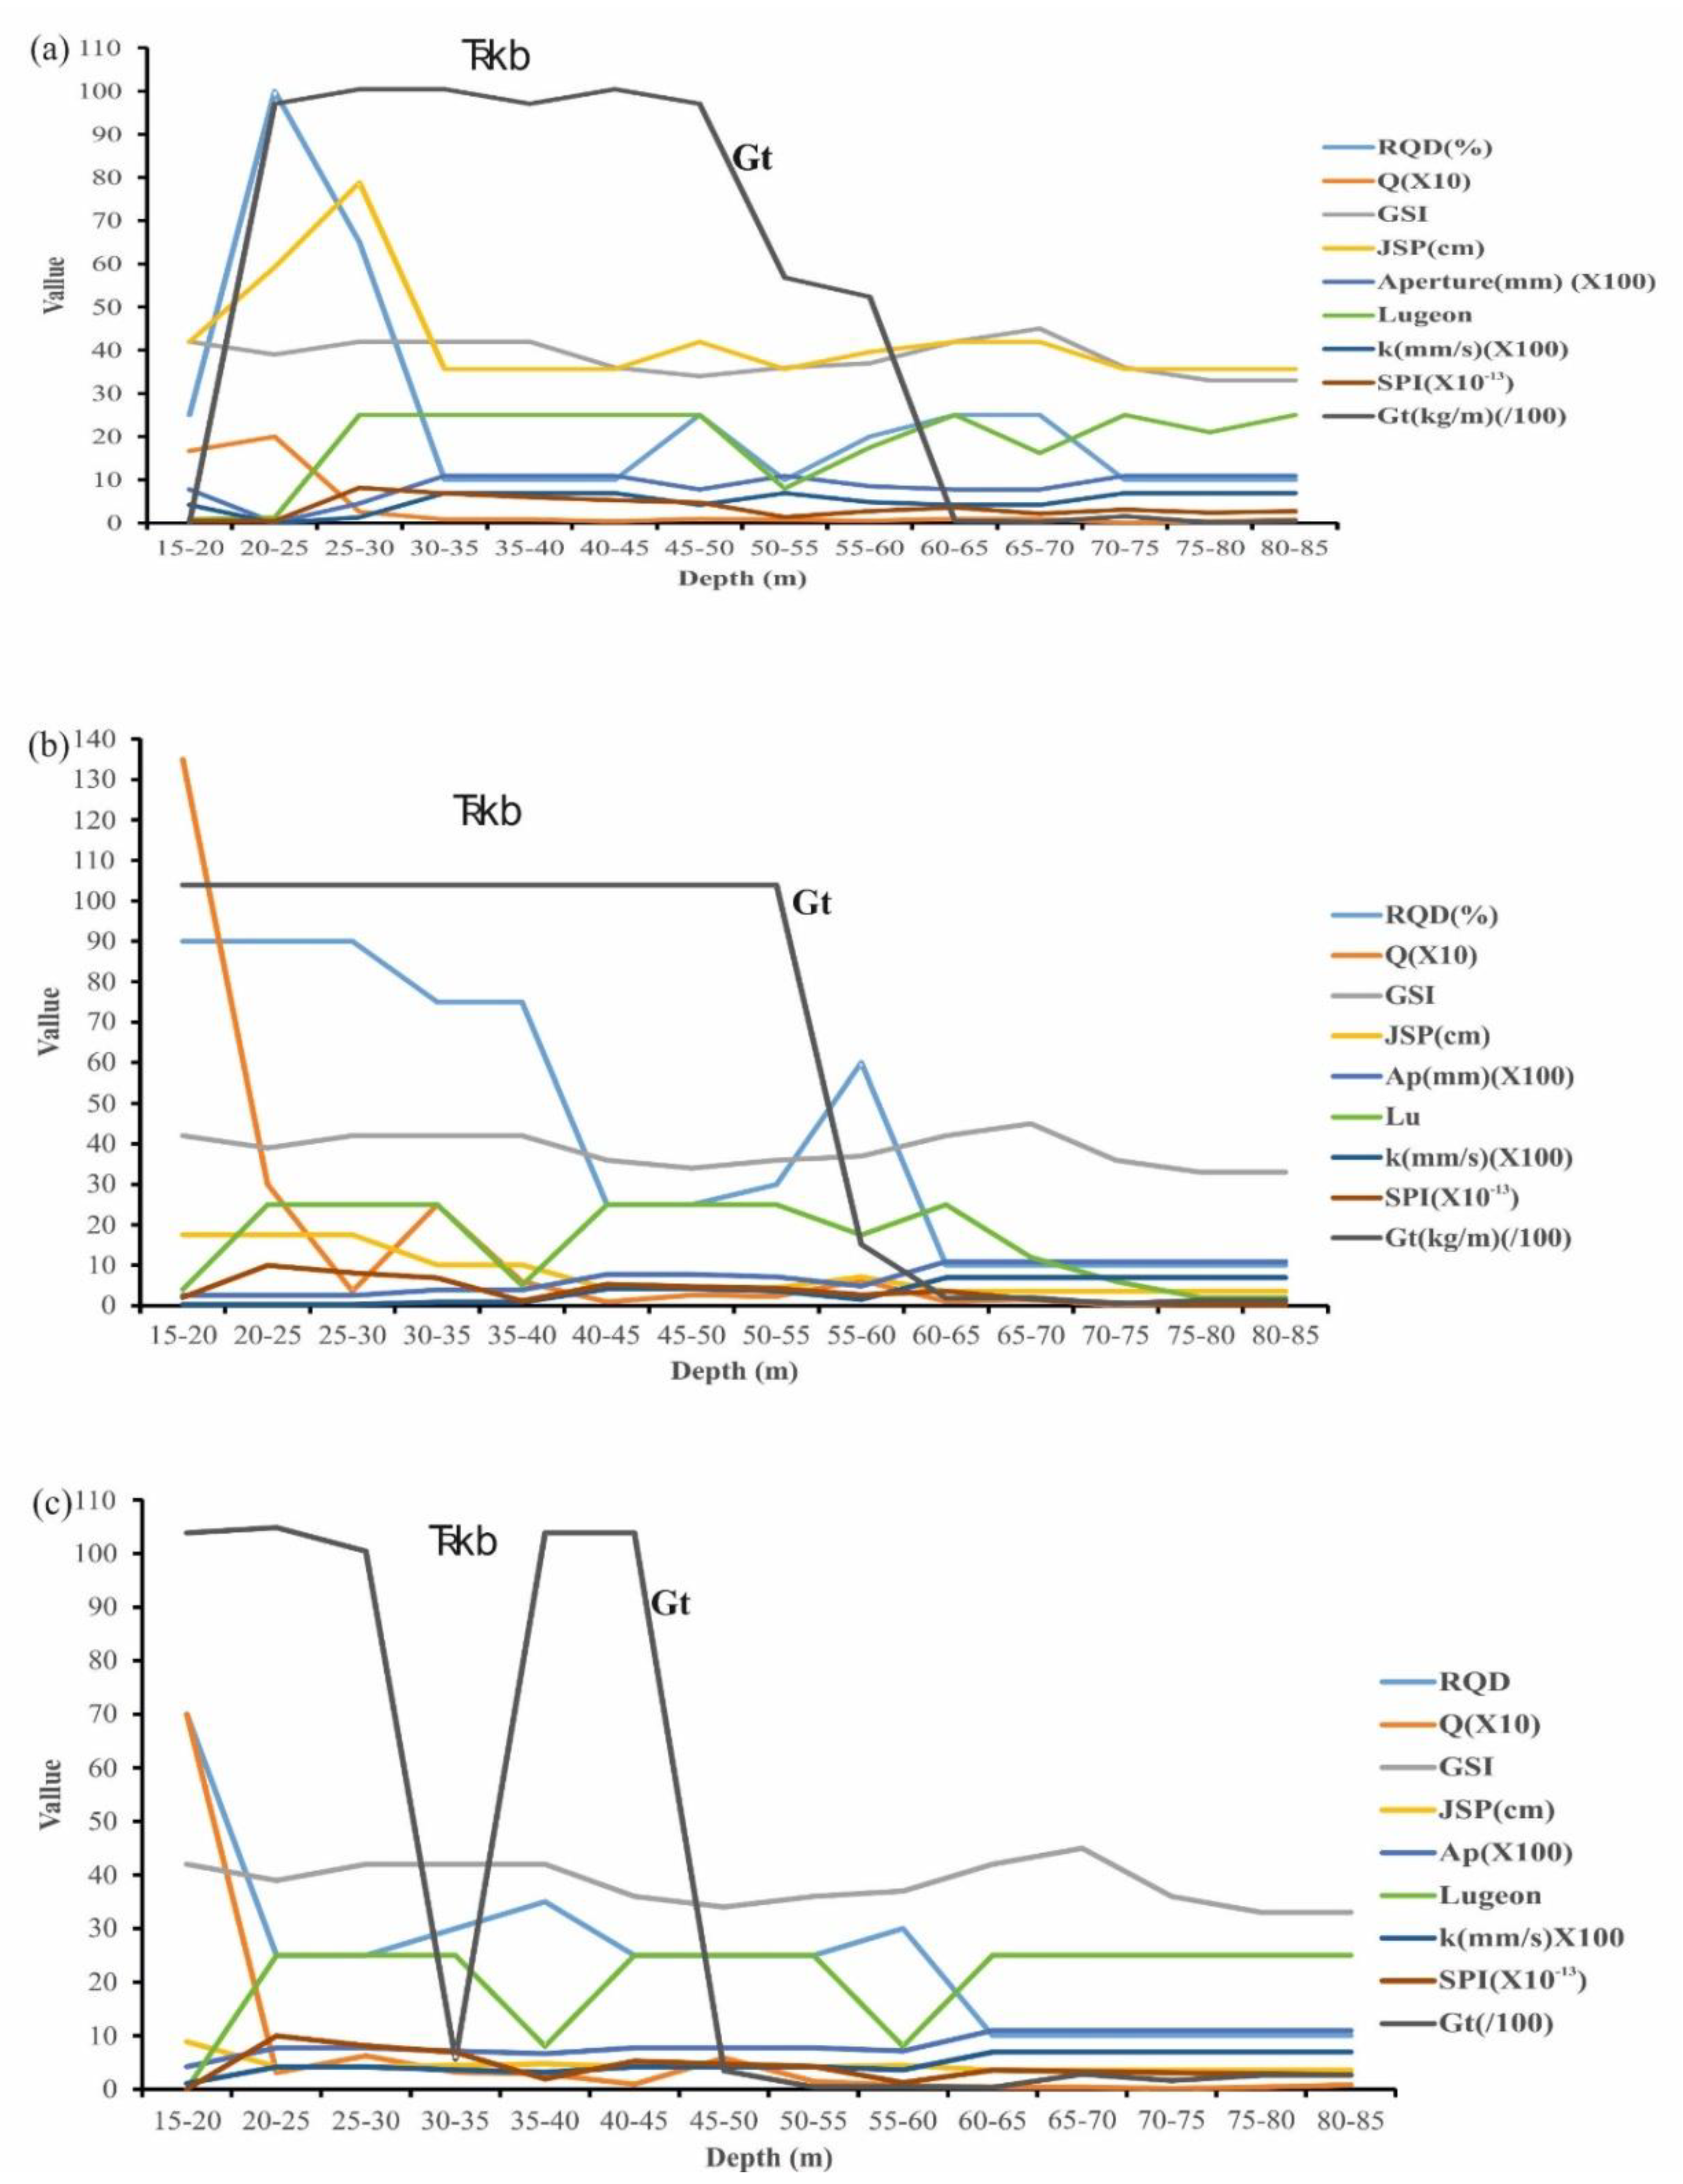
RQD, Q, GSI, JSP, Ap, Lu, k, SPI, and Gt trend variation graphs for A series boreholes and B series boreholes are given in Figure 10 and Figure 11, respectively. As seen in graphs of both figures there are no permeability and grouting problems for both clayey limestone and sandstone-siltstone-claystone alternations. Pilot grouting investigation showed that the karstic limestone block should be explored in detail before dam construction.
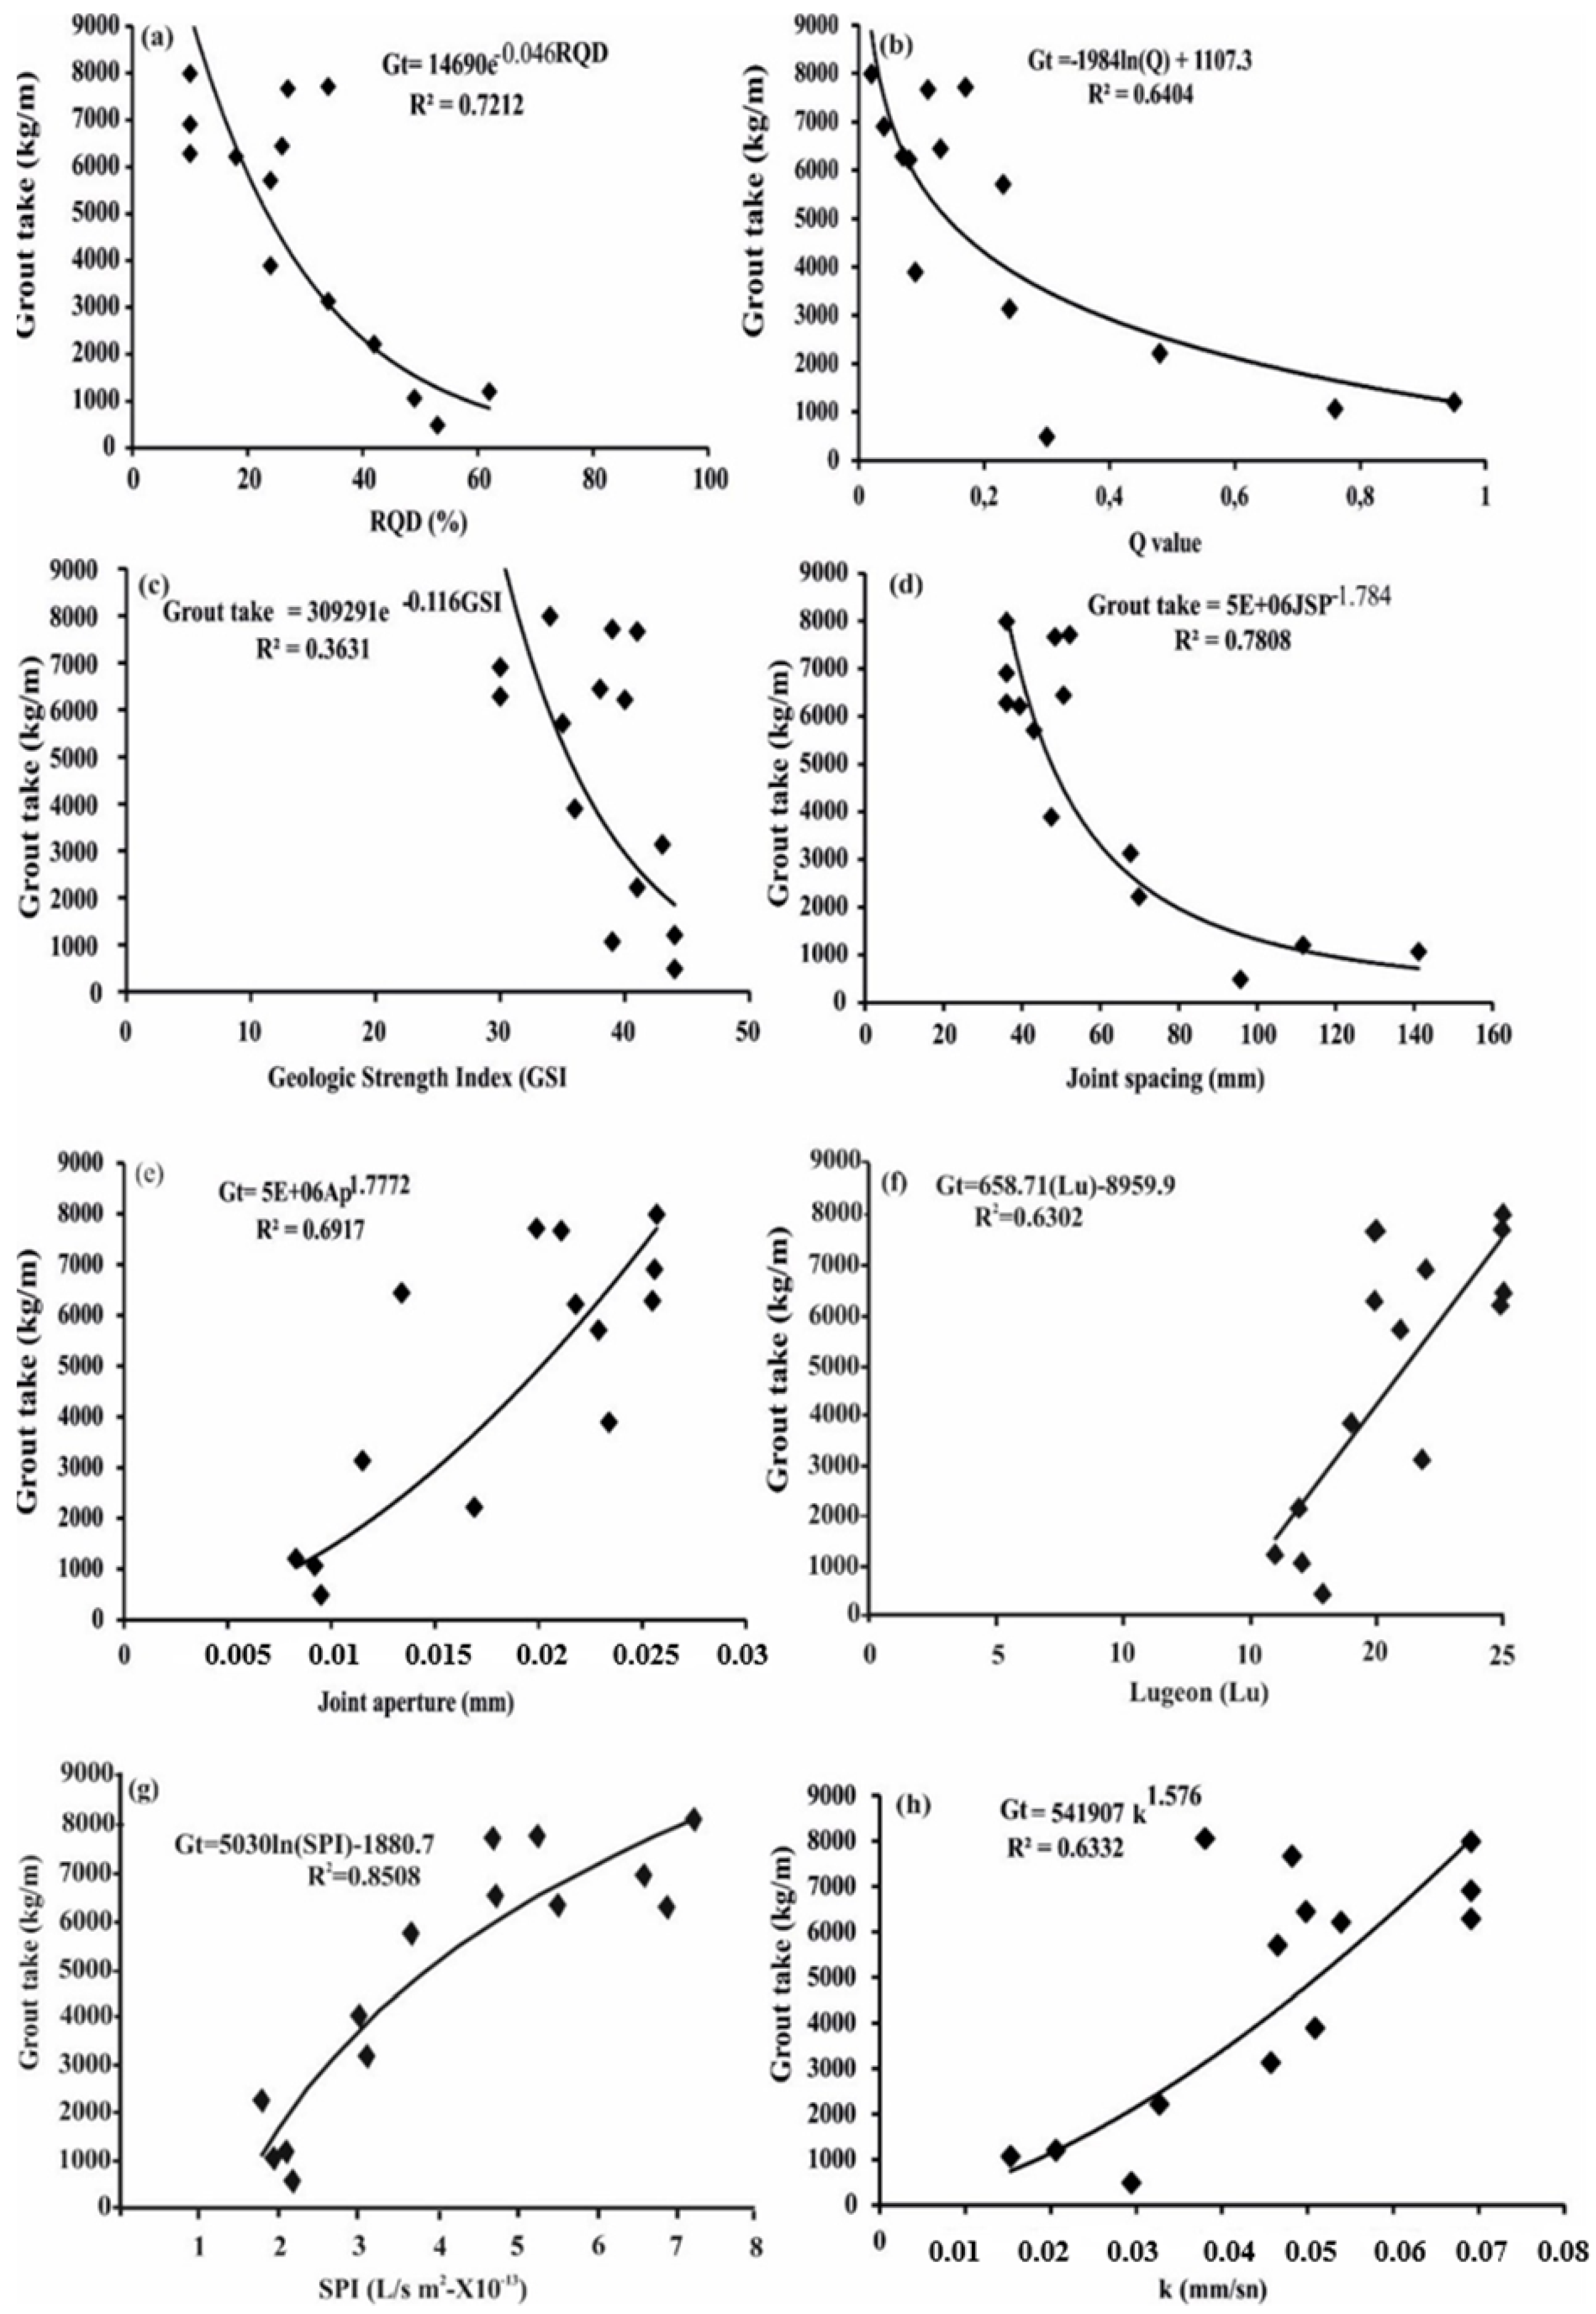
Regression analyses as statistical methods are widely used in geotechnical and rock engineering practice (e.g., Hoek and Brown [27]; Apte et al. [28]; Akca [29]; Uddameri [30]; Sivrikaya [31]; Zorlu et al. [32]; Yagiz et al. [33]; Yagiz and Gokceoglu [34]; Chen-Chang et al. [35]; Valia and Arpa, [36]; Azimian and Ajalloeian R [10]; Farid and Rizwan [15]; Öge and Çırak [37]; Rahimi et al. [38]). Average values of rock mass properties of karstic limestone block (Q value, RQD, GSI, JSP, Ap, Lu, SPI, k) and average Gt were calculated (Table 9). Gt and average values of RQD, Q, GSI, JSP, Ap, Lu, and SPI were correlated with simple regression analyses. Equations (4)–(11) are the derived empirical equations from simple regression analyses (Table 10). Figure 12 shows the graphs of simple regression analyses results. The determination factors (R2) were determined by power and logarithmic function as 0.7212 and 0.6404 for Gt-RQD and Gt-Q, respectively. An increase in Gt is observed with the decreasing RQD, Q, GSI, and JSP. There is a power function relationship between Gt and Ap with a coefficient of determination of (R2) = 0.6917. There is a linear relationship between Gt and Lu with a coefficient of determination of (R2) = 0.6302. The highest coefficient of determination of (R2 = 0.858) is determined with Equation (10) which is a logarithmic function between Gt and SPI values.
Besides the correlation coefficient (R2), the performances of empirical equations were evaluated according to statistical criteria, such as root mean square error (RMSE), mean absolute percentage error (MAPE), and variance account for (VAF). Prediction performance of empirical equation was utilized by previous researchers i.e., in [39,40].
If an equation has an excellent predictive capacity, the value of the RMSE will be zero. When the VAF value is closer to 100% or equal, prediction performance of empirical equation is accepted as perfect. Equations (4)–(11) are derived with simple regression analyses. Considering the VAF and RMSE values, the prediction performance of empirical equations, Equation (10) shows the best performance. Equations (4), (5), (9), and (11) give relatively better performance. Other correlations do not exhibit significant performance. Considering the MAPE value, Equations (5) and (10) show the better performance, respectively (Table 10).
SPSS (2002) [41] computer programme was used in the nonlinear stage of the statistical studies. Q class, GSI, RQD, Lugeon, SPI, and aperture were used as input parameters. Q class, GSI, and RQD are the rock mass properties and were used separately. SPI and Lugeon are also related with permeability, so SPI and Lugeon were defined separately as input parameter for the estimation of the Gt (Table 11).
The first step is to define the GSI and the Lugeon as the function of Gt parameters:
f(Q, Lugeon) = Gt.
A simple regression analysis between the measured Gt with the lugeon gives Equation (9) with a linear relationship (Figure 11b). Simple regression analysis between the measured Gt with the Q class gives Equation (5) with a logarithmic relationship. The nature of these relationships show that the nonlinear multiple regression is more suitable than the linear multiple regression.
The combination of Equations (9) and (5) can be defined as follows:
Gt = ALn(Q) + BLugeon − C.
A, B, C are the coefficients of the nonlinear multiple regression equation. The following equation for predicting the Gt is obtained by applying a nonlinear regression analysis using a statistical computer proram (SPSS 20 [41]
Gt(predict) = 1078Ln(Q) + 448Lugeon − 2576
The coefficient of determination (R2) between Gt(measured) and Gt(predicted) from Equation (17) is 0.755.
Later Aperture is added as an additional function of the Gt as follows;
f(Q,Lugeon,Aperture) = Gt,
Gt = ALn(Q) + BLugeon − CAperture − D.
A, B, C and D are the coefficients of the nonlinear multiple regression equation. The following equation for predicting the Gt is obtained by applying a nonlinear regression analysis;
Gt = 596Ln(Q) + 447Lugeon − 97921Aperture − 1653.2
The coefficient of determination (R2) between Gt(measured) and Gt(predicted) from Equation (20) is 0.773.
The same nonlinear regression analyses are performed SPI with Lugeon and Q as a function of grout take (Gt):
f(Q,SPI) = Gt.
Equation (23) is constructed as follows:
Gt(predict) = ALn(Q) + BLn(SPI) − C.
A, B, C are the coefficients of the nonlinear multiple regression equation. The following equation for predicting the Gt is obtained by applying a nonlinear regression analysis;
Gt(predict) = −216Ln(Q) + 5429Ln(SPI) + 159,712.
The coefficient of determination (R2) between Gt(measured) and Gt(predicted) from Equation (23) is 0.853.
Later, aperture is added as an additional function of the Gt as follows;
f(Q,SPI,aperture) = Gt.
Equation (26) is constructed as follows:
Gt(predict) = ALn(Q) + BLn(SPI) − CAperture + D.
A, B, C, and D are the coefficients of the nonlinear multiple regression equation. The following equation for predicting the Gt is obtained by applying a nonlinear regression analysis;
Gt(predict) = ALn(Q) + BLn(SPI) − CAperture + D,
Gt(predict) = −163Ln(Q) + 5492Ln(SPI) + 15,404Aperture + 161,333.
The coefficient of determination (R2) between Gt(measured) and Gt(predicted) from Equation (27) is obtained as 0.853.
The same procedures were applied and Gt (predict) was determined with GSI and RQD function parameters. Function modellings were performed according to equations derived with a simple regression equation and the results of the multiple nonlinear regression analyses are given in Table 12.
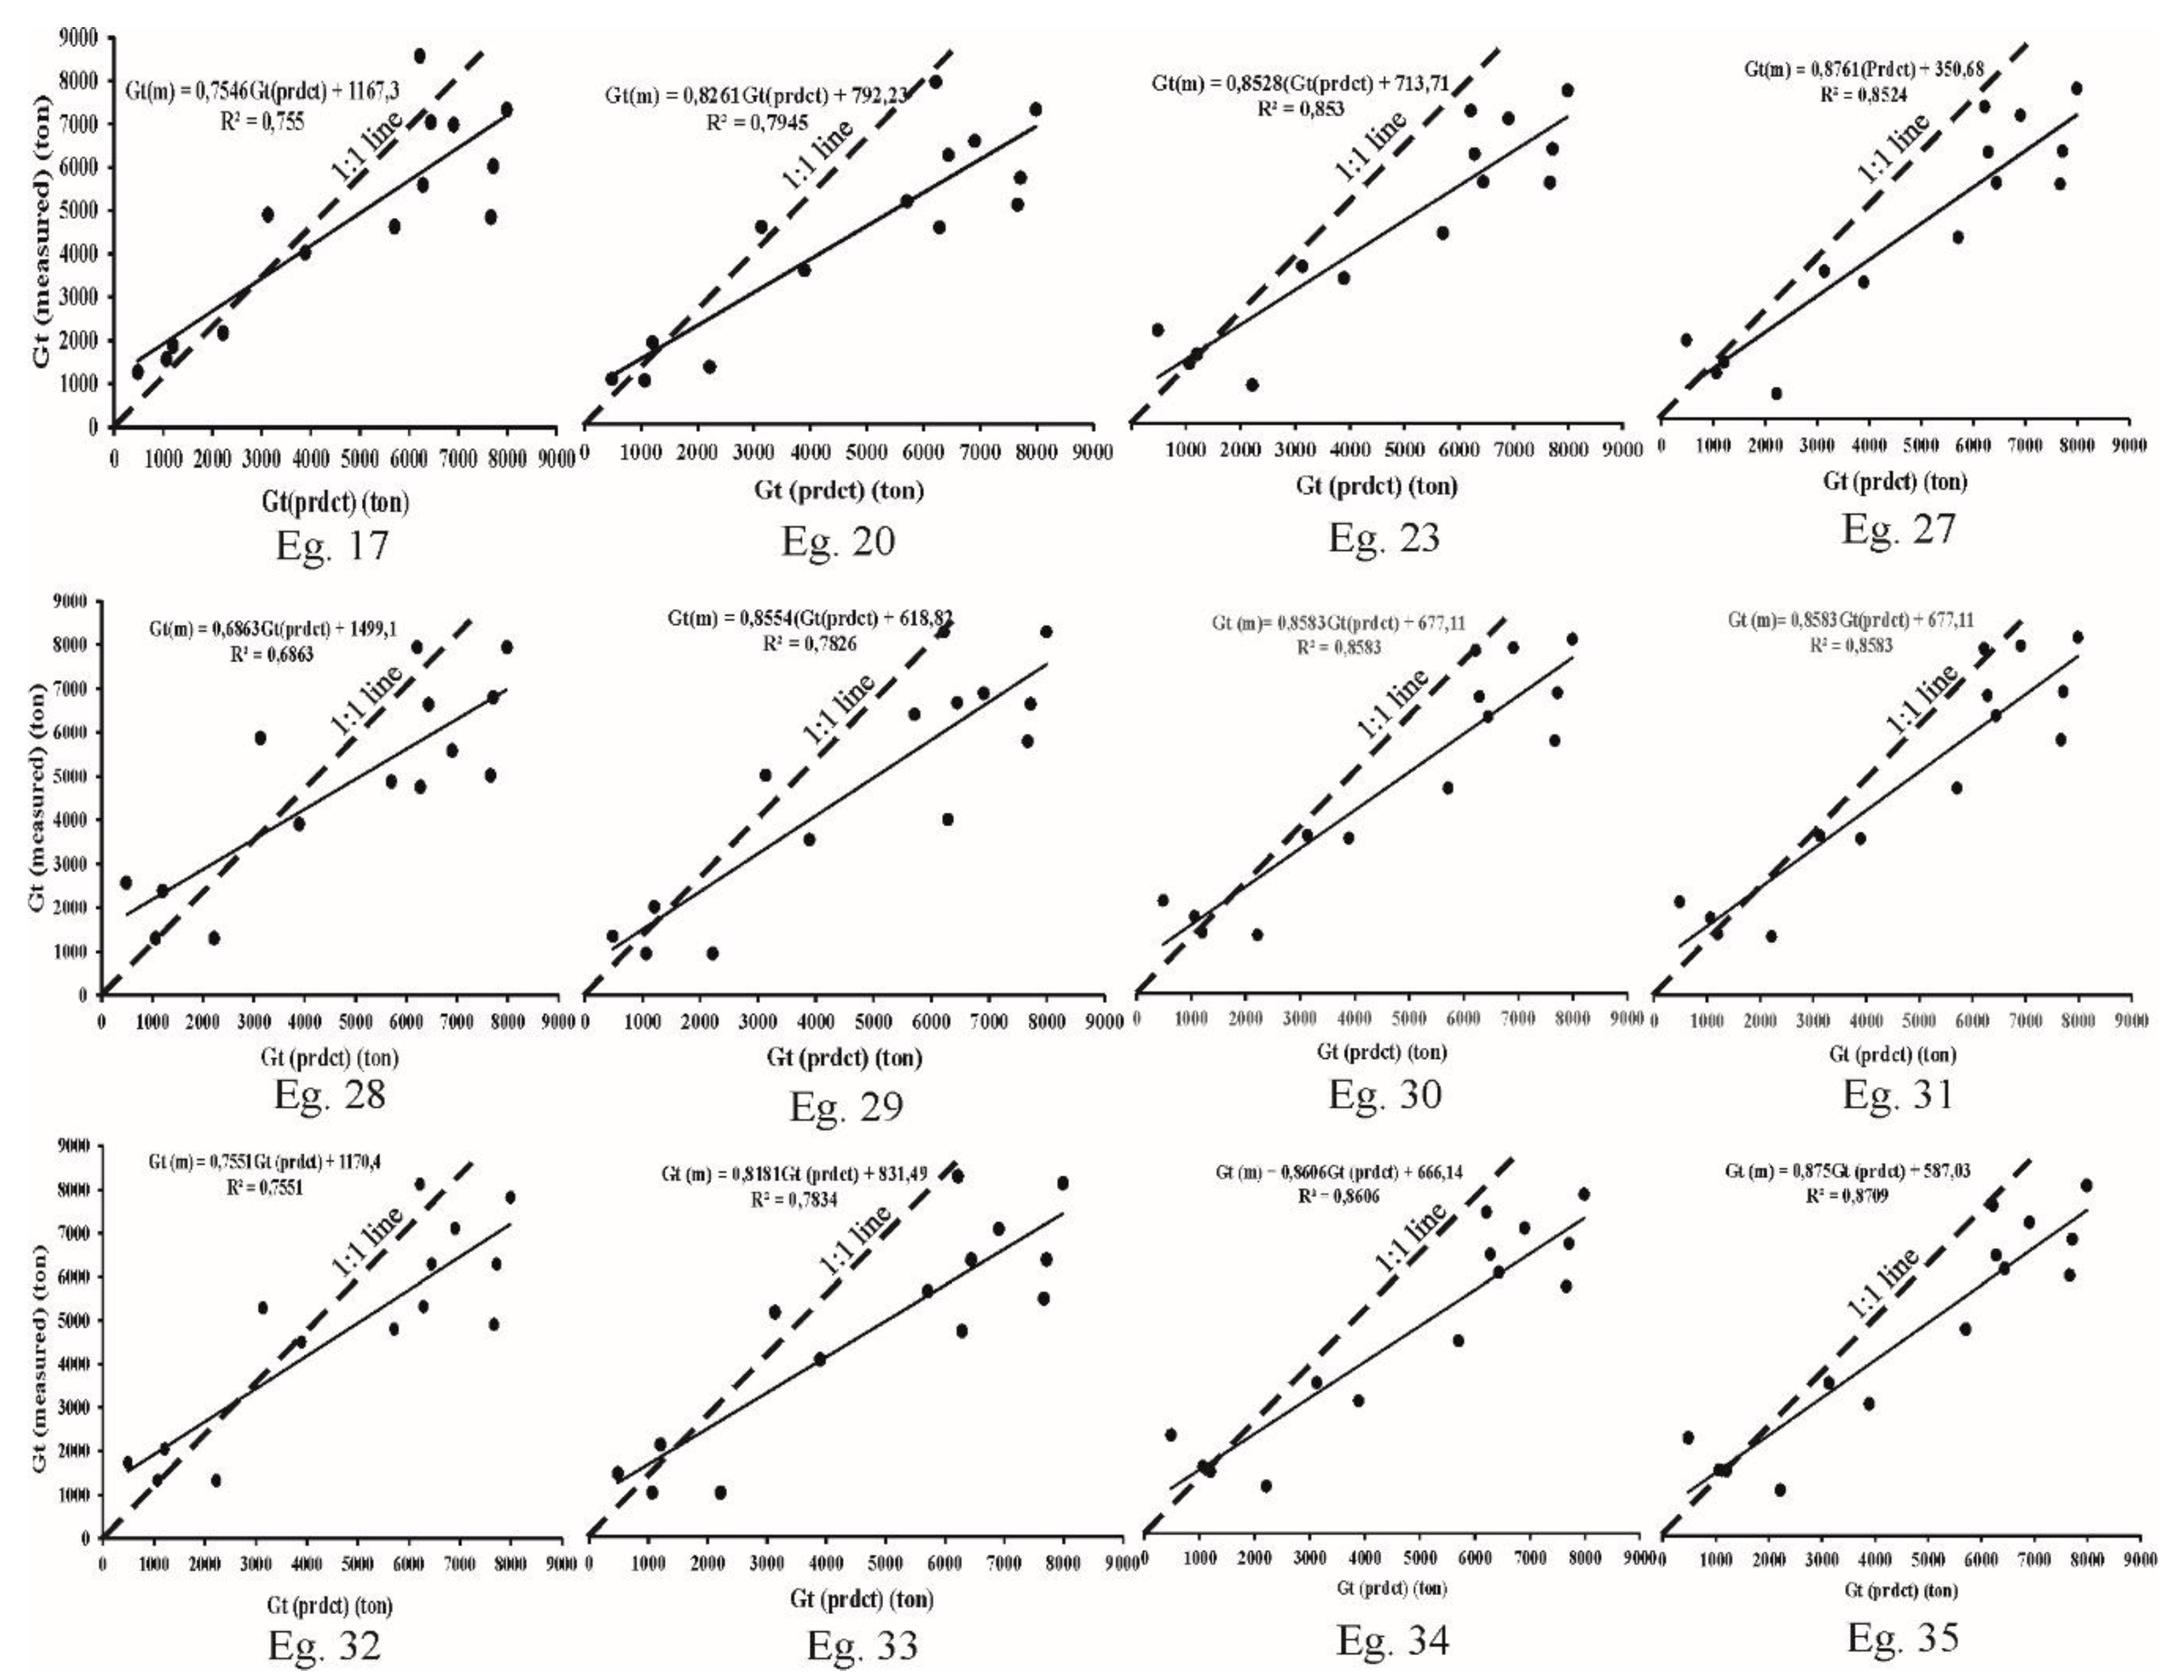
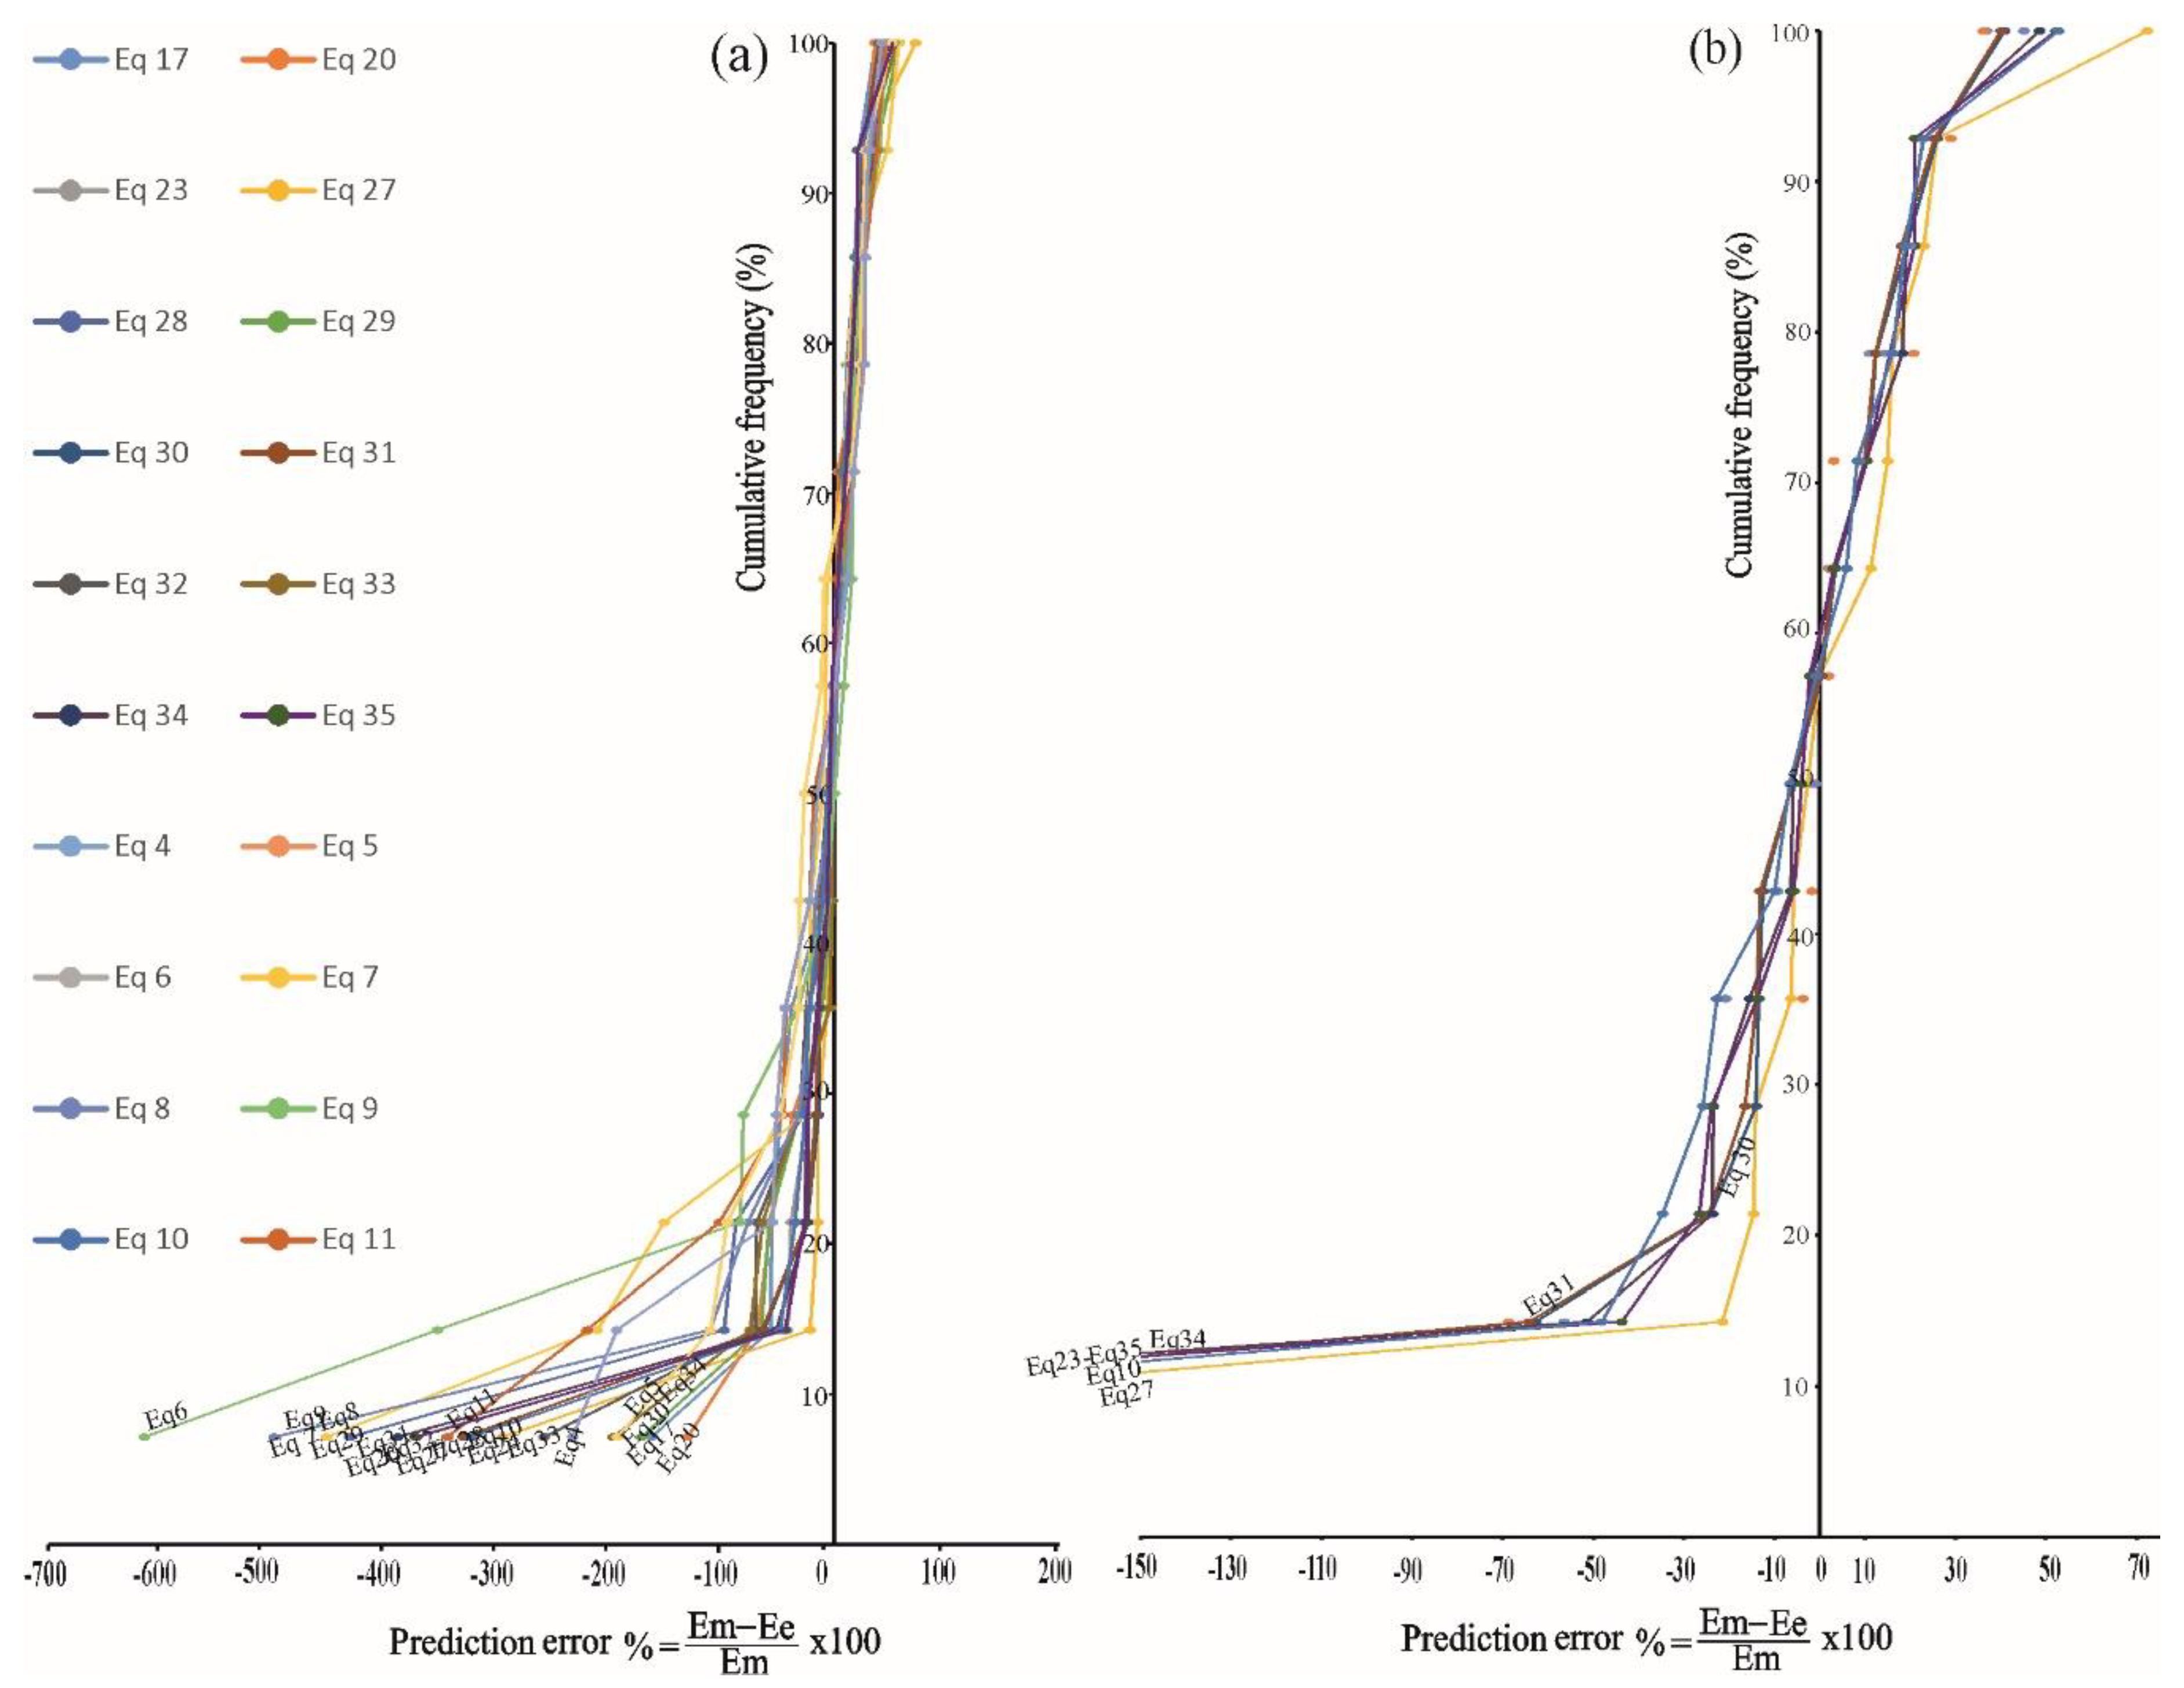
Considering the VAF, RMSE, R2, and MAPE values, Equations (17), (20), (23), (27), (28)–(30), (34), and (35) show the better prediction. Remaining empirical equations also exhibit significant performances. The predicted Gt values are correlated with the measured Gt amounts and graphs of correlation analyses are given in Figure 13. A 1:1 line was drawn in order to assess better the placement of the equations. Equations (23), (27), (30), (31), (34), and (35) show better performance according to the accumulations of data along the 1:1 line. On the other hand, all equations also show better performance. Prediction error (PE)-cumulative frequency chart is also another way to see prediction performance of empirical equations. The prediction error (PE)-cumulative frequency chart was drawn to define prediction performance of empirical equations (Figure 14). The negative values of PE mean the overestimation of empirical equations. To provide clarification of Figure 14a, the equation with lower VAF and higher RMSE values were removed and Figure 14b was drawn. Equation (35) shows the best prediction. Equations (23), (27), (30), (31) and (34) derived with multiple nonlinear regression analyses and Equation (10) derived with simple regression analysis show significant prediction performance.
8. Results and Conclusions
Permeability of dam site lithologies is an important subject for dam construction. Especially, construction of a dam on karstic lithology is very problematic. A pilot grouting was performed for the determination of the permeability and the groutability of geologic units along the Mut dam axis. Seven boreholes of a total depth of 895 m were drilled. A total of 624 Lugeon tests were performed and 669.321 kg of grouting mixture was injected inside the boreholes. There are three lithologies at dam Mut dam site.
The Lugeon test results both before grouting and after grouting are low in the basement clayey limestone and sandstone, siltstone claystone alternation levels. The injected grouting material amount is also very low. The joints are unconnected, and joint apertures and joint persistence are low or closed with grouting.
The RQD value range is poor to very good quality and discontinuity frequency is greater than 25 per meter in the karstic limestone block. Lugeon tests result are greater than 25 before grouting, but Lugeon test results are decreased in some levels (such as between 50 and 60 m) after grouting. The main solid material was injected in karstified limestone block levels. A total of 90.72% of (607,230 kg) total injected material was injected in karstified limestone. Karstic limestone block is permeable due to karstification and heavy discontinuities.
A series of simple regression analyses were conducted between Gt and the average values RQD, Q, GSI, the joint spacing, joint aperture, Lugeon, SPI, and k value. The determination coefficient of regression analyses for Gt-RQD, Gt-Q value, Gt-joint spacing, Gt-Lugeon, and Gt-SPI were considered acceptable. The highest determination coefficient was determined between Gt and SPI. Significant RMSE, VAF, and MAPE values were determined between the Gt and SPI correlation. There is an exponential relationship between Gt and the RQD, GSI, a power relationship between Gt and aperture, joint spacing, permeability coefficient, a logarithmic relationship between Gt and Q, SPI value, and a linear relationship between Gt and Lugeon data.
Subsequently, nonlinear multiple regression analyses were performed. Q class, GSI, and RQD were used separately for calculation of the empirical equation. Lugeon and secondary permeability index data were also used separately. Q class, GSI, and RQD were used as the initial input parameters, Lugeon and secondary permeability index were used as the second input parameters, and aperture of joints was used as the final input parameter. A series of empirical equations were derived with the nonlinear multiple regression analysis. All of the derived empirical equations have high regression coefficients and significant REMSE, VAF, and MAPE values. The prediction error (PE)-cumulative frequency chart was drawn to define prediction performance of empirical equations. The equation derived with RQD, SPI, and Aperture showed the best prediction for Gt (Equation (36)). Six equations derived with multiple nonlinear regression analyses and one equation derived with simple regression analysis exhibit significant prediction performance (Equations (10), (23), (27), (30), (31), (34), and (35)).
In this study, pilot grouting at the Mut dam site was evaluated. There was no permeability problem with the sandstone-siltstone-claystone alternations and basement clayey limestone. Karstic limestone block is permeable due to karstification and heavy discontinuities. Karstic limestone block rock mass properties correlated with grouting material amount. Prediction performance of the empirical equations derived in this study are mainly satisfactory. Even so, all empirical equations rely on the number and quality of the data used. Hence, for design purposes, the empirical equations should be controlled. This study must also be supported by another studies because the main result obtained from the study is that the empirical equations for Gt predictions have serious uncertainties. Especially, karstic environments are extremely complex, and it is too difficult to predict the amount of Gt from the rock mass parameters. For this reason, the empirical equations for Gt prediction is open to discussion. However, this study is an example for investigation of karstic limestone rock masses and the estimation of amount of grout material from rock mass properties. Estimation of amount of grout material is extremely important for dam construction because the amount of grout material directly affects the feasibility of dams.
Author Contributions
Conceptualization, A.K. and C.G.; methodology, A.K.; software, A.K.; validation, A.K. and C.G.; formal analysis, A.K.; investigation, A.K.; resources, A.K.; data curation, A.K.; writing—original draft preparation, A.K.; writing—review and editing, C.G. All authors have read and agreed to the published version of the manuscript.
Funding
This research received no external funding.
Acknowledgments
The authors would like to express their sincere thanks to geological engineers Serdar Ülker, Yaşar Alkılıç, Necmetting Gürsoy, and İhsan İçten for their permission to use data and valuable comments that improved this article. One of the authors, A. Kayabasi, is also grateful to his old workplace, the General Directorate of Electrical Power Researches Survey and Development Administration.
Conflicts of Interest
The authors declare no conflict of interest.
References
- Wyllie, D.C. Foundations on Rocks, 2nd ed.; E & FN Spon: London, UK, 1999. [Google Scholar]
- Lugeon, M. Barrage et Géologie; Dunod: Paris, France, 1933. [Google Scholar]
- Foyo, A.; Sánchez, A.M.; Tomillo, C. A proposal for a secondary permeability index obtained from water pressure tests in dam foundations. Eng. Geol. 2005, 77, 69–82. [Google Scholar] [CrossRef]
- Gürocak, Z.; Alemdağ, S. Assesment of permeability and injection depth at the Atasu Dam site (Turkey) based on experimental and numerical analyses. Bull. Eng. Geol. Environ. 2012, 71, 221–229. [Google Scholar] [CrossRef]
- Kiraly, L. Anisotropy and heterogeneity of permeability in fractured limestones. Eclogae Geol. Helv. 1969, 62, 613–619. [Google Scholar]
- Kiraly, L. Definition of the hydrogeological unit. Bull. Cent. Hydrogeol. 1978, 2, 83–216. [Google Scholar]
- Kiraly, L. Karstification and groundwater flow. In Evolution of Karst from Prekarst to Cessation; Gabrovsek, F., Ed.; Zalozba ZRC: Postojna, Slovenija, 2002; pp. 155–190. [Google Scholar]
- Hoek, E.; Bray, J.W. Rock Slope Engineering, 3rd ed.; Stephen Austin and Sons, Institute of Mining and Metallurgy: London, UK, 1981. [Google Scholar]
- Uromeihy, A.; Farrokhi, R. Evaluation groutability at Kamal-Saleh dam based on Lugeon test results. Bull. Eng. Geol. Environ. 2012, 71, 215–219. [Google Scholar] [CrossRef]
- Azimian, A.; Ajalloeian, R. Comparison between Lugeon with secondary permeability index obtained of water pressure test in rock masses. Electron. J. Geotec. Eng. 2013, 18, 1603–1612. [Google Scholar]
- Sadeghiyeh, S.M.; Hashemi, M.; Ajalloeian, R. Comparison of permeability and groutability of ostur dam site rock mass for grout curtain design. Rock Mech. Rock Eng. 2013, 46, 341–357. [Google Scholar] [CrossRef]
- Qureshi, U.M.; Khan, M.K.; Bessaih, N.; Al-Mawwali, K.; Al-Sadrani, K. An empirical relationship between in-situ permeability and RQD of discontinuous sedimentary rocks. Electron. J. Geotec. Eng. 2014, 19, 4781–4790. [Google Scholar]
- Kayabasi, A.; Yesiloglu-Gultekin, N.; Gokceoglu, C. Use of non linear prediction tools to assess rock mass permeability using various discontinuity parameters. Eng. Geol. 2015, 185, 1–9. [Google Scholar] [CrossRef]
- Sohrabi-Bidar, A.; Nis-Rastegar, A.; Zolfaghari, A. Estimation of the grout take using empirical relationship (case study: Bakhtiari dam site). Bull. Eng. Geol. Environ. 2016, 75, 425–438. [Google Scholar] [CrossRef]
- Farid, T.A.; Rizwan, M. Prediction of in situ permeability for limestone rock using rock quality designation index. World Acad. Sci. Eng. Technol. Int. J. Geotech. Geol. Eng. 2017, 11, 896–899. [Google Scholar]
- MGM. Turkish State Meteorological Service. Available online: https://mgm.gov.tr/eng/forecast-Citiesaspx (accessed on 25 September 2019).
- Ülker, S.; Alkılıç, Y.; Gürsoy, N. Mut Barajı Deneme Enjeksiyonu Sonuç Raporu; Elektrik İşleri etüt İdaresi Genel Müdürlüğü: Ankara, Turkey, 1997. (In Turkish) [Google Scholar]
- Gedik, A.; Birgili, Ş.; Yılmaz, H. Mut-Silifke-Ermenek Havzasının Jeolojisi ve Petrol Olanakları; General Directorate of Mıneral Research and Exploration (MTA): Ankara, Turkey, 1982. (In Turkish) [Google Scholar]
- Dalkılıç, H.; Balcı, V. 1/100 000 Scaled Silifke O30 Sheet of Turkey Geology Maps; General Directorate of Mıneral Research and Exploration (MTA): Ankara, Turkey, 2009. [Google Scholar]
- İçten, M.İ. Göksu Mut Dam Site Engineering Geology Report; General Directorate of Electrical Power Resources Survey and Development Administration (EIE): Ankara, Turkey, 1999. [Google Scholar]
- Deere, D.U. Technical description of rock cores for engineering purposes. Rock Mech. Eng. Geol. 1963, 1, 16–22. [Google Scholar]
- Barton, N.; Lion, R.; Lunde, J. Engineering classification of rock masses for the design of tunnel support. Rock Mech. 1974, 6, 189–236. [Google Scholar] [CrossRef]
- Hoek, E.; Marinos, P. A brief history of the development of the Hoek-Brown failure criterion. Soils Rocks 2007, 2, 1–8. [Google Scholar]
- Sönmez, H.; Ulusay, R. Modifications to the geological strength index (GSI) and their applicability to satability of slopes. Int. J. Rock Mech. Rock Sci. 1999, 36, 743–760. [Google Scholar] [CrossRef]
- Barton, N. Suggested methods for the quantitative description of discontinuities in rock masses. ISRM commission on Standardization of Laboratory and Field Tests. Int. J. Rock Mech. Min. Sci. Geomech. Abstr. 1978, 15, 319–368. [Google Scholar]
- Snow, D. Rock fracture spacings, openings and porosities. J. Soil Mech. Found. Div. Proc. ASCE 1968, 94, 73–91. [Google Scholar]
- Hoek, E.; Brown, E.T. Practical estimates of rock mass strength. Int. J. Rock Mech. Min. Sci. 1997, 34, 1165–1186. [Google Scholar] [CrossRef]
- Apte, M.G.; Price, P.N.; Nero, A.V.; Revzan, K. Predicting new hampshire indoor radon concentrations from geologic information and other covariates. Environ. Geol. 1999, 37, 181–194. [Google Scholar] [CrossRef] [Green Version]
- Akca, N. Correlation of SPT-CPT data from the United Arab Emirates. Eng. Geol. 2003, 67, 219–231. [Google Scholar] [CrossRef]
- Uddameri, V. Using statistical and artificial neural networkmodels to forecast potentiometric levels at a deep well in South Texas. Environ. Geol. 2007, 51, 885–895. [Google Scholar] [CrossRef]
- Sivrikaya, O. Models of compacted fine-grained soils used as mineral liner for solid waste. Environ. Geol. 2008, 53, 1585–1595. [Google Scholar] [CrossRef]
- Zorlu, K.; Gokceoglu, C.; Ocakoglu, F.; Nefeslioglu, H.A.; Acikalin, S. Prediction of uniaxial compressive strength of sandstones using petrography-based models. Eng. Geol. 2008, 96, 141–158. [Google Scholar] [CrossRef]
- Yagiz, S.; Gokceoglu, C.; Sezer, E.; Iplikci, S. Application of two non-linear prediction tools to the estimation of tunnel boring machine performance. Eng. Appl. Artif. Intell. 2009, 22, 818–824. [Google Scholar] [CrossRef]
- Yagiz, S.; Gokceoglu, C. Application of fuzzy inference system and nonlinear regression models for predicting rock brittleness. Expert Syst. Appl. 2010, 37, 2265–2272. [Google Scholar] [CrossRef]
- Lee, C.-C.; Lee, C.-H.; Yeh, H.-F.; Lin, H.-I. Modeling spatial fracture intensity as a control on flow in fractured rock. Environ. Earth Sci. 2011, 63, 1199–1211. [Google Scholar] [CrossRef]
- Valia, B.; Arpa, G. Finding the relationship between RQD and fracture frequency in the different Ok tedilithologies. Procedia Earth Planet. Sci. 2013, 6, 403–410. [Google Scholar] [CrossRef] [Green Version]
- Öge, F.İ.; Çırak, M. Relating rock mass properties with Lugeon value using multiple regression and nonlinear in an underground mine site. Bull. Eng. Geol. Environ. 2019, 78, 1113–1126. [Google Scholar] [CrossRef]
- Rahimi, E.; Teshnizi, E.S.; Rastegarna, A.; Al-Shariati, E.M. Cement take estimation using neural networks and statistical analysis in Bakhtiari and Karun 4 dam sites, in south west of Iran. Bull. Eng. Geol. Environ. 2019, 78, 2817–2834. [Google Scholar] [CrossRef]
- Alvarez Grima, M.; Babuska, R. Fuzzy model for the pre-diction of unconfined compressive strength of rock samples. Int. J. Rock Mech. Min. Sci. 1999, 36, 339–349. [Google Scholar] [CrossRef]
- Finol, J.; Guo, Y.K.; Jing, X.D. A rule based fuzzy model for the prediction of petrophysical rock parameters. J. Pet. Sci. Eng. 2001, 29, 97–113. [Google Scholar] [CrossRef]
- SPSS. Statistical Package for the Social Sciences (v.11.5); SPSS Inc.: Chicago, IL, USA, 2002. [Google Scholar]
Figure 1.
A sketch of grouting technical equipment.

Figure 2.
The location map of the Mut dam site.

Figure 3.
Geological map of the Mut dam site (modified after Dalkılıç and Balcı [19]).
Figure 3.
Geological map of the Mut dam site (modified after Dalkılıç and Balcı [19]).

Figure 4.
(a) Geological map of the dam site and pilot grouting location. (b) Geologic cross section along the dam site (A-A’).
Figure 4.
(a) Geological map of the dam site and pilot grouting location. (b) Geologic cross section along the dam site (A-A’).

Figure 5.
Frequency distributions of Lugeon values before and after grouting: (A) karstic limestone; (B) sandstone siltstone claystone alternations; (C) clayey limestone.
Figure 5.
Frequency distributions of Lugeon values before and after grouting: (A) karstic limestone; (B) sandstone siltstone claystone alternations; (C) clayey limestone.

Figure 6.
Distribution of injected grout material amount in boreholes.

Figure 7.
The log description of karstic limestone block in A series boreholes and K borehole.

Figure 8.
The log descriptions of karstic limestone block in B series boreholes.

Figure 9.
Geological strength index (GSI) values of karstic limestone block on the quantitative GSI chart.
Figure 9.
Geological strength index (GSI) values of karstic limestone block on the quantitative GSI chart.

Figure 10.
Lugeon tests, rock quality designation values RQD, joint frequency, injected material amount, and lithology trend graph in A series boreholes and K borehole (Ʀkb: Belveren limestone block, Tomd: sandstone-siltstone-claystone alternation, Tomf: clayey limestone). (a) Borehole A1; (b) Borehole A2; (c) Borehole A3; (d) Borehole K.

Figure 11.
Lugeon tests, RQD, and injected material amount trend graph in B series boreholes (Ʀkb: Belveren limestone block). (a) Borehole B1; (b) Borehole B2; (c) Borehole B3.
Figure 11.
Lugeon tests, RQD, and injected material amount trend graph in B series boreholes (Ʀkb: Belveren limestone block). (a) Borehole B1; (b) Borehole B2; (c) Borehole B3.

Figure 12.
Graphs showing the relation between (a) grout take and RQD, (b) grout take and Q value, (c) grout take and GSI, (d) grout take and joint spacing (JSP), (e) grout take and joint aperture (Ap), (f) grout take and Lugeon (Lu), (g) grout take and secondary permeability coefficient (SPI), (h) grout take and permeability coefficient (k).

Figure 13.
Graphs showing the relation between measured grouting amount Gt (measured) and the predicted grouting amount, Gt (prdct).
Figure 13.
Graphs showing the relation between measured grouting amount Gt (measured) and the predicted grouting amount, Gt (prdct).

Figure 14.
Graphs showing the relationships between prediction error and cumulative frequency for the empirical equations evaluated in this study. (a) The evaluation all empirical equations and (b) the evaluation for the empirical equations between −150% and +70%.
Figure 14.
Graphs showing the relationships between prediction error and cumulative frequency for the empirical equations evaluated in this study. (a) The evaluation all empirical equations and (b) the evaluation for the empirical equations between −150% and +70%.


Table 1.
General properties of the Mut dam.
| Dam Name | Mut Dam |
|---|---|
| Dam type | Rock fill |
| River | Göksu |
| Dam height from foundation (m) | 120 |
| Dam height from talveg (m) | 113 |
| Talveg elevation (m) | 197 |
| Cret elevation (m) | 310 |
| River elevation at dam axis (m) | 195 |
| Maximum reservoir elevation (m) | 305 |
| Cret length (m) | 430 |
| Energy tunnel length (m) | 1250 |
| Penstock length (m) | 395 |
| Power house tailwater elevation (m) | 160 |
| Installed power capacity (MW) | 91 |
| Long time average flow (m3/s) | 30,486 |
Table 2.
Grouting mixture types and compositions for A series boreholes.
| Mixture Types | Water/Cement/Sand Weight Ratio | Grouting Mixture Composition | ||
|---|---|---|---|---|
| Water (L) | Cement (kg) | Bentonite (kg) | ||
| A | 5/1 | 100 | 20 | 0.100 |
| B | 4/1 | 100 | 25 | 0.125 |
| C | 3/1 | 150 | 50 | 0.250 |
| D | 2/1 | 100 | 50 | 0.250 |
| E | 1/1 | 100 | 100 | 0.500 |
| F | 1/1 | 100 | 100 | 1.000 |
Table 3.
Grouting mixture types and compositions for B series boreholes.
| Mixture Types | Water/Cement/Sand Weight Ratio | Grouting Mixture Composition | |||
|---|---|---|---|---|---|
| Water (L) | Cement (kg) | Sand (kg) | Bentonite (kg) | ||
| A | 5/1 | 100 | 20 | 0 | 0.100 |
| B | 4/1 | 100 | 25 | 0 | 0.125 |
| C | 3/1 | 150 | 50 | 0 | 0.250 |
| D | 2/1 | 100 | 50 | 0 | 0.250 |
| E | 1/1/0.25 | 100 | 100 | 25 | 2.000 |
| F | 1/1/0.1 | 100 | 100 | 100 | 5.000 |
Table 4.
Information about boreholes, tests, and grouting at Mut dam site.
| Borehole No. | Total Depth (m) | Number of Lugeon Test | Number of Grouting | Total Grouting (m) | Injected Solid Material (kg) |
|---|---|---|---|---|---|
| A1 | 170 | 120 | 50 | 122.00 | 94,358 |
| A2 | 170 | 124 | 64 | 122.50 | 96,677 |
| A3 | 170 | 124 | 68 | 126.50 | 115,414 |
| K | 145 | 104 | 55 | 101.50 | 84,943 |
| B1 | 80 | 50 | 35 | 55.00 | 116,755 |
| B2 | 80 | 50 | 34 | 52.50 | 96,712 |
| B3 | 80 | 48 | 28 | 52.50 | 64,462 |
| K | 104 | ||||
| Total | 895 | 724 | 334 | 632.50 | 669,321 |
Table 5.
Injected solid material amount in karstified limestone lithology.
| Depth (m) | Solid Material Amount (kg) |
|---|---|
| 20.00–25.00 | 28.593 |
| 25.00–30.00 | 82.699 |
| 30.00–35.00 | 86.604 |
| 35.00–40.00 | 97.138 |
| 40.00–45.00 | 104.910 |
| 45.00–50.00 | 72.068 |
| 50.00–55.00 | 73.525 |
| 55.00–60.00 | 41.855 |
| 60.00–65.00 | 9617 |
| 65.00–70.00 | 10.221 |
| Total | 607.230 |
Table 6.
Statistical evaluation of rock mass properties from the Mut dam site.
| Parameter | Lithology | Min | Max | Mean | Std. Deviation | Variance |
|---|---|---|---|---|---|---|
| RQD (%) | 10 | 100 | 32.1 | 25.88 | 669.77 | |
| Q | Karstic | 0.01 | 13.5 | 0.63 | 1.73 | 2.98 |
| GSI | limestone | 22 | 61 | 39.32 | 7.09 | 50.32 |
| Joint spacing (mm) | block | 35.66 | 344.23 | 69.73 | 56.33 | 3172.91 |
| Aperture (mm) | 0.0025 | 0.112 | 0.019 | 0.029 | 0.00086 | |
| k (mm/sn) | 4.48 × 10⁻⁵ | 0.069 | 0.044 | 0.025 | 000063 | |
| SPI (L/s m2) | 0 | 1.27 × 10⁻¹² | 4.57 × 10⁻¹³ | 2.80 × 10⁻¹³ | 7.87 × 10⁻²⁶ |
Table 7.
Rock mass classification based on the secondary permeability index (SPI) [2].
Table 7.
Rock mass classification based on the secondary permeability index (SPI) [2].
| Rock Mass Class | SPI 10−14 (L/s m2) | Classification | Ground Treatment |
|---|---|---|---|
| Class A | <2.16 | Excellent | Needless |
| Class B | 2.16–17.2 | Good-Fair | Local |
| Class C | 17.2–172 | Poor | Required |
| Class D | >172 | Very poor | Extensive |
Table 8.
SPI classes of Mut Dam sites pilot grouting boreholes.
| Depth (m) | Lithology | A1 | A2 | A3 | K | B1 | B2 | B3 |
|---|---|---|---|---|---|---|---|---|
| 00–05 | Karstic limestone | D | D | D | D | B | D | D |
| 05–10 | D | D | D | D | B | D | D | |
| 10–15 | D | D | D | D | D | D | D | |
| 15–20 | D | D | D | D | D | D | D | |
| 20–25 | D | D | D | D | D | D | D | |
| 25–30 | D | D | D | D | D | D | D | |
| 30–35 | D | D | D | D | D | D | D | |
| 35–40 | D | D | D | D | D | D | D | |
| 40–45 | D | D | D | D | D | D | D | |
| 45–50 | D | D | D | D | D | D | D | |
| 50–55 | D | D | D | D | D | D | D | |
| 55–60 | D | D | D | D | D | D | D | |
| 60–65 | D | D | D | D | D | D | D | |
| 65–70 | D | D | D | D | D | D | D | |
| 70–75 | Sandstone-siltstone-claystone | C | A | D | D | D | B | D |
| 75–80 | A | A | A | A | D | B | D | |
| 80–85 | A | A | A | A | ||||
| 85–90 | A | A | A | A | ||||
| 90–95 | A | A | A | A | ||||
| 95–100 | A | A | A | A | ||||
| 100–105 | A | A | A | A | ||||
| 105–110 | A | A | A | A | ||||
| 110–115 | A | A | A | A | ||||
| 115–120 | A | A | A | A | ||||
| 120–125 | A | A | A | A | ||||
| 125–130 | A | A | A | A | ||||
| 130–135 | A | A | A | A | ||||
| 135–140 | A | A | A | A | ||||
| 140–145 | A | A | A | A | ||||
| 145–150 | A | A | A | A | ||||
| 150–155 | Clayey limestone | C | B | A | A | |||
| 155–160 | C | B | A | A | ||||
| 165–170 | C | B | A | A |
Table 9.
Average of all calculated data depending on depth.
| Depth (m) | Lithology | RQD (%) | Q Value | GSI Value | Joint Spacing (mm) | Lugeon | SPI (L/s m2) (×10−13) Spacing (cm) | Permeability (mm/sn) | Aperture (mm) | Grout (kg/m) |
|---|---|---|---|---|---|---|---|---|---|---|
| 00–05 | Karstic limestone | 42 | 3.30 | 41 | 69.83 | 20 | 5.50423 | 0.0327 | 0.0169 | 6283 |
| 05–10 | 69 | 1.34 | 39 | 141.16 | 22 | 6.5749 | 0.0153 | 0.0092 | 6905 | |
| 10–15 | 53 | 0.30 | 44 | 95.72 | 25 | 7.20049 | 0.0294 | 0.0095 | 7987 | |
| 15–20 | 62 | 1.52 | 44 | 111.68 | 25 | 6.87888 | 0.0206 | 0.0083 | 6215 | |
| 20–25 | 34 | 0.24 | 43 | 67.66 | 20 | 4.70122 | 0.0457 | 0.0115 | 7665 | |
| 25–30 | 24 | 0.09 | 36 | 47.50 | 25 | 5.26032 | 0.0509 | 0.0234 | 7713 | |
| 30–35 | 24 | 0.23 | 35 | 43.06 | 25 | 4.7066 | 0.0465 | 0.0229 | 6442 | |
| 35–40 | 26 | 0.13 | 38 | 50.57 | 21 | 3.65002 | 0.0498 | 0.0134 | 5707 | |
| 40–45 | 34 | 0.17 | 39 | 52.16 | 19 | 3.01047 | 0.0377 | 0.0199 | 3891 | |
| 45–50 | 27 | 0.11 | 41 | 48.40 | 22 | 3.11916 | 0.0482 | 0.0211 | 3131 | |
| 50–55 | 18 | 0.08 | 40 | 39.36 | 16 | 2.07051 | 0.0539 | 0.0218 | 1202 | |
| 55–60 | 10 | 0.02 | 34 | 36.08 | 18 | 2.18498 | 0.0691 | 0.0255 | 484 | |
| 60–65 | 10 | 0.04 | 30 | 36.08 | 17 | 1.93192 | 0.0691 | 0.0255 | 1063 | |
| 65–70 | 10 | 0.07 | 30 | 36.08 | 17 | 1.79006 | 0.0691 | 0.0255 | 2216 | |
| 70–75 | Sandstone-siltstone-claystone | 10 | 0.06 | 29 | 36.40 | 0 | 6.43863 | 0.0691 | 0.0364 | 17 |
| 75–80 | 10 | 0.06 | 30 | 36.40 | 0 | 0.61631 | 0.0691 | 0.0364 | 91 | |
| 80–85 | 10 | 0.06 | 26 | 36.40 | 0 | 0 | 0.0691 | 0.0364 | 3 | |
| 85–90 | 11 | 0.08 | 28 | 36.87 | 0 | 0 | 0.0661 | 0.0361 | 1 | |
| 90–95 | 14 | 0.09 | 30 | 37.97 | 0 | 0.00831864 | 0.0623 | 0.0356 | 0 | |
| 95–100 | 11 | 0.08 | 40 | 36.87 | 0 | 0.00794893 | 0.0661 | 0.0361 | 0 | |
| 100–105 | 10 | 0.06 | 32 | 36.40 | 0 | 0 | 0.0691 | 0.0364 | 0 | |
| 105–110 | 14 | 0.10 | 33 | 37.97 | 0 | 0 | 0.0623 | 0.0356 | 0 | |
| 110–115 | 10 | 0.08 | 34 | 36.40 | 0 | 0 | 0.0691 | 0.0364 | 0 | |
| 115–120 | 10 | 0.07 | 35 | 36.40 | 0 | 0 | 0.0691 | 0.0364 | 0 | |
| 120–125 | 20 | 0.15 | 39 | 42.31 | 0 | 0 | 0.0571 | 0.0351 | 0 | |
| 125–130 | 10 | 0.08 | 37 | 36.40 | 0 | 0 | 0.0691 | 0.0364 | 0 | |
| 130–135 | 12 | 0.06 | 36 | 37.29 | 0 | 0.0202091 | 0.0651 | 0.0400 | 0 | |
| 135–140 | 47 | 0.37 | 48 | 145.17 | 6 | 0.342064 | 0.0329 | 0.0351 | 0 | |
| 140–145 | 100 | 2.00 | 55 | 353.85 | 2 | 0.0984153 | 0.0000 | 0.0003 | 0 | |
| 145–150 | 100 | 2.00 | 55 | 353.85 | 1 | 0.0807122 | 0.0000 | 0.0003 | 0 | |
| 150–155 | Clayey limestone | 100 | 2.00 | 56 | 353.85 | 4 | 0.234909 | 0.0000 | 0.0003 | 0 |
| 155–160 | 42 | 3.30 | 41 | 69.83 | 11 | 5.50423 | 0.0327 | 0.0169 | 6283 | |
| 165–170 | 69 | 1.34 | 39 | A | 17 | 0 | 0.0153 | 0.0092 | 6905 |
Table 10.
The values of the root mean square errors (RMSE), values account for (VAF), and mean absolute percentage error (MAPE) estimated grout take.
Table 10.
The values of the root mean square errors (RMSE), values account for (VAF), and mean absolute percentage error (MAPE) estimated grout take.
| Equation No. | Empirical Equations | R2 | RMSE | VAF | MAPE |
|---|---|---|---|---|---|
| 4 | Gt(prdct) = 14,690e−0.046RQD | 0.72 | 1.93 | 41.19 | 37.31 |
| 5 | Gt(prdct) = −1984ln(Q) + 1107.3 | 0.64 | 1.51 | 64.04 | 65.12 |
| 6 | Gt(prdct) = 309,291e−0.116GSI | 0.36 | 2.48 | 5.96 | 69.36 |
| 7 | Gt(prdct) = 5 × 10⁶SP−1.784 | 0.78 | 1.48 | 65.62 | 34.92 |
| 8 | Gt(prdct) = 5 × 10⁶Ap1.772 | 0.69 | 1.71 | 56.10 | 38.55 |
| 9 | Gt(prdct) = 658.71(Lu) − 8959.9 | 0.63 | 1.53 | 63.02 | 63,23 |
| 10 | Gt(prdct) = 5030ln(SPI) − 1880.7 | 0.85 | 0.97 | 85.08 | 42,66 |
| 11 | Gt(prdct) = 541.907k1.576 | 0.63 | 1.77 | 50.17 | 45.93 |
Table 11.
Multiple regressn equations employed in the study.
| Step No. | Function | Equation | Combined Eq. No. | Constants |
|---|---|---|---|---|
| 1 | f(Q, Lu) = Gt(prdct) | Gt(prdct) = Axn(Q) + BLu − C | Equation (5), Equation (9) | A,B,C |
| 2 | f(Q,Lu, Ap) = Gt(prdct) | Gt(prdct) = ALn(Q) + BLu − CAp − D | Equation (5), Equation (8), Equation (9) | A,B,C,D |
| 3 | f(Q,SPI) = Gt(prdct) | Gt(prdct) = ALn(Q) + BLn(SPI) − C | Equation (5), Equation (10) | A,B,C |
| 4 | f(Q,SPI,Ap) = Gt(prdct) | Gt(prdct) = ALn(Q) + BLn(SPI) −CAp + D | Equation (5), Equation (9), Equation (10) | A,B,C,D |
| 5 | f(GSI, Lu) = Gt(prdct) | Gt(prdct) = ALn(GSI) + BLu − C | Equation (6), Equation (9) | A,B,C |
| 6 | f(GSI,Lu, Ap) = Gt(prdct) | Gt(prdct) = ALn(GSI) + BLu – Cap − D | Equation (6), Equation (8), Equation (9) | A,B,C,D |
| 7 | f(GSI,SPI) = Gt(prdct) | Gt(prdct) = ALn(GSI) + BLn(SPI) − C | Equation (6), Equation (10) | A,B,C |
| 8 | f(GSI,SPI,Ap) = Gt(prdct) | Gt(prdct) = ALn(GSI) + BLn(SPI) − CAp + D | Equation (6), Equation (9), Equation (10) | A,B,C,D |
| 9 | f(RQD, Lu) = Gt(prdct) | Gt(prdct) = ALn(RQD) + BLu − C | Equation (4), Equation (9) | A,B,C |
| 10 | f(RQD,Lu, Ap) = Gt(prdct) | Gt(prdct) = AxLn(RQD) + BxLu− CxAp − D | Equation (4), Equation (8), Equation (9) | A,B,C,D |
| 11 | f(RQD,SPI) = Gt(prdct) | Gt(prdct) = ALn(RQD) + BLn(SPI) − C | Equation (4), Equation (10) | A,B,C |
| 12 | f(RQD,SPI,Ap) = Gt(prdct) | Gt(prdct) = ALn(RQD) + BLn(SPI) − CAp + D | Equation (4), Equation (9), Equation (10) | A,B,C,D |
Table 12.
The values of the root mean square errors (RMSE), values account for (VAF), and mean absolute percentage error (MAPE) estimated grout take.
Table 12.
The values of the root mean square errors (RMSE), values account for (VAF), and mean absolute percentage error (MAPE) estimated grout take.
| Eq. No. | Empirical Equations | R2 | RMSE | VAF | MAPE |
|---|---|---|---|---|---|
| 17 | Gt(prdct) = 1078LN(Q) + 448(Lu) − 2576 | 0.755 | 1.4 | 75.50 | 33.76 |
| 20 | Gt(prdct) = −596.283LN(Q) + 446.607(Lu) – 97920.747(Ap) – 1653.2 | 0.773 | 1.14 | 79.32 | 29.63 |
| 23 | Gt(prdct) = 216LN(Q) + 5429LN(SPI) + 159.712 | 0.853 | 0.96 | 85.29 | 45.99 |
| 27 | Gt(prdct) = −163LN(Q) + 5492LN(SPI) + (15.405Ap) + 161.333 | 0.853 | 0.10 | 85.17 | 37.41 |
| 28 | Gt(prdct) = 5693.334LN(GSI) + 557.859Lu – 27546.85 | 0.686 | 1.41 | 68.63 | 58.36 |
| 29 | Gt(prdct) = 886.849LN(GSI) + 497.875Lu−180.552 (Ap) + 898.436 | 0.758 | 1.19 | 77.58 | 35.84 |
| 30 | Gt(prdct) = −2572.757LN(GSI) + 5483.395LN(SPI) + 171007.6 | 0.858 | 0.94 | 85.83 | 41.14 |
| 31 | Gt(prdct) = −2688LN(GSI) + 5452LN(SPI)-(4918Ap) + 170643.231 | 0.858 | 0.94 | 86.04 | 41.21 |
| 32 | Gt(prdct) = 1931.584LN(RQD) + 409.128(Lu) – 10077.57 | 0.755 | 1.24 | 75.51 | 42.51 |
| 33 | Gt(prdct) = 1001.774LN(RQD) + 436.383(Lu) – 94995.23(Ap) − 5,876,032 | 0.797 | 1.17 | 78.18 | 36.51 |
| 34 | Gt(prdct) = −937.386LN(RQD) + 6132.818LN(SPI) + 183306.319 | 0.861 | 0.94 | 86.06 | 45.58 |
| 35 | Gt(prdct) = −1164.606LN(RQD) + 6139.639LN(SPI) – 25131.793(Ap) + 184701.957 | 0.871 | 0.90 | 87.09 | 43.94 |
© 2019 by the authors. Licensee MDPI, Basel, Switzerland. This article is an open access article distributed under the terms and conditions of the Creative Commons Attribution (CC BY) license (http://creativecommons.org/licenses/by/4.0/).
Share and Cite
MDPI and ACS Style
Kayabasi, A.; Gokceoglu, C. An Assessment on Permeability and Grout Take of Limestone: A Case Study at Mut Dam, Karaman, Turkey. Water 2019, 11, 2649. https://doi.org/10.3390/w11122649
AMA Style
Kayabasi A, Gokceoglu C. An Assessment on Permeability and Grout Take of Limestone: A Case Study at Mut Dam, Karaman, Turkey. Water. 2019; 11(12):2649. https://doi.org/10.3390/w11122649
Chicago/Turabian StyleKayabasi, Ali, and Candan Gokceoglu. 2019. "An Assessment on Permeability and Grout Take of Limestone: A Case Study at Mut Dam, Karaman, Turkey" Water 11, no. 12: 2649. https://doi.org/10.3390/w11122649
Note that from the first issue of 2016, this journal uses article numbers instead of page numbers. See further details here.