Characterizing Consecutive Flooding Events after the 2017 Mt. Salto Wildfires (Southern Italy): Hazard and Emergency Management Implications

 ,
,  , ,
, ,
Abstract
:1. Introduction
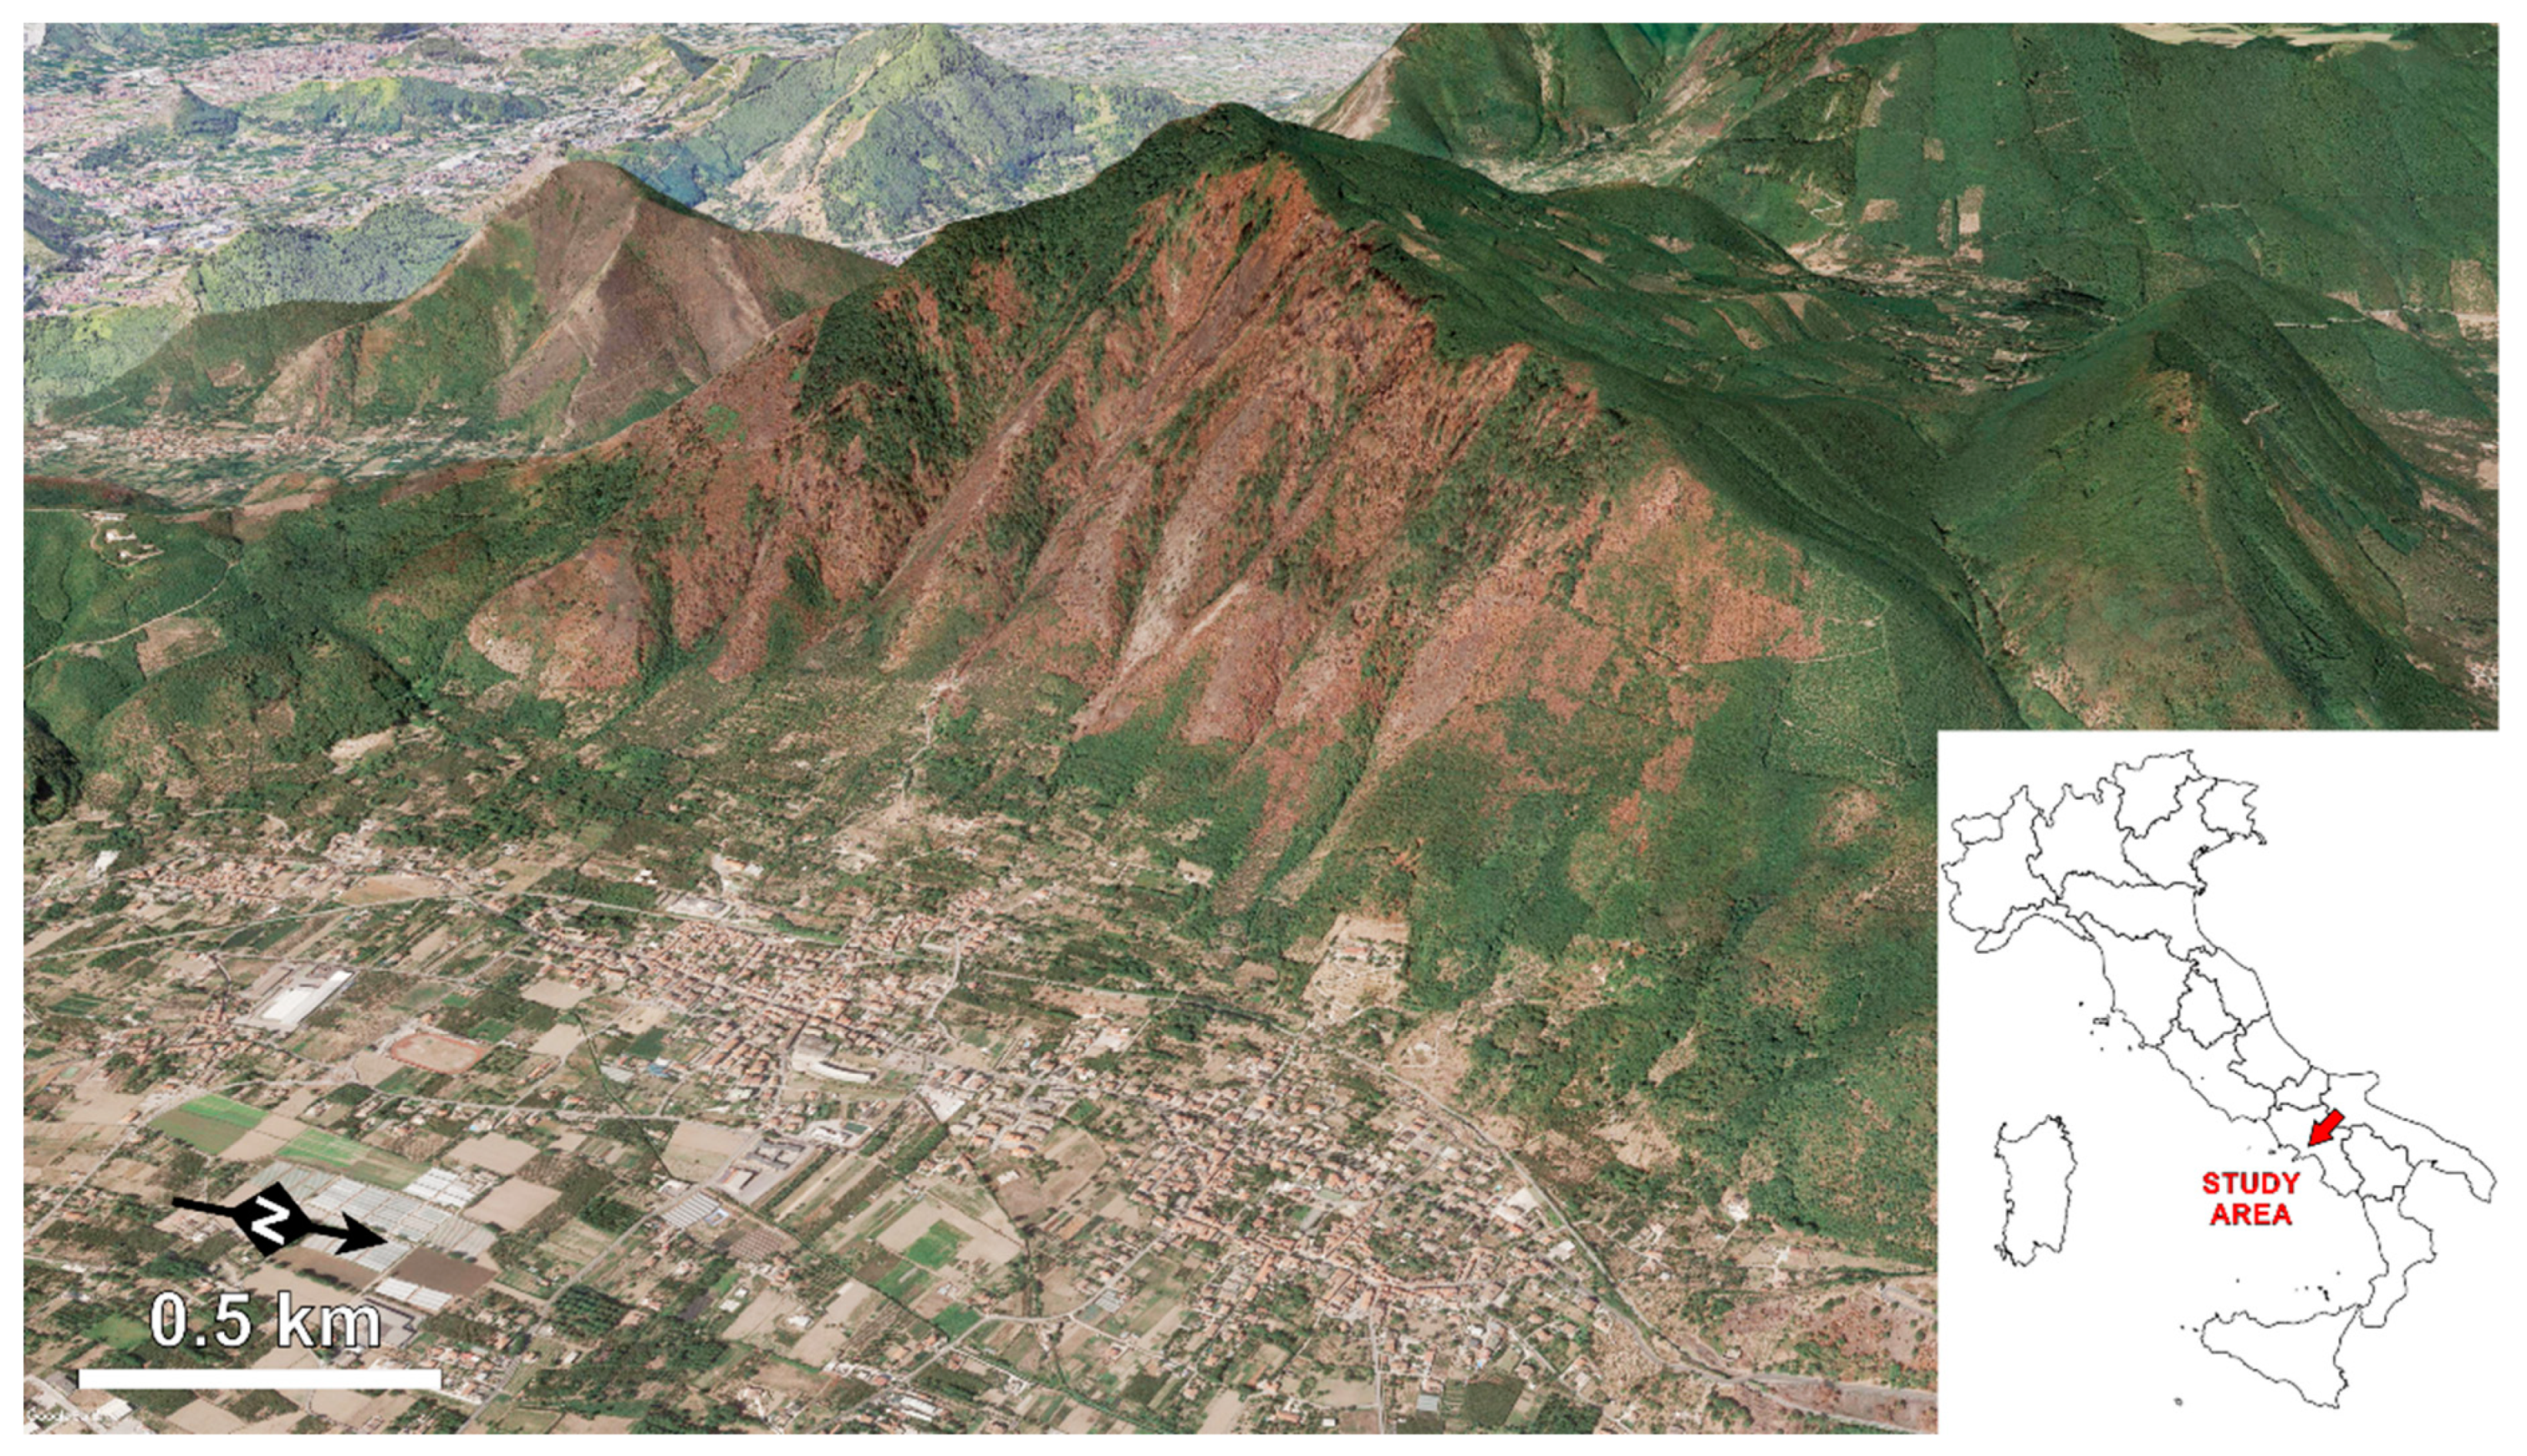
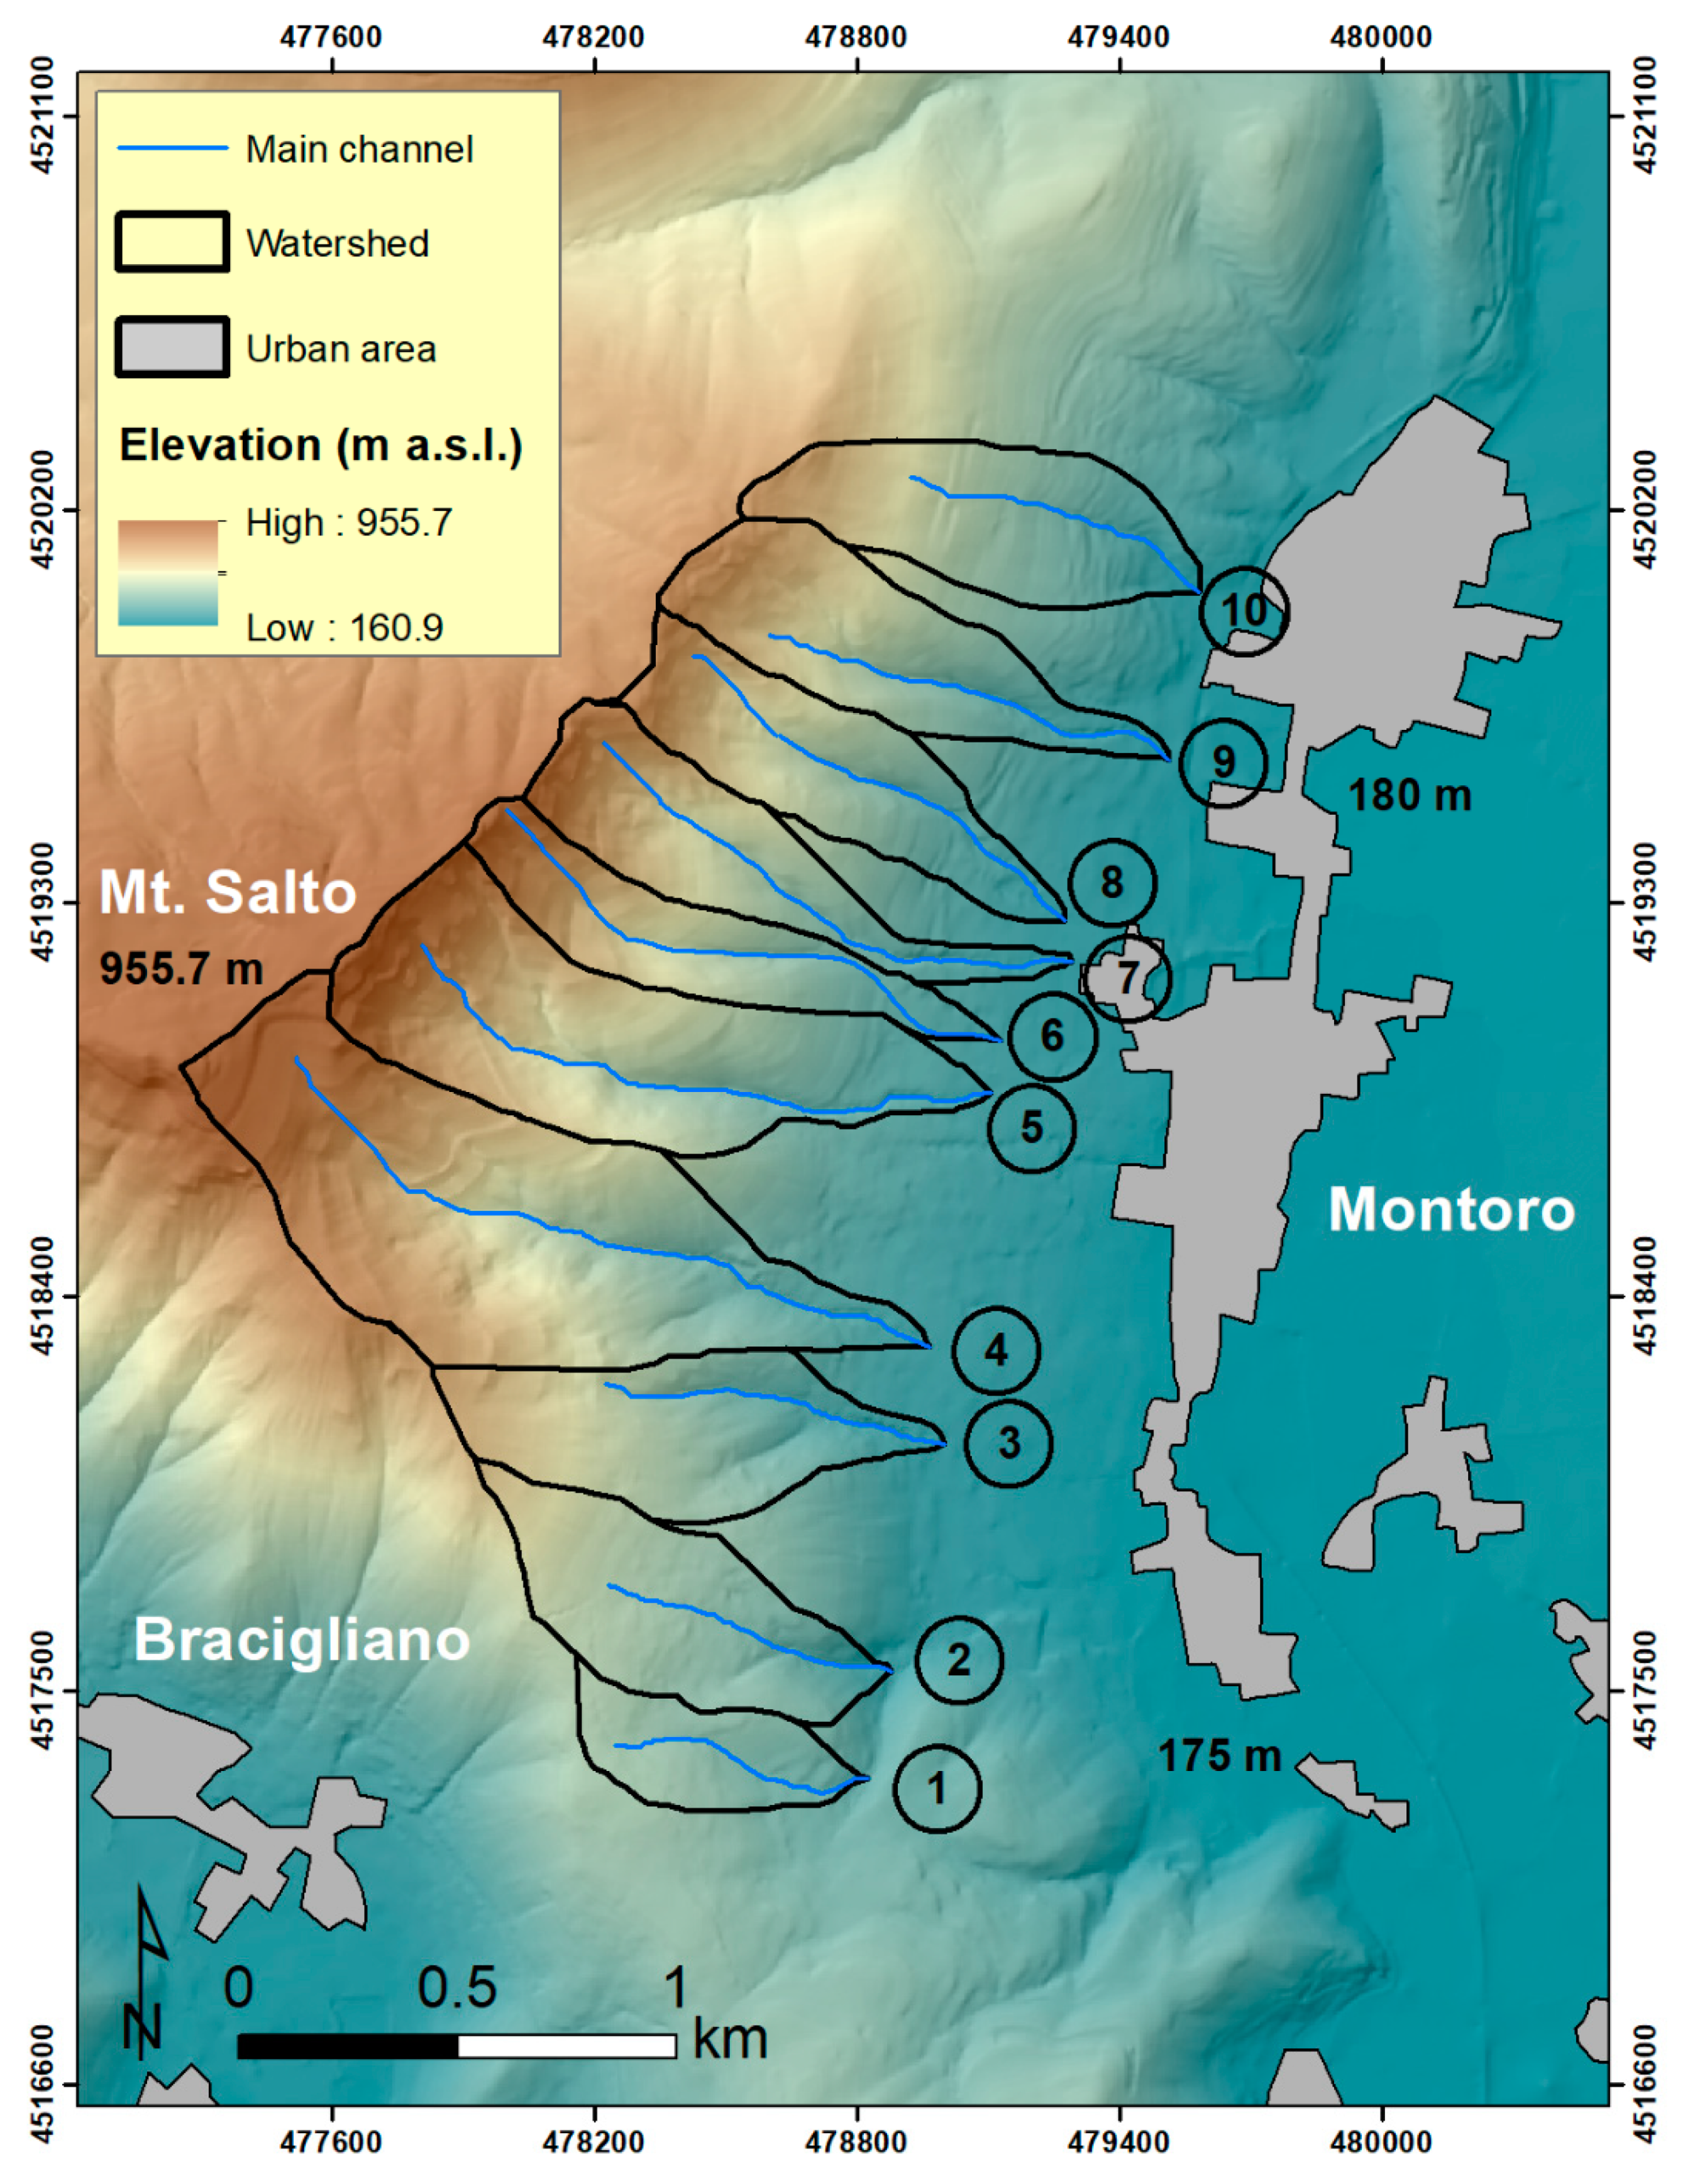
2. Study Area
3. Materials and Methods
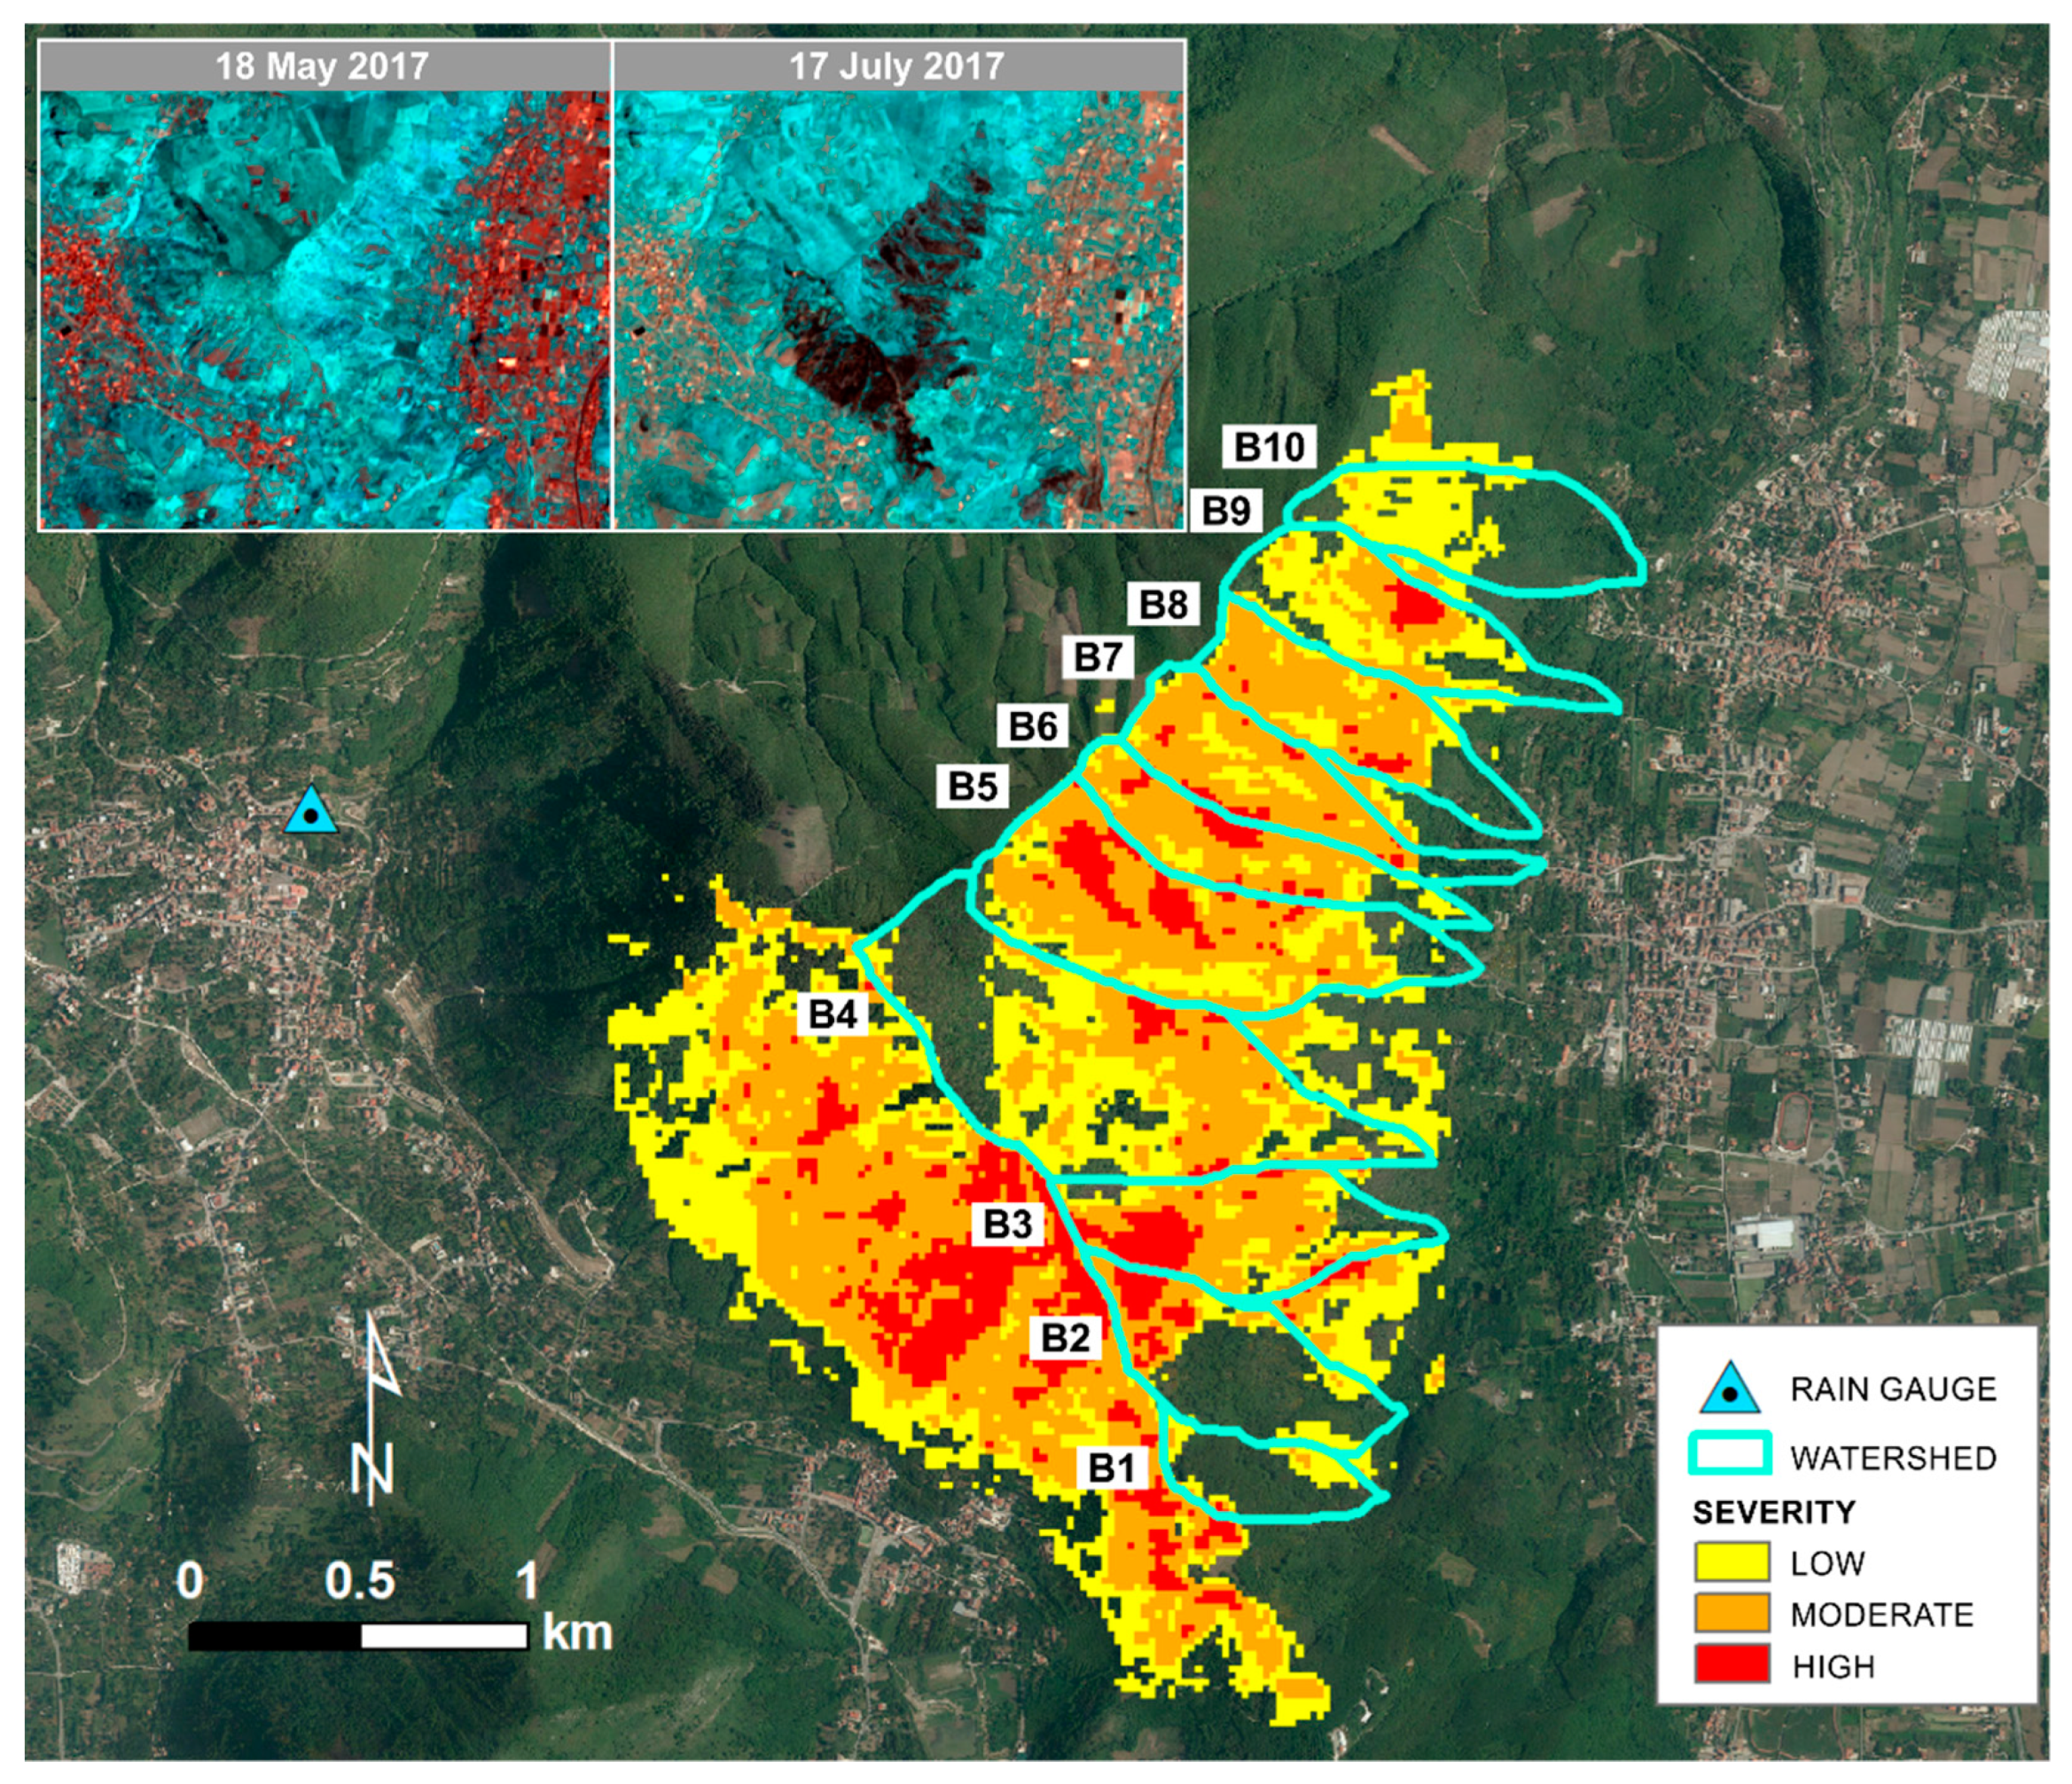
3.1. Fire Severity Assessment
3.2. Storm-Related Meteorological Observations
3.3. Rainfall Data
3.4. Evaluation of Flooding Impact Using Crowdsourced Data
4. Results
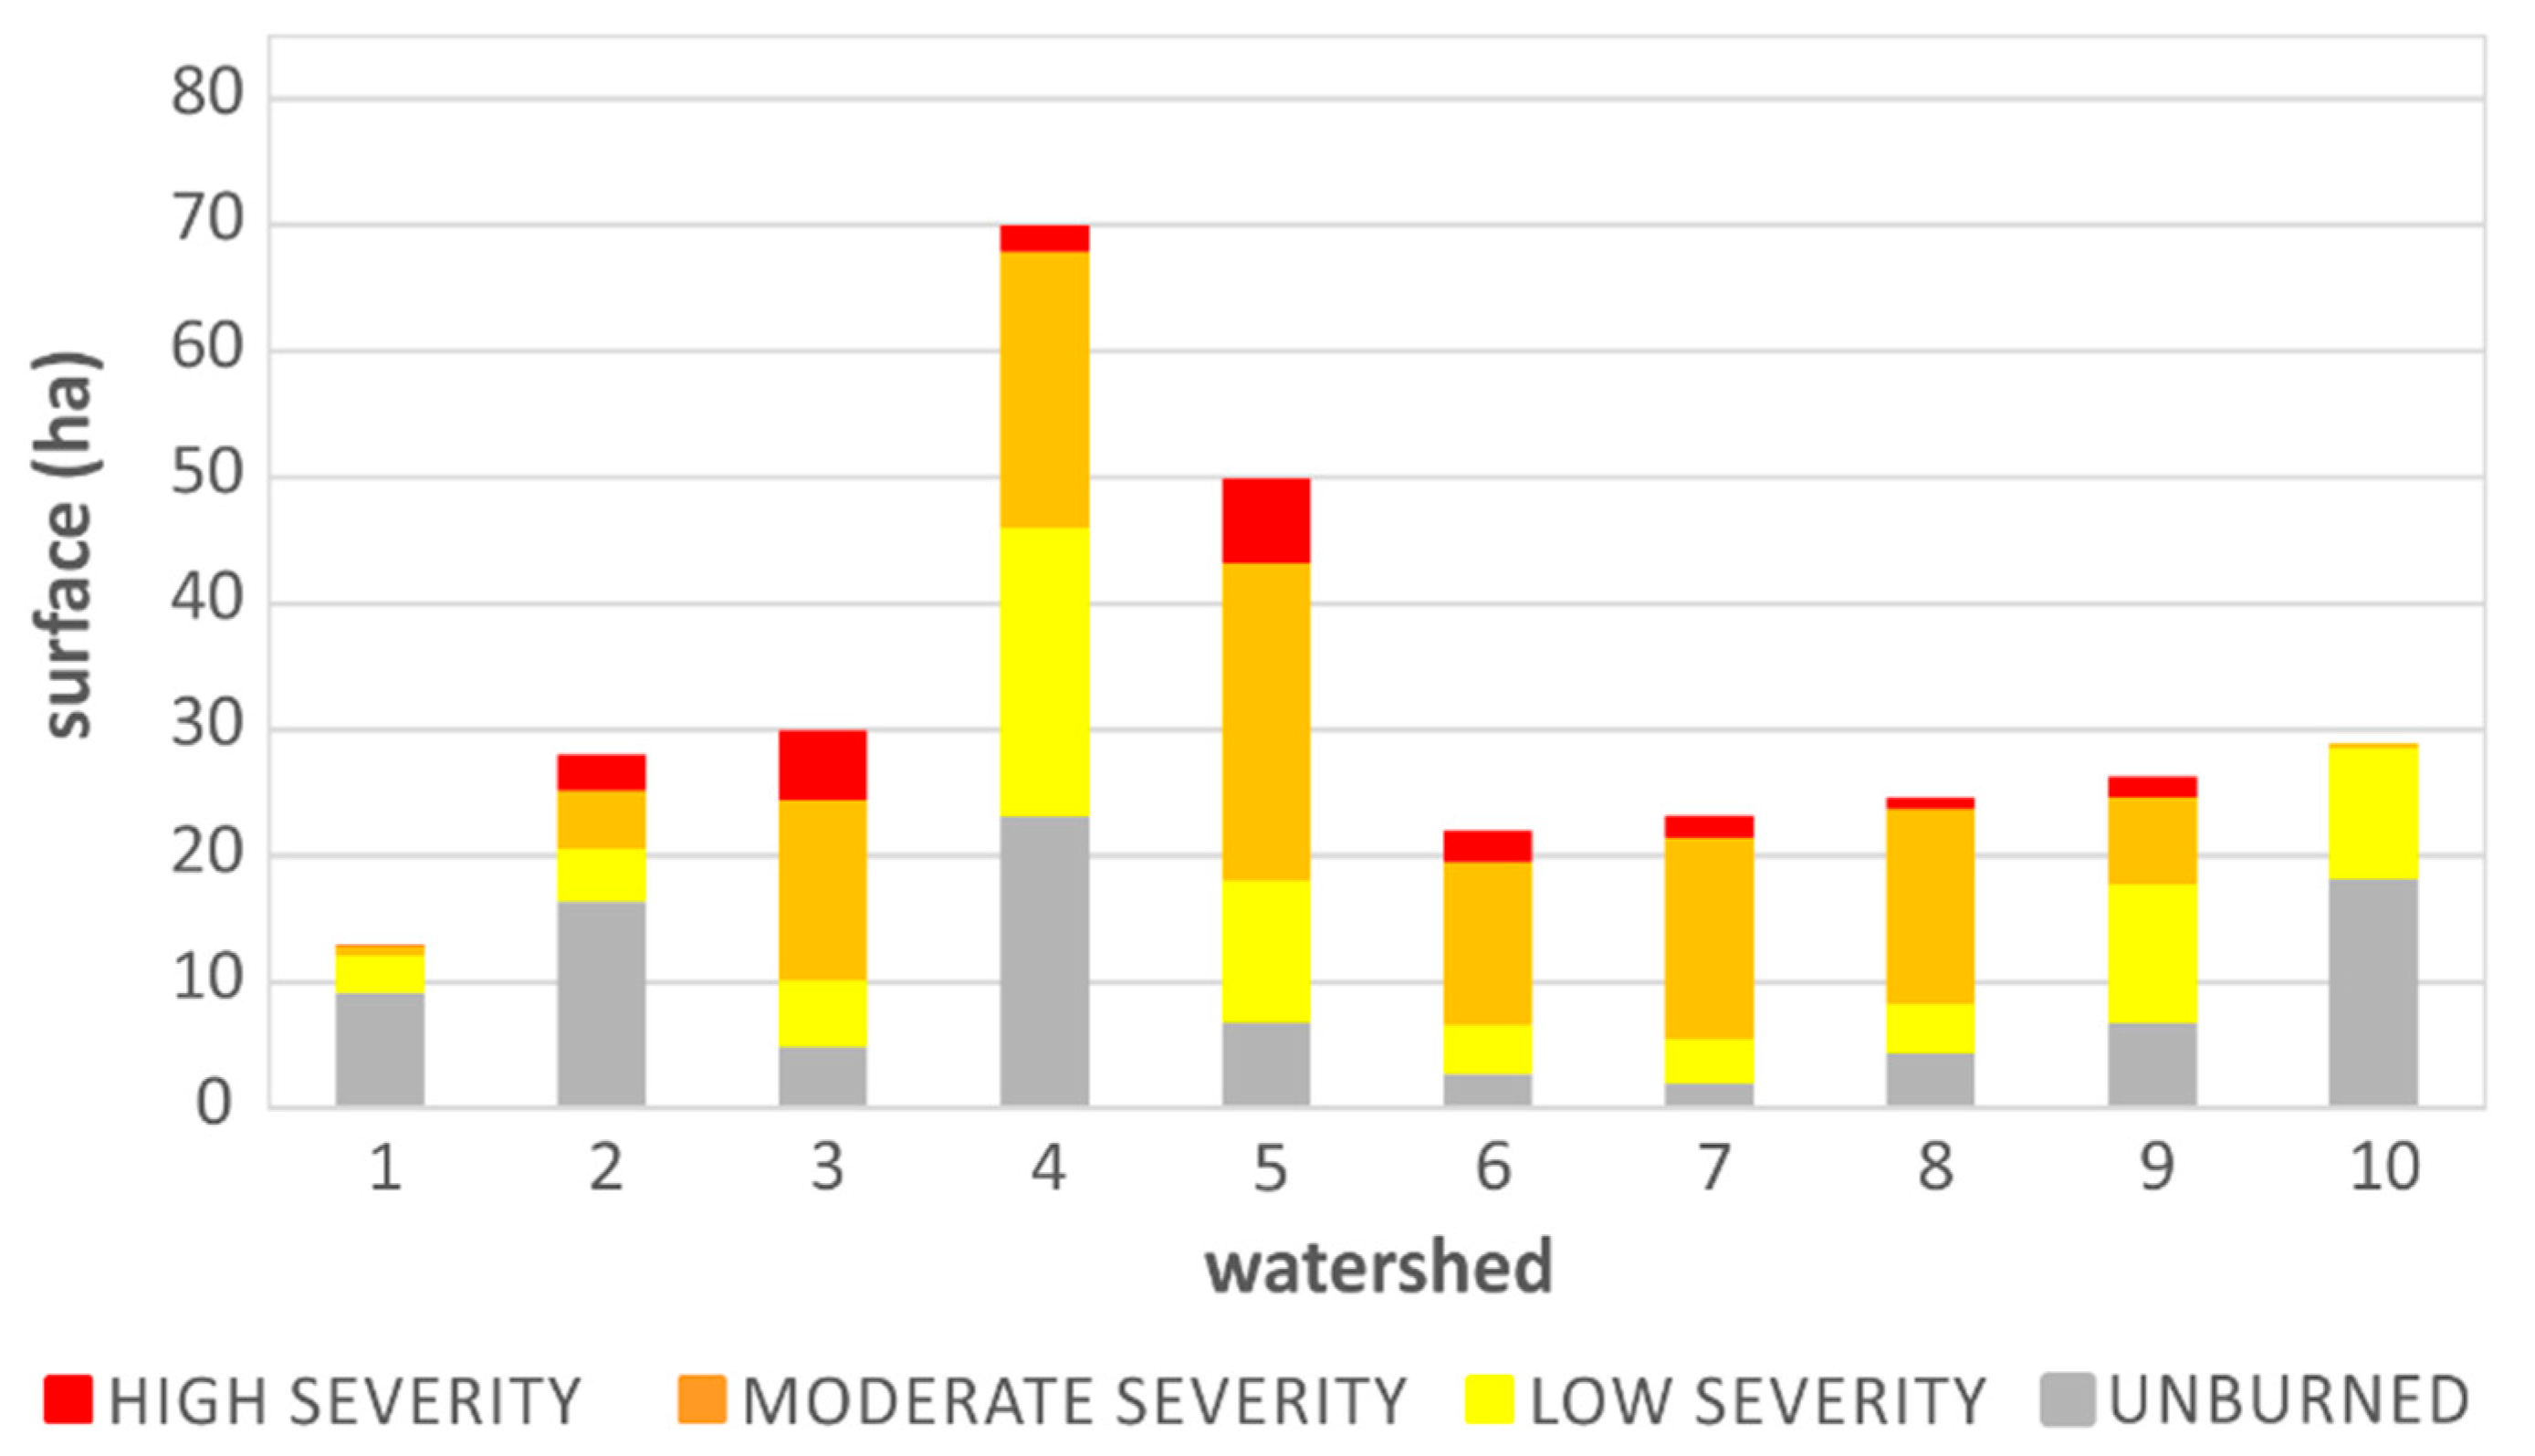
4.1. Fire Severity
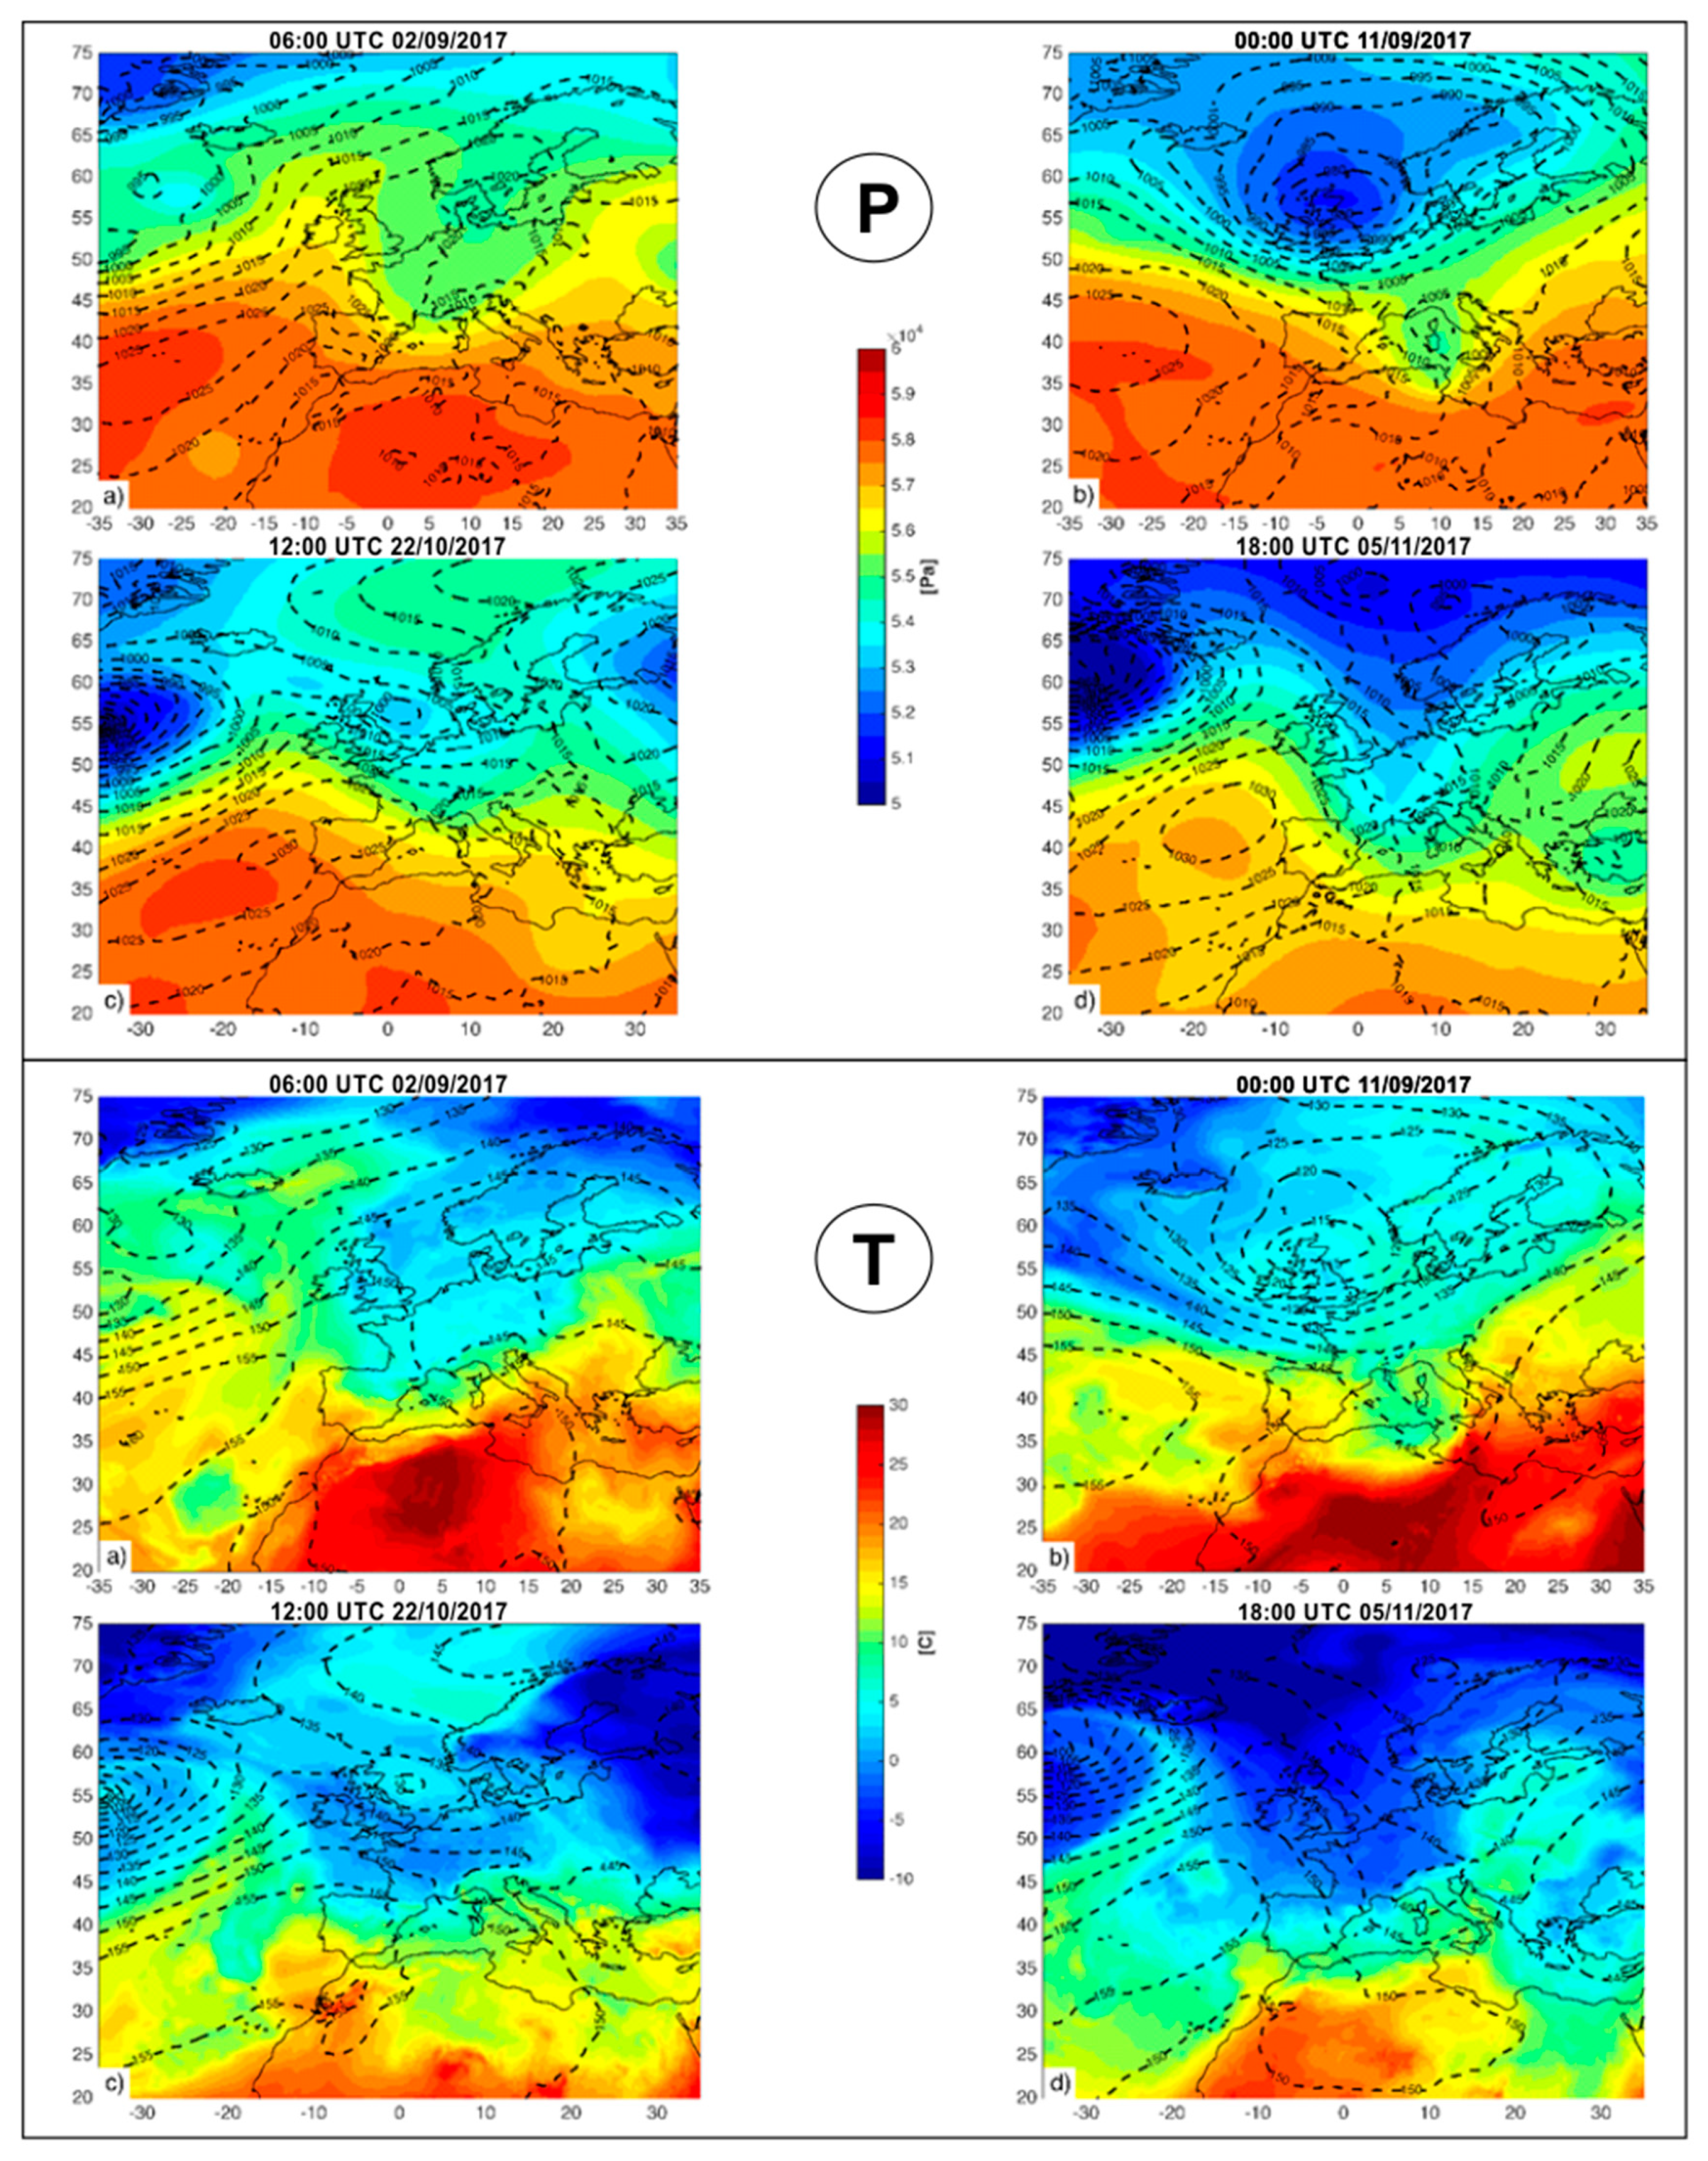
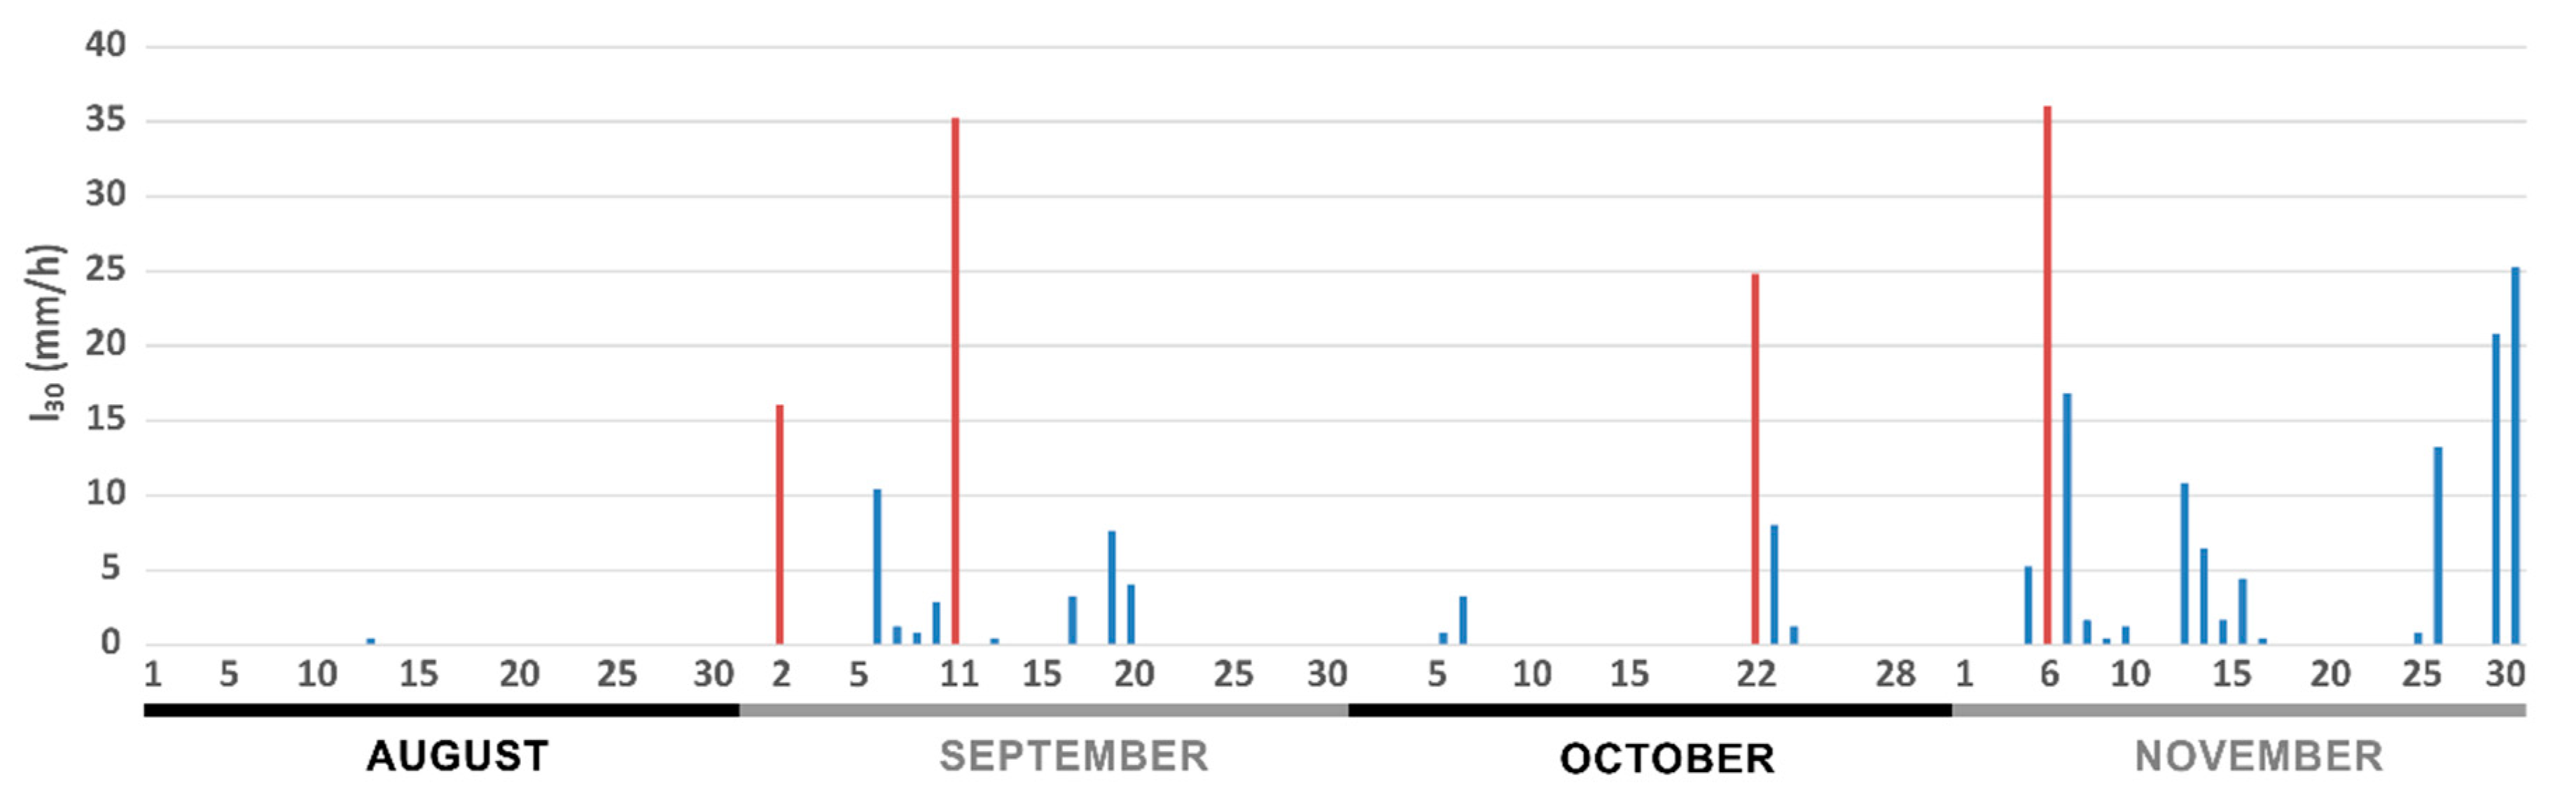
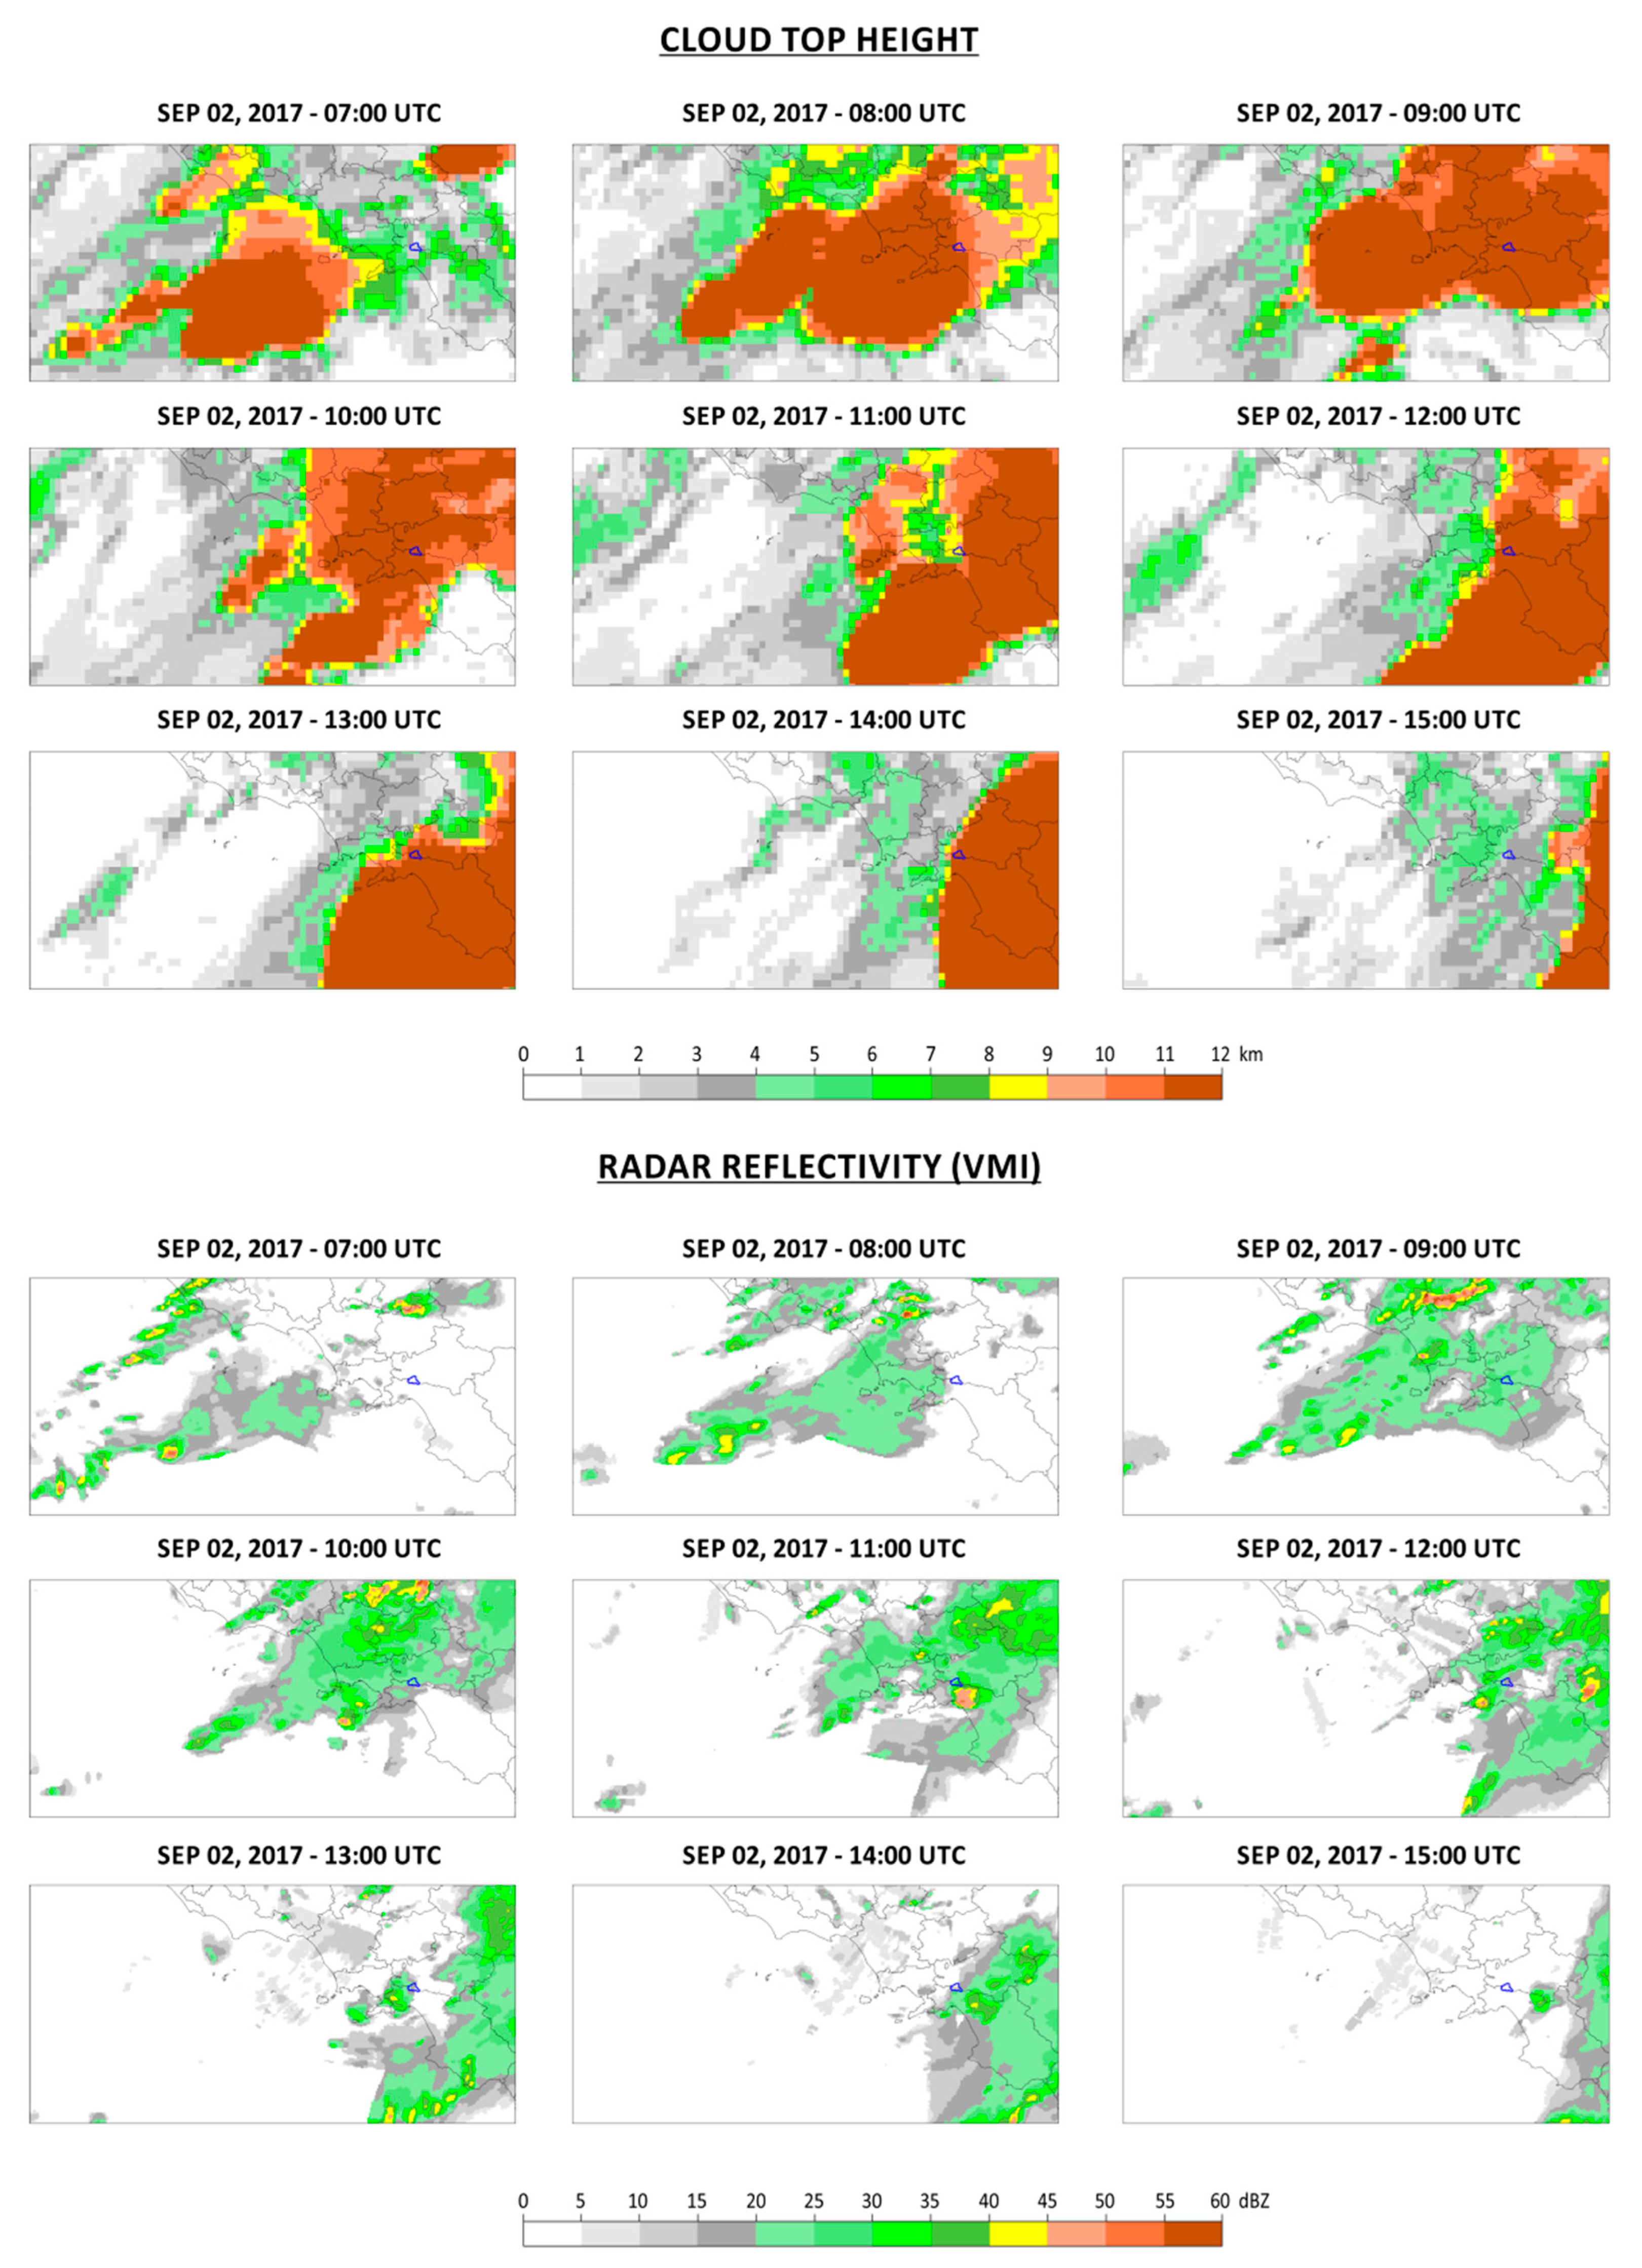
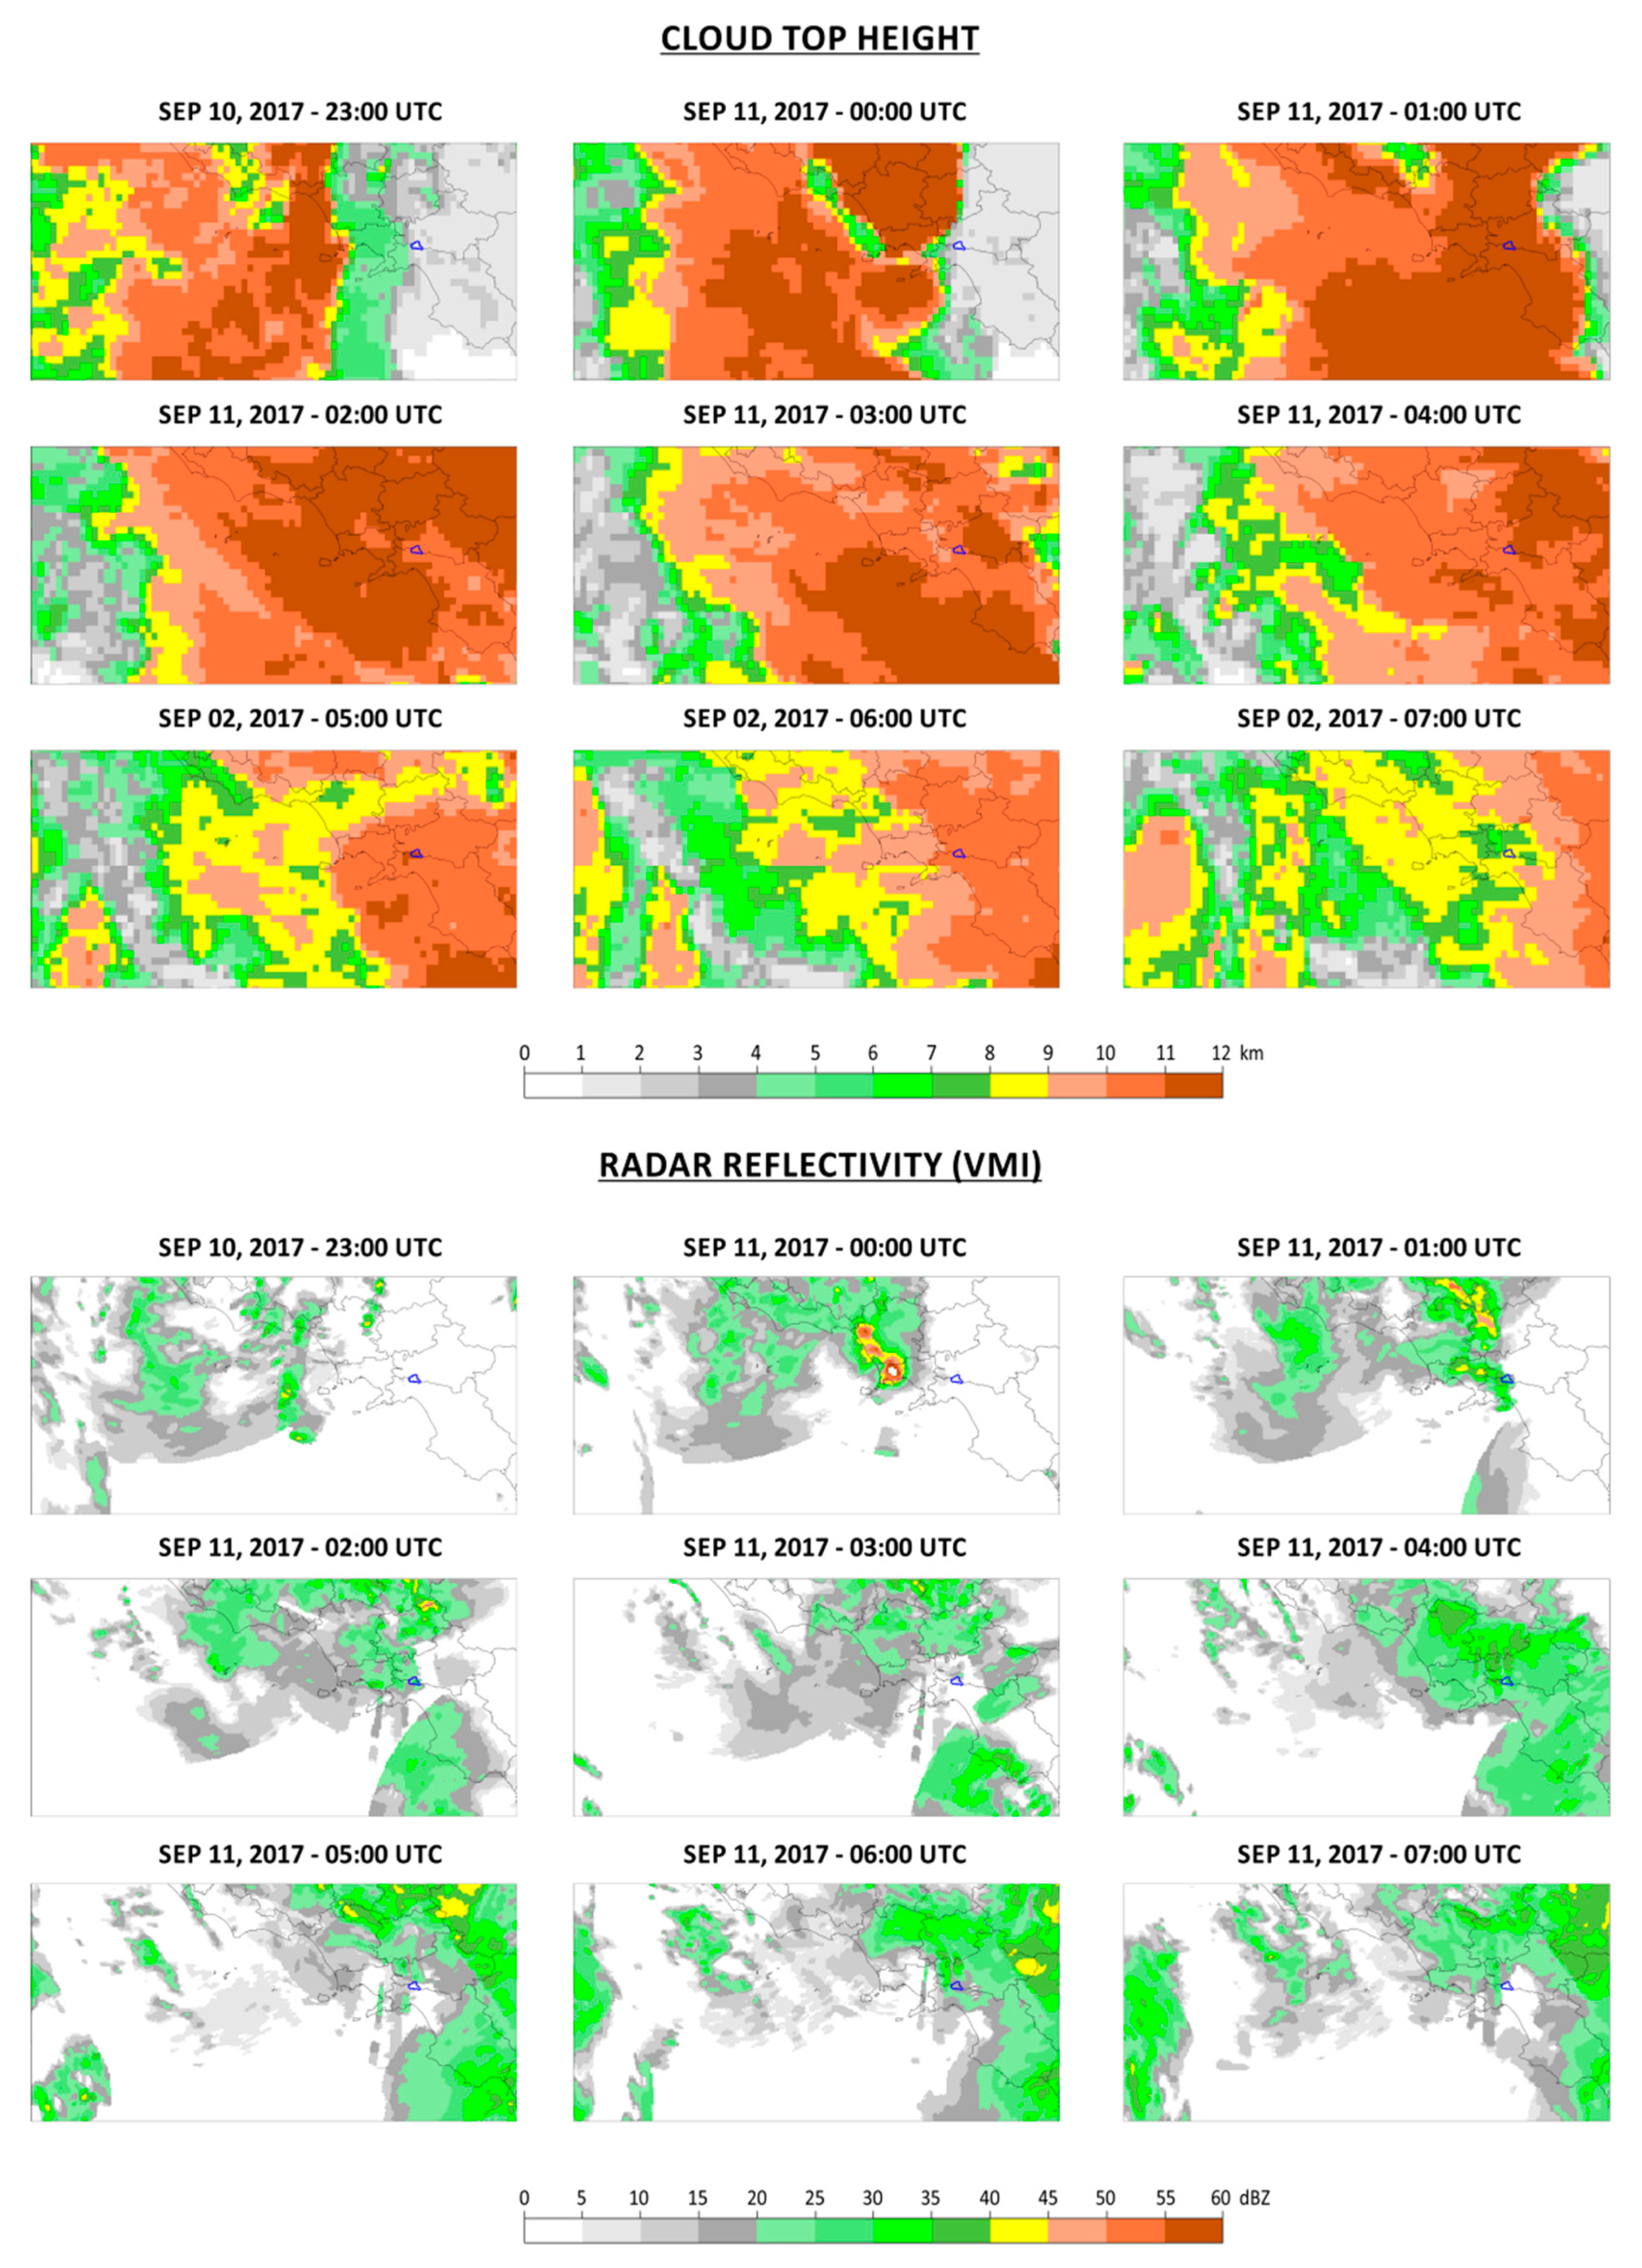
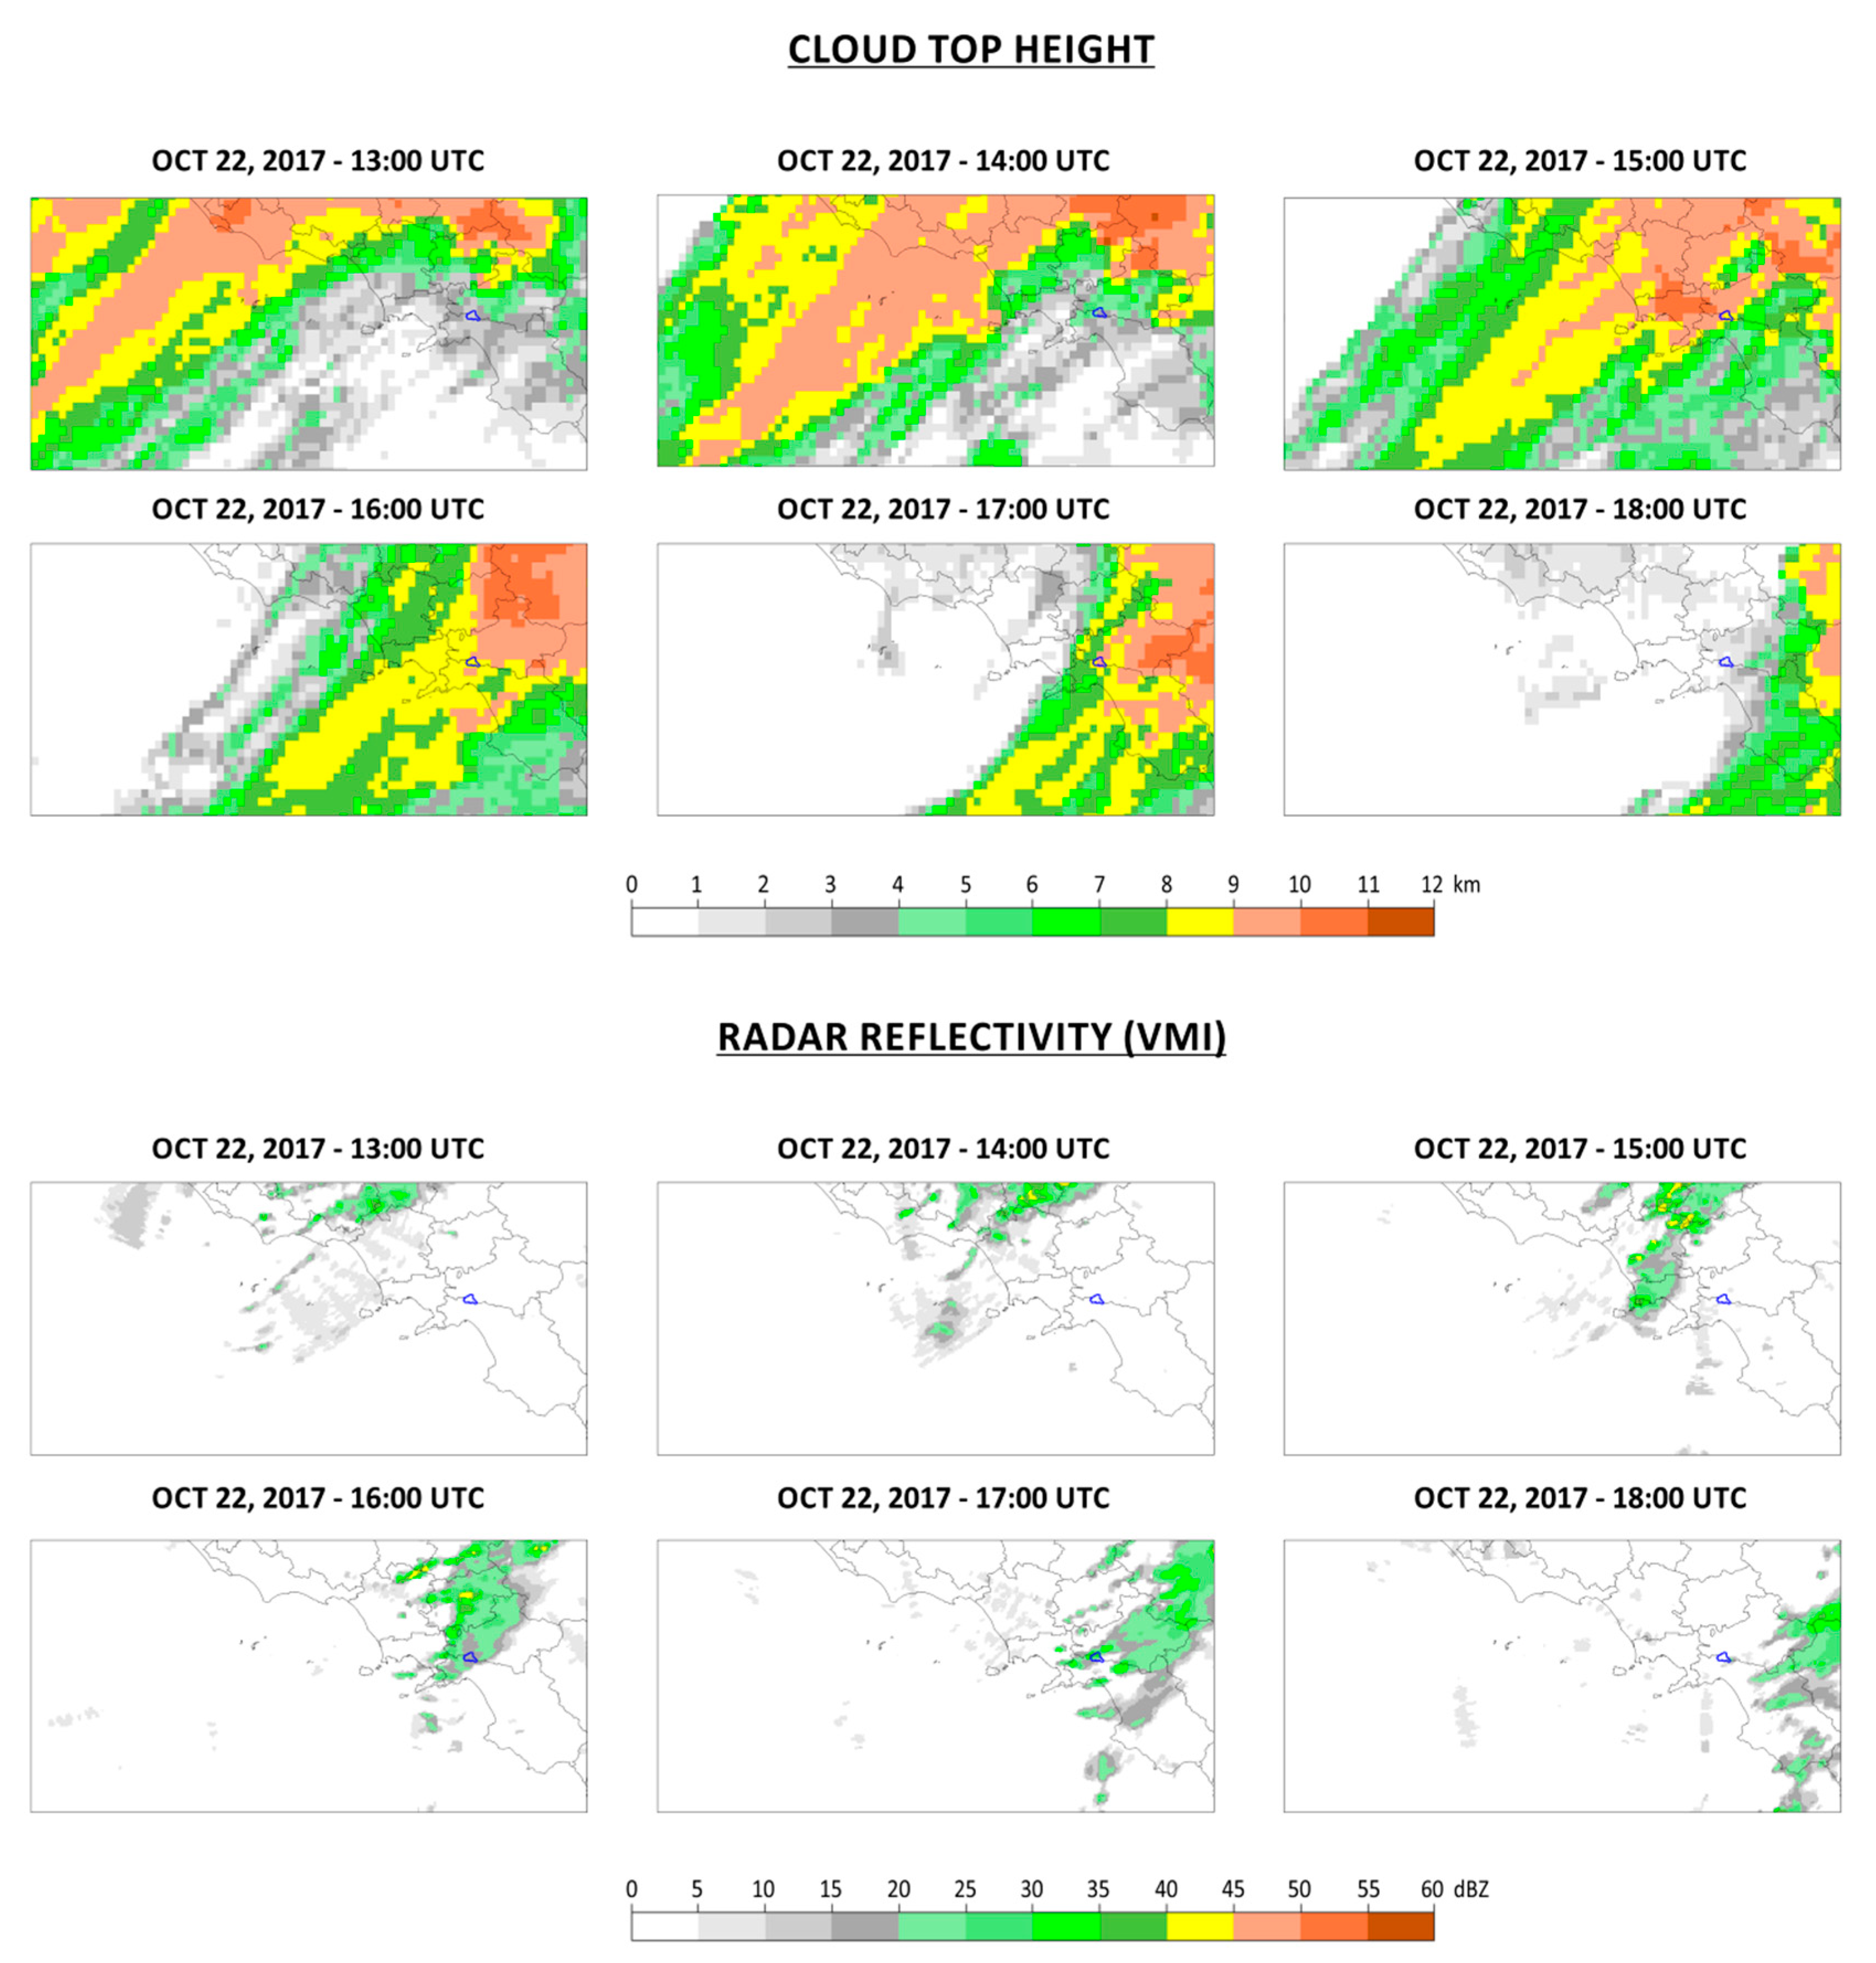
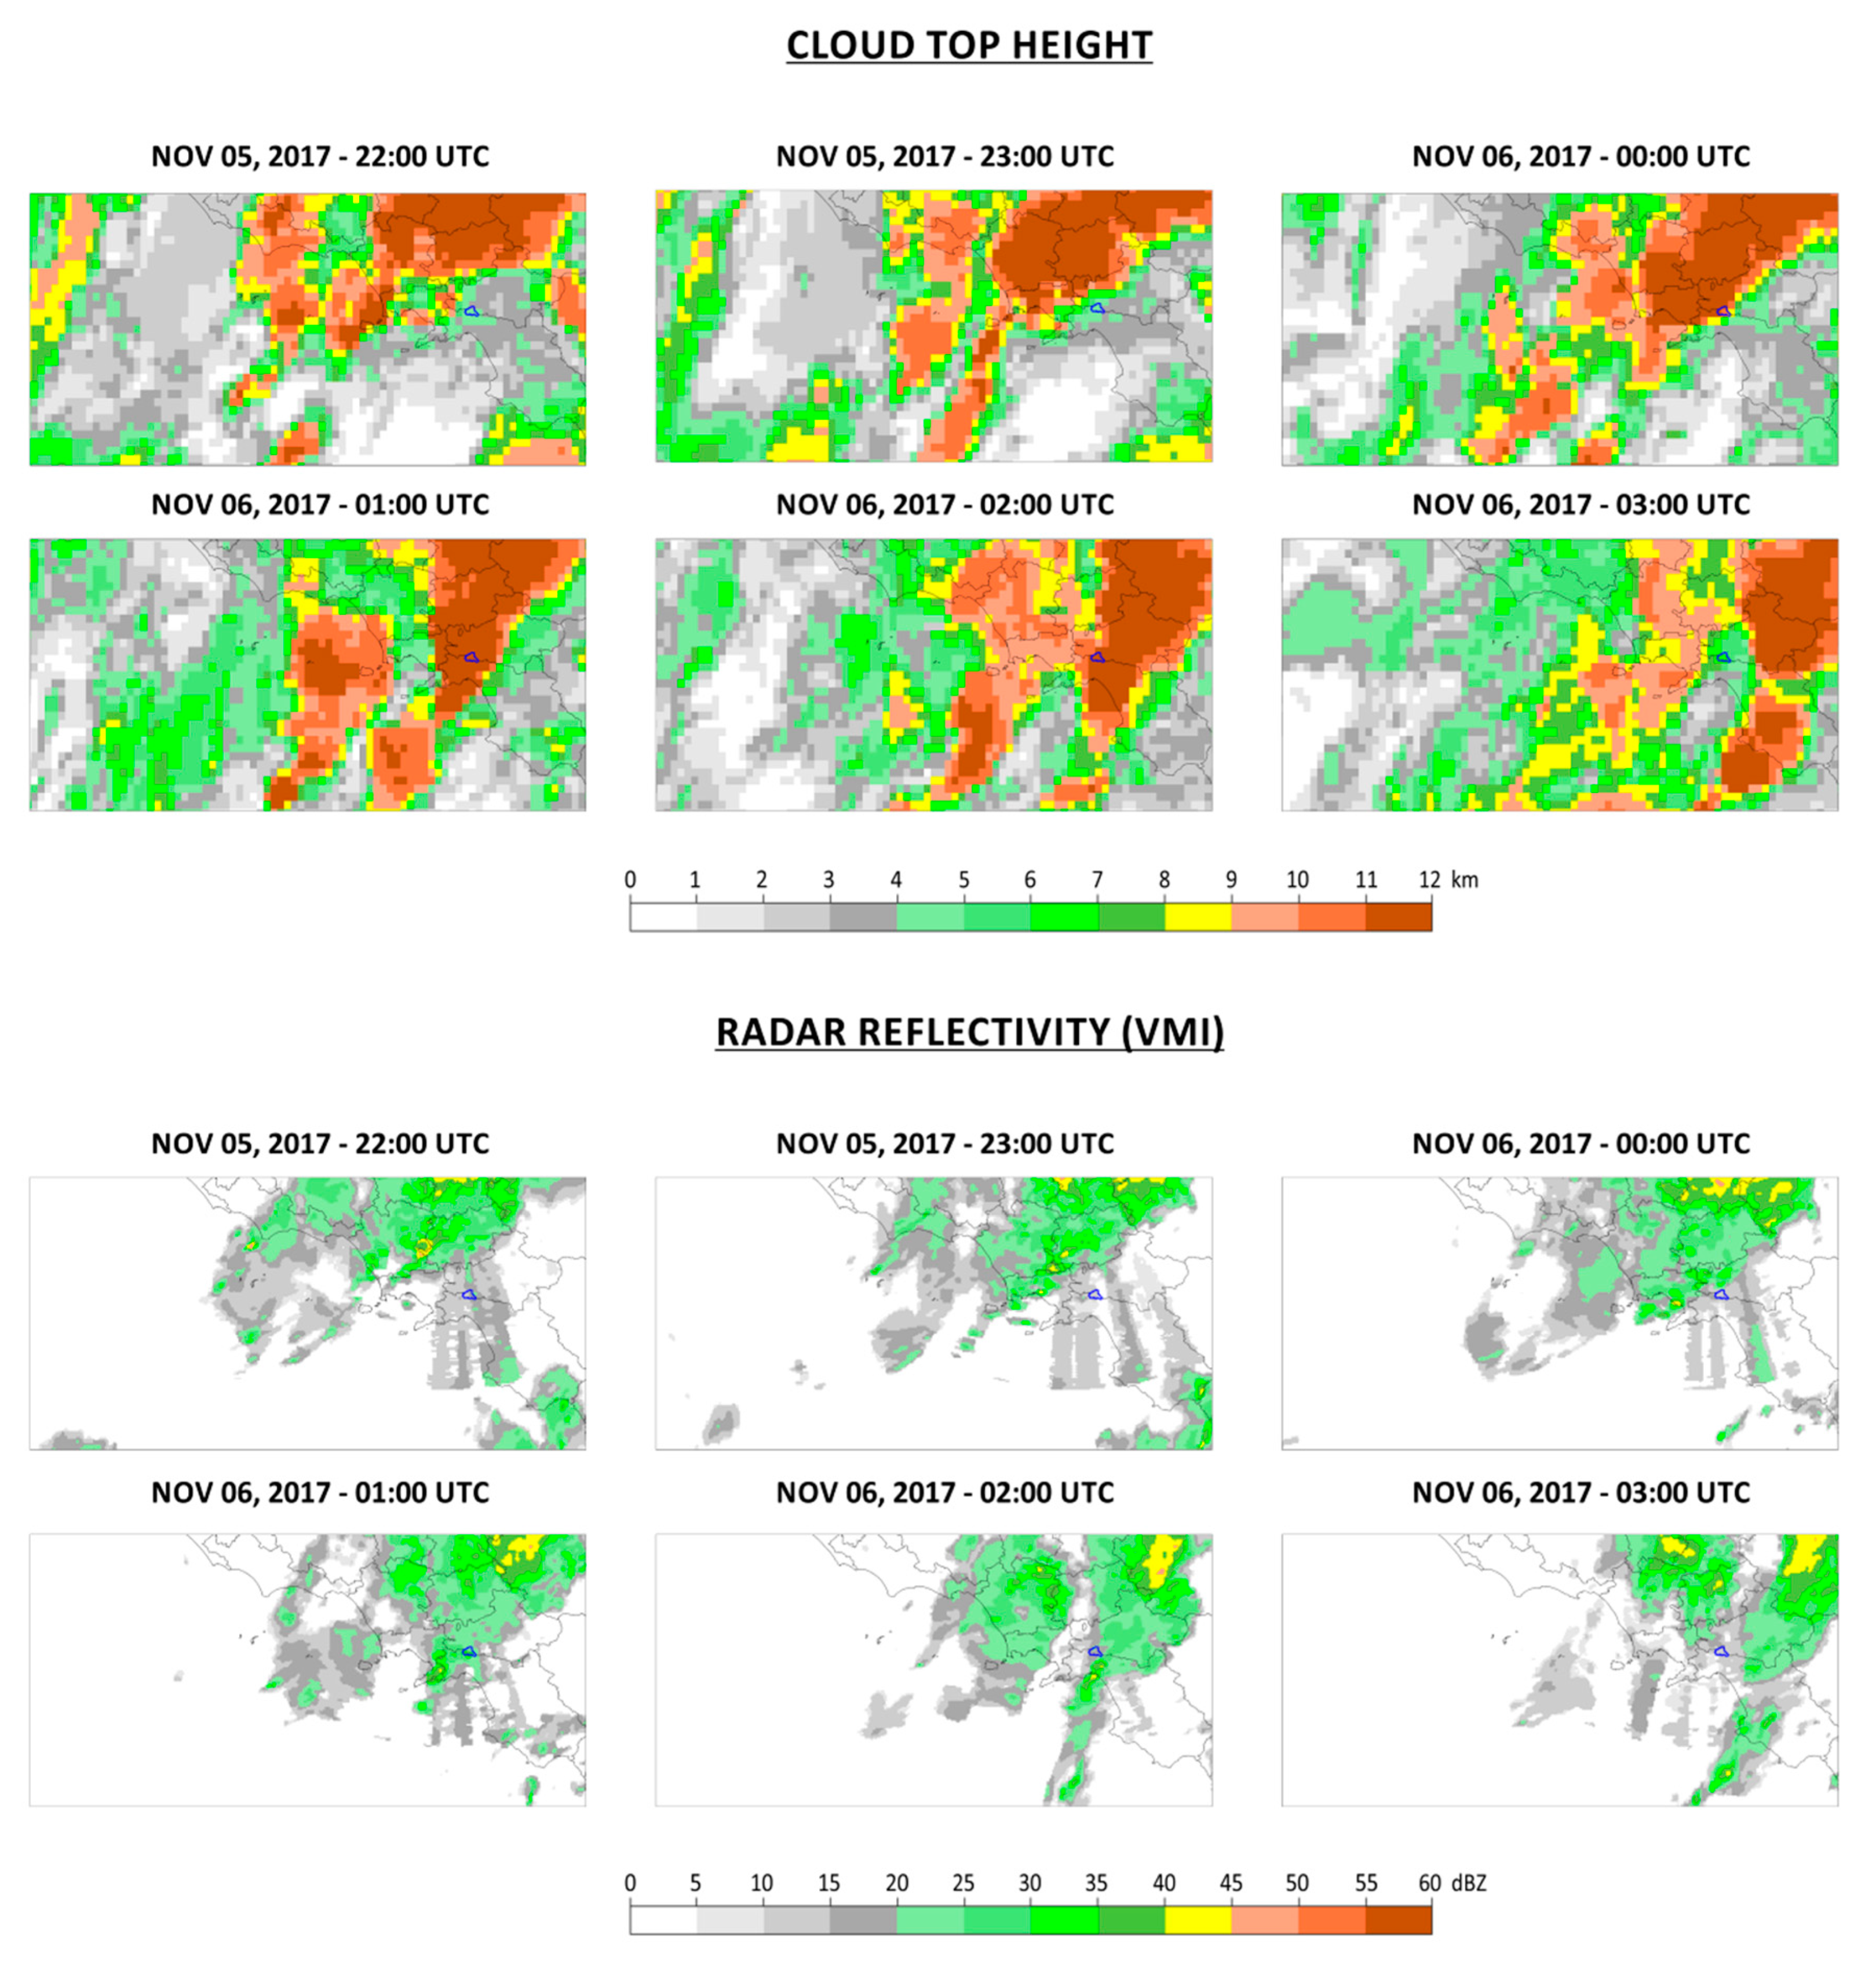
4.2. Properties of Meteorological Systems and Flood-Triggering Rainfall
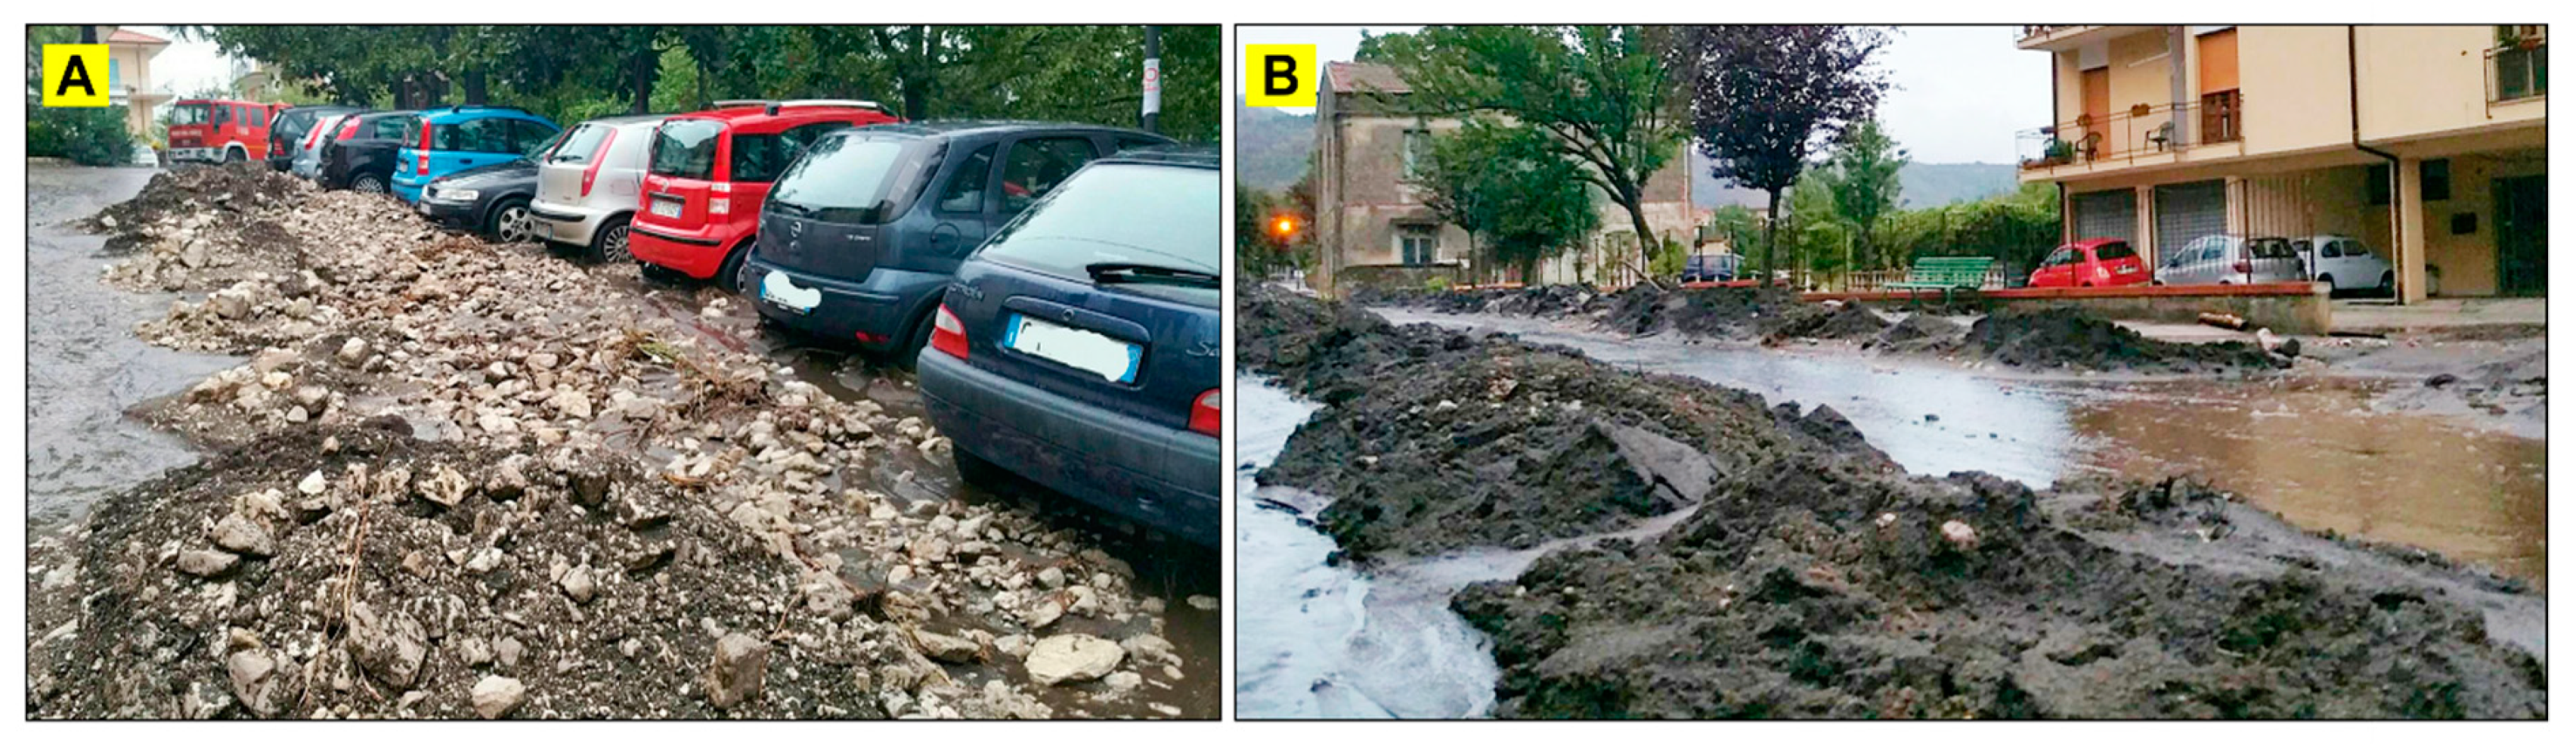
4.3. The Impact of Flow Processes in the Urban Area
5. Discussion and Conclusions
Author Contributions
Funding
Acknowledgments
Conflicts of Interest
Appendix A


References
- Arca, B.; Salis, M.; Pellizzaro, G.; Bacciu, V.; Spano, D.; Duce, P.; Ager, A.A.; Finney, M.A. Climate change impact on fire probability and severity in Mediterranean areas. In Proceedings of the VI International Conference on Forest Fire Research, Coimbra, Portugal, 15–18 November 2010; pp. 5–18. [Google Scholar]
- Lozano, O.M.; Salis, M.; Ager, A.A.; Arca, B.; Alcasena, F.J.; Monteiro, A.T.; Finney, M.A.; Del Giudice, L.; Scoccimarro, E.; Spano, D. Assessing Climate Change Impacts on Wildfire Exposure in Mediterranean Areas. Risk Anal. 2017, 37, 1898–1916. [Google Scholar] [CrossRef] [PubMed]
- Meyer, G.A.; Pierce, J.L. Climatic controls on fire-induced sediment pulses in Yellowstone National Park and central Idaho: A long-term perspective. For. Ecol. Manag. 2003, 178, 89–104. [Google Scholar] [CrossRef]
- Keeley, J.E. Fire intensity, fire severity and burn severity: A brief review and suggested usage. Int. J. Wildland Fire 2009, 18, 116–126. [Google Scholar] [CrossRef]
- Key, C.H.; Benson, N.C. Landscape Assessment (LA) Sampling and Analysis Methods; Gen. Tech. Rep. RMRS-GTR-164-CD; USDA Forest Service: Washington, DC, USA, 2006.
- Parsons, A.; Robichaud, P.R.; Lewis, S.A.; Napper, C.; Clark, J.T. Field Guide for Mapping Post-Fire Soil Burn Severity; Gen. Tech. Rep. RMRS GTR; USDA Forest Service: Washington, DC, USA, 2010; Volume 243, pp. 1–49.
- Lentile, L.B.; Holden, Z.A.; Smith, A.M.S.; Falkowski, M.J.; Hudak, A.T.; Morgan, P.; Lewis, S.A.; Gessler, P.E.; Benson, N.C. Remote sensing techniques to assess active fire characteristics and post-fire effects. Int. J. Wildland Fire 2006, 15, 319–345. [Google Scholar] [CrossRef]
- Mallinis, G.; Mitsopoulos, I.; Chrysafi, I. Evaluating and comparing sentinel 2A and landsat-8 operational land imager (OLI) spectral indices for estimating fire severity in a mediterranean pine ecosystem of Greece. Gisci. Remote Sens. 2018, 55, 1–18. [Google Scholar] [CrossRef]
- Carvajal-Ramírez, F.; da Silva, J.R.M.; Agüera-Vega, F.; Martínez-Carricondo, P.; Serrano, J.; Moral, F.J. Evaluation of fire severity indices based on pre- and post-fire multispectral imagery sensed from UAV. Remote Sens. 2019, 11, 993. [Google Scholar] [CrossRef] [Green Version]
- Van Wagtendonk, J.W.; Root, R.R.; Key, C.H. Comparison of AVIRIS and Landsat ETM + detection capabilities for burn severity. Remote Sens. Environ. 2004, 92, 397–408. [Google Scholar] [CrossRef]
- García-Llamas, P.; Suárez-Seoane, S.; Fernández-Guisuraga, J.M.; Fernández-García, V.; Fernández-Manso, A.; Quintano, C.; Taboada, A.; Marcos, E.; Calvo, L. Evaluation and comparison of Landsat 8, Sentinel-2 and Deimos-1 remote sensing indices for assessing burn severity in Mediterranean fire-prone ecosystems. Int. J. Appl. Earth Obs. Geoinf. 2019, 80, 137–144. [Google Scholar] [CrossRef]
- Escuin, S.; Navarro, R.; Fernández, P. Fire severity assessment by using NBR (Normalized Burn Ratio) and NDVI (Normalized Difference Vegetation Index) derived from LANDSAT TM/ETM images. Int. J. Remote Sens. 2008, 29, 1053–1073. [Google Scholar] [CrossRef]
- Veraverbeke, S.; Lhermitte, S.; Verstraeten, W.W.; Goossens, R. Evaluation of pre/post-fire differenced spectral indices for assessing burn severity in a Mediterranean environment with Landsat Thematic Mapper. Int. J. Remote Sens. 2011, 32, 3521–3537. [Google Scholar] [CrossRef] [Green Version]
- Veraverbeke, S.; Verstraeten, W.W.; Lhermitte, S.; Goossens, R. Evaluating Landsat Thematic Mapper spectral indices for estimating burn severity of the 2007 Peloponnese wildfires in Greece. Int. J. Wildland Fire 2010, 19, 558–569. [Google Scholar] [CrossRef] [Green Version]
- French, N.H.F.; Kasischke, E.S.; Hall, R.J.; Murphy, K.A.; Verbyla, D.L.; Hoy, E.E.; Allen, J.L. Using Landsat data to assess fire and burn severity in the North American boreal forest region: An overview and summary of results. Int. J. Wildland Fire 2008, 17, 443–462. [Google Scholar] [CrossRef]
- Sobrino, J.A.; Llorens, R.; Fernández, C.; Fernández-Alonso, J.M.; Vega, J.A. Relationship between forest fires severity measured in situ and through remotely sensed spectral indices. Forests 2019, 10, 457. [Google Scholar] [CrossRef] [Green Version]
- Allen, J.L.; Sorbel, B. Assessing the differenced Normalized Burn Ratio’s ability to map burn severity in the boreal forest and tundra ecosystems of Alaska’s national parks. Int. J. Wildland Fire 2008, 17, 463–475. [Google Scholar] [CrossRef]
- Soverel, N.O.; Perrakis, D.D.B.; Coops, N.C. Estimating burn severity from Landsat dNBR and RdNBR indices across western Canada. Remote Sens. Environ. 2010, 114, 1896–1909. [Google Scholar] [CrossRef]
- Rulli, M.C.; Bozzi, S.; Spada, M.; Bocchiola, D.; Rosso, R. Rainfall simulations on a fire disturbed mediterranean area. J. Hydrol. 2006, 327, 323–338. [Google Scholar] [CrossRef]
- Neris, J.; Santamarta, J.C.; Doerr, S.H.; Prieto, F.; Agulló-Pérez, J.; García-Villegas, P. Post-fire soil hydrology, water erosion and restoration strategies in andosols: A review of evidence from the Canary Islands (Spain). iForest 2016, 9, 583–592. [Google Scholar] [CrossRef] [Green Version]
- Moody, J.A.; Martin, D.A.; Haire, S.L.; Kinner, D.A. Linking runoff response to burn severity after a wildfire. Hydrol. Process. 2008, 22, 2063–2074. [Google Scholar] [CrossRef]
- Gartner, J.E.; Cannon, S.H.; Santi, P.M. Empirical models for predicting volumes of sediment deposited by debris flows and sediment-laden floods in the transverse ranges of southern California. Eng. Geol. 2014, 176, 45–56. [Google Scholar] [CrossRef]
- Doerr, S.H.; Shakesby, R.A.; Walsh, R.P.D. Soil water repellency: Its causes, characteristics and hydro-geomorphological significance. Earth Sci. Rev. 2000, 51, 33–65. [Google Scholar] [CrossRef]
- DeBano, L.F. The role of fire and soil heating on water repellency in wildland environments: A review. J. Hydrol. 2000, 231–232, 195–206. [Google Scholar] [CrossRef]
- Jordán, A.; Zavala, L.M.; Mataix-Solera, J.; Nava, A.L.; Alanís, N. Effect of fire severity on water repellency and aggregate stability on Mexican volcanic soils. Catena 2011, 84, 136–147. [Google Scholar] [CrossRef]
- Moody, J.A.; Ebel, B.A. Hyper-dry conditions provide new insights into the cause of extreme floods after wildfire. Catena 2012, 93, 58–63. [Google Scholar] [CrossRef]
- Weninger, T.; Filipović, V.; Mešić, M.; Clothier, B.; Filipović, L. Estimating the extent of fire induced soil water repellency in Mediterranean environment. Geoderma 2019, 338, 187–196. [Google Scholar] [CrossRef]
- Parise, M.; Cannon, S.H. Wildfire impacts on the processes that generate debris flows in burned watersheds. Nat. Hazards 2012, 61, 217–227. [Google Scholar] [CrossRef]
- Kean, J.W.; Staley, D.M.; Lancaster, J.T.; Rengers, F.K.; Swanson, B.J.; Coe, J.A.; Hernandez, J.L.; Sigman, A.J.; Allstadt, K.E.; Lindsay, D.N. Inundation, flow dynamics, and damage in the 9 January 2018 Montecito debris-flow event, California, USA: Opportunities and challenges for post-wildfire risk assessment. Geosphere 2019, 15, 1140–1163. [Google Scholar] [CrossRef] [Green Version]
- Cui, Y.; Cheng, D.; Chan, D. Investigation of post-fire debris flows in Montecito. ISPRS Int. J. Geo Inf. 2019, 8, 5. [Google Scholar] [CrossRef] [Green Version]
- Moody, J.A.; Shakesby, R.A.; Robichaud, P.R.; Cannon, S.H.; Martin, D.A. Current research issues related to post-wildfire runoff and erosion processes. Earth Sci. Rev. 2013, 122, 10–37. [Google Scholar] [CrossRef]
- Cannon, S.H.; Boldt, E.M.; Laber, J.L.; Kean, J.W.; Staley, D.M. Rainfall intensity-duration thresholds for postfire debris-flow emergency-response planning. Nat. Hazards 2011, 59, 209–236. [Google Scholar] [CrossRef]
- Restrepo, P.; Jorgensen, D.P.; Cannon, S.H.; Costa, J.; Laber, J.; Major, J.; Martner, B.; Purpura, J.; Werner, K. Joint NOAA/NWS/USGS prototype debris flow warning system for recently burned areas in Southern California. Bull. Am. Meteorol. Soc. 2008, 89, 1845–1851. [Google Scholar] [CrossRef]
- Staley, D.M.; Negri, J.A.; Kean, J.W.; Laber, J.L.; Tillery, A.C.; Youberg, A.M. Prediction of spatially explicit rainfall intensity–duration thresholds for post-fire debris-flow generation in the western United States. Geomorphology 2017, 278, 149–162. [Google Scholar] [CrossRef]
- Cannon, S.H.; Gartner, J.E.; Wilson, R.C.; Bowers, J.C.; Laber, J.L. Storm rainfall conditions for floods and debris flows from recently burned areas in southwestern Colorado and southern California. Geomorphology 2008, 96, 250–269. [Google Scholar] [CrossRef]
- De Vita, P.; Guadagno, C.; Lanzara, R.; Lombardi, G.; Tarantino, E.; Vallario, A. L’evento alluvionale del 20 agosto 1993 nei territori comunali di Solofra e Serino (Avellino-Campania). In Proceedings of the VIII Congresso Nazionale Geologi, Roma, Italy, 21–23 January 1994; pp. 165–171. [Google Scholar]
- Candela, A.; Aronica, G.; Santoro, M. Effects of Forest Fires on Flood Frequency Curves in a Mediterranean Catchment. Hydrol. Sci. J. 2005, 50, 193–206. (In French) [Google Scholar] [CrossRef]
- Calcaterra, D.; Parise, M.; Strumia, S.; Mazzella, E. Relations between Fire, Vegetation and Landslides in the Heavily Populated Metropolitan Area of Naples, Italy. In Proceedings of the 1st North American Landslides Conference, Vail, CO, USA, 3–8 June 2007; AEG Special Publication, Omnipress: Madison, WI, USA, 2007; Volume 23, pp. 1448–1461. [Google Scholar]
- Rossi, M.; Torri, D.; Santi, E.; Bacaro, G.; Mondini, A.C.; Reichenbach, P.; Fiorucci, F.; Marchesini, I. Evaluating the impact of fires on slope instability processes: A case study in Central Italy (Invited). In Proceedings of the AGU 2013 Fall Meeting, San Francisco, CA, USA, 9–13 December 2013. [Google Scholar]
- Esposito, G.; Matano, F.; Molisso, F.; Ruoppolo, G.; Di Benedetto, A.; Sacchi, M. Post-fire erosion response in a watershed mantled by volcaniclastic deposits, Sarno Mountains, Southern Italy. Catena 2017, 152, 227–241. [Google Scholar] [CrossRef] [Green Version]
- Esposito, G.; Esposito, E.; Matano, F.; Molisso, F.; Sacchi, M.; Porfido, S. Effects of a wildfire on rocks and soils in the Sarno Mountains, Campania, Southern Apennines. Rend. Online Soc. Geol. Ital. 2013, 24, 119–121. [Google Scholar]
- Carabella, C.; Miccadei, E.; Paglia, G.; Sciarra, N. Post-wildfire landslide hazard assessment: The case of the 2017 montagna del morrone fire (central apennines, Italy). Geosciences 2019, 9, 175. [Google Scholar] [CrossRef] [Green Version]
- Tiranti, D.; Moscariello, A.; Giudici, I.; Rabuffetti, D.; Cremonini, R.; Campana, V.; Bosco, F.; Giardino, M. Post-fire rainfall events influence on debris-flows trigger mechanisms, evolution and sedimentary processes: The Rio Casella case study in the North-western Italian Alps. Geophys. Res. Abstr. 2006, 8, 03479. [Google Scholar]
- Agenzia Regionale per la Protezione Ambientale Piemonte (ARPA). Rapporto evento del 7 June 2018—Colata detritica nel Comune di Bussoleno. Available online: https://www.arpa.piemonte.it/arpa-comunica/file-notizie/2018/rapporto-evento-bussoleno2.pdf (accessed on 14 October 2019).
- Pierson, T.C. Hyperconcentrated flow—Transitional process between water flow and debris flow. In Debris-flow Hazards and Related Phenomena; Springer Praxis Books; Jakob, M., Hungr, O., Eds.; Springer: Berlin/Heidelberg, Germany, 2005. [Google Scholar]
- Rolandi, G.; Petrosino, P.; Mc Geehin, J. The interplinian activity at Somma—Vesuvius in the last 3500 years. J. Volcanol. Geotherm. Res. 1998, 82, 19–52. [Google Scholar] [CrossRef]
- Cole, P.D.; Scarpati, C. The 1944 eruption of Vesuvius, Italy: Combining contemporary accounts and field studies for a new volcanological reconstruction. Geol. Mag. 2010, 147, 391–415. [Google Scholar] [CrossRef]
- De Vita, P.; Fusco, F.; Tufano, R.; Cusano, D. Seasonal and event-based hydrological and slope stability modeling of pyroclastic fall deposits covering slopes in Campania (Southern Italy). Water 2018, 10, 1140. [Google Scholar] [CrossRef] [Green Version]
- WRB. World Reference base for Soil Resources, Reports, 103; FAO Press: Rome, Italy, 2006. [Google Scholar]
- Maeda, T.; Takenaka, H.; Warkentin, B.P. Physical Properties of Allophane Soils. Adv. Agron. 1977, 29, 229–264. [Google Scholar]
- Warkentin, B.P. Physical Properties of Forest-Nursery Soils: Relation to Seedling Growth. In Forestry Nursery Manual: Production of Bareroot Seedlings; Duryea, M.L., Landis, T.D., Perry, C.R., Eds.; Springer: Dordrecht, The Netherlands, 1984; pp. 53–61. ISBN 978-94-009-6110-4. [Google Scholar]
- Rodríguez Rodríguez, A.; Guerra, J.A.; Gorrín, S.P.; Arbelo, C.D.; Mora, J.L. Aggregates stability and water erosion in Andosols of the Canary Islands. Land Degrad. Dev. 2002, 13, 515–523. [Google Scholar] [CrossRef]
- Mobilia, M.; Califano, F.; Longobardi, A. Analysis of Rainfall Events Driving MDHEs Occurred in the Solofrana River Basin, Southern Italy. Procedia Eng. 2015, 119, 1139–1146. [Google Scholar] [CrossRef] [Green Version]
- Napolitano, E.; Fusco, F.; Baum, R.L.; Godt, J.W.; De Vita, P. Effect of antecedent-hydrological conditions on rainfall triggering of debris flows in ash-fall pyroclastic mantled slopes of Campania (southern Italy). Landslides 2016, 13, 967–983. [Google Scholar] [CrossRef]
- Budetta, P.; de Riso, R. The mobility of some debris flows in pyroclastic deposits of the northwestern Campanian region (southern Italy). Bull. Eng. Geol. Environ. 2004, 63, 293–302. [Google Scholar] [CrossRef]
- Longobardi, A.; Diodato, N.; Mobilia, M. Historical storminess and hydro-geological hazard temporal evolution in the Solofrana River Basin—Southern Italy. Water 2016, 8, 398. [Google Scholar] [CrossRef] [Green Version]
- European Space Agency. User Guides SENTINEL-2 MSI Introduction. 2015. Available online: https://sentinel.esa.int/web/sentinel/user-guides/sentinel-2-msi (accessed on 9 October 2019).
- European Space Agency. User Guides SENTINEL-2 MSI Product Types Level-1C. 2015. Available online: https://sentinel.esa.int/web/sentinel/user-guides/sentinel-2-msi/product-types/level-1c (accessed on 9 October 2019).
- Huang, H.; Roy, D.P.; Boschetti, L.; Zhang, H.K.; Yan, L.; Kumar, S.S.; Gomez-Dans, J.; Li, J. Separability analysis of Sentinel-2A Multi-Spectral Instrument (MSI) data for burned area discrimination. Remote Sens. 2016, 8, 873. [Google Scholar] [CrossRef] [Green Version]
- Vulpiani, G.; Tabary, P.; Parent du Chatelet, J.; Marzano, F.S. Comparison of Advanced Radar Polarimetric Techniques for Operational Attenuation Correction at C Band. J. Atmos. Ocean. Technol. 2008, 25, 1118–1135. [Google Scholar] [CrossRef] [Green Version]
- Esposito, G.; Matano, F.; Scepi, G. Analysis of Increasing Flash Flood Frequency in the Densely Urbanized Coastline of the Campi Flegrei Volcanic Area, Italy. Front. Earth Sci. 2018, 6, 63. [Google Scholar] [CrossRef]
- Brouwer, T.; Eilander, D.; van Loenen, A.; Booij, M.J.; Wijnberg, K.M.; Verkade, J.S.; Wagemaker, J. Probabilistic flood extent estimates from social media flood observations. Nat. Hazards Earth Syst. Sci. 2017, 17, 735–747. [Google Scholar] [CrossRef] [Green Version]
- Restrepo-Estrada, C.; de Andrade, S.C.; Abe, N.; Fava, M.C.; Mendiondo, E.M.; de Albuquerque, J.P. Geo-social media as a proxy for hydrometeorological data for streamflow estimation and to improve flood monitoring. Comput. Geosci. 2018, 111, 148–158. [Google Scholar] [CrossRef]
- Mazzoleni, M.; Verlaan, M.; Alfonso, L.; Monego, M.; Norbiato, D.; Ferri, M.; Solomatine, D.P. Can assimilation of crowdsourced data in hydrological modelling improve flood prediction? Hydrol. Earth Syst. Sci. 2017, 21, 839–861. [Google Scholar] [CrossRef] [Green Version]
- Diakakis, M.; Deligiannakis, G.; Katsetsiadou, K.; Lekkas, E.; Melaki, M.; Antoniadis, Z. Mapping and classification of direct effects of the flood of October 2014 in athens. Bull. Geol. Soc. Greece 2016, 50, 681–690. [Google Scholar] [CrossRef] [Green Version]
- Tkachenko, N.; Jarvis, S.; Procter, R. Predicting floods with Flickr tags. PLoS ONE 2017, 12, e0172870. [Google Scholar] [CrossRef] [PubMed]
- Annis, A.; Nardi, F. Integrating VGI and 2D hydraulic models into a data assimilation framework for real time flood forecasting and mapping. Geo Spat. Inf. Sci. 2019, 22, 223–236. [Google Scholar] [CrossRef] [Green Version]
- Schnebele, E.; Cervone, G.; Waters, N. Road assessment after flood events using non-authoritative data. Nat. Hazards Earth Syst. Sci. 2014, 14, 1007–1015. [Google Scholar] [CrossRef] [Green Version]
- Pennington, C.; Freeborough, K.; Dashwood, C.; Dijkstra, T.; Lawrie, K. The National Landslide Database of Great Britain: Acquisition, communication and the role of social media. Geomorphology 2015, 249, 44–51. [Google Scholar] [CrossRef] [Green Version]
- Molini, L.; Parodi, A.; Siccardi, F. Dealing with uncertainty: An analysis of the severe weather events over Italy in 2006. Nat. Hazards Earth Syst. Sci. 2009, 9, 1775–1786. [Google Scholar] [CrossRef]
- Molini, L.; Parodi, A.; Rebora, N.; Craig, G.C. Classifying severe rainfall events over Italy by hydrometeorological and dynamical criteria. Q. J. R. Meteorol. Soc. 2011, 137, 148–154. [Google Scholar] [CrossRef]
- Meyer, G.A.; Wells, S.G. Fire-Related Sedimentation Events on Alluvial Fans, Yellowstone National Park, U.S.A. SEPM J. Sediment. Res. 1997, 67, 776–791. [Google Scholar]
- Neris, J.; Tejedor, M.; Fuentes, J.; Jiménez, C. Infiltration, runoff and soil loss in Andisols affected by forest fire (Canary Islands, Spain). Hydrol. Process. 2013, 27, 2814–2824. [Google Scholar] [CrossRef]
- Gariano, S.L.; Brunetti, M.T.; Iovine, G.; Melillo, M.; Peruccacci, S.; Terranova, O.; Vennari, C.; Guzzetti, F. Calibration and validation of rainfall thresholds for shallow landslide forecasting in Sicily, southern Italy. Geomorphology 2015, 228, 653–665. [Google Scholar] [CrossRef]
- Staley, D.M.; Kean, J.W.; Cannon, S.H.; Schmidt, K.M.; Laber, J.L. Objective definition of rainfall intensity-duration thresholds for the initiation of post-fire debris flows in southern California. Landslides 2013, 10, 547–562. [Google Scholar] [CrossRef]
- Bhat, G.S.; Kumar, S. Vertical structure of cumulonimbus towers and intense convective clouds over the South Asian region during the summer monsoon season. J. Geophys. Res. Atmos. 2015, 120, 1710–1722. [Google Scholar] [CrossRef]
- McCann, D.W. The Enhanced-V: A Satellite Observable Severe Storm Signature. Mon. Weather Rev. 1983, 111, 887–894. [Google Scholar] [CrossRef] [Green Version]
- Lee, K.-O.; Flamant, C.; Ducrocq, V.; Duffourg, F.; Fourrié, N.; Davolio, S. Convective initiation and maintenance processes of two back-building mesoscale convective systems leading to heavy precipitation events in Southern Italy during HyMeX IOP 13. Q. J. R. Meteorol. Soc. 2016, 142, 2623–2635. [Google Scholar] [CrossRef]
- Federico, S.; Torcasio, R.C.; Avolio, E.; Caumont, O.; Montopoli, M.; Baldini, L.; Vulpiani, G.; Dietrich, S. The impact of lightning and radar reflectivity factor data assimilation on the very short-term rainfall forecasts of RAMS@ISAC: Application to two case studies in Italy. Nat. Hazards Earth Syst. Sci. 2019, 19, 1839–1864. [Google Scholar] [CrossRef] [Green Version]
- Del Moral, A.; Rigo, T.; Llasat, M.C. A radar-based centroid tracking algorithm for severe weather surveillance: Identifying split/merge processes in convective systems. Atmos. Res. 2018, 213, 110–120. [Google Scholar] [CrossRef]


| Watershed | 1 | 2 | 3 | 4 | 5 | 6 | 7 | 8 | 9 | 10 |
|---|---|---|---|---|---|---|---|---|---|---|
| Area (ha) | 13 | 28 | 30 | 70 | 50 | 22 | 23 | 25 | 26 | 29 |
| Perimeter (km) | 1.9 | 2.5 | 2.9 | 4.3 | 3.6 | 2.9 | 3.0 | 2.8 | 2.8 | 2.7 |
| Average slope (°) | 14 | 20 | 26 | 31 | 35 | 32 | 35 | 32 | 32 | 27 |
| Relief (m) | 167 | 419 | 539 | 725 | 705 | 657 | 663.5 | 580 | 582 | 532 |
| Main channel length (km) | 0.6 | 0.7 | 0.8 | 1.7 | 1.5 | 1.3 | 1.3 | 1.1 | 1.0 | 0.7 |
| Main channel average slope (°) | 13 | 19 | 21 | 23 | 26 | 26 | 26 | 27 | 25 | 23 |
| Main channel slope at outlet (°) | 7 | 5 | 4 | 5 | 6 | 9 | 2 | 4 | 3 | 6 |
| Relief ratio | 0.27 | 0.61 | 0.66 | 0.43 | 0.48 | 0.49 | 0.53 | 0.54 | 0.59 | 0.72 |
| Slope ratio | 0.93 | 0.95 | 0.81 | 0.74 | 0.74 | 0.81 | 0.74 | 0.84 | 0.78 | 0.85 |
| Event | 2 September 2017 | 11 September 2017 | 22 October 2017 | 6 November 2017 |
|---|---|---|---|---|
| Storm duration (minutes) | 40 | 50 | 110 | 120 |
| Total storm rainfall (mm) | 8.2 | 20 | 27.4 | 45.4 |
| Max C30 (mm) | 8 | 17.6 | 12.4 | 18 |
| Max C10 (mm) | 7.4 | 10 | 5.4 | 7.4 |
| Max I30 (mm/h) | 16 | 35.2 | 24.8 | 36 |
| Max I10 (mm/h) | 44.4 | 60 | 32.4 | 44.4 |
| RI Max C30 (years) | 1 | 1.1 | 1 | 1.1 |
| VMIflood response (dBZ) | 22 | 26 | 17 | 36 |
| VMImax storm (dBZ) | 24 | 26 | 35 | 36 |
| Hflood response (km) | 4.5 | 12 | 9 | 12 |
| Hmax storm (km) | 12 | 12 | 9 | 12 |
| Issued alert | Yellow | Orange | Yellow | Orange |
| Event | Flow Type | Damaged Anthropic Elements | |||
|---|---|---|---|---|---|
| Water flow | Hyperconcentrated flow | Debris flow | Roads | Buildings | |
| 2 September 2017 | X | X | X | ||
| 11 September 2017 | X | X | X | X | X |
| 22 October 2017 | X | X | X | ||
| 6 November 2017 | X | X | X | X | X |
© 2019 by the authors. Licensee MDPI, Basel, Switzerland. This article is an open access article distributed under the terms and conditions of the Creative Commons Attribution (CC BY) license (http://creativecommons.org/licenses/by/4.0/).
Share and Cite
Esposito, G.; Parodi, A.; Lagasio, M.; Masi, R.; Nanni, G.; Russo, F.; Alfano, S.; Giannatiempo, G. Characterizing Consecutive Flooding Events after the 2017 Mt. Salto Wildfires (Southern Italy): Hazard and Emergency Management Implications. Water 2019, 11, 2663. https://doi.org/10.3390/w11122663
Esposito G, Parodi A, Lagasio M, Masi R, Nanni G, Russo F, Alfano S, Giannatiempo G. Characterizing Consecutive Flooding Events after the 2017 Mt. Salto Wildfires (Southern Italy): Hazard and Emergency Management Implications. Water. 2019; 11(12):2663. https://doi.org/10.3390/w11122663
Chicago/Turabian StyleEsposito, Giuseppe, Antonio Parodi, Martina Lagasio, Rocco Masi, Giovanni Nanni, Filiberto Russo, Stefano Alfano, and Gaetano Giannatiempo. 2019. "Characterizing Consecutive Flooding Events after the 2017 Mt. Salto Wildfires (Southern Italy): Hazard and Emergency Management Implications" Water 11, no. 12: 2663. https://doi.org/10.3390/w11122663