
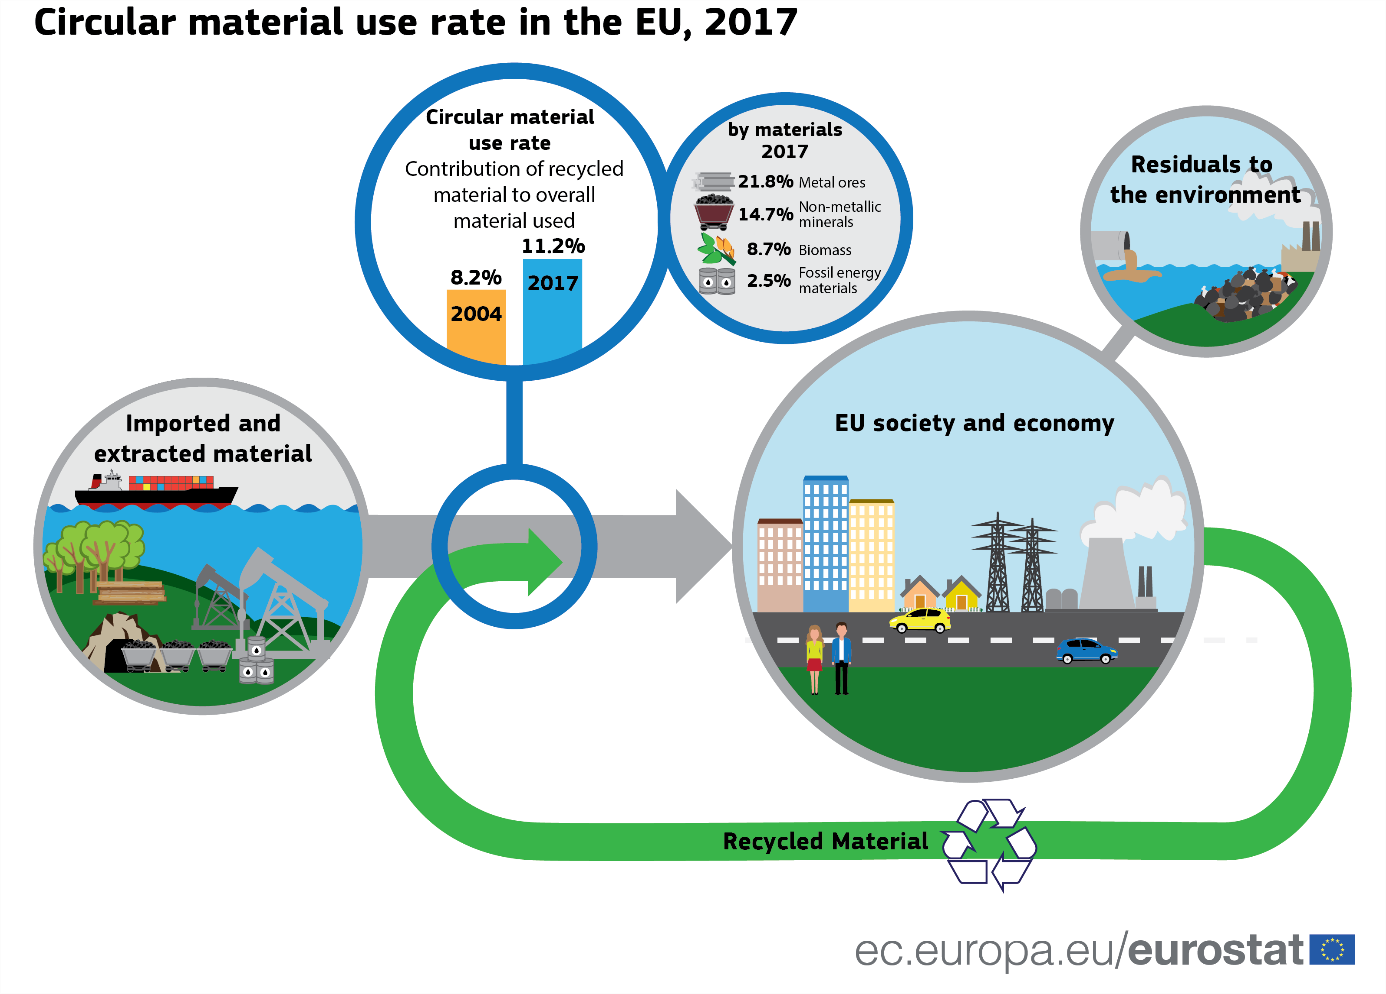
The European Union (EU) circular material use rate was 11.2% in 2017. This means that over 11% of material resources used in the EU came from recycled products.
The circular material use rate has fluctuated between 11.1% and 11.2% since 2012, with a small increase in 2016 (11.4%). In the period between 2004 and 2012, it increased from 8.2% to 11.1%, i.e. by almost 3 percentage points.
The circular material use rate, also known as circularity rate, is the share of material resources used which came from recycled products and recovered materials, thus saving extractions of primary raw materials. The circularity rate is part of the EU monitoring framework on the circular economy.
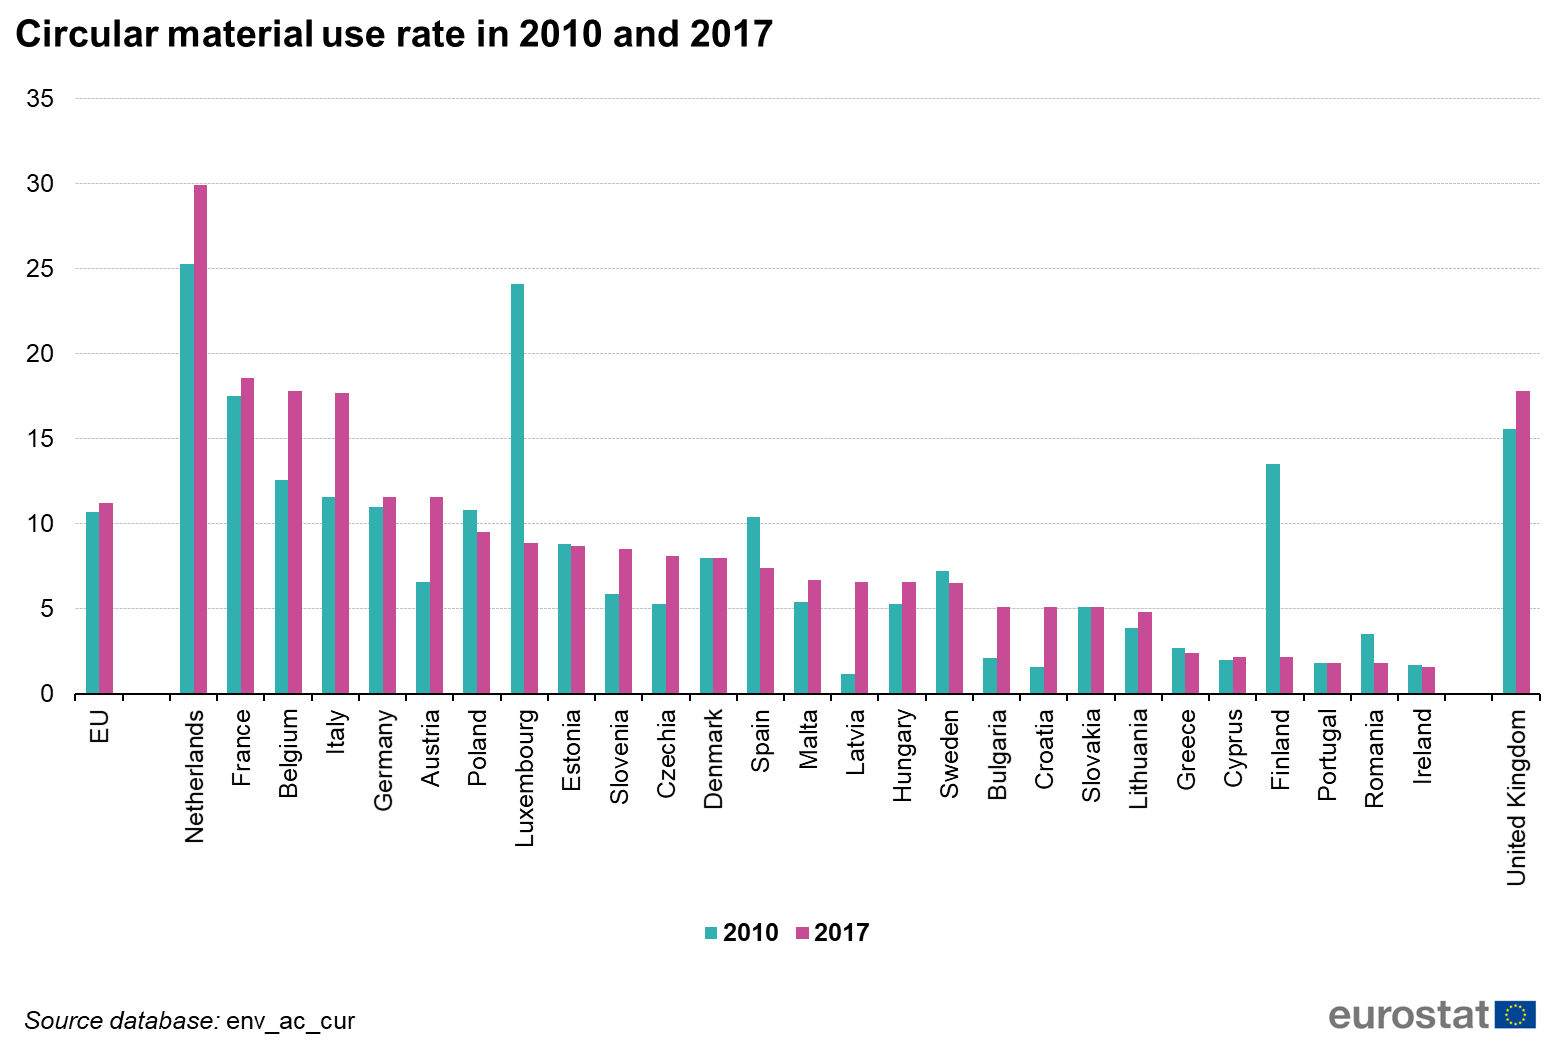
Highest increase in Italy, largest decrease in Luxembourg
In the period between 2010 and 2017, the circular material use rate increased in 15 of the 27 Member States, remained stable in three and decreased in nine other Member states.
The highest increases were recorded in Italy (+6 pp), followed by Latvia, Belgium, Austria and the Netherlands (each +5 pp). At the opposite end of the scale, the largest drop was recorded in Luxembourg (-15 pp) and Finland (-11 pp), followed by Spain (-3 pp).
Significant differences in circular material use rate for different materials
Metal ores was the material category with the highest circularity rate. In 2017, over a fifth of metal ores (21.8%) used in the EU came from recycled products and recovered materials, ahead of 14.7% of non-metallic minerals (including glass), 8.7% of biomass (including paper, wood, tissue, and other) and 2.5% of fossil energy materials (including plastics and fossil fuels).
Fossil fuel materials are less suitable for recycling because they are used primarily to produce energy; however, more recycling of plastics could be possible. Most types of biomass are unsuitable for recycling (for example, food and fodder or wood for energy), yet progress is possible (for example, by reducing food waste and recycling natural tissues in textiles).
Note:
- The circular material use rate is part of the EU monitoring framework on the circular economy. It measures the contribution of recycled material to overall material used.
- The circular material use rate is much lower than other indicators of circularity, such as recycling rates, which are around 56 % in the EU. A recycling rate is a share of waste recycled. Instead, the circular material use rate is defined in terms of all the materials that are fed into our economy, not only waste. This means that the circular material use rate can be increased in more ways than recycling rates can be increased and requires a deeper transformation within our societies. For instance, replacing fossil fuel carriers with renewables, using more efficient production technologies, or extending the lifespan of the products.
- The European Union (EU) includes 27 EU Member States. The United Kingdom left the European Union on 31 January 2020. Further information is published here.
For more information:
- Eurostat Statistics Explained article on material flows in the circular economy
- Eurostat Sankey diagram of material flows
- Eurostat website section dedicated to the circular economy
- Eurostat Circular material use rate — Calculation method
- The source data can be found in Eurostat dataset env_ac_cur and env_ac_curm.
To contact us, please visit our User Support page.
For press queries, please contact our Media Support.