January saw a drop in temperatures and some snowfall in Italy, but as early as mid-February we had pointed out how they were not enough to make up the snow water deficit. Our most recent data confirm a significant snow deficit and now, as the melt season approaches, it becomes urgent to think about the implications
Winter is now ending, and the lengthening days remind us of the approach of spring. Spring is usually when the snow melts, providing us with the water we need for many activities, from energy supply to agriculture, not to mention its essential role in the well-being of ecosystems. Unfortunately, however, snowfall in the winter 2022-23 has been scarce, and it threatens to exacerbate the drought that has been affecting Italy since last year: historically, March 4th is the day of maximum snow accumulation in Italy. From this date onward, it becomes difficult to have snowfall intense and prolonged enough to replace the snow that is missing.
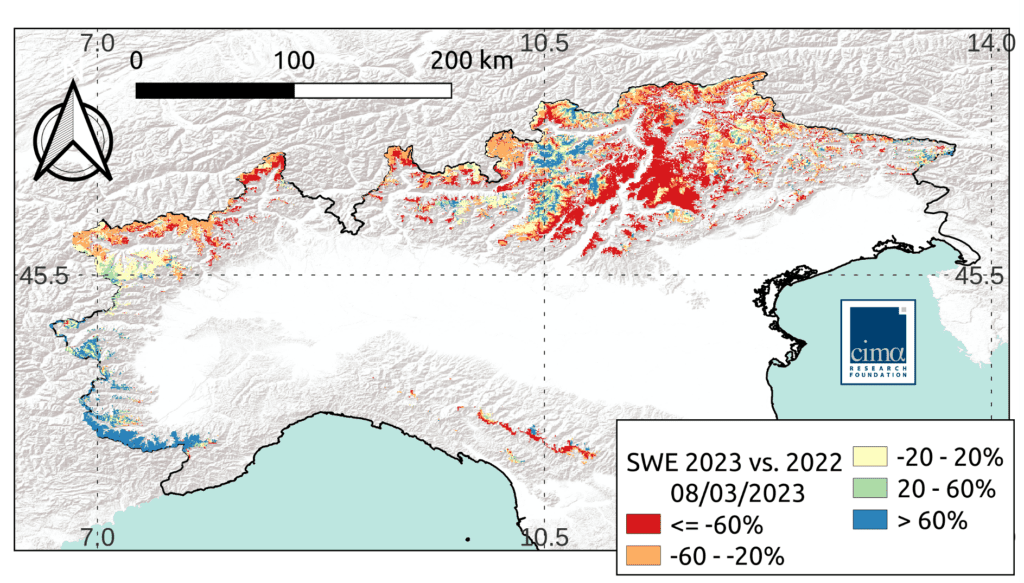
CIMA Research Foundation regularly collects available data, integrating the information collected by ground-based sensors with that from satellites, and processing it with the S3M model. This tool allows us to get a picture of the situation, reporting in particular the Snow Water Equivalent (SWE), a parameter that represents the amount of water contained in the snow and therefore can inform on the severity of the deficit.
At the end of January, several areas in Italy experienced even heavy snowfall and temperatures dropped. But, as our analyses already pointed out, this was not enough to make up for the deficit of snow that had accumulated over the months. As we use to say, in fact, snow accumulation cannot be viewed as a 100-meter race but must be evaluated as a marathon – snow must be allowed to accumulate steadily over a relatively long time in order to provide the water reserve that is so precious to us. January’s snowfalls, on the other hand, were closely followed by particularly warm temperatures (which we can feel even these days and is expected to last until mid-March) which led to a rapid and early melt.
This is a significant decrease affecting both the Apennines and the Alps, especially at low altitudes. From the point of view of economic activities, it is the lack of snow in the Alps that is of greatest concern. These mountains, in fact, supply fresh water to the Po River basin, which is home to about half of Italy’s water resources: overall, we estimate that on the Alps the deficit is, to date, -69% compared to the average of the last 12 years. Looking at the Po River alone, the deficit stands at -66%. Both figures are worse, therefore, than the national deficit of -63% – a figure that, moreover, represents a worsening compared to the mid-February analysis, mainly due to gradually milder temperatures. The latter, in fact, led to the melting of about a third of the SWE nationwide.


Snowmelt was also intense in the Apennines; however, heavy snowfall in January meant that, at least in the central and southern areas, snowfall remained closer to the average. Unfortunately, however, these mountains are home to only about 10 percent of the national SWE; in other words, their snow does not significantly help us solve the Alps’ water deficit.


As a whole, the situation is worse than last year, which was also already very dry. By now, with spring just around the corner, it becomes urgent to assess its implications. “We have to ask ourselves: what have we learned from previous snow deficits? First, that scarce snow water resources often lead to a decline in hydropower production on an Alpine scale. Second, that warm, drought years like 2022 see less snow but also a greater need for irrigation water, as suggested by data from the Autonomous Region of Val d’Aosta, analyzed in collaboration with ARPA Val d’Aosta,” says Francesco Avanzi, researcher in the Hydrology and Hydraulics Department at CIMA Research Foundation. “This is a ‘perfect storm’ for our mountains, which are providing less snow – just when we will need more water than usual.”