
Abstract
As a vital step towards the industrialization of perovskite solar cells, outdoor field tests of large-scale perovskite modules and panels represent a mandatory step to be accomplished. Here we demonstrate the manufacturing of large-area (0.5 m2) perovskite solar panels, each containing 40 modules whose interfaces are engineered with two-dimensional materials (GRAphene-PErovskite (GRAPE) panels). We further integrate nine GRAPE panels for a total panel area of 4.5 m2 in a stand-alone solar farm infrastructure with peak power exceeding 250 W, proving the scalability of this technology. We provide insights on the system operation by analysing the panel characteristics as a function of temperature and light intensity. The analysis, carried out over a months-long timescale, highlights the key role of the lamination process of the panels on the entire system degradation. A life-cycle assessment based on primary data indicates the high commercial potential of the GRAPE panel technology in terms of energy and environmental performances.
Main
Among the third generation of photovoltaics (PVs), perovskite solar cell (PSC) technology is the most promising one to hit the PV market. This development has progressed with an impressive pace, allowing the power conversion efficiency (PCE) of PSCs to surpass the ones of other commercial thin-film solar cell technologies (CdTe, (Cu,In)GaSe2, amorphous Si) and approach the state-of-the-art PCE of single crystal silicon (c-Si) solar cells (26.1%) (ref. 1). Coupled with the exceptional PV performance, the low manufacturing cost of PSCs (<38.8 US$ m−2) (ref. 2) is particularly attractive for large-scale production of modules and panels, enabling the design of novel tandem configurations together with c-Si and other thin-film PVs. Remarkably, the PSC technology has the potential to reach a levelized cost of electricity less than 20€ MWh−1 (refs. 2,3,4).
In this context, the demonstration of effective fabrication processes for large-area perovskite solar modules (PSMs) and their integration into a solar farm operating in outdoor conditions are key challenges from an industrial perspective. Hence, the main prerequisites for the full exploitation of PSC technology are: the engineering of cell architecture able to retain the lab-scale devicesʼ performances during the upscaling process; the design of effective module interconnection; the establishment of panel lamination processes compatible with thermal and chemical stability requirements of the PSC materials and the panel stability.
In the past few years, strong efforts have been devoted to the fabrication of large-area PSMs5,6. However, there are not yet reports concerning field tests of m2-sized solar farms and their real-life operation in outdoor conditions. Outdoor testing of laboratory-scale PSCs is still limited and mainly focused on the analysis of temperature coefficients of power, neglecting accurate short-circuit current (ISC), open circuit voltage (VOC) and fill factor (FF) dependence on both the irradiance and the temperature conditions as those occurring during outdoor operation. Consequently, additional data and knowledge are needed to evaluate the stability and degradation of large-scale PSMs and panels under real operation conditions, enabling the energy yield of a perovskite-based solar farm to be forecasted.
To bridge the gap between laboratory prototypes and outdoor operating solar farms, we exploit the know-how developed in the use of graphene and other two-dimensional materials for interface engineering of PSCs and PSMs7,8,9,10,11,12,13,14,15,16,17,18,19, realizing panel-scale 2D materials-enabled PV perovskite (GRAphene-PErovskite, GRAPE) demonstrators. Such knowledge was the key to success in designing, assembling and constructing a stand-alone solar farm consisting of 4.5 m2 total panel area. The GRAPE panels consist of state-of-the-art mesoscopic n-i-p PSMs (Supplementary Fig. 1) based on graphene-doped electron transporting layers (ETLs) and functionalized MoS2 (fMoS2) buffer layers inserted between the perovskite and the hole transporting layer (HTL). Our holistic approach includes the development of the required solar farm infrastructure, the integration of GRAPE panels and the design and installation of required peripherals (that is, power electronics, real-time data acquisition systems and a weather station). The continuous monitoring and the direct correlation of the environmental conditions with the outdoor performance of the GRAPE panels provide true metrics for assessing the lifetime of the proposed technology, while offering valuable information on the potential for the commercialization of this technology. In this scenario, the life-cycle assessment (LCA) methodology is used to evaluate the environmental footprint and sustainability of the GRAPE technology. Importantly, the assessment of the energy production and stability and the LCA of the proposed technologies allow to reach a technology readiness level (TRL) 7 (system prototype demonstration in operational environment). To the best of our knowledge, no previous analyses on perovskite-based PVs have been so far reported up to this TRL, which will be of interest for the PV industrial sector.
Two-dimensional materials-based modules and panels
Two-dimensional materials were produced in an industrial pilot production plant through wet-jet milling (WJM) and/or liquid-phase exfoliation techniques20. Additional details regarding the single-layer graphene/few-layer graphene and fMoS2 flake production processes and characterizations are reported in the Methods section and in the Supplementary Methods sections 2–8.
We fabricated 360 PSMs, each having a substrate area of 11 × 11 cm2 and composed of nine series-connected PSCs with an active area of 9.1 cm2, resulting in a total active area of 81.9 cm2 (aperture area = 101 cm2). We selected the following 2D materials-enabled cell stack8,21 (Fig. 1a): glass/fluorine doped tin oxide (FTO)/compact TiO2 + graphene (cTiO2 + G)/mesoporous TiO2 + graphene (mTiO2 + G)/mixed-cation perovskite/fMoS2/poly(triaryl amine) (PTAA)/Au (Methods and Supplementary Information provide further details concerning the fabrication process of PSMs). The graphene flakes integrated into the mTiO2 ETL promotes the crystallization of the perovskite wrapped within the ETL itself22, leading to an order of magnitude reduction of the electron trap density compared with the one of pristine mTiO213. Meanwhile, the incorporation of graphene flakes in the cTiO2 layer reduces the device dark current and improves the FF of the resulting PSCs23. At the perovskite–HTL interface, the buffer layer of fMoS2 flakes promotes the hole transfer from the absorbing layer to the HTL compared with reference devices without fMoS219,21,24. In addition, the use of graphene and fMoS2 stabilizes the perovskite/ETL and perovskite/HTL interfaces, respectively, under harsh testing conditions, such as prolonged illumination and thermal stresses16,22. Lastly, the choice of PTAA as the HTL was motivated by its intrinsic thermal stability up to 85 °C (ref. 19), a temperature set by the International Summit on Organic Photovoltaic Stability (ISOS) and International Electrotechnical Commission stability test protocols25. In addition, PTAA satisfies the requirements needed for our low-temperature lamination process developed for the encapsulation of the GRAPES panels, as discussed hereafter.

a–c, Modules. d–f, Solar panels. a, The stack structure of the GRAPE solar cells composing the modules. The graphene and fMoS2 layers are represented using their chemical structure. b, I–V curves (forward (Forw.) scan/empty dots curve and reverse (Rev.) scan/full dots curve as indicated by the direction of the blue arrows) for the most efficient PSM measured at 1 sun irradiation. c, Module PCE statistic over 360 PSMs extracted from reverse scan I–V measurements. d, Photograph of a representative 0.5 m2 GRAPE panel. e, I–V curves of the nine GRAPE panels (PSP) measured at global tilted irradiance around 1,000 W m−2. f, Nominal power (Pn) calculated from the I–V curves of the nine GRAPE panels.
The geometric FF of the PSMs, defined as the ratio between active and aperture areas, was set to 81%. This choice led to a high production yield of the PSMs with a low failure rate, which is typically determined by the ETL/perovskite/HTL stack removal (that is, the P2 laser process; Supplementary Information provides further details)10,26. The current–voltage (I–V) curves and the stabilized output power measured for the most efficient PSMs (maximum PCE on active area equal to 16.4%) are reported in Fig. 1b and Supplementary Fig. 2, respectively, while Fig. 1c shows the statistical distribution of the PCE data recorded for the PSMs. The average PCE of the 360 PSMs measured at 1 sun irradiation with the standard deviation is 12.5% ± 1.6 (Fig. 1c). Even if these results are important at such device scale, the spread of PCE data distribution across 360 PSMs is currently attributed to the complex fabrication process that includes 16 different steps, as described hereafter. It is expected that the PCE spread will be reduced by a fully automated PSM fabrication.
The as-produced PSMs were sorted in terms of their maximum power point (MPP) performance, while special attention was paid during their assembly into several GRAPE panels by hybrid series/parallel connections (Fig. 1d), aiming at properly balancing their PV metrics distribution. Each panel consists of five parallel connected strings realized by connecting eight modules in series, resulting in 40 PSMs per panel (Supplementary Fig. 3a). A low-temperature cross-linkable ethylene-vinyl acetate (EVA) has been used as sealing material (Supplementary Fig. 3b) being compatible with a standard PV lamination process used in commercially viable PV technologies. The primary module was sealed with a Kapton foil capable to prevent module degradation induced by the possible release of acetic acid by EVA during the panel’s operation and to avoid the back electrode delamination during EVA melting27,28. Such precaution allowed us to establish a low-temperature (85 °C) lamination approach that limited the degradation of the thermally sensitive materials contained in the PSMs. We formulated a multi-step lamination protocol (Methods) compatible with the temperature/pressure boundary conditions imposed by the perovskite-based modules.
The performance of each GRAPE panel was initially assessed by performing outdoor characterizations at the Energia Solare TEst e Ricerca (ESTER) facility of the Centre for Hybrid and Organic Solar Energy, just after the fabrication process and before its installation in the solar farm29 (Supplementary Figs. 4–6). Figure 1e shows the I–V curves measured outdoors with a sun tracker (global tilted irradiance) for each one of the nine GRAPE panels at irradiance values of ~1,000 W m−2. Figure 1f shows the nominal power (Pn) of the nine GRAPE panels estimated for 1,000 W m−2 irradiance by scaling the maximum output power (Pm) to the corresponding experimental irradiance. An average Pn of 30 W ± 3 W was obtained for the tested panels. Among them, the best performing one (that is, panel number nine) achieved a Pn of 35.5 W. The maximum nominal PCE calculated on the active area of the panel (0.32 m2) is ~11% (average PCE of 9.2%). All the main parameters of the I–V curves, including FF and Pn, are reported in Supplementary Table 1.
Solar farm
A stand-alone solar farm infrastructure was designed and constructed using the fabricated GRAPE panels as the building blocks (Fig. 2a). More in detail, we opted to install the solar farm in Heraklion, Crete (Supplementary Fig. 7a,b), a site that combines favourable climate conditions, such as a high solar irradiation of 1,990 kWh m−2 (right top panel of Supplementary Fig. 7a). The solar farm consisted of nine GRAPE panels, the required electrical equipment (solar charger, MPP tracker, inverter and batteries, as shown in Supplementary Fig. 7c) and a weather station. The outdoor field tests of the solar farm included extensive measurements of the electrical characteristics of GRAPE panels, while the energy harvested by the solar farm covered the energy needs of associated a.c. loads of the Hellenic Mediterranean University (HMU) laboratory (Supplementary Fig. 7c and Supplementary Table 2).

a, Nine GRAPE panels integrated in a stand-alone solar farm-powered infrastructure installed in Crete, HMU campus. b, Typical I–V and P−V characteristics of the solar farm with a maximum output power (Pm) of ~261 Wp. c, One-line electrical diagram of the solar farm configuration. SPD, surge protection device; VDC, voltage DC; PE, protective earth (ground); H07RN-F, type of DC cable; J1W-R, type of AC cable; L1, single-phase AC electrical system; T1 + T2, thermally activated contacts; Fs-1, type of circuit breaker; G1-1, type of differential power switch; QS-1, type of power switch; L1-N, single-phase AC with neutral.
The harvested energy was extracted using an in-house developed solar charger with a MPP tracker (Supplementary Figs. 8–13 and Supplementary Tables 3–4), while the d.c.-to-a.c. conversion of the solar farm output was carried out by a suitable inverter (Supplementary Fig. 7c). Figure 2b shows typical I–V (forward I–V scan) and power–voltage (P–V) curves of the solar farm in its first day of operation. The electrical one-line diagram and the block diagram of the stand-alone system are presented in Fig. 2c and Supplementary Fig. 7c, respectively. In the solar farm, the electrical energy harvested by the GRAPE panels was not directly used to supply power to the a.c. loads but was stored in four serially connected 6 V vented tubular plate batteries with a capacity of 260 Ah. The I–V characteristics and the power performance of the solar farm (Pm of ~261 watt peak (Wp)) exhibited features (namely, I–V shape and FF) similar to the ones of the individual panels (Fig. 1e,f). These data indicated that no further power losses have been accumulated either during their integration into the solar farm or in the time interval between the fabrication of the panels and the operation of the solar farm.
The in-house-developed solar charger and MPP tracker permitted the following operations: (1) the measurement of I–V curves using both forward and reverse scan modes under real outdoor conditions, (2) the implementation of different MPP tracking algorithms such as Perturb and Observe and fractional VOC algorithms (Supplementary Information) and (3) a direct comparison with other PV technologies installed in the same field such as CdTe and Si solar panels. The identification of fractional VOC as the most efficient MPP tracking algorithm for the solar farm increased the overall energy yield by 11% with respect to the Perturb and Observe algorithm (Supplementary Table 4).
The real-time monitoring of the environmental conditions allowed the performance of the PV panels to be directly correlated (Methods provide additional details). The power output of the solar farm was tracked at MPP conditions and all the relevant meteorological data, including sun irradiance, humidity, ambient and panel temperatures were recorded simultaneously using a real-time data acquisition system (Supplementary Figs. 14–16). The typical dependence of the panel electrical characteristics on various environmental parameters have been acquired during the day and reported in Supplementary Fig. 17a,b,c, while the Pmax of the solar farm versus illumination at different humidity levels are reported in Supplementary Fig. 17e,f,g.
To evaluate the performance under different light conditions, the PV characteristics of the solar farm have been plotted as a function of the in-plane irradiance (Fig. 3). The total ISC increased almost linearly with the irradiance level (Fig. 3a), whereas VOC data indicate a logarithmic dependence (Fig. 3b), which is expected for PSCs operating at light intensities >10 W m−2 (ref. 30). Differently, the solar farm FF was almost unaffected by the irradiance (Fig. 3c). The maximum power (PMAX) followed the irradiance almost linearly (Fig. 3d) as a consequence of the trends observed for the other PV metrics.

a, ISC versus irradiance. b, VOC versus irradiance. c, FF versus irradiance. d, Maximum power (PMAX) versus irradiance. Blue and red circles refer to morning and afternoon measurements, respectively, while the blue and red arrows indicate the increase/decrease of irradiance during morning/afternoon hours.
To investigate the hourly dependence of the electrical characteristics of the solar farm, data have been separated into morning and afternoon acquisition. The two different branches of PMAX (indicated by arrows) indicate that the PV performance during the morning is higher than during the afternoon. The superior PMAX during the morning is mainly attributed to the VOC data, and to a lesser extent to FF and ISC (ref. 31), which are less dependent on the morning/afternoon measurements. To further elucidate the trend of the solar farm metrics, the thermal stress of the stand-alone system has been evaluated during ‘hot days’ in the June 2020–June 2021 period in Crete, focusing on temperature as the external parameter determining the solar farm performance. The temperature of the panels during the day followed the trend of the ambient temperature. However, the panel temperature was higher than the ambient one, and the peak temperature was reached in the afternoon, almost one hour after the maximum irradiance (Supplementary Fig. 18a). Despite the temperature of GRAPE panels reaching values as high as ~50 °C (Supplementary Fig. 18a), the energy produced by the solar farm was very close to that estimated for a solar farm operating at standard test conditions (Supplementary Fig. 18b).
Notably, the temperature sensitivity of the PV performance is typically regulated by an internal balance between charge generation and recombination processes32. The ISC and VOC changes associated with temperature are commonly expressed through the ISC and VOC temperature coefficient (βIsc and βVoc, respectively)32. To estimate the temperature coefficients of our PV technology, the solar farm panels were measured at various temperatures at an irradiance of 500 W m−2 (Fig. 4 and Supplementary Fig. 19) after a light soaking of 45 min to stabilize PV characteristics and temperature of the modules. The ISC exhibited a positive βIsc of +0.03% °C−1, that is, a little smaller than the one of c-Si (0.0728% °C−1) (ref. 33), whereas βVoc was equal to −0.17% °C−1. Interestingly, the latter is less negative than those of commercial PV technologies34. For example, βVoc of c-Si panels is around −0.35 % °C−1 (ref. 34). Our low βVoc is consistent with previous studies on indoor tests of PSCs, which have shown low absolute values of βVoc, ranging between −0.12% °C−1 (ref. 35) and −0.18% °C−1 (ref. 36). Considering that both ISC and FF have slightly positive temperature coefficients (Fig. 4a and Supplementary Fig. 19b), the negative temperature coefficient of the maximum power of the panels (−0.21% °C−1, Supplementary Fig. 19c) is mainly ruled by the temperature dependence of VOC and it is almost half of the corresponding coefficient for a c-Si cell34.

a,b, Temperature dependence of ISC (a, red dots) and VOC (b, green dots) for a representative GRAPE panel measured at an irradiance level of 500 m−2. Current temperature coefficient (βIsc = +0.03% °C−1) and voltage temperature coefficient (βVoc = −0.17 °C−1) are also extracted from the linear fit of the data. c, The figure shows the Pn for the period 10 June 2020–10 March 2021. The grey region represents the 100–80% range of the initial power.
Because of the temperature behaviour of the PV parameters (Fig. 4a,b and Supplementary Fig. 19) and considering the higher temperature of the panel in the afternoon compared with the morning (Supplementary Fig. 17), we can assert that the morning/afternoon behaviour observed for the PV characteristics of the solar farm (Fig. 3) is mainly determined by the temperature dependence of the GRAPE panel VOC.
To clarify the relationship between PV performance and temperature (Supplementary Fig. 19b,d), electrochemical impedance spectroscopy measurements were performed on the best performing GRAPE panel to assess the interfacial charge transport dynamics under variable frequencies (Supplementary Figs. 20 and 21 and discussion in Supplementary Information). The transient analysis shows that the series resistance (RS) remained almost constant up to 48 °C, while the charge transfer resistance (RCT) decreased at elevated temperatures. Because the decrease of RCT was associated with an increase of leakage current and recombination processes, these data are consistent with the moderate performance drop linked to the increase in temperature (Supplementary Fig. 19c)33.
To exclude the presence of extrinsic contributions, such as interconnections of multiple modules, to the temperature dependence of our GRAPE panels, we have performed similar measurements on a two-module panel having the same material configuration (Supplementary Fig. 22). Notably, we have measured a similar negative VOC coefficient (and negative temperature coefficient in PMAX, FF, PCE) also at the module level. Overall, these data reveal that the low βVoc is inherent to our PV technology and is not an extrinsic effect. Contrary to many semiconductors, in which the optical band gap (EG) decreases almost linearly with the temperature increase associated with solar cell operation, halide perovskites have a positive correlation between EG and temperature37,38,39. This effect causes an increase of the VOC by increasing the temperature. However, the increase of the charge recombination with the increase of the temperature39 partially counterbalances the effect of the EG values on the VOC. Moreover, the increase of the EG with the temperature should also cause a negative βIsc, that, however, was not recorded in our case. Therefore, other effects should be considered to identify the origin of the slightly positive βIsc, including thermally excited carries, reduced resistivity values for perovskite and charge transport layers33 and spectral intensity fluctuations at wavelengths near the modified EG at elevated temperatures39.
Overall, the direct comparison between our panels and commercial technologies, indicates that GRAPE panels exhibit the smallest VOC drop with increasing temperature among the various technologies. This is a promising feature that may enable the realization of PV systems with high PCE working in outdoor applications34.
If the designed solar farm had been grid connected, it would have continuously harvested energy for during daylight. By making this assumption, it is possible to estimate the total energy-production capability of the solar farm. From 10 June 2020 until 10 June 2021, the solar farm operated with nine GRAPE panels, corresponding to an installed power of 267 Wp that could have potentially produced ~376.06 kWh, even considering the solar farm performance losses measured in the first 12 months (Supplementary Fig. 23). Without losses, the energy production would have been 546.78 kWh with a performance ratio for the system of 68.78%.
An almost monotonic reduction of the solar farm Pn was observed during the nine months of operation (Fig. 4c). Nevertheless, the solar farm has passed the ISOS O-3 test (1,000 h outdoor conditions), achieving a remarkable T80 of 5,832 h (at ~month 8). The periods in which the solar farm exhibited a small recovery of the initial output power, that is, from 10 June 2020 to 22 June 2020 and from 22 July 2020 to 10 August 2020, were characterized by a lower load of the system because the batteries were fully charged and the system did not consume energy from the panels.
After month nine, a substantial drop in the nominal power of the solar farm was caused by the failure of the modulesʼ lamination that induced severe local physical damage in the panels associated with the presence of oxygen and moisture (Supplementary Figs. 24 and 25). The failure of the module lamination is mainly related to the low-temperature cross linking of EVA and the process (85 °C) that was chosen to avoid degradation of the PSMs during their encapsulation. In fact, the lamination temperature used in the present work is close to the maximum temperature reached by the panels in some hot days in Crete (~70 °C, Supplementary Fig. 14c). Thus, it is necessary to develop PSM materials that could withstand higher lamination temperature (~120 °C) for several tens of minutes, and develop more advanced encapsulants, such as those recently proposed for PSCs30.
Nevertheless, we point out that the solar farm stability, in the period before the failure of the lamination (month 1 to month 9), was superior to the one reported by previous reports on laboratory-scale PSCs35,40,41. In those devices, the degradation was mainly associated with: the reverse bias behaviour of PSCs that can lead to tunnelling breakdown induced by ion migration, an effect that is enhanced at elevated temperatures (>40 °C) (ref. 42) and the volatile cations migration, such as methylammonium (MA), and noble metal diffusion towards the perovskite active layer43.
Life-cycle assessment
A cradle-to-gate LCA was performed according to the International Standard Organization 14040–14044 standards44,45 for the calculation of the eco-profile of the manufacturing process of a GRAPE module up to the installation of the solar farm for outdoor testing. The possibility of building a life-cycle inventory largely based on high TRL primary data permits us to make a robust assessment compared with other LCA studies published in literature (Supplementary Discussion 16) in which most of the information is not experimentally derived. In our analysis, the chosen functional unit46 is 1 kWh of generated electricity by the solar farm. To increase the level of information, the reference flow corresponding to one PSM module based on GRAPE technology of 121 cm2 (active area = 81 cm2) was used to characterize the eco-profile of the manufacturing phase. The life-cycle data inventories (Supplementary Tables 5–8) include all the input and output flows related to materials and energy requirement characterizing the module manufacturing process, the outdoor station lamination and the operational phase (Supplementary Figs. 27 and 28). Due to the lack of primary data on the end-of-life phase of the PV solar farm, the modelling of this life-cycle phase is excluded from the analysis. The Environmental Footprint (EF) 2.0 method was used to perform the life-cycle impact analysis47, thus, providing eco-profiles characterized according to 16 environmental categories (Supplementary Table 9 and description in Supplementary Information). To determine data quality and representativeness, the pedigree uncertainty matrix (Supplementary Table 10) was applied to demonstrate that the LCA data accuracy is ~97–98% for the identified impact categories (Supplementary Table 11).
Figure 5 shows the PSM manufacturing process (Fig. 5a) and the characterization of its eco-profile (Fig. 5b). The largest impact on all the EF categories is given by Step 15 ‘Gold evaporation’. As shown in Fig. 5c, the eco-profile of the outdoor pilot installation is substantially determined by the PSM manufacturing process (Supplementary Figs. 27 and 28 and the related part in Supplementary Information provide more details) due to the high impact of gold consumption in agreement with other findings in literature46,48. Prospectively, a realistic GRAPE technology scale-up and its sustainable mass production will consider the replacement of gold with an alternative material for the back electrode, such as graphene or other carbon materials or cheap metals49, to reduce the environmental footprint of the system. To this regard, LCA results of a hypothetical GRAPE module using a graphene-based back electrode for the PSMs are reported in Fig. 5d, showing the environmental benefits associated with gold replacement. Another environmental hotspot that could be mitigated through material replacement is associated with the consumption of silver in Step 4A and Step 6A. Notably, this consumption could be reduced by implementing a full P1/P2/P3 laser process26. From the energy-consumption point of view, the second-most costly contribution to the eco-profile is represented by Step 5, that is, ‘Compact layer deposition’, due to the electricity consumed during the spray pyrolysis deposition. Feasible minimization of the environmental impact of this step could be addressed by performing a low-temperature process50. This could lead to an improvement in the deposition efficiency and a consistent reduction of this step burden on the overall environmental profile. We should also point out that the very low quantities of 2D materials present in the PSM (0.2 mg of graphene and 0.6 mg of fMoS2) do not represent an environmental hotspot for the eco-profile of the PSM based on GRAPE technology (Supplementary Table 11).

a, Workflow of the PSM manufacturing and panel assembling based on GRAPE technology. b, Characterization results of the PSM manufacturing environmental profile. For each impact category (Supplementary Table 11), coloured bars represent the contribution percentage of the manufacturing steps. c, Characterization results of the solar farm installation. For each impact category, coloured bars represent the contribution percentage of the PV station components. The x-axis breaks (b,c) are used to increase the inspection of the contribution percentages. d, Comparison of the environmental profiles of two manufacturing processes of GRAPE PSMs using gold-based (left) and graphene-based (right) back electrodes. Calculations are performed with the EF method/single score (that is, the environmental categories’ results are normalized and weighted to obtain an aggregate impact score expressed as a dimensionless value, mPt). GWP100, Global Warming Potential over 100 years.
On the basis of these potential technological improvements of the manufacturing process, an optimized GRAPE solar farm was modelled (Supplementary Figs. 29–31 and Supplementary Discussion 16) to assess the energy performance (Supplementary Tables 13 and 14) that turns out to be halved compared with the base scenario. Then, a prospective LCA study allowed the environmental footprint of 1 kWh of electricity produced by the optimized GRAPE solar farm to be compared with that of future energy-production scenarios in Europe. Figure 6 shows that our results are promising because the eco-profile of the investigated system might compete with those calculated for the 2050 European electricity mixes, even in the case of the optimistic (OPT) future scenario. The lowest impact is found for the future outdoor installation located in South Europe. The environmental footprints calculated for all the geographical locations are lower than the current European electricity mix and are already competitive with the business-as-usual (BAU) and realistic (REAL) future scenarios. The environmental and energy performances of the solar farm are even more promising considering that the manufacturing and lamination processes of GRAPE technology are still not totally optimized for industrial production.

Comparison of the environmental footprint of the optimized GRAPE solar farm (installed in three different European areas), the European electricity mix (taken from the Ecoinvent database) and the 2050 European electricity mix based on BAU, REAL and OPT future scenarios. The chosen functional unit is 1 kWh of electricity produced, and the calculation is performed with the EF method/single score. μPt, micropoint.
Conclusions
We have presented 2D material-enabled perovskite panels (GRAPE) and their assembly and integration in a solar farm installed in Crete. The GRAPE solar farm reached a peak power exceeding 250 W working in outdoor conditions. Notably, we have revealed that the VOC temperature coefficient of the GRAPE panels is half of the one of c-Si panels, simultaneously also exhibiting a larger positive ISC temperature coefficient. This feature is extremely promising for outdoor operation at elevated temperatures, such as in high-irradiance global locations. The GRAPE panels, despite low technological maturity, have shown promising stability. In fact, they achieved a remarkable T80 of 5,832 h and T75 of 6,552 h, respectively, before the failure of the module lamination. The stability demonstrated by the GRAPE panels represents the state of the art, considering literature reports on laboratory-scale PSCs. At the same time, our results indicate that additional efforts are required to improve encapsulant materials and lamination protocol to extend further the panels’ lifetime. A systematic life-cycle impact assessment based on primary data shows the impact of the module manufacturing process. We found that the solar farm shows an environmental profile that might compete with those calculated for the 2050 Europe electricity mixes, even in the case of the optimistic improvement future scenario. Furthermore, the environmental footprints of the solar farm calculated for several geographical locations turn out to be lower than the current European electricity mix and are already competitive with the business-as-usual and realistic improvement future scenarios.
The collected data of the GRAPE solar farm will permit the assessment of the stability of the perovskite technology in real conditions, reaching a higher technology and material-readiness level and laying the groundwork for commercialization targets.
Methods
2D materials preparation and characterization
The WJM method provides a single-layer graphene/few-layer graphene production rate of ~0.4 g min−1 (on a single WJM apparatus) and an exfoliation yield (defined as the weight ratio of the final graphitic flakes over the one of the initial graphite) of ~100% (ref. 20). The ink of graphene flakes in ethanol (EtOH) (≥99.8 %, Sigma Aldrich) was prepared through the WJM method20, followed by solvent exchange from N-Methyl-2-pyrrolidone (NMP) to EtOH51. A four-pass WJM protocol was used20. Experimentally, a mixture including 20 l of NMP (>97%, Sigma Aldrich) and 200 g of graphite flakes (+100 mesh, Sigma Aldrich) was prepared in a container and mixed by a mechanical stirrer (Eurostar digital Ika-Werke). Subsequently, the mixture was pressurized by a hydraulic piston into a processor consisting of five sets of different perforated and interconnected discs by applying pressure in the range of 140 MPa to 250 MPa. During this step, two jet streams originate at the second disk, which is made of two holes with a diameter of 1 mm in diameter. Subsequently, the jet streams collide in a nozzle with a diameter of 0.3 mm between the second and the third discs. During the passage of the sample through the nozzle, the turbulence of the solvent originates the shear force that exfoliates the graphite52. The as-produced dispersion was cooled down by a chiller and then collected in another container. The sample was re-processed three times by three consecutive WJM machines with nozzles of 0.2 mm, 0.15 mm and 0.1 mm diameters, respectively. The as-produced graphene dispersion was subsequently ultracentrifuged at 16,000 g for 30 min at 15 °C using a Beckman Coulter Optima XE‐90 centrifuge with an SW32Ti rotor. Thus, the un‐exfoliated graphite was removed through sedimentation-based separation53. More in detail, 80% of the supernatant was collected by pipetting after the ultracentrifugation process. The pipetted sample was dried using a rotary evaporator (Heidolph, Hei-Vap Value) at 70 °C and 5 mbar. Subsequently, 500 ml of EtOH was added to the dried sample. The sample was then dispersed using a sonic bath for 10 min. Afterwards, the sample was centrifuged at 800 g using a Beckman Coulter Optima XE‐90 centrifuge with an SW32Ti rotor. The sediments were collected, discarding the supernatant. This process of decantation was repeated twice to wash out the NMP residuals. Finally, the sediments were dispersed in 200 ml of EtOH, obtaining a concentration of graphene flakes of 0.9 mg ml−1.
Single-layer/few-layer fMoS2 flakes were produced through ultrasonication-assisted liquid-phase exfoliation of pulverized MoS2 crystals, followed by their chemical functionalization with thiol of 3-mercaptopropionic acid (MPA) moieties8. Nevertheless, we can anticipate that the production of fMoS2 flakes has been now already upscaled by means of WJM methods, providing a further advancement of the results presented in this work. The ink of molybdenum disulfide (MoS2) flakes in isopropanol (IPA) (≥99.5%, Sigma Aldrich) was produced by ultrasonication-assisted liquid-phase exfoliation of a MoS2 crystal (HQGraphene) in IPA followed by sedimentation-based separation21,53,54. Experimentally, 30 mg of MoS2 bulk crystal was added to 50 ml of IPA and then ultrasonicated in a sonic bath (Branson 5800 cleaner, Branson Ultrasonics) for 8 h. To collect the MoS2 flakes, the resulting dispersion was ultracentrifuged at 2,700 g for 15 min in a Beckman Coulter Optima XE‐90 centrifuge with an SW32Ti rotor. Thus, the un-exfoliated MoS2 crystals were separated as sediment, while the MoS2 flakes were collected from the supernatant. Lastly, the solvent was evaporated until reaching a concentration of MoS2 flakes of 0.2 mg ml−1.
The ink of fMoS2 flakes in IPA was produced by chemical functionalization of MoS2 flakes with MPA (≥99%, Sigma Aldrich)8. Briefly, the functionalization was carried out by heating the MoS2 flakes dispersion in IPA at 60 °C for 1 h in the presence of MPA under vigorous magnetic stirring. A ratio of 20 µl of MPA per 1 ml of MoS2 dispersion (0.5 g l−1) was used8. After 1 h, the material was recovered by ultracentrifugation for 30 min at 175,600 g using a Beckman Coulter Optim XE‐90 centrifuge with an SW32Ti rotor. Subsequently, the material was washed twice using IPA (0.5 IPA:1 fMoS2 ink vol/vol). The redispersion was combined with ultrasonication in a sonic bath for 5 min with ultracentrifugation at 175,600 g for 30 min. Lastly, the fMoS2 flakes were redispersed in IPA by ultrasonication for 30 min. The volume of IPA was adjusted to obtain the final ink at a concentration of 0.2 mg ml−1.
The exfoliated material characterization methods and analyses are reported in the Supplementary Information (Supplementary Methods 2–16 and Supplementary Figs. 32–40).
Module materials, realization and characterization
Mesoporous transparent titania paste (30 NR-D), formamidinium iodide (FAI) and methylammonium bromide (MABr) were purchased from GreatCell Solar. Lead(II) iodide (PbI2), lead(II) bromide (PbBr2) were purchased from TCI and caesium iodide (CsI) from GmbH. Medium molecular weight (20–75 kDa) poly(triaryl amine) (PTAA) was purchased from Solaris Chem. All other materials, including titanium(IV) isopropoxide (TTIP), diisopropoxytitanium bis(acetylacetonate) (Ti(AcAc)2), acetylacetone (AcAc), lithium bis(trifluoromethanesulfonyl)imide (LiTFSI), EtOH, 2-propanol (IPA), acetone, dimethylformamide (DMF), dimethyl sulfoxide (DMSO), acetonitrile (ACN), tert-butylpyridine (tBP) and chlorobenzene (CB), were purchased from Sigma Aldrich. All the materials were used as received, unless specified otherwise.
The large-area coating of the functional layers of PSMs is very challenging, and intense research is ongoing to develop processes that minimize the performance losses related to the upscaling. Deposition uniformity, post processing (solvent, gas, vacuum or other quenching techniques), P1–P2–P3 laser processes on large areas represent just some of the criticalities that need to be considered during PSM upscaling. For this reason, to develop a large number of modules, we opted for a solution inspired by the silicon technology, namely a panel made connecting submodules. These submodules were fabricated on a substrate area (11 × 11 cm2), which guaranteed an optimal trade-off between PCE and reproducibility.
The first step of module fabrication consists of the patterning of the FTO-covered glass substrates (Pilkington, 8 Ω/□ (110 × 110 mm2)) by a raster scanning laser (Nd: YVO4 pulsed at 80 kHz average fluency 700 mJ/cm2, λ = 350 nm) to isolate adjacent cells (P1 process) composing the final module. After the patterning process, each substrate was cleaned by ultrasonic bath using detergent with de-ionized water, acetone and isopropanol (10 min for each step). A screen-printed metal mask was applied over the FTO glass substrate to prevent compact TiO2 (cTiO2) deposition over the cell interconnection and contact area. The graphene-doped compact TiO2 (cTiO2 + G) blocking layer (40 nm) was deposited by spray pyrolysis at 460 °C a solution consisting of 0.16 M Ti(AcAc)2 and 0.4 M AcAc in EtOH doped with graphene ink (1 vol%). Subsequently, the compact layers were annealed for 30 min at 460 °C. The metal mask was subsequently removed from the samples using a HCl in de-ionized water solution. The same graphene ink (1 vol%) was used to dope the solution of mesoporous TiO2 (mTiO2) paste (30 NR-D, GreatCell SolarDyesol) in EtOH (1:5 wt/wt). The resulting graphene-doped mTiO2 (mTiO2 + G) solution was deposited on the substrate by spin coating at 3,000 r.p.m. for 20 s and subsequently annealed in air for 30 min at 480 °C to obtain a 120 nm-thick scaffold layer. The perovskite layer was deposited in a N2-filled glove box after cooling down the samples to room temperature. The perovskite solution was obtained by mixing FAI (1 M), PbI2 (1.1 M), MABr (0.2 M), PbBr2 (0.2 M) and CsI (1.5 mM) in a mixture of anhydrous DMF/DMSO (4:1 vol/vol). After 30 min of stirring at room temperature, the perovskite was spin coated onto the samples, using an anti-solvent method. In particular, a two-step programme at 1,000 r.p.m. for 10 s and 5,000 r.p.m. for 30 s was used to deposit the perovskite precursor solution. During the second step, 1 ml of CB was poured on the spinning substrate 7 s before the end of the programme. Immediately after spin coating, the substrates were annealed at 100 °C for 1 h to form a perovskite crystal structure resulting in a compact perovskite layer with a thickness of 450 nm. The fMoS2 interlayer was deposited by thermal-assisted spray coating by keeping the perovskite substrate at 80 °C during the deposition process. Subsequently, the photoelectrode was covered by a PTAA (10 mg ml−1) solution in toluene, doped with tBP 7 µl ml−1 and LiTFSI (170 mg ml−1 in ACN) 10 µl ml−1 and spin coated at 1,600 r.p.m. for 25 s. At this stage, a second laser process (P2) was carried out to clean the FTO interconnection areas by setting the laser fluence at 248.8 mJ cm−2 and a raster scanning distance at 2 µm for a total P2 area of 400 µm approximately, to ensure high quality and reproducibility over hundreds of devices. The modulesʼ aperture ratio is 82%, as achieved by a cell width of 9 mm and a dead area of 2 mm. Finally, a high vacuum chamber (10−6 mbar) was used to thermally evaporate the 150 nm Au back electrode. Lastly, adjacent cell isolation from the CE side was achieved by a third laser ablation (P3 process) with a fluence of 306 mJ cm−2 and a raster scanning distance of 3 µm for a total ablated width of 120 µm.
Current–voltage (I–V) characteristics of unmasked and encapsulated modules were acquired in air by using a solar simulator (ABET Sun 2000, class A) calibrated at AM1.5 and 100 mW cm−2 illumination with a certified reference Si cell (RERA Solutions RR-1002). Incident power was measured with a Skye SKS 1110 sensor. The class of the solar simulator was measured with a BLACK-Comet UV–vis spectrometer. Both reverse and forward I–V scans were performed using a scan rate of 200 mV s−1 for the unmasked large-area modules.
Panel lamination
The GRAPE panels were laminated in an industrial laminator for c-Si solar panels (Supplementary Fig. 3c). A thorough screening of commercial and research lamination materials was preliminarily performed to assess their compatibility with the PSM lamination process. A cross-linkable EVA was chosen as the encapsulant material because of its low lamination temperature of 85 °C (1 h at a maximum pressure of 1 atm). The latter permitted the optimum lamination of all the PSMs, while avoiding temperature-sensitive materials degradation. Moreover, the presence of a primary Kapton encapsulation in the PSM (Supplementary Information section ‘Panel assembly and lamination’ provides further details) reduced the impact of the acetic acid that is released by the EVA during the panel’s operation28. Perovskite modules were laminated between a front glass and a back sheet, consisting of a structure of polypropylene (PP)-aluminium-polyethylene terephthalate (PET)-PP foil.
More in detail, panel laminations were performed using: a commercial PV laminator (Core2 Model from Rise technology) equipped with a cooling system to guarantee a high reproducibility on the lamination procedure and to reduce the exposure time of the PSC functional materials to potentially critical temperatures; a back sheet (Icosolar CPO 3 G alu) made of an aluminium foil, minimizing the panel weight while providing a hermetic barrier to O2 and water vapour from the backside; an edge sealer (HelioSeal PVS 101) in the butyl-based tape version to facilitate the application. This component was laminated together with primary sealer to reduce sideways water vapour permeation; a cross-linkable EVA with a lamination temperature of 85 °C (38-CTU-AL ultra-clear from Xinology) as the main sealing material to encapsulate the PSC modules, protecting the latter from oxygen contamination while allowing for a low-temperature lamination approach.
We developed the following multi-step lamination procedure: (1) the panel is put in a moderate vacuum condition (1 mbar), (2) the temperature is progressively increased by 10 °C min–1 until 60 °C and held for 30 min, (3) the temperature is further increased with a rate of 10 °C min–1 until 85 °C, (4) the pressure is increased with a rate of 150 mbar min–1 until 1,000 mbar and then held for 60 min and (5) a forced cooling step is then performed with a rate of –7 °C min–1 until 55 °C.
Looking at the final module and panel performance (Fig. 1), the upscaling from modules to panels results in a PCE reduction of almost 30%. Although a reduction of PCE is often observed during the upscaling of any PV technologies55, possible strategies to mitigate the performance drop of our technology are: (1) reducing the temperature stress during the lamination process by adopting advanced encapsulant materials recently proposed for PSCs,56 (2) increasing the light transmittance by increasing the optical transparency of the lamination glass over the perovskite absorption range and (3) minimizing the electrical performance mismatch between the PSMs composing a GRAPE panel. Nevertheless, we point out the PV performances achieved for our GRAPE panels, to the best of our knowledge, represent the current state of the art at such scale.
Panel testing
The ESTER lab, in which the GRAPE panels were initially tested, consists of three separate units (Supplementary Fig. 5): solar-weather, spectral and PV test. The solar-weather unit provides measurements of the three separate components of solar irradiance (direct, diffuse, reflected), the global horizontal solar irradiance and the standard weather parameters (for example, temperature, humidity and wind speed). The spectral unit measures the solar spectral irradiance in the spectral range 350–1,700 nm. The PV unit consists of four stands that can hold approximately 15 PV panels of medium size. The stand n. 1 is a south-oriented frame with variable tilt angles. The stand n. 2 is a sun tracker. The stand n. 3 can mount flexible PV panels on curved surfaces, while stand n. 4 can be tilted and oriented in various directions providing a high experimental versatility in the PV modules test configuration. The stands are equipped with irradiance sensors (pyranometers and reference cells of various technologies). Each PV module is continuously connected to a MPP tracker (MPPT) developed and provided by ISAAC-SUPSI, Lugano, CH. The energy produced by operating panels is dissipated via a resistive load. The data are collected by a Campbell Scientific CR1000 data logger via RS485. Moreover, every 10 min, I–V curves of each module are traced and stored in the database together with the 1 min rate MPP data. Short-, medium- and long-term monitoring activities of GRAPE panels57 were carried out at the facility. Each GRAPE panel was mounted on the sun tracker (stand n. 2) and connected to a dedicated MPPT as shown in Supplementary Fig. 6. Short-term tests (one-day exposure) were carried out for each panel by recording I–V curves.
Solar farm realization
The GRAPE panels were installed on specific aluminium PV mounting structures following a landscape mode (two series in a row) in a restricted-access area of the HMU campus. This array configuration was suggested by electrical simulations of the solar farm, aiming to avoid shading effects in the early morning and in the late afternoon. The installed mounting structures can be adjusted, allowing any difference of the ground height/slope to be compensated. The PV panels were electrically interconnected in a parallel string configuration consisting of nine in-parallel PV panels with a total surface area of 4.5 m2. Notably, some of the panels were fabricated six months before launching the solar farm with a total of nine panels because of the three-month lockdown related to the COVID-19 pandemic.
The optimization of the MPP estimation was performed based on the development of a suitable MPP tracker driven by a specific algorithm. The produced energy of the solar farm was extracted using commercial charging regulators (BlueSolar MPPT 100/30, Victron Energy) and an inverter (Phoenix Inverter Smart 1600VA, Victron Energy). Thus, the energy was stored in batteries (four 6 V, 260 Ah commercial sunlight batteries connected in series) (Supplementary Fig. 7c). The used inverters have conversion efficiency d.c. to a.c. of 98%, and the produced a.c. energy supplies some of the electrical loads of the HMU lab.
The performance of the solar farm was recorded via data loggers to gain information on power generation, storage and distribution points and overall PCE of the PV system. The data from the weather station were directly correlated with the power flow of the inverters.
Reporting summary
Further information on research design is available in the Nature Research Reporting Summary linked to this article.
Data availability
Data generated or analysed during this study are included in the published article and its Supplementary Information and Source Data files. All experimental data collected outdoors in the solar farm have been gathered in an open data repository at HMU and are available at https://solarfarmhmu.gr/. The website includes the weather data of the installation area and the electrical characteristics of GRAPE panels. The online monitoring system of the solar farm presented on the website was built using an in-house developed IV-MPP tracker and commercial IV tracers. Source data are provided with this paper.
References
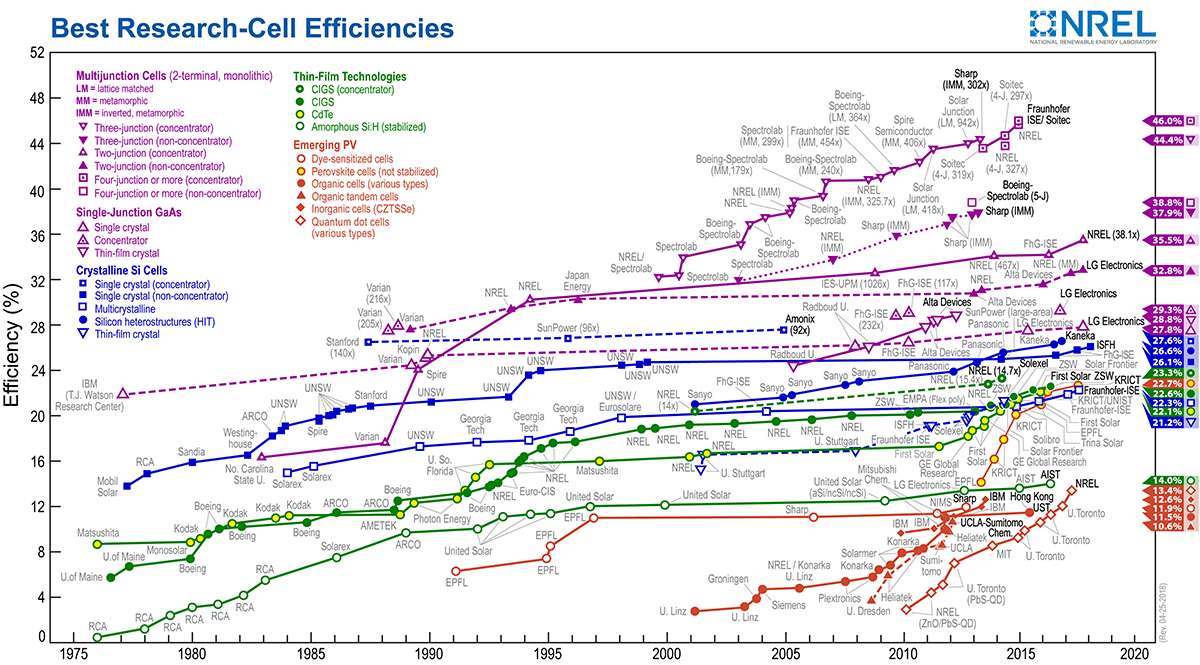
Best research-cell efficiencies. NREL https://www.nrel.gov/pv/assets/images/efficiency-chart.png (2022).
Zafoschnig, L. A., Nold, S. & Goldschmidt, J. C. The race for lowest costs of electricity production: techno-economic analysis of silicon, perovskite and tandem solar cells. IEEE J. Photovolt. 10, 1632–1641 (2020).
Tian, X., Stranks, S. D. & You, F. Life cycle energy use and environmental implications of high-performance perovskite tandem solar cells. Sci. Adv. 6, eabb0055 (2020).
Li, Z. et al. Cost analysis of perovskite tandem photovoltaics. Joule 2, 1559–1572 (2018).
Champion photovoltaic module efficiency chart. NREL https://www.nrel.gov/pv/module-efficiency.html (2022).
Park, N. G. & Zhu, K. Scalable fabrication and coating methods for perovskite solar cells and solar modules. Nat. Rev. Mater. 5, 333–350 (2020).
Petridis, C., Kakavelakis, G. & Kymakis, E. Renaissance of graphene-related materials in photovoltaics due to the emergence of metal halide perovskite solar cells. Energy Environ. Sci. 11, 1030–1061 (2018).
Agresti, A. et al. Two-dimensional (2D) material interface engineering for efficient perovskite large-area modules. ACS Energy Lett. 4, 1862–1871 (2019).
Taheri, B. et al. Graphene-engineered automated sprayed mesoscopic structure for perovskite device scaling-up. 2D Mater. 5, 045034 (2018).
Razza, S., Pescetelli, S., Agresti, A. & Di Carlo, A. Laser processing optimization for large-area perovskite solar modules. Energies 14, 1069 (2021).
Pescetelli, S. et al. Synergic use of two-dimensional materials to tailor interfaces in large area perovskite modules. Nano Energy 95, 107019 (2022).
Agresti, A. et al. Graphene-perovkite solar cells exceed 18% efficiency: a stability study. ChemSusChem 9, 2609–2619 (2016).
Biccari, F. et al. Graphene-based electron transport layers in perovskite solar cells: a step-up for an efficient carrier collection. Adv. Energy Mater. 7, 1701349 (2017).
Agresti, A. et al. Titanium-carbide MXenes for work function and interface engineering in perovskite solar cells. Nat. Mater. 18, 1228–1234 (2019).
Arora, N. et al. Perovskite solar cells with CuSCN hole extraction layers yield stabilized efficiencies greater than 20%. Science 358, 768–771 (2017).
Busby, Y. et al. Aging effects in interface-engineered perovskite solar cells with 2D nanomaterials: a depth profile analysis. Mater. Today Energy 9, 1–10 (2018).
Jung, E. H. et al. Efficient, stable and scalable perovskite solar cells using poly(3-hexylthiophene). Nature 567, 511–515 (2019).
Thrithamarassery Gangadharan, D. & Ma, D. Searching for stability at lower dimensions: current trends and future prospects of layered perovskite solar cells. Energy Environ. Sci. 12, 2860–2889 (2019).
Agresti, A. et al. Graphene interface engineering for perovskite solar modules: 12.6% power conversion efficiency over 50 cm2 active area. ACS Energy Lett. 2, 279–287 (2017).
Del Rio Castillo, A. E. et al. High-yield production of 2D crystals by wet-jet milling. Mater. Horiz. 5, 890–904 (2018).
Najafi, L. et al. MoS2 quantum dot/graphene hybrids for advanced interface engineering of a CH3NH3PbI3 perovskite solar cell with an efficiency of over 20%. ACS Nano 12, 10736–10754 (2018).
O’Keeffe, P. et al. Graphene-induced improvements of perovskite solar cell stability: effects on hot carriers. Nano Lett. 19, 684–691 (2019).
Agresti, A. et al. Graphene and related 2D materials for high efficient and stable perovskite solar cells. In 2017 IEEE 17th International Conference on Nanotechnology, NANO 2017 145–150 (IEEE, 2017).
Agresti, A. et al. Titanium-carbide MXenes for work function and interface engineering in perovskite solar cells. Nat. Mater. 18, 1228–1234 (2019).
Khenkin, M. V. et al. Consensus statement for stability assessment and reporting for perovskite photovoltaics based on ISOS procedures. Nat. Energy 5, 35–49 (2020).
Palma, A. L. et al. Laser-patterning engineering for perovskite solar modules with 95% aperture ratio. IEEE J. Photovolt. 7, 1674–1680 (2017).
Corsini, F. & Griffini, G. Recent progress in encapsulation strategies to enhance the stability of organometal halide perovskite solar cells. JPhys Energy 2, 031002 (2020).
Kempe, M. D. et al. Acetic acid production and glass transition concerns with ethylene-vinyl acetate used in photovoltaic devices. Sol. Energy Mater. Sol. Cells 91, 315–329 (2007).
Spena, A., Cornaro, C., Intreccialagli, G. & Chianese, D. Data validation and uncertainty evaluation of the ESTER outdoor facility for testing of photovoltaic modules. In 24th European Photovoltaic Solar Energy Conference and Exhibition 3586–3589 (EU PVSEC, 2009).
Gouda, L. et al. Open circuit potential build-up in perovskite solar cells from dark conditions to 1 sun. J. Phys. Chem. Lett. 6, 4640–4645 (2015).
Stoichkov, V. et al. Outdoor performance monitoring of perovskite solar cell mini-modules: diurnal performance, observance of reversible degradation and variation with climatic performance. Sol. Energy 170, 549–556 (2018).
Dupré, O., Vaillon, R. & Green, M. A. Physics of the temperature coefficients of solar cells. Sol. Energy Mater. Sol. Cells 140, 92–100 (2015).
Gulkowski, S., Zdyb, A. & Dragan, P. Experimental efficiency analysis of a photovoltaic system with different module technologies under temperate climate conditions. Appl. Sci. 9, 141 (2019).
Makrides, G., Zinsser, B., Phinikarides, A., Schubert, M. & Georghiou, G. E. Temperature and thermal annealing effects on different photovoltaic technologies. Renew. Energy 43, 407–417 (2012).
Jošt, M. Perovskite solar cells go outdoors: field testing and temperature effects on energy yield. Adv. Energy Mater. 10, 2000454 (2020).
Fu, F. et al. High-efficiency inverted semi-transparent planar perovskite solar cells in substrate configuration. Nat. Energy 2, 16190 (2017).
Wang, D., Wright, M., Elumalai, N. K. & Uddin, A. Stability of perovskite solar cells. Sol. Energy Mater. Sol. Cells 147, 255–275 (2016).
Ruf, F. et al. Temperature-dependent studies of exciton binding energy and phase-transition suppression in (Cs,FA,MA)Pb(I,Br)3 perovskites. APL Mater. 7, 031113 (2019).
Kymakis, E., Kalykakis, S. & Papazoglou, T. M. Performance analysis of a grid connected photovoltaic park on the island of Crete. Energy Convers. Manag. 50, 433–438 (2009).
Reynaa, Y. et al. Performance and stability of mixed FAPbI3(0.85)MAPbBr3(0.15) halide perovskite solar cells under outdoor conditions and the effect of low light irradiation. Nano Energy 30, 570–579 (2016).
Stoichkov, V. et al. Outdoor performance monitoring of perovskite solar cell mini-modules: diurnal performance, observance of reversible degradation and variation with climatic performance. Sol. Energy 170, 549–556 (2018).
Bowring, A. R., Bertoluzzi, L., O'Regan, B. C. & McGehee, M. D. Reverse bias behavior of halide perovskite solar cells. Adv. Energy Mater. 8, 1702365 (2018).
Song, W. & Aernouts, T. Novel test scenarios needed to validate outdoor stability of perovskite solar cells. J. Phys. Energy 2, 021003 (2020).
Environmental Management—Life Cycle Assessment—Principles and guidelines. ISO 14040:2006 (2006).
Environmental Management—Life Cycle Assessment—Requirements and guidelines. ISO 14044:2006 (2006).
Maranghi, S., Parisi, M. L., Basosi, R. & Sinicropi, A. Environmental profile of the manufacturing process of perovskite photovoltaics: harmonization of life cycle assessment studies. Energies 12, 3746 (2019).
Fazio, S. et al. Supporting Information to the Characterisation Factors of Recommended EF Life Cycle Impact Assessment Methods: New Methods and Differences with ILCD (Publications Office of the European Union, 2018).
Leccisi, E. & Fthenakis, V. Life cycle energy demand and carbon emissions of scalable single-junction and tandem perovskite PV. Prog. Photovolt. Res. Appl. 29, 1078–1092 (2021).
Mariani, P. et al. Low-temperature graphene-based paste for large-area carbon perovskite solar cells. ACS Appl. Mater. Interfaces 13, 22368–22380 (2021).
Wang, J. T. et al. Low-temperature processed electron collection layers of graphene/TiO2 nanocomposites in thin film perovskite solar cells. Nano Lett. 14, 724–730 (2014).
Lamanna, E. et al. Mechanically stacked, two-terminal graphene-based perovskite/silicon tandem solar cell with efficiency over 26%. Joule 4, 865–881 (2020).
Del Rio Castillo, A. E., Ansaldo, A., Pellegrini, V. & Bonaccorso, V. Exfoliation of layered materials by wet-jet milling techniques. World patent 2017089987A1 (2017).
Backes, C. et al. Production and processing of graphene and related materials. 2D Mater. 7, 0222001 (2020).
Najafi, L. et al. Solution-processed hybrid graphene flake/2H–MoS2 quantum dot heterostructures for efficient electrochemical hydrogen evolution. Chem. Mater. 29, 5782–5786 (2017).
Rakocevic, L. et al. Loss analysis in perovskite photovoltaic modules. Sol. RRL 3, 1900338 (2019).
Shi, L. et al. Gas chromatography–mass spectrometry analyses of encapsulated stable perovskite solar cells. Science 368, 6497 (2020).
Cornaro, C., Renzi, L., Pierro, M., Di Carlo, A. & Guglielmotti, A. Thermal and electrical characterization of a semi-transparent dye-sensitized photovoltaic module under real operating conditions. Energies 11, 155 (2018).
Acknowledgements
The work has been supported by European Union’s Horizon 2020 research and innovation programme under grant agreement numbers 785219—GrapheneCore2 (A.D.C., E.K., L.S. and F.B.) and 881603—GrapheneCore3 (A.D.C., E.K., L.S. and F.B.).
Author information
Authors and Affiliations
Contributions
A.D.C., E.K. and F.B. conceived the work. S.P. and A.A. designed, realized and optimized 2D material-based perovskite solar cells and modules by performing the electrical characterizations. S.P. and A.A., developed the module encapsulation procedure. S.R. performed laser scribe ablation for module realization. G.V., K.R., I.K. and E.S. designed and built the solar farm infrastructure and performed in situ electrical panel characterizations. E.L. and L.S. laminated the GRAPE panels. M. Pierro and C.C. performed panel measurements on the ESTER station. S.B., L.N., B.M.-G., A.E.D.R.C., R.O.-N. and M. Prato produced and characterized 2D materials. P.M., S.M., M.L.P., A.S. and R.B. performed LCA. A.D.C., E.K. and F.B. supervised the work. All authors contributed to the discussion of the results and to the writing of the manuscript.
Corresponding authors
Ethics declarations
Competing interests
F.B. is a co-founder and CSO, and S.B. is a senior scientist at BeDimensional S.p.A., a company that is commercializing 2D materials. L.S. and E.L. are employees of Greatcell Solar Italia, part of the Greatcell Energy Group focused on the commercialization of Perovskite solar technology.
Peer review
Peer review information
Nature Energy thanks Ilke Celik, Nam-Gyu Park, Trystan Watson and the other, anonymous, reviewer(s) for their contribution to the peer review of this work.
Additional information
Publisher’s note Springer Nature remains neutral with regard to jurisdictional claims in published maps and institutional affiliations.
Supplementary information
Supplementary Information
Supplementary Figs. 1–40, Discussion, Tables 1–15, Methods and References 1–49.
Supplementary Data 1
a, Statistical analysis of weather variables (temperature) from June 2020 until June 2021 at the installation field (0.5 m2 for each panel). b, Statistical analysis of weather variables (relative humidity) from June 2020 until June 2021 at the installation field (0.5 m2 for each panel). c, Statistical analysis of weather variables (panel temperature) from June 2020 until June 2021 at the installation field (0.5 m2 for each panel). d, Statistical analysis of weather variables (wind speed) from June 2020 until June 2021 at the installation field (0.5 m2 for each panel).
Source data
Source Data Fig. 1
Statistical distribution of the PCE data recorded for the PSMs.
Rights and permissions
About this article

Cite this article
Pescetelli, S., Agresti, A., Viskadouros, G. et al. Integration of two-dimensional materials-based perovskite solar panels into a stand-alone solar farm. Nat Energy 7, 597–607 (2022). https://doi.org/10.1038/s41560-022-01035-4
Received:
Accepted:
Published:
Issue Date:
DOI: https://doi.org/10.1038/s41560-022-01035-4
This article is cited by
-
Infrared-reflective ultrathin-metal-film-based transparent electrode with ultralow optical loss for high efficiency in solar cells
Scientific Reports (2024)
-
Hybrid chips to enable a sustainable internet of things technology: opportunities and challenges
Discover Materials (2024)
-
Long-term operating stability in perovskite photovoltaics
Nature Reviews Materials (2023)
-
Stabilization of photoactive phases for perovskite photovoltaics
Nature Reviews Chemistry (2023)
-
Challenges and opportunities for the mechanical reliability of metal halide perovskites and photovoltaics
Nature Energy (2023)
