the Creative Commons Attribution 4.0 License.
the Creative Commons Attribution 4.0 License.
 | 24 Nov 2022
Evidence of localised Amazon rainforest dieback in CMIP6 models
Paul D. L. Ritchie
Peter M. Cox
Amazon forest dieback is seen as a potential tipping point under climate change. These concerns are partly based on an early coupled climate–carbon cycle simulation that produced unusually strong drying and warming in Amazonia. In contrast, the fifth-generation Earth system models (Phase 5 of the Coupled Model Intercomparison Project, CMIP5) produced few examples of Amazon dieback under climate change. Here we examine results from seven sixth-generation models (Phase 6 of the Coupled Model Intercomparison Project, CMIP6), which include interactive vegetation carbon and in some cases interactive forest fires. Although these models typically project increases in area-mean forest carbon across Amazonia under CO2-induced climate change, five of the seven models also produce abrupt reductions in vegetation carbon, which indicate localised dieback events. The northern South America (NSA) region, which contains most of the rainforest, is especially vulnerable in the models. These dieback events, some of which are mediated by fire, are preceded by an increase in the amplitude of the seasonal cycle in near-surface temperature, which is consistent with more extreme dry seasons. Based on the ensemble mean of the detected dieback events we estimate that 7±5 % of the NSA region will experience abrupt downward shifts in vegetation carbon for every degree of global warming past 1.5 ∘C.
- Article
(1930 KB) - Full-text XML
-
Supplement
(1390 KB) - BibTeX
- EndNote


A “tipping point” commonly refers to small changes to input levels causing a system to abruptly transition to some alternative (often less desirable) stable state (Lenton et al., 2008). Future tipping points pose a risk to both natural ecosystems and, by extension, human activities, as they produce abrupt system-wide changes that are often difficult or even impossible to reverse (Lenton et al., 2013). The Amazon rainforest is one example in the climate system that is at risk of experiencing a tipping event, with the possibility of abrupt forest dieback in response to rising global temperatures (Cox et al., 2004). Amazon dieback has the potential to accelerate global warming through reducing the Amazon's ability to act as a carbon sink and releasing carbon dioxide that would lead to additional global warming (Cox et al., 2000). Tipping points may play an important role in the future of our changing climate (Jørgensen et al., 2014; Lenton et al., 2013), with previous analysis of CMIP5 (Phase 5 of the Coupled Model Intercomparison Project) models suggesting that multiple regional abrupt transitions could occur for global warming levels less than 2 ∘C (Drijfhout et al., 2015).
There are several factors which could contribute to a decline in vegetation in the Amazon, including a lengthened dry season, increased fire frequency, and reduced precipitation (Malhi et al., 2009). The number of extreme hot and dry days in the Amazon is predicted to increase with global warming (Vogel et al., 2020), and the length and intensity of the dry season are expected to intensify (Malhi et al., 2009). Further drying in the Amazon is anticipated from the slowdown of the Atlantic Meridional Overturning Circulation due to ice melt causing an influx of fresh water into the North Atlantic (Lenton et al., 2019). Moisture stress resulting from severe droughts in the Amazon is likely to result in a degree of tree mortality (Phillips et al., 2009). As the rainforest dries it becomes more vulnerable to fire, which, coupled with the increased frequency of fires seen in the Amazon over recent years, could lead the rainforest to pass a tipping point and result in vegetation dieback (Malhi et al., 2009; Aragão et al., 2018). Anthropogenic deforestation also contributes to this by reducing dry season rainfall and decreasing the resilience of the forest to climate change, potentially leading to permanent forest loss in some regions of the Amazon (Zemp et al., 2017). Mechanisms which result in the drying of the Amazon rainforest can therefore be considered to be the main cause of vegetation dieback.
Dieback tipping events are primarily thought of as bifurcation-type tipping points (Ritchie et al., 2021), which occur when external climatic factors reduce the resilience of a state (e.g. forest) and ultimately cause the system to tip into a new contrasting state (e.g. savannah) (Scheffer et al., 2009). For some bifurcation-type tipping points there are generic features of a system that can be detected to indicate the approach of a tipping point (Scheffer et al., 2009; Dakos et al., 2008). The most common example is “critical slowing down”, where a system becomes increasingly slow at recovering from small perturbations as negative feedbacks become overwhelmed by positive ones. Critical slowing down can be observed by increases to the autocorrelation and variance in a state variable (Scheffer et al., 2009; Dakos et al., 2008). A recent study which looked at such signals in satellite-retrieved vegetation greenness reports evidence of reducing resilience of the Amazon rainforest since 2005 (Boulton et al., 2022).
However, previous research into projections of Amazonian vegetation dieback has also suggested that generic early-warning signals (EWSs) such as these fail in the Amazon but that more system-specific indicators may be found (Boulton et al., 2013). For example, the interannual variability in the atmospheric CO2 concentration, as a function of tropical temperature variability, has been shown to be connected to the sensitivity of tropical carbon to climate change (Cox et al., 2013; Wenzel et al., 2014). This metric shows trends which are also consistent with reducing resilience of tropical forests (Wang et al., 2014; Luo and Keenan, 2022).
Recent studies (Boulton et al., 2022; Luo and Keenan, 2022) focus on fairly short observational records of less than 60 years. One recent study, using CMIP5 models, determined that Amazon dieback, under the high-emissions scenario RCP8.5, is not likely to occur in the 21st century but recognises that an increase in anthropogenic deforestation could bring the Amazon closer to a dieback event (Chai et al., 2021). Meanwhile, other studies predict the Amazon rainforest to have a low resilience to climate change, coinciding with human pressures such as deforestation (Hirota et al., 2011). There is remaining uncertainty associated with the likelihood of a dieback event occurring, stemming largely from uncertainty in the effects of important factors such as the extent of CO2 fertilisation and soil nutrient limitations (Rammig et al., 2010; Hirota et al., 2021). In this paper we look at the projections from the latest CMIP6 Earth system models for evidence of Amazon dieback and identify an indicator which is based on longer-term temperature records.
2.1 CMIP6 models, experiment runs, and data used
Climate models that incorporate interactive vegetation carbon from Phase 6 of the Coupled Model Intercomparison Project (CMIP6) were utilised in this study (Meehl et al., 2014). See Table 1 for the corresponding seven CMIP6 climate models. For the purpose of this study we focus on the climatic drivers alone impacting vegetation and therefore make use of the 1pctCO2 runs, where CO2 is increased by 1 % per year (Eyring et al., 2016). Data from the unforced PIControl runs (a control run with a fixed pre-industrial CO2 concentration) were also used to determine each model's internal variability. Primarily, we use model output data of the vegetation carbon and surface temperature for the seven climate models in the northern South America (NSA) region. The amplitude of the temperature seasonal cycle in this study is defined as the difference between the maximum and minimum monthly mean for each year. All anomalies presented correspond to the yearly mean relative to the mean of the first 10 years, aside from temperature anomalies, which correspond to the 10-year running mean relative to the mean of the first 10 years.
Table 1CMIP6 models used within this study (Nijsse et al., 2020; Döscher et al., 2022; Arora et al., 2020; Tokarska et al., 2020; Wang et al., 2021).

2.2 Abrupt-shift-detection algorithm
The algorithm used to detect abrupt shifts is relatively simple by design. Three criteria must be fulfilled for a grid point to be identified as containing an abrupt shift in the vegetation carbon. Namely, the vegetation carbon must change by at least 2 kg C m−2 over a 15-year period and that this must contribute to at least 25 % of the overall change in vegetation carbon. Finally, to remove detected abrupt shifts that might be due to a model's high internal variability, the mean annual rate of change in the abrupt shift must be at least 3 times larger than the variability in the rates of change in the unforced control run. The left column of Fig. S2 provides an example of a grid point that correctly gets rejected based on this final criterion that would otherwise be classified as an abrupt shift, whereas the right column shows an example of a clear abrupt shift that successfully satisfies the final criterion.
Grid points where abrupt shifts were detected are subsequently sorted based on the direction of the abrupt shift (positive or negative) and the direction of overall trend (positive or negative). This results in four classifications of abrupt shifts; however, for our analysis we solely focus on dieback abrupt shifts corresponding to the overall trend and direction of the abrupt shift being negative. This type of abrupt shift can be used as an analogy for a tipping event where a region changes equilibrium state from rainforest to savannah. We also checked whether generic EWSs were present in detected grid points of the models analysed during this study but found no clear indication that critical slowing down could be used as a reliable EWS (see Fig. S1 in the Supplement).
2.3 Risk associated with Amazon dieback
Our system-specific assessment of risk for Amazon dieback is to observe high sensitivities of the amplitude of the temperature seasonal cycle to global warming. This is defined as the gradient of a linear regression fit to the amplitude of the temperature seasonal cycle against global warming. For a comparison between grid points with abrupt shifts and those without, the regression is fitted against the first 73 years of data corresponding to when CO2 has doubled from pre-industrial levels (noting that 91 % of detected abrupt shifts occur after a doubling of CO2). To assess the risk of an abrupt dieback shift occurring, the percentage of grid points that experience abrupt dieback out of all grid points with sensitivities within a specified range is calculated. This gives a measure of how likely it is for a grid point with a given sensitivity to feature a dieback event before the end of the simulation run.
3.1 Detection of abrupt shifts
We focus our analysis on detecting Amazon dieback abrupt shifts in seven state-of-the-art climate models, which all enable interactive vegetation carbon, from Phase 6 of the Climate Model Intercomparison Project (CMIP6). Specifically, we are interested in climate-change-induced dieback (rather than direct deforestation) and therefore consider the idealised scenario of CO2 increasing 1 % per year starting from pre-industrial levels.
Figure 1a–g depict spatially (grid points coloured red) abrupt Amazon dieback shifts, which indicate a move towards a savannah state. Three models – NorCPM1, TaiESM1, and SAM0-UNICON – all show a clustering of dieback abrupt shifts in the north of the Amazon. GFDL-EMS4 also presents a coherent structure with abrupt shifts clustered in west-central Amazonia. Compared to GFDL-ESM4, EC-Earth3-Veg has approximately 10 % fewer abrupt shifts, which are more scattered across the Amazon basin. This is due to the high natural variability that is inherent in this model and is therefore highly sensitive to the threshold chosen for the final criterion (see Fig. S3). Interestingly, UKESM1-0-LL displays no dieback events, despite showing large-scale dieback in previous CMIP generations (Cox et al., 2004). Similarly, very few abrupt shifts are detected in the MPI-ESM1-2-LR model.
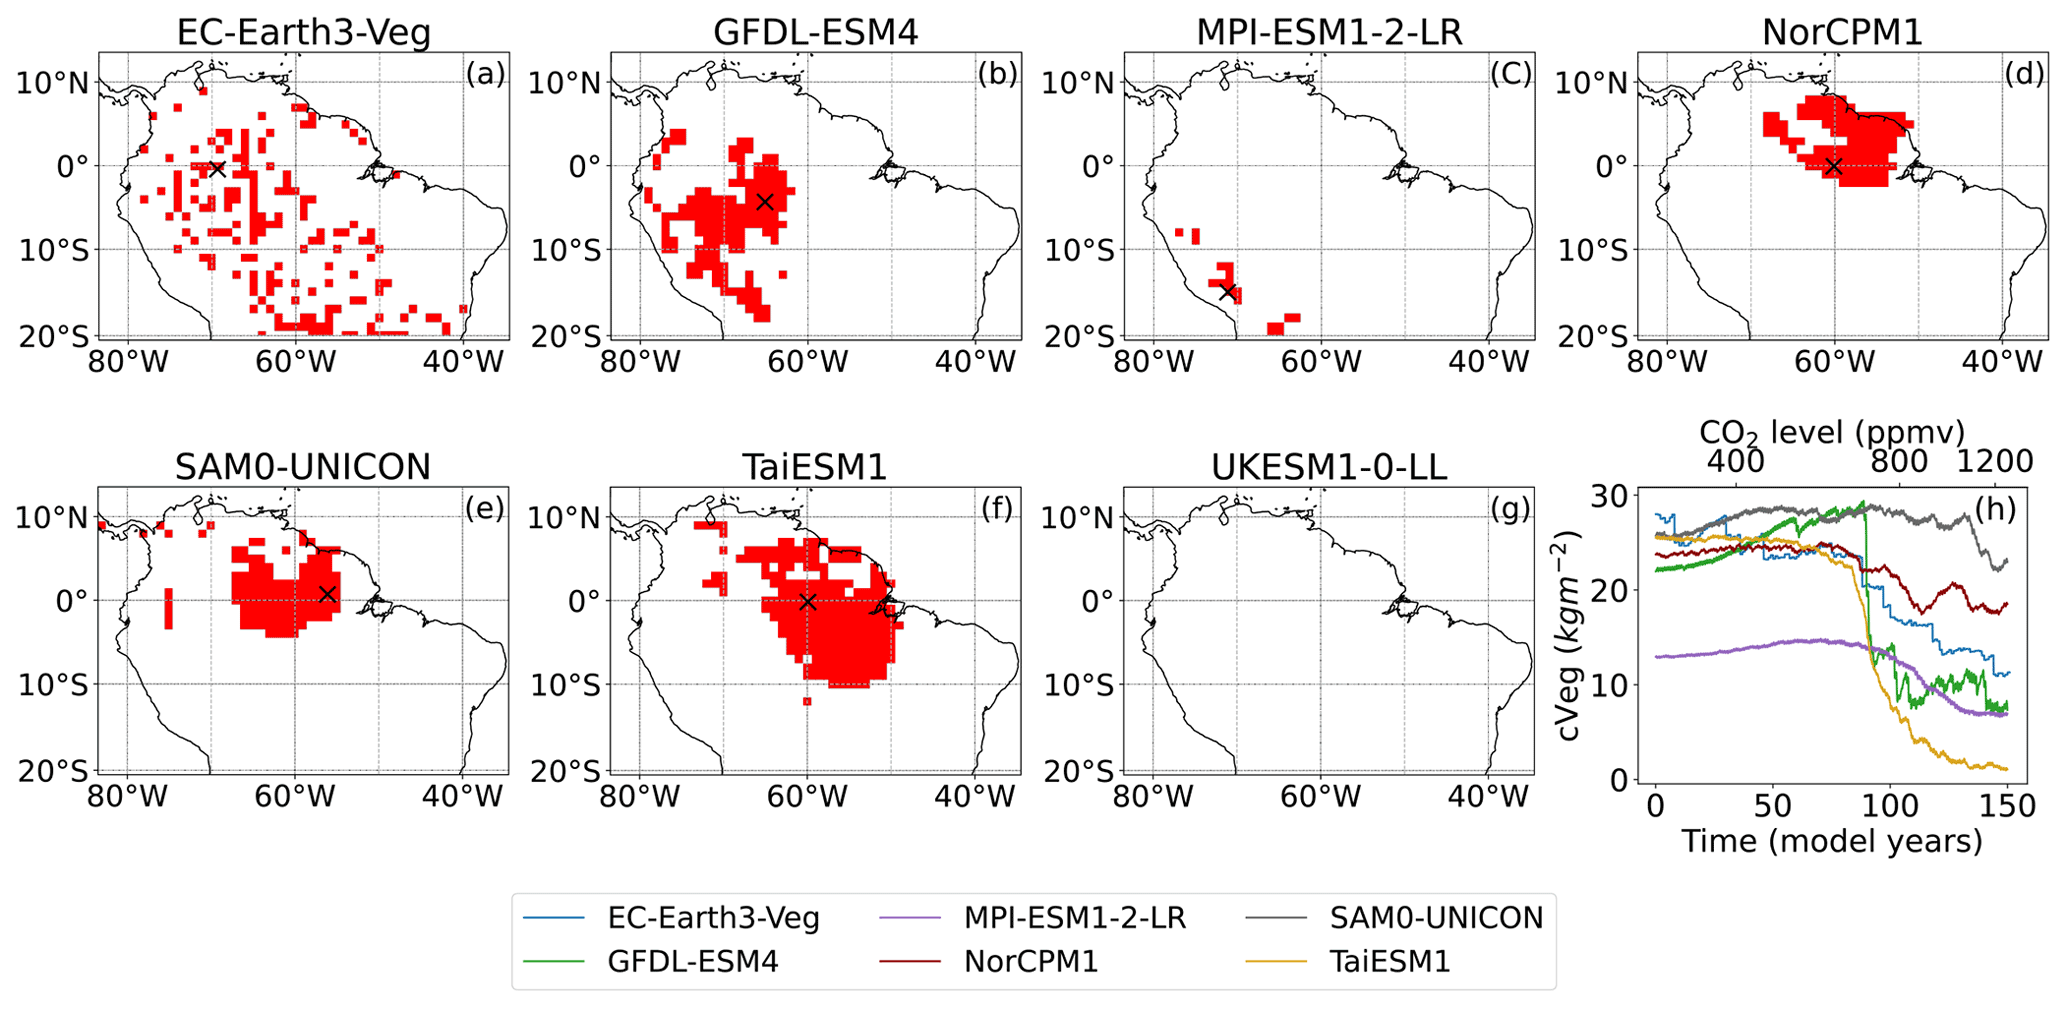
Figure 1Abrupt shifts detected in the Amazon by the described algorithm and example time series for dieback shifts. (a–h) Maps of detected abrupt shifts. Grid points coloured red indicate detected abrupt dieback shifts where the direction of the overall trend and the abrupt shift are both negative. (h) Example time series for detected dieback shifts in each model, corresponding to grid points highlighted by black crosses.
Some sample time series of detected dieback abrupt shifts across the models are shown in Fig. 1h. Between the models there is some variation in the general shape of abrupt shift time series; however, most exhibit a change in state from one equilibrium to another that would be expected of a tipping event.
3.2 Evolution and impact of abrupt shifts in the NSA region
Henceforth, we restrict our analysis to the IPCC AR6-defined northern South America (NSA) region, which contains the majority of the Amazon basin (see Fig. 2a) and features many of the detected abrupt dieback shifts (red points in Fig. 1). Figure 2b shows how the fractional area of the NSA region to experience an abrupt dieback shift evolves for increasing global warming. Some models show clear abrupt shifts in the NSA area to experience an abrupt shift reflecting multiple grid points featuring an abrupt shift at a similar level of warming. Strikingly, TaiESM1 shows about 20 % of the NSA region suffering an abrupt dieback event at about 1.7 ∘C warming, and by 3 ∘C global warming about 40 % of the NSA region would experience an abrupt shift. The bold black line represents the mean behaviour, and the plume gives the variability in all seven models. Although some of the large abrupt shifts from individual models can still be identified, the model mean shows a smoother increase in fractional NSA area to undergo an abrupt shift under global warming. There is not a singular temperature threshold; instead the risk of tipping increases (approximately linearly) between 1.3 and 3 ∘C of warming and reaches approximately 20 % of the NSA region to undergo an abrupt dieback shift.
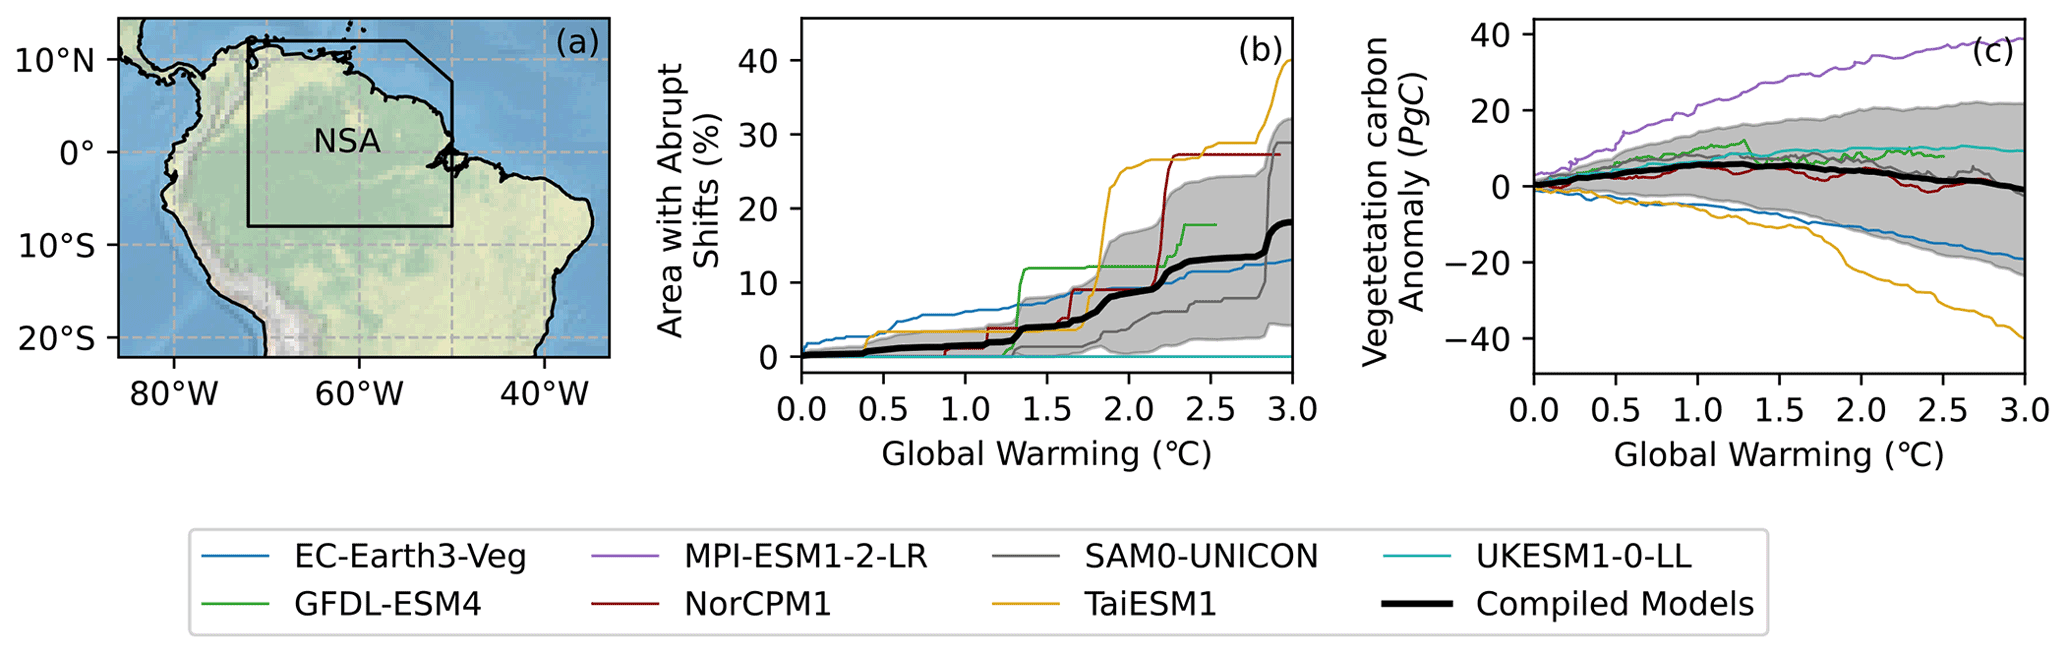
Figure 2Plots showing the evolution of abrupt dieback shifts and vegetation carbon with global warming. (a) IPCC AR6-defined northern South America (NSA) region of the Amazon. (b) Plot showing the evolution of the percentage of the NSA region that has experienced an abrupt shift with increasing global warming. (c) Plot showing how the vegetation carbon anomaly relative to the mean of the first 10 years evolves with global warming. The plumes in (b) and (c) indicate the error in the averaged line (black) of the CMIP6 models.
Interestingly, when inspecting the NSA regional average abrupt changes are not obvious, despite a significant number of local abrupt shifts (see Fig. 2c). Only the cluster of abrupt shifts at approximately 1.3 ∘C warming for GFDL-ESM4 appears in the total vegetation carbon anomaly for the NSA region. Furthermore, the CMIP6 models do not even agree on the sign change in vegetation carbon.
3.3 Risk of Amazon dieback
Three identified abrupt shifts, which all occur around a doubling of CO2 in different models, are shown in Fig. 3a–c and all show a change in equilibrium state after the abrupt shift. Initially, vegetation carbon may increase due to the CO2 fertilisation effect (cf. Fig. 3a and b); however there exists a threshold in the CO2 concentration at which increased temperature and drying overwhelm the positive effect of CO2 and result in an abrupt dieback shift. Figure 3d–f show the trend in the temperature seasonal cycle associated with these three grid points. An increasing trend is observed in the amplitude of the temperature seasonal cycle in the lead-up to the abrupt shift (indicated by dashed red line) for the three examples. This suggests that an increase in variability may be used to assess the risk of Amazon vegetation dieback occurring. This behaviour can be expected in the lead-up to a vegetation dieback shift because the length and intensity of the dry season have been shown to increase due to drying in the Amazon (Vogel et al., 2020; Malhi et al., 2009). The results shown in Fig. 3 provide motivation for further investigation into whether this behaviour is observable in all grid points or only ones which eventually experience an abrupt shift.
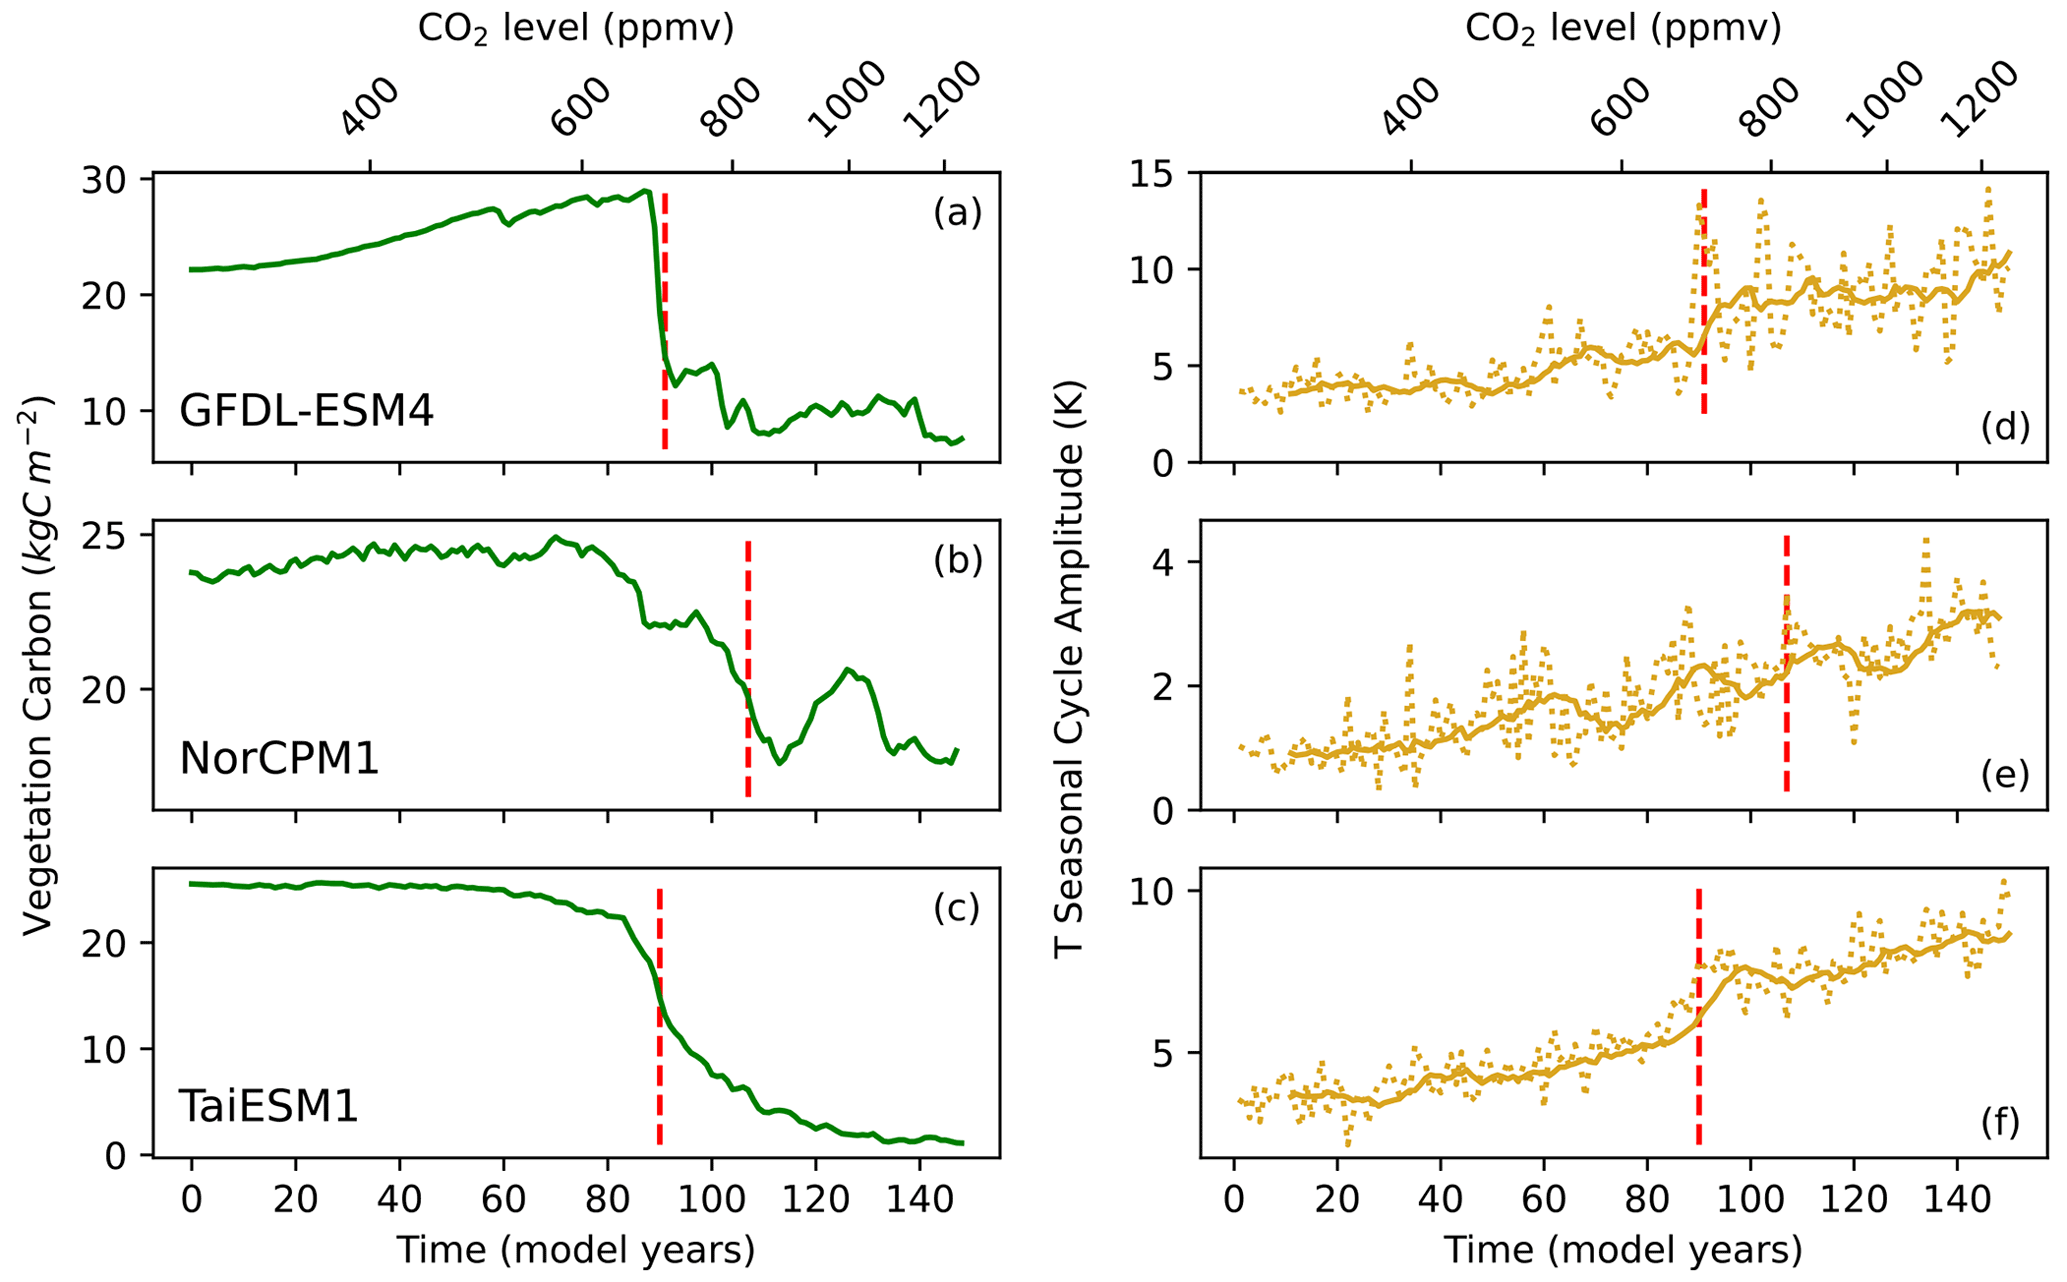
Figure 3Time series showing how the temperature seasonal cycle amplitude evolves over time for grid points which experience abrupt dieback shifts. (a-c) Example time series of identified dieback shifts for three models at grid points 5∘ S, 65∘ W; 0∘, 60∘ W; and 0∘, 60∘ W. The dotted red line indicates the midpoint of the 15-year period where the abrupt shift is detected by the algorithm. (d–f) The change in the amplitude of the temperature seasonal cycle with time and CO2 for these dieback shifts in each model. The solid lines represent the 10-year running average of the seasonal cycle amplitude, while the dotted lines are the yearly data.
Figure 4 investigates the robustness of using the temperature seasonal cycle amplitude as a risk assessment for an impending dieback event. Specifically, we compare the distributions of grid points possessing an abrupt shift and those without for the temperature seasonal cycle amplitude sensitivity to global warming. The sensitivity is calculated up to a doubling of CO2 (91 % of abrupt shifts are detected after a doubling of CO2) for all grid points and models (Fig. 4a–g). The histogram bars are coloured according to the number of grid points featuring an abrupt shift (red) and not (purple) for the given sensitivity intervals. Four of the five models that contain abrupt shifts within the NSA region (GFDL-ESM4, NorCPM1, SAM0-UNICON, TaiESM1; Fig. 4b, d, e, and f) display clear thresholds in the sensitivity such that above the thresholds only grid points with an abrupt shift are featured. EC-Earth3-Veg (Fig. 4a) provides an exception; however due to the high stochasticity of the model most of the detected abrupt shifts are due to natural variability. Promisingly, MPI-ESM1-2-LR and UKESM1-0-LL (Fig. 4c and g) do not possess grid points with high sensitivities and could therefore offer an explanation for not exhibiting any abrupt shifts in the NSA region.

Figure 4Plots demonstrating the efficacy of the temperature seasonal cycle amplitude as a method of assessing the risk of an oncoming abrupt dieback shift. (a–g) Histograms with bins of width 0.2 showing the percentage area of the NSA region that have different sensitivities of the temperature seasonal cycle amplitude to global warming, calculated up to a doubling of CO2. Red-coloured bars correspond to grid points with detected dieback shifts, and purple bars indicate grid points where no abrupt shifts are detected. (h) The mean of histograms (a)–(g). (i) A bar chart showing how the percentage risk of a grid point, in any of the seven analysed models, experiencing a dieback shift changes with increasing sensitivity of the seasonal cycle amplitude to global warming.
Taking an ensemble mean of all the models shows that grid points without an abrupt shift tend to have sensitivities centred around zero, whereas abrupt shift grid points are positively skewed to higher sensitivities (see Fig. 4h). This means that the risk of a grid point having an abrupt shift (defined as the ratio of grid points with an abrupt dieback shift to all grid points for each sensitivity) generally increases for grid points with higher sensitivities to global warming as shown in Fig. 4i. The minimum risk of a grid point experiencing an abrupt shift is for a sensitivity close to 0, where the temperature seasonal cycle amplitude is unaffected by global warming. As the sensitivity increases from 0.5 to 1.0 K K−1 the risk of a grid point containing an abrupt shift increases approximately linearly from 10 % to 60 %. For sensitivities greater than 1.0 K K−1 the risk remains between 60 % and 80 %. The risk also increases to 35 % for negative sensitivities; however this is largely from the EC-Earth3-Veg model, in which it is not clear how many of the detected shifts are indeed abrupt.
The effects of abrupt shifts observed in the NSA region may be limited if anthropogenic climate change is restricted to below 1.5∘, as set out in the aims of the Paris Agreement (UNFCCC, 2015). Exceeding 1.5 ∘C warming is likely to result in sharp increases in the areas experiencing abrupt shifts. Despite large areas of the Amazon experiencing tipping events with warming, the abrupt shifts observed in Fig. 2 may be considered localised events. These are largely balanced out by the increase in vegetation carbon seen elsewhere in the NSA region, likely resulting from CO2 fertilisation, where an increase in photosynthesis rate results in an increase in biomass (Cox et al., 2004; Huntingford et al., 2013). This appears to indicate that large-scale regional dieback, as observed in previous generations of models, is not present in CMIP6, and the impacts will be more localised. Thus, despite the CMIP6 models failing to agree on the overall impact of vegetation carbon in the Amazon, abrupt shifts remain a threat to local communities and ecosystems.
Differences between modelled vegetation dieback arise for multiple reasons. Although there is a reduced spread in the CMIP6 model generation, ESMs continue to project different regional climate changes over Amazonia (Parsons, 2020). Even for the same climate change, models produce a range of tropical forest responses, such as different sensitivities to drying (which is affected by assumptions concerning the root depth of tropical trees), different responses to warming (controlled through different optimum photosynthesis temperatures), and different representations of climate-sensitive disturbance processes (e.g. fires) (Table 1).
The assumed optimum temperature for photosynthesis has been highlighted as a particularly important factor in mediating the response of tropical forests to climate change (Booth et al., 2012). The vegetation components of ESMs often also have different responses to a given increase in atmospheric CO2 (Wenzel et al., 2016). The direct physiological effects of CO2 on the rate of plant photosynthesis and on plant water use efficiency typically counteract the negative impact of climate change on tropical forests (Betts et al., 2004). As a result, the extent of CO2 fertilisation is another important difference across the models (Rammig et al., 2010).
Abrupt shifts are driven by stochastic variations in each model, which can be either interannually generated climate variability or the randomness of disturbance events (such as fire), which is assumed in some vegetation models. Where this stochastic forcing is relatively small, the detected abrupt shifts will tend to be spatially coherent and determined by the underlying large-scale patterns of climate change. However, in models where this stochastic forcing is more significant (e.g. EC-Earth3-Veg), detected abrupt shifts tend to be much less spatially coherent. Under these circumstances the detection of an abrupt shift is more dependent on the threshold chosen (see Fig. S3).
Some models have fire present, such as EC-Earth3-Veg, GFDL-ESM4, MPI-ESM1-2-LR, and NorCPM1, while others do not (e.g. UKESM1-0-LL, TaiESM1, and SAM0-UNICON) (see Table 1). It is interesting to note that UKESM1-0-LL, which experiences no dieback shifts, also has no fires simulated within the model. However, the role that fire plays in inducing vegetation dieback in these models requires further experimentation and work.
Our analysis shows that typically the sensitivity of the amplitude of the temperature seasonal cycle to global warming is higher for grid points subsequently featuring an abrupt dieback shift, compared with grid points with no abrupt dieback (Fig. 4). Furthermore, the result remains robust for removing any single model from the analysis (see Fig. S4). This therefore offers the possibility of using this sensitivity as a system-specific early-warning signal for future dieback in the Amazon. The increase in risk observed for negative sensitivities also could mean that any changes in moisture and temperature cycles in the Amazon suggest an increased risk of an abrupt shift occurring.
We find evidence of clustered localised abrupt dieback shifts in over half the CMIP6 models analysed. Additionally, we use the idealised run with a 1 % per year increase in CO2 to focus on abrupt dieback shifts caused solely by anthropogenic climate change, though abrupt dieback can also be caused through land use changes such as deforestation.
Anthropogenic climate change could result in localised tipping events occurring in the Amazon rainforest, as observed in several CMIP6 models. The dieback events detected would have severe consequences for local communities and ecosystems. This study suggests that 7±5 % of the northern South America region would experience abrupt downward shifts in vegetation carbon per degree of global warming above 1.5 ∘C.
Further research is needed to assess the risk of tipping events under climate change and to identify forewarning methods that can be applied to observational data. However, our results indicate that the sensitivity of the amplitude of the temperature seasonal cycle to global warming is a promising indicator of risk for local Amazon forest dieback.
The CMIP6 model output datasets analysed during this study are available online at https://doi.org/10.22033/ESGF/CMIP6.4507 (EC-Earth Consortium, 2019), https://doi.org/10.22033/ESGF/CMIP6.8473 (Krasting et al., 2018), doi10.22033/ESGF/CMIP6.6435 (Wieners et al., 2019), https://doi.org/10.22033/ESGF/CMIP6.10861 (Bethke et al., 2019), https://doi.org/10.22033/ESGF/CMIP6.7782 (Park and Shin, 2019), https://doi.org/10.22033/ESGF/CMIP6.9702 (Lee and Liang, 2020), and https://doi.org/10.22033/ESGF/CMIP6.5792 (Tang et al., 2019). Code used for analysis is available at https://doi.org/10.5281/zenodo.7038389 (Parry et al., 2022).
The supplement related to this article is available online at: https://doi.org/10.5194/esd-13-1667-2022-supplement.
IMP carried out the data analysis and drafted the paper. PDLR and PMC advised on the study. All authors contributed to the submitted paper.
The contact author has declared that none of the authors has any competing interests.
Publisher's note: Copernicus Publications remains neutral with regard to jurisdictional claims in published maps and institutional affiliations.
We acknowledge the World Climate Research Programme's Working Group on Coupled Modelling, which is responsible for CMIP, and we thank the climate modelling groups (listed in Table 1 in the Methods section) for producing and making available their model output.
This research has been supported by the European Research Council “Emergent Constraints on Climate-Land feedbacks in the Earth System (ECCLES)” project under grant agreement number 742472 (Paul D. L. Ritchie and Peter M. Cox). Peter M. Cox was also supported by the European Union's Framework Programme Horizon 2020 for Research and Innovation under grant agreement number 821003, Climate–Carbon Interactions in the Current Century (4C) project. Isobel M. Parry was supported by the Engineering and Physical Sciences Research Council (EPSRC).
This paper was edited by Somnath Baidya Roy and reviewed by three anonymous referees.
Aragão, L., Anderson, L., Fonseca, M., Rosan, T. M., Vedovato, L., Wagner, F., Silva, C., Silva-Junior, C., Arai, E., Aguiar, A. P., Barlow, J., Berenguer, E., Deeter, M., Domingues, L., Gatti, L., Gloor, M., Malhi, Y., Marengo, J., Miller, J., and Saatchi, S.: 21st Century drought-related fires counteract the decline of Amazon deforestation carbon emissions, Nat. Commun., 9, 536, https://doi.org/10.1038/s41467-017-02771-y, 2018. a
Arora, V. K., Katavouta, A., Williams, R. G., Jones, C. D., Brovkin, V., Friedlingstein, P., Schwinger, J., Bopp, L., Boucher, O., Cadule, P., Chamberlain, M. A., Christian, J. R., Delire, C., Rosie, A. F., Hajima, T., Ilyina, T., Joetzjer, E., Kawamiya, M., Koven, C. D., Krasting, J. P., Law, R. M., Lawrence, D. M., Lenton, A., Lindsay, K., Pongratz, J., Raddatz, T., Séférian, R., Tachiiri, K., Tjiputra, J. F., Wiltshire, A., Wu, T., and Ziehn, T.: Carbon–concentration and carbon–climate feedbacks in CMIP6 models and their comparison to CMIP5 models, Biogeosciences, 17, 4173–4222, https://doi.org/10.5194/bg-17-4173-2020, 2020. a
Bethke, I., Wang, Y., Counillon, F., Kimmritz, M., Fransner, F., Samuelsen, A., Langehaug, H. R., Chiu, P.-G., Bentsen, M., Guo, C., Kirkevåg, A., Oliviè, D. J. L., Seland, Ø., Fan, Y., Lawrence, P., Eldevik, T., and Keenlyside, N.: NCC NorCPM1 model output prepared for CMIP6 CMIP 1pctCO2, Earth System Grid Federation [code], https://doi.org/10.22033/ESGF/CMIP6.10861, 2019. a
Betts, R. A., Cox, P. M., Collins, M., Harris, P. P., Huntingford, C., and Jones, C. D.: The role of ecosystem-atmosphere interactions in simulated Amazonian precipitation decrease and forest dieback under global climate warming, Theor. Appl. Climatol., 78, 157–175, https://doi.org/10.1007/s00704-004-0050-y, 2004. a
Booth, B., Jones, C., Collins, M., Totterdell, I., Cox, P., Sitch, S., Huntingford, C., Betts, R., Harris, G., and Lloyd, J.: High sensitivity of future global warming to land carbon cycle processes, Environ. Res. Lett., 7, 024002, https://doi.org/10.1088/1748-9326/7/2/024002, 2012. a
Boulton, C., Good, P., and Lenton, T.: Early warning signals of simulated Amazon rainforest dieback, Theor. Ecol., 6, 273–384, https://doi.org/10.13140/RG.2.2.20894.33601, 2013. a
Boulton, C. A., Lenton, T. M., and Boers, N.: Pronounced loss of Amazon rainforest resilience since the early 2000s, Nat. Clim. Change, 12, 271–278, https://doi.org/10.1038/s41558-022-01287-8, 2022. a, b
Chai, Y., Martins, G., Nobre, C., von Randow, C., Chen, T., and Dolman, H.: Constraining Amazonian land surface temperature sensitivity to precipitation and the probability of forest dieback, npj Clim. Atmos. Sci., 4, 6, https://doi.org/10.1038/s41612-021-00162-1, 2021. a
Cox, P., Betts, R., Jones, C., Spall, S., and Totterdell, I.: Acceleration of global warming due to carbon-cycle feedbacks in a coupled climate model, Nature, 408, 184–187, https://doi.org/10.1038/35041539, 2000. a
Cox, P., Betts, R., Collins, M., Harris, P., Huntingford, C., and Jones, C.: Amazonian forest dieback under climate-carbon cycle projections for the 21st century, Theor. Appl. Climatol., 78, 137–156, https://doi.org/10.1007/s00704-004-0049-4, 2004. a, b, c
Cox, P., Pearson, D., Booth, B., Friedlingstein, P., Huntingford, C., Jones, C., and Luke, C.: Sensitivity of tropical carbon to climate change constrained by carbon dioxide variability, Nature, 494, 341–344, https://doi.org/10.1038/nature11882, 2013. a
Dakos, V., Scheffer, M., van Nes, E. H., Brovkin, V., Petoukhov, V., and Held, H.: Slowing down as an early warning signal for abrupt climate change, P. Natl. Acad. Sci. USA, 105, 14308–14312, https://doi.org/10.1073/pnas.0802430105, 2008. a, b
Döscher, R., Acosta, M., Alessandri, A., Anthoni, P., Arsouze, T., Bergman, T., Bernardello, R., Boussetta, S., Caron, L.-P., Carver, G., Castrillo, M., Catalano, F., Cvijanovic, I., Davini, P., Dekker, E., Doblas-Reyes, F. J., Docquier, D., Echevarria, P., Fladrich, U., Fuentes-Franco, R., Gröger, M., v. Hardenberg, J., Hieronymus, J., Karami, M. P., Keskinen, J.-P., Koenigk, T., Makkonen, R., Massonnet, F., Ménégoz, M., Miller, P. A., Moreno-Chamarro, E., Nieradzik, L., van Noije, T., Nolan, P., O'Donnell, D., Ollinaho, P., van den Oord, G., Ortega, P., Prims, O. T., Ramos, A., Reerink, T., Rousset, C., Ruprich-Robert, Y., Le Sager, P., Schmith, T., Schrödner, R., Serva, F., Sicardi, V., Sloth Madsen, M., Smith, B., Tian, T., Tourigny, E., Uotila, P., Vancoppenolle, M., Wang, S., Wårlind, D., Willén, U., Wyser, K., Yang, S., Yepes-Arbós, X., and Zhang, Q.: The EC-Earth3 Earth system model for the Coupled Model Intercomparison Project 6, Geosci. Model Dev., 15, 2973–3020, https://doi.org/10.5194/gmd-15-2973-2022, 2022. a
Drijfhout, S., Bathiany, S., Beaulieu, C., Brovkin, V., Claussen, M., Huntingford, C., Scheffer, M., Sgubin, G., and Swingedouw, D.: Catalogue of abrupt shifts in Intergovernmental Panel on Climate Change climate models, P. Natla. Acad. Sci. USA, 112, E5777–E5786, https://doi.org/10.1073/pnas.1511451112, 2015. a
EC-Earth Consortium: EC-Earth-Consortium EC-Earth3-Veg model output prepared for CMIP6 CMIP 1pctCO2, Earth System Grid Federation [code], https://doi.org/10.22033/ESGF/CMIP6.4507, 2019. a
Eyring, V., Bony, S., Meehl, G. A., Senior, C. A., Stevens, B., Stouffer, R. J., and Taylor, K. E.: Overview of the Coupled Model Intercomparison Project Phase 6 (CMIP6) experimental design and organization, Geosci. Model Dev., 9, 1937–1958, https://doi.org/10.5194/gmd-9-1937-2016, 2016. a
Hirota, M., Holmgren, M., Van Nes, E. H., and Scheffer, M.: Global resilience of tropical forest and savanna to critical transitions, Science, 334, 232–235, https://doi.org/10.1126/science.1210657, 2011. a
Hirota, M., Flores, B., Betts, R., Borma, L., Esquivel Muelbert, A., Jakovac, C., Lapola, D., Montoya, E., Oliveira, R., and Sakschewski, B.: Amazon Assessment Report 2021, in: chap. 24 Resilience of the Amazon forest to global changes: Assessing the risk of tipping points,United Nations Sustainable Development Solutions Network, 1–32, https://doi.org/10.55161/QPYS9758, 2021. a
Huntingford, C., Zelazowski, P., Galbraith, D., Mercado, L., Sitch, S., Fisher, R., Lomas, M., Walker, A., Jones, C., Booth, B., Malhi, Y., Hemming, D., Kay, G., Good, P., Lewis, S., Phillips, O., Atkin, O., Lloyd, J., Gloor, M., and Cox, P.: Simulated resilience of tropical rainforests to CO2-induced climate change, Nat. Geosci., 6, 268–273, https://doi.org/10.1038/ngeo1741, 2013. a
Jørgensen, S. V., Hauschild, M. Z., and Nielsen, P. H.: Assessment of urgent impacts of greenhouse gas emissions – the climate tipping potential (CTP), Int. J. Life Cy. Assess., 19, 919–930, https://doi.org/10.1007/s11367-013-0693-y, 2014. a
Krasting, J. P., John, J. G., Blanton, C., McHugh, C., Nikonov, S., Radhakrishnan, A., Rand, K., Zadeh, N. T., Balaji, V., Durachta, J., Dupuis, C., Menzel, R., Robinson, T., Underwood, S., Vahlenkamp, H., Dunne, K. A., Gauthier, P. P. G., Ginoux, P., Griffies, S. M., Hallberg, R., Harrison, M., Hurlin, W., Malyshev, S., Naik, V., Paulot, F., Paynter, D. J., Ploshay, J., Reichl, B. G., Schwarzkopf, D. M., Seman, C. J., Silvers, L., Wyman, B., Zeng, Y., Adcroft, A., Dunne, J. P., Dussin, R., Guo, H., He, J., Held, I. M., Horowitz, L. W., Lin, P., Milly, P. C. D., Shevliakova, E., Stock, C., Winton, M., Wittenberg, A. T., Xie, Y., and Zhao, M.: NOAA-GFDL GFDL-ESM4 model output prepared for CMIP6 CMIP 1pctCO2, Earth System Grid Federation [code], https://doi.org/10.22033/ESGF/CMIP6.8473, 2018. a
Lee, W.-L. and Liang, H.-C.: AS-RCEC TaiESM1.0 model output prepared for CMIP6 CMIP 1pctCO2, Earth System Grid Federation [code], https://doi.org/10.22033/ESGF/CMIP6.9702, 2020. a
Lenton, T. M., Held, H., Kriegler, E., Hall, J. W., Lucht, W., Rahmstorf, S., and Schellnhuber, H. J.: Tipping elements in the Earth's climate system, P. Natl. Acad. Sci. USA, 105, 1786–1793, https://doi.org/10.1073/pnas.0705414105, 2008. a
Lenton, T. M., Rockström, J., Gaffney, O., Rahmstorf, S., Richardson, K., Steffen, W., and Schellnhuber, H. J.: Environmental Tipping Points, Annu. Rev. Environ. Resour., 38, 1–29, https://doi.org/10.1038/d41586-019-03595-0, 2013. a, b
Lenton, T. M., Rockström, J., Gaffney, O., Rahmstorf, S., Richardson, K., Steffen, W., and Schellnhuber, H. J.: Climate tipping points – too risky to bet against, Nature, 575, 592–595, https://doi.org/10.1038/d41586-019-03595-0, 2019. a
Luo, X. and Keenan, T.: Tropical extreme droughts drive long-term increase in atmospheric CO2 growth rate variability, Nat. Commun., 13, 1193, https://doi.org/10.1038/s41467-022-28824-5, 2022. a, b
Malhi, Y., Aragão, L. E. O. C., Galbraith, D., Huntingford, C., Fisher, R., Zelazowski, P., Sitch, S., McSweeney, C., and Meir, P.: Exploring the likelihood and mechanism of a climate-change-induced dieback of the Amazon rainforest, P. Natl. Acad. Sci. USA, 106, 20610–20615, https://doi.org/10.1073/pnas.0804619106, 2009. a, b, c, d
Meehl, G. A., Moss, R., Taylor, K. E., Eyring, V., Stouffer, R. J., Bony, S., and Stevens, B.: Climate Model Intercomparisons: Preparing for the Next Phase, EOS Trans. Am. Geophys. Union, 95, 77–78, https://doi.org/10.1002/2014eo090001, 2014. a
Nijsse, F. J. M. M., Cox, P. M., and Williamson, M. S.: Emergent constraints on transient climate response (TCR) and equilibrium climate sensitivity (ECS) from historical warming in CMIP5 and CMIP6 models, Earth Syst. Dynam., 11, 737–750, https://doi.org/10.5194/esd-11-737-2020, 2020. a
Park, S. and Shin, J.: SNU SAM0-UNICON model output prepared for CMIP6 CMIP 1pctCO2, Earth System Grid Federation [code], https://doi.org/10.22033/ESGF/CMIP6.7782, 2019. a
Parry, I., Ritchie, P, and Cox, P.: Evidence-of-localised-Amazon-rainforest-dieback-in-CMIP6-models-code, Zenodo [code], https://doi.org/10.5281/zenodo.7038389, 2022. a
Parsons, L. A.: Implications of CMIP6 Projected Drying Trends for 21st Century Amazonian Drought Risk, Earth's Future, 8, e2020EF001608, https://doi.org/10.1029/2020ef001608, 2020. a
Phillips, O. L., Aragão, L. E. O. C., Lewis, S. L., Fisher, J. B., Lloyd, J., López-González, G., Malhi, Y., Monteagudo, A., Peacock, J., Quesada, C. A., van der Heijden, G., Almeida, S., Amaral, I., Arroyo, L., Aymard, G., Baker, T. R., Bánki, O., Blanc, L., Bonal, D., Brando, P., Chave, J., Átila Cristina Alves de Oliveira, Cardozo, N. D., Czimczik, C. I., Feldpausch, T. R., Freitas, M. A., Gloor, E., Higuchi, N., Jiménez, E., Lloyd, G., Meir, P., Mendoza, C., Morel, A., Neill, D. A., Nepstad, D., Patiño, S., Peñuela, M. C., Prieto, A., Ramírez, F., Schwarz, M., Silva, J., Silveira, M., Thomas, A. S., ter Steege, H., Stropp, J., Vásquez, R., Zelazowski, P., Dávila, E. A., Andelman, S., Andrade, A., Chao, K.-J., Erwin, T., Fiore, A. D., Eurídice Honorio, C., Keeling, H., Killeen, T. J., Laurance, W. F., Cruz, A. P., Pitman, N. C. A., Vargas, P. N., Ramírez-Angulo, H., Rudas, A., Salamão, R., Silva, N., Terborgh, J., and Torres-Lezama, A.: Drought Sensitivity of the Amazon Rainforest, Science, 323, 1344–1347, https://doi.org/10.1126/science.1164033, 2009. a
Rammig, A., Jupp, T., Thonicke, K., Tietjen, B., Heinke, J., Ostberg, S., Lucht, W., Cramer, W., and Cox, P.: Estimating the risk of Amazonian forest dieback, New Phytol., 187, 694–706, https://doi.org/10.1111/j.1469-8137.2010.03318.x, 2010. a, b
Ritchie, P. D., Clarke, J. J., Cox, P. M., and Huntingford, C.: Overshooting tipping point thresholds in a changing climate, Nature, 592, 517–523, https://doi.org/10.1038/s41586-021-03263-2, 2021. a
Scheffer, M., Bascompte, J., Brock, W. A., Brovkin, V., Carpenter, S. R., Dakos, V., Held, H., van Nes, E. H., Rietkerk, M., and Sugihara, G.: Early-warning signals for critical transitions, Nature, 461, 53–59, https://doi.org/10.1038/nature08227, 2009. a, b, c
Tang, Y., Rumbold, S., Ellis, R., Kelley, D., Mulcahy, J., Sellar, A., Walton, J., and Jones, C.: MOHC UKESM1.0-LL model output prepared for CMIP6 CMIP 1pctCO2, Earth System Grid Federation [code], https://doi.org/10.22033/ESGF/CMIP6.5792, 2019. a
Tokarska, K. B., Stolpe, M. B., Sippel, S., Fischer, E. M., Smith, C. J., Lehner, F., and Knutti, R.: Past warming trend constrains future warming in CMIP6 models, Sci. Adv., 6, eaaz9549, https://doi.org/10.1126/sciadv.aaz9549, 2020. a
UNFCCC: Adoption of the Paris Agreement, FCCC/CP/2015/L.9/Rev.1, http://unfccc.int/resource/docs/2015/cop21/eng/l09r01.pdf (last access: 17 March 2022), 2015. a
Vogel, M., Hauser, M., and Seneviratne, S.: Projected changes in hot, dry and wet extreme events' clusters in CMIP6 multi-model ensemble, Environ. Res. Lett., 15, 094021, https://doi.org/10.1088/1748-9326/ab90a7, 2020. a, b
Wang, J. A., Baccini, A., Farina, M., Randerson, J. T., and Friedl, M. A.: Supplementary information: Disturbance suppresses the aboveground carbon sink in North American boreal forests, Nat. Clim. Change, 11, 435–441, https://doi.org/10.1038/s41558-021-01027-4, 2021. a
Wang, X., Piao, S., Ciais, P., Friedlingstein, P., Myneni, R. B., Cox, P., Heimann, M., Miller, J., Peng, S., Wang, T., Yang, H., and Chen, A.: A two-fold increase of carbon cycle sensitivity to tropical temperature variations variability, Nature, 506, 212–215, https://doi.org/10.1038/nature12915, 2014. a
Wenzel, S., Cox, P. M., Eyring, V., and Friedlingstein, P.: Emergent constraints on climate-carbon cycle feedbacks in the CMIP5 Earth system models, J. Geophys. Res.-Biogeo., 119, 794–807, https://doi.org/10.1002/2013JG002591, 2014. a
Wenzel, S., Cox, P. M., Eyring, V., and Friedlingstein, P.: Projected land photosynthesis constrained by changes in the seasonal cycle of atmospheric CO2, Nature, 538, 499–501, https://doi.org/10.1038/nature19772, 2016. a
Wieners, K.-H., Giorgetta, M., Jungclaus, J., Reick, C., Esch, M., Bittner, M., Legutke, S., Schupfner, M., Wachsmann, F., Gayler, V., Haak, H., de Vrese, P., Raddatz, T., Mauritsen, T., von Storch, J.-S., Behrens, J., Brovkin, V., Claussen, M., Crueger, T., Fast, I., Fiedler, S., Hagemann, S., Hohenegger, C., Jahns, T., Kloster, S., Kinne, S., Lasslop, G., Kornblueh, L., Marotzke, J., Matei, D., Meraner, K., Mikolajewicz, U., Modali, K., Müller, W., Nabel, J., Notz, D., Peters-von Gehlen, K., Pincus, R., Pohlmann, H., Pongratz, J., Rast, S., Schmidt, H., Schnur, R., Schulzweida, U., Six, K., Stevens, B., Voigt, A., and Roeckner, E.: MPI-M MPI-ESM1.2-LR model output prepared for CMIP6 CMIP 1pctCO2, Earth System Grid Federation [code], https://doi.org/10.22033/ESGF/CMIP6.6435, 2019. a
Zemp, D., Schleussner, C.-F., Barbosa, H., and Rammig, A.: Deforestation effects on Amazon forest resilience, Geophys. Res. Lett., 44, 6182–6190, https://doi.org/10.1002/2017GL072955, 2017. a