Running Solr on Kubernetes
Learn the basics of running Apache Solr on Kubernetes for search applications.

Important Disclaimer: Please visit the Solr Operator page for the latest updates regarding Solr on Kubernetes.
This is the first in a two-part series where we introduce the basics of running Solr on Kubernetes (k8s) for search engineers. Specifically, we cover the following topics:
- Getting started with Google Kubernetes Engine (GKE)
- Helm charts
- StatefulSets, initContainers, ConfigMaps, and Persistent Volumes
- Liveness and Readiness Probes
- Cross pod synchronization
- Load-balancing services and pod selectors
- Upgrading Solr with zero-downtime canary style deployments
- Performance and Load Testing
- Monitoring Solr metrics with Prometheus and Grafana
- Encrypting traffic between Solr instances using TLS
In the next post, we’ll dig into questions around auto-scaling, performance and load testing, and other advanced operations. Before we delve into the details, let’s explore the question of why you might want to run Solr on Kubernetes. Namely, k8s offers three main benefits for Solr operators:
- Helps enforce best practices and proven design patterns for distributed systems,
- Reduces the cost of ownership of a complex system like Solr, and
- Runs Solr in the same operational environment where users want to run microservice-based applications.
In terms of best practices and design patterns, Kubernetes gives us a common language to declare how a distributed application should be installed, configured, and maintained in production. Operations engineers learn how to manage Solr by how it uses Kubernetes native resources like services, StatefulSets, and volume claims, instead of worrying about internal implementation details. With Kubernetes, ops teams can focus on cluster sizing, monitoring, and measuring performance using their standard toolset for metrics, logging, alerting, and so on.
As for reducing the cost of ownership, Kubernetes enables general operations engineers to run Solr without our customers having to invest in training or hiring specialists. This is particularly important for Solr, where operating a large-scale Solr cluster has traditionally required very specialized skills. Having your Solr expert leave for a better opportunity is a real risk in today’s job market. Of course, k8s doesn’t eliminate all the complexity of running Solr at scale, but it goes a very long way down that path.
Kubernetes is purpose built for managing cloud-native microservice-based applications. With Solr’s ability to search over massive datasets in sub-second time as well as serve low-latency, ad hoc analytics with streaming expressions, Solr is an attractive backend for data-intensive applications.

However, it would be unproductive to deploy your microservices in seconds to Kubernetes but then have to go through a complex deployment process for Solr outside of k8s. Ideally, ops teams can just deploy Solr along with their microservice applications that depend on it. The Solr helm chart provided by Lucidworks makes that a reality.
Now that you have a sense for why it’s a good idea to run Solr on Kubernetes, let’s roll up our sleeves and launch a Solr cluster in the cloud.
Prerequisites
In this section, we cover how to get setup with Kubernetes and launch your first cluster in GKE. If you’re already familiar with kubectl, helm, gcloud, and GKE, you can safely skip to the next section.
Kubernetes
 Throughout this document, we show how to deploy to a Google Kubernetes Engine (GKE) based cluster. The GKE option is recommended because you can quickly deploy multiple nodes, GKE is a fun environment to learn k8s concepts, and Google gives you $300 in free credits to get started. Before proceeding, setup your Google Cloud access and SDK using the instructions here: https://cloud.google.com/sdk/docs/quickstarts. You can also run a single node Solr cluster on minikube locally, but we won’t cover that here.
kubectl
kubectl is the command-line tool for interacting with a Kubernetes cluster. It should have been installed with minikube or the gcloud SDK. To verify kubectl is available, do: `kubectl version`. If it’s not installed, simply do:
gcloud components install kubectl
Eventually, you’ll get tired of typing “kubectl” so do your future self a favor now and add the following alias to your shell init script (e.g. ~/.bash_profile):
alias k=kubectl
Launch GKE Cluster
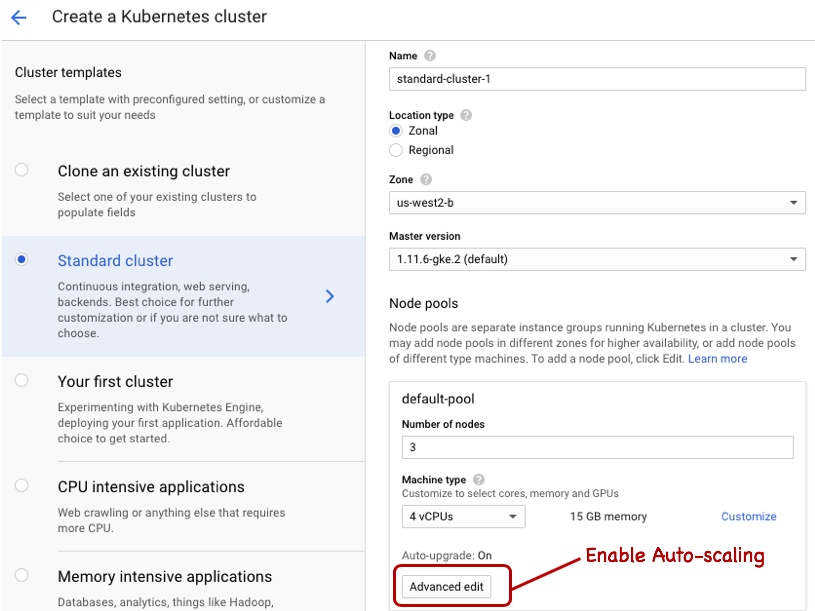
You can launch the cluster from the command-line, but if this is the first time you’re doing it, we recommend using the GCloud console UI. The suggested default Master version and n1-standard-4 instance types should be sufficient for now. Click on the Advanced Edit option to enable auto-scaling of the k8s cluster up to 5 nodes (see screenshot).
Make note of the name of your cluster and project ID; we use the values solr-perf-1 and solr-dev respectively in the examples below. Once your cluster is running, switch over to the command-line to setup the default compute/zone, core/account, and project ID for working with your cluster, such as:
gcloud config set compute/zone us-west2-b
gcloud config set core/account some-account@lucidworks.com
gcloud config set project solr-dev
Next, let’s update the kubectl config file to work with your new cluster by doing:
gcloud container clusters get-credentials solr-perf-1
To verify kubectl is configured for your cluster correctly, do:
kubectl config current-context
You should see output like:
gke_solr-dev_us-west2-b_solr-perf-1
Give your account cluster admin privileges by doing:
kubectl create clusterrolebinding cluster-admin-binding --clusterrole=cluster-admin
  --user=$(gcloud config get-value core/account)
Pro Tip: Keep the kubectl cheat sheet handy: https://kubernetes.io/docs/reference/kubectl/cheatsheet/
Helm
Helm is a popular tool in the k8s ecosystem for deploying applications. We use helm below to deploy Solr, so follow the instructions here to get setup with Helm: https://github.com/helm/helm. Installing Tiller is the most common way of using Helm, but it’s not required to follow along with this post. Briefly on the Mac, try:
brew install kubernetes-helm
kubectl create serviceaccount --namespace kube-system tiller
kubectl create clusterrolebinding tiller-cluster-rule
   --clusterrole=cluster-admin --serviceaccount=kube-system:tiller
helm init --service-account tiller
helm version
Deploy Solr to GKE
Let’s start by deploying a 3-node Solr cluster with Zookeeper to GKE. Clone the repo or download the zip from: https://github.com/lucidworks/solr-helm-chart. We’ve submitted the Helm chart to https://github.com/helm/charts but it’s still pending approval.
One of the nice features of Helm is a chart can dynamically link to other charts. For instance, the Solr chart depends on the Zookeeper chart. Let’s pull the Zookeeper chart into the Solr chart by doing:
cd solr-helm-chart/solr
helm repo add incubator https://storage.googleapis.com/kubernetes-charts-incubator
helm dependency update
Before we deploy, take a moment to look over the configuration variables defined in values.yaml. This file allows you to customize the most common variables for a Solr deployment such as resource allocation, JVM args passed to Solr, and the Solr version (currently 7.6.0).
For production, it’s typical to submit helm charts to the Helm Tiller service running in k8s, but for this exercise, let’s skip Tiller and use the helm template command to render a Kubernetes manifest from the Solr and Zookeeper helm charts. Let’s also change the Solr version to 7.5.0 so that we can upgrade to 7.6.0 later in the exercise:
helm template . --set image.tag=7.5.0 --name solr > solr.yaml
Now, deploy the Solr manifest (solr.yaml) to Kubernetes using:
kubectl apply -f solr.yaml
Be patient while the Zookeeper and Solr pods initialize. Kubernetes may need to fetch the Docker images from Docker Hub as well as provision persistent volumes. Also, don’t worry too much about any warnings you see in the GCloud Console UI while the pods are initializing. In our experience, the cluster workload UI is a little too aggressive with its warnings while pods are being provisioned and can give a false sense of trouble. If Solr and Zookeeper are not all Running within 3-4 minutes the first time you do this, then you can start troubleshooting.
To see the status of the pods, do:
kubectl get pods
When they are all ready, you’ll see output like:
NAME               READY     STATUS    RESTARTS   AGE
solr-0             1/1       Running   0          38m
solr-1             1/1       Running   0          35m
solr-2             1/1       Running   0          34m
solr-zookeeper-0   1/1       Running   0          38m
solr-zookeeper-1   1/1       Running   0          37m
solr-zookeeper-2   1/1       Running   0          36m
If a pod is having trouble getting to the Running state or is slow to come online, use the describe command to see pod specific activity, e.g. `kubectl describe pod solr-0`. The describe command output includes the events Kubernetes takes to start the pod. Take a moment to look over the events reported for the solr-0 pod.
Looks like everything is up-and-running, so now what? Most applications that use Solr as a backend will not expose it to the internet and instead will front it with a stateless microservice search application, such as Lucidworks Fusion. So let’s just forward a local port to the cluster using: kubectl port-forward solr-0 28983:8983
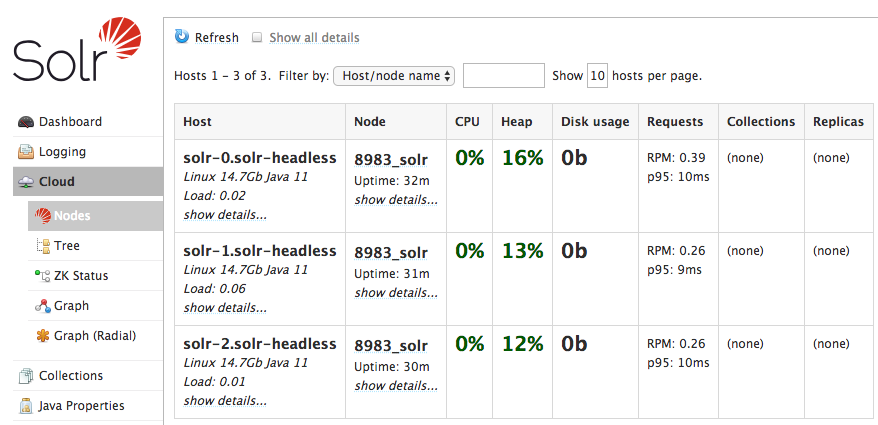
Now, point your browser to: http://localhost:28983/solr/#/~cloud?view=nodes
You should see something like:
Now that we have a way to contact Solr from our local workstation, let’s create a collection using the following:
curl -v "http://localhost:28983/solr/admin/collections?action=CREATE&name=perf3x1&numShards=3&replicationFactor=1&maxShardsPerNode=1&collection.configName=_default"
And add some test data:
wget https://raw.githubusercontent.com/apache/lucene-solr/master/solr/example/exampledocs/books.json
curl "http://localhost:28983/solr/perf3x1/update/json/docs?commit=true" -H "Content-Type: application/json" --data-binary @books.json
At this point, you have a 3-node Solr cluster running in Kubernetes. Nice work! Now, we’ll get into the details of how the deployment works and cover basic operations like enabling TLS between the Solr instances.
Kubernetes Nuts & Bolts
In this section, we cover some of the interesting aspects of the Solr deployment. In the interest of time, we won’t cover much about Zookeeper and instead refer you to the following guide about how Zookeeper works in Kubernetes: https://kubernetes.io/docs/tutorials/stateful-application/zookeeper/
Also, there are a number of important Kubernetes concepts that we don’t cover here. For a more in-depth coverage of k8s concepts, see: https://kubernetes.io/docs/concepts/overview/what-is-kubernetes/
Pod

A pod is a group of one or more containers (typically Docker) that share network and storage. To keep things easy, think of a pod as being group of related processes on an application-specific logical host. Containers in a pod share the same IP address and port space, so they can communicate via localhost but can’t bind to the same port.
Since k8s is a container orchestration framework, you might wonder why they invented a new term instead of just using “container”? It turns out that while many deployments only have a single container in a pod, which is the case with our Solr deployment, it’s not uncommon to deploy pods with multiple containers.
A great example of this is the sidecar Envoy proxy deployed by Istio. The classic example of a pod with multiple related containers is running Apache httpd and memcached in the same pod. There are a number of great resources about pods on the internet, so let’s move on to more interesting concepts and we’ll call out important aspects of the Solr pods as needed.
StatefulSet
If you’re new to Kubernetes, the first thing you need to learn is that pods move around the cluster and you don’t have much control over that! In fact, you should not care if a pod moves around the cluster as that process is central to the design of Kubernetes.
One of the main tasks performed by Kubernetes is to balance cluster resource utilization. As part of this process, k8s may decide to move a pod to another node. Or, a node can fail for various reasons and k8s needs to replace those failed pods on another healthy node in the cluster.
So think for a minute what would happen if k8s moved a Solr pod to a different node. If the disk Solr was using didn’t come along with it, then when Solr initializes on the new node, it won’t have any cores (Lucene indexes) available and would have to perform a potentially expensive snapshot replication from another replica in the cluster. And how it would know which cores it needed to replicate since this information is also stored on disk? Things would be even worse for collections that use a replication factor of one as there would be no other replica to sync with.
This problem is not unique to Solr. Thankfully, Kubernetes has an elegant solution for systems like Solr that need to keep state on disk and have that state restored if the pod gets moved (or crashes and gets restarted), namely StatefulSets.
We could spend a whole blog digging into the details of a StatefulSet, but there’s already a great number of resources that do that, starting with https://cloud.google.com/kubernetes-engine/docs/concepts/statefulset.
We do want to clear up one misconception that we’ve heard mumbled in the hallways when discussing running Solr on Kubernetes, namely that k8s is not well-suited for stateful applications. It’s true that k8s has a mixed history with running stateful applications, but that’s old news. StatefulSets are a first-class feature in k8s and there are many examples of successful stateful applications; a quick search on the helm github site for charts shows 110 hits when searching for StatefulSet: https://github.com/helm/charts/search?l=YAML&q=StatefulSet.
So now let’s see a StatefulSet in action. If you list out the pods (kubectl get pods -l ), you’ll see the following output:
solr-0              1/1        Running    0           1h
solr-1              1/1        Running    0           1h
solr-2              1/1        Running    0           1h
Those are the pods in the StatefulSet named “solr”. Notice that each gets a stable hostname with an ordinal index starting with 0; if the pod goes away, it’ll come back with the same hostname but different IP address. Although it is unimportant for Solr, since it uses Zookeeper to coordinate cluster activities, the replicas in the set are initialized in ascending order and removed in descending order.
Persistent Volumes
To prove that a replica in a StatefulSet comes back with the same hostname and storage attached, we need to kill a pod. Before we start killing pods in the cluster, let’s cover an important aspect of Solr StatefulSets, namely PersistentVolumes. If you look into the Solr helm chart, you’ll notice that the StatefulSet has the following volumeMount:
          volumeMounts:
            - name: solr-pvc
              mountPath: /opt/solr/server/home
Let’s log into solr-0 and take a look at what that is:
kubectl exec -it solr-0 --container solr -- /bin/bash
solr@solr-0:/opt/solr/server$ lsblk
NAME    MAJ:MIN RM  SIZE RO TYPE MOUNTPOINT
sda       8:0    0   34G  0 disk
├─sda1    8:1      29.9G  0 part /etc/hosts
...
sdb       8:16   0    5G  0 disk
sdc       8:32   0   20G  0 disk /opt/solr/server/home
This shows we have a 20G disk mounted at /opt/solr/server/home. How did that happen? To get a persistent volume attached to each replica in the set, you need a volume claim template, which sets the group id (gid=8983 for Solr) and the desired size (20 gigabytes):
volumeClaimTemplates:
    - metadata:
        name: solr-pvc
        annotations:
          pv.beta.kubernetes.io/gid: "8983"
      spec:
        accessModes:
          - ReadWriteOnce
        resources:
          requests:
            storage: 20Gi
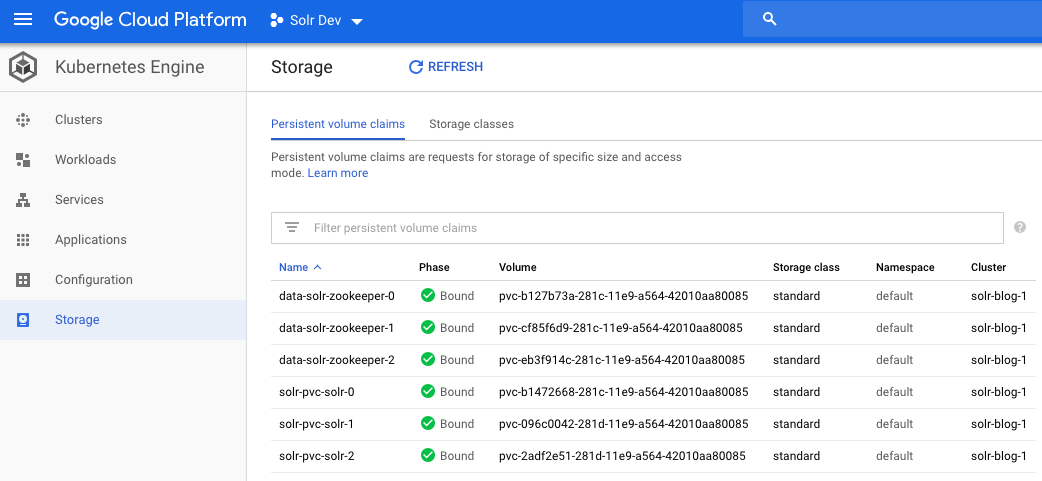
Obviously, you’ll need more disk space for a real Solr deployment, which can be increased by changing the `volumeClaimTemplates.storageSize` parameter in the values.yaml file. Behind the scenes, GKE allocates disks from Google compute engine. You can get details about the storage attached for the persistent volumes from the UI as shown below using:
kubectl describe PersistentVolumeClaim solr-pvc-solr-0
Using an initContainer to Bootstrap Solr Home
If you look in the /opt/solr/server/home directory, you’ll see a solr.xml file. There are a couple of interesting things going on here. First, the pod spec for the StatefulSet passes the following to Solr using an environment variable:
            - name: "SOLR_HOME"
              value: "/opt/solr/server/home"
Solr 7.x requires the SOLR_HOME directory to contain a solr.xml file. When k8s mounts the `solr-pvc` volume it’s an empty directory (initially). Consequently, we leverage another useful Kubernetes tool called an initContainer to bootstrap solr.xml into our empty persistent volume directory.
      initContainers:
        - name: check-zk
          ...
        - name: "cp-solr-xml"
          image: busybox:latest
          command: ['sh', '-c', 'cp /tmp/solr.xml /tmp-config/solr.xml']
          volumeMounts:
          - name: "solr-xml"
            mountPath: "/tmp"
          - name: "solr-pvc"
            mountPath: "/tmp-config"
The cp-solr-xml initContainer simply copies the solr.xml file from /tmp to /tmp-config which happens to be the same persistent volume (solr-pvc) as the Solr container sees at /opt/solr/server/home. But wait, how did solr.xml get into /tmp of the initContainer? This occurs using a Kubernetes ConfigMap and a volume mount in the StatefulSet definition:
apiVersion: "v1"
kind: "ConfigMap"
metadata:
  name: "solr-config-map"
  labels:
    app: solr
    chart: solr-1.0.0
    release: solr
    heritage: Tiller
data:
  solr.xml: |
    <?xml version="1.0" encoding="UTF-8" ?>
    <solr>
     ...
    </solr>
The ConfigMap now holds a solr.xml file in the solr.xml key. To make it available to our pods in the StatefulSet, we mount the ConfigMap as a volume using:
      volumes:
        - name: solr-xml
          configMap:
            name: solr-config-map
            items:
            - key: solr.xml
              path: solr.xml
Admittedly, getting the solr.xml bootstrapped into Solr’s home directory using initContainers and ConfigMaps is pretty cumbersome. It does serve is a good example of using initContainers to get the pod in a good state before starting the primary container. In the future, Solr should have a better solution to this problem built in, see: https://issues.apache.org/jira/browse/SOLR-13035.
To recap, the Solr StatefulSet has assigned each node a hostname in the cluster based on the set name and replica ordinal, e.g. solr-0, solr-1, etc and has attached a 20G persistent volume to each pod at /opt/solr/server/home.
Replacing Lost Stateful Replicas
Let’s determine which node the solr-2 pod is running using:
kubectl get pod -o=custom-columns=NODE:.spec.nodeName,NAME:.metadata.name
Now, let’s kill a pod and see what happens:
kubectl delete po solr-2 --force --grace-period 0
Wait a few seconds and then list out the pods: kubectl get pods
NAME               READY     STATUS            RESTARTS   AGE
solr-0             1/1       Running           0          19m
solr-1             1/1       Running           0          16m
solr-2             0/1       PodInitializing   0          7s
solr-zookeeper-0   1/1       Running           0          19m
solr-zookeeper-1   1/1       Running           0          18m
solr-zookeeper-2   1/1       Running           0          17m
After waiting a short while, notice the lost solr-2 pod has been re-added to the cluster. If you re-run the node name listing, you’ll see that solr-2 pod came back and was re-created on the same node as before. That’s because k8s strives to maintain a balanced cluster.
Liveness and Readiness Probes
Kubernetes actively monitors the status of your pods using liveness and readiness probes. For now, the Solr helm chart hits the /solr/admin/info/system endpoint using:
          livenessProbe:
            initialDelaySeconds: 20
            periodSeconds: 10
            httpGet:
              scheme: "HTTP"
              path: /solr/admin/info/system
              port: 8983
          readinessProbe:
            initialDelaySeconds: 15
            periodSeconds: 5
            httpGet:
              scheme: "HTTP"
              path: /solr/admin/info/system
              port: 8983
However, once https://issues.apache.org/jira/browse/SOLR-11126 is available, we can have more sophisticated liveness and readiness checks.
Coordinating Pod Initialization
Before we move on to the next section, let’s look at how k8s coordinates the timing of pods between Solr and Zookeeper. Specifically, Solr requires Zookeeper to be available before it can fully initialize and serve requests. However, with k8s, we want to be able to deploy our pods without having to coordinate the order. In fact, there’s no concept of ordering pod initialization between StatefulSets in Kubernetes. To accomplish this, we rely on an initContainer that tests ZK health before the primary Solr container gets invoked by k8s. If ZK is not healthy, then the initContainer sleeps for a few seconds and then tries again for up to one minute.
      initContainers:
        - name: check-zk
          image: busybox:latest
          command:
            - 'sh'
            - '-c'
            - |
              COUNTER=0;
              while [ $COUNTER -lt 30 ]; do
               ... # see helm chart for script details
              done;
              echo "Did NOT see a ZK leader after 60 secs!";
              exit 1;
If Solr doesn’t come online, check the status of the initContainers using:
kubectl describe pod <pod name>
Upgrading Solr
Remember when we said Kubernetes helps enforce best practices and proven design patterns? Performing a rolling upgrade without downtime is one of those best practices that are built into StatefulSets. To see this in action, simply re-run the helm template command without the –set image.tag parameter:
helm template . --name solr > solr.yaml

and then do: kubectl apply -f solr.yaml
The output of the apply command shows the elegance of Kubernetes:
service "solr-zookeeper-headless" unchanged
service "solr-zookeeper" unchanged
statefulset.apps "solr-zookeeper" configured
statefulset.apps "solr" configured
configmap "solr-config-map" unchanged
poddisruptionbudget.policy "solr" unchanged
service "solr-headless" unchanged
service "solr-svc" unchanged
poddisruptionbudget.policy "solr-zookeeper" unchanged
Notice how it detected that the solr StatefulSet changed but otherwise all the other resources remained unchanged. k8s performs a rolling upgrade from the Solr 7.5.0 container to the 7.6.0 container starting with solr-2. After solr-2 initializes, take a look at the logs and you’ll see that it’s now running Solr 7.6.0:
2019-02-04 02:07:26.059 INFO (main) [ ] o.a.s.s.SolrDispatchFilter  ___      _ Welcome to Apache Solr™ version 7.6.0
2019-02-04 02:07:26.063 INFO (main) [ ] o.a.s.s.SolrDispatchFilter / __| ___| |_ _   Starting in cloud mode on port 8983
2019-02-04 02:07:26.063 INFO (main) [ ] o.a.s.s.SolrDispatchFilter __ / _  | '_|  Install dir: /opt/solr
2019-02-04 02:07:26.064 INFO (main) [ ] o.a.s.s.SolrDispatchFilter |___/___/_|_|    Start time: 2019-02-04T02:07:26.064447Z
That’s all well and good, except it doesn’t take into account leader re-election for any leaders hosted on the node that gets upgraded. Kube has our back in this case too as it sends a SIGTERM to the Solr process, which triggers Solr to start unloading cores and shutting down gracefully. k8s will wait up to 30 seconds for Solr to perform a graceful shutdown, which should be sufficient for most use cases. You can increase this timeout using `terminationGracePeriodSeconds` on the pod spec if needed.
Canary Release
Rolling updates across a StatefulSet requires you to upgrade all the pods, but what if you want to experiment with a Solr update before rolling it out across the cluster, i.e. you want to perform what’s called a “canary release”.
For instance, let’s say we want to try Solr 8.0.0 (not yet released) but only send a percentage of the requests to it, just in case our experiment goes wrong. Or, it could be something less intrusive such as trying out a different mix of Solr configuration parameters. The point is your canary pod has some change that you want to verify before rolling out across the cluster.
For this experiment we only want to introduce a single canary pod into the mix. Before we implement this solution, let’s cover how Kubernetes services work with a set of pods. To start, take a look at the services defined for the Solr cluster using:
kubectl get svc -l app=solr
NAME            TYPE        CLUSTER-IP    EXTERNAL-IP   PORT(S)    AGE
solr-headless   ClusterIP   None          <none>        8983/TCP   59m
solr-svc        ClusterIP   10.63.248.4   <none>        8983/TCP   59m
Kubernetes services load-balance requests across a set of pods using pod selector labels. For example, the solr-svc service selects pods with labels: app=solr, release=solr, and component=server:
apiVersion: "v1"
kind: "Service"
metadata:
  name: "solr-svc"
spec:
  type: "ClusterIP"
  ports:
  - port: 8983
    name: "solr-client"
  selector:
    app: "solr"
    release: "solr"
    component: "server"
Thus, it doesn’t matter which StatefulSet (or Deployment) the pods come from so long as a pod’s labels match the service’s selector. This means we can deploy multiple StatefulSets in the cluster, each pointing at different versions of Solr, and the service happily routes traffic to both.
We’ll leave it as an exercise for the reader to deploy another StatefulSet with a single replica using a different Solr version. After the canary pod is online, you’ll need to use the Solr collections API to add a replica from your collection to the canary Solr instance.
Performance Smoke Test
We won’t spend much time on performance and load testing right now as we’ll come back to it in more detail in the next post. For now, one of the questions we wanted to answer is whether or not Solr is slower in Kubernetes.
To start, we need to index data at a fairly high volume, so we chose to use Spark running in Dataproc and the spark-solr library provided by Lucidworks. The following Scala script run from the Spark shell indexes ~7.5M docs stored in Google Cloud Storage (GCS):
val df = spark.read.parquet("gs://solr-perf-data/test7m")
val zkhost = "35.236.83.52:2181"
val collection = "perf3x1"
val writeOpts = Map("zkhost" -> zkhost, "collection" -> collection, "batch_size" -> "10000", "commit_within" -> "30000")
df.write.format("solr").options(writeOpts).save
com.lucidworks.spark.util.SolrSupport.getCachedCloudClient(zkhost).commit(collection)
This script allows us to scale it out to as many concurrent indexing cores using Spark as we need so we can test massive Solr clusters and datasets of any size stored in GCS. Indexing into our 3-node cluster running with `n1-standard-4` instance types led to 16,800 docs/sec (3 shards / 1 replica per shard). We used 12 concurrent executor cores on the Spark side.
To compare, we ran the same test against Solr running on GCE (VMs not containers) and achieved ~15,000 docs/sec. So in this case, running on Kube was faster, but it’s a fairly small data set and performance of cloud VMs can vary slightly. What’s important is that Kube was on-par with VM-based performance in GCE using the same n1-standard-4 instance types. In the next post, we’ll run longer performance and load tests on bigger sets with Solr replication enabled.
Solr Metrics in Prometheus
Prometheus (https://prometheus.io/) is a monitoring solution that has first class integration with Kubernetes. The Solr helm chart has the option of integrating with Prometheus via the prometheus-exporter that is distributed as part of the Solr docker image. This is turned off by default, but can be enabled via the `exporter.enabled` value.
The following instructions assume that you already have a running instance of Prometheus, the easiest way to stand one up is via the Prometheus helm chart that is documented here: https://github.com/helm/charts/tree/master/stable/prometheus
To add the exporter to our running Solr, first create a file called solr_exporter.yaml with the contents:
---
exporter:
  enabled: true
  service:
    annotations:
      prometheus.io/scrape: "true"
      prometheus.io/port: "9983"
These annotations assume that your Prometheus instance is configured to look for the default annotations on Kubernetes services. If you have changed these then adjust the annotations accordingly.
We can then regenerate our solr.yaml file with the following command:
helm template --name "solr" . --values solr_exporter.yaml > solr.yaml
Applying the new template shows us that a new deployment and service have been created:
kubectl apply -f solr.yaml
poddisruptionbudget.policy "solr-zookeeper" unchanged
service "solr-zookeeper-headless" unchanged
service "solr-zookeeper" unchanged
statefulset.apps "solr-zookeeper" configured
statefulset.apps "solr" configured
configmap "solr-config-map" unchanged
poddisruptionbudget.policy "solr" unchanged
service "solr-exporter" created
deployment.apps "solr-exporter" created
service "solr-headless" unchanged
service "solr-svc" unchanged
And we can see that we now have a solr-exporter pod running:
kubectl get po -l "app=solr,component=exporter"
NAME                             READY     STATUS    RESTARTS   AGE
solr-exporter-5c8d77d658-47jbp   0/1       Running   5          4m
Looking in Prometheus, we can now see that we have metrics from Solr, for example viewing the number of documents in each shard we can see:
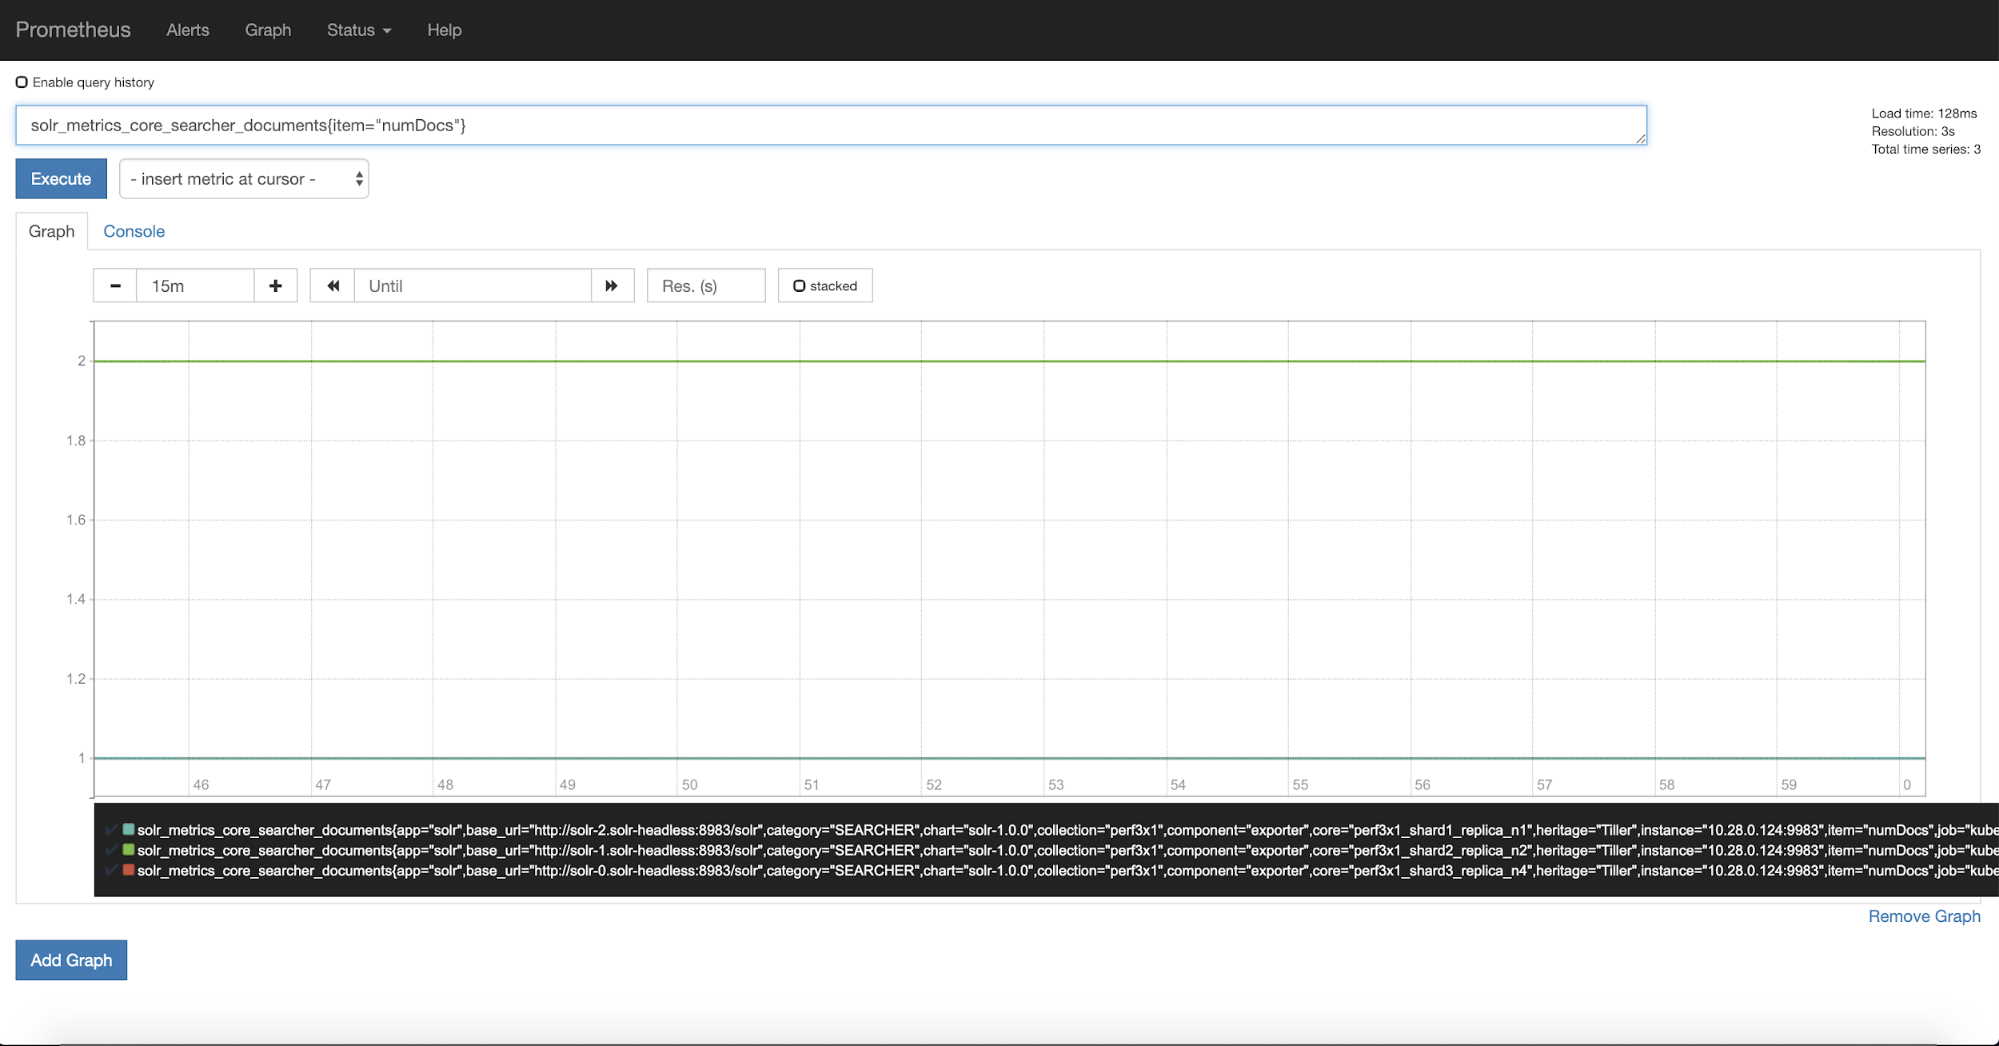
There are a staggering number of metrics that the exporter provides, nearly 1400 for a three node cluster with a single collection. It can be difficult to know which metrics are important and to see how they are related. Thankfully there is a Grafana dashboard that Solr provides that allows us to see the most important metrics over time.
To use this dashboard you will need to have an instance of Grafana installed, pointing to Prometheus as one of its data sources. There is a helm chart that can help with the installation of Grafana here: https://github.com/helm/charts/tree/master/stable/grafana.
Once Grafana is running you can import the Grafana chart from here: https://github.com/apache/lucene-solr/blob/master/solr/contrib/prometheus-exporter/conf/grafana-solr-dashboard.json by going Create -> Import and then pasting the JSON.
The dashboard will then look something like:
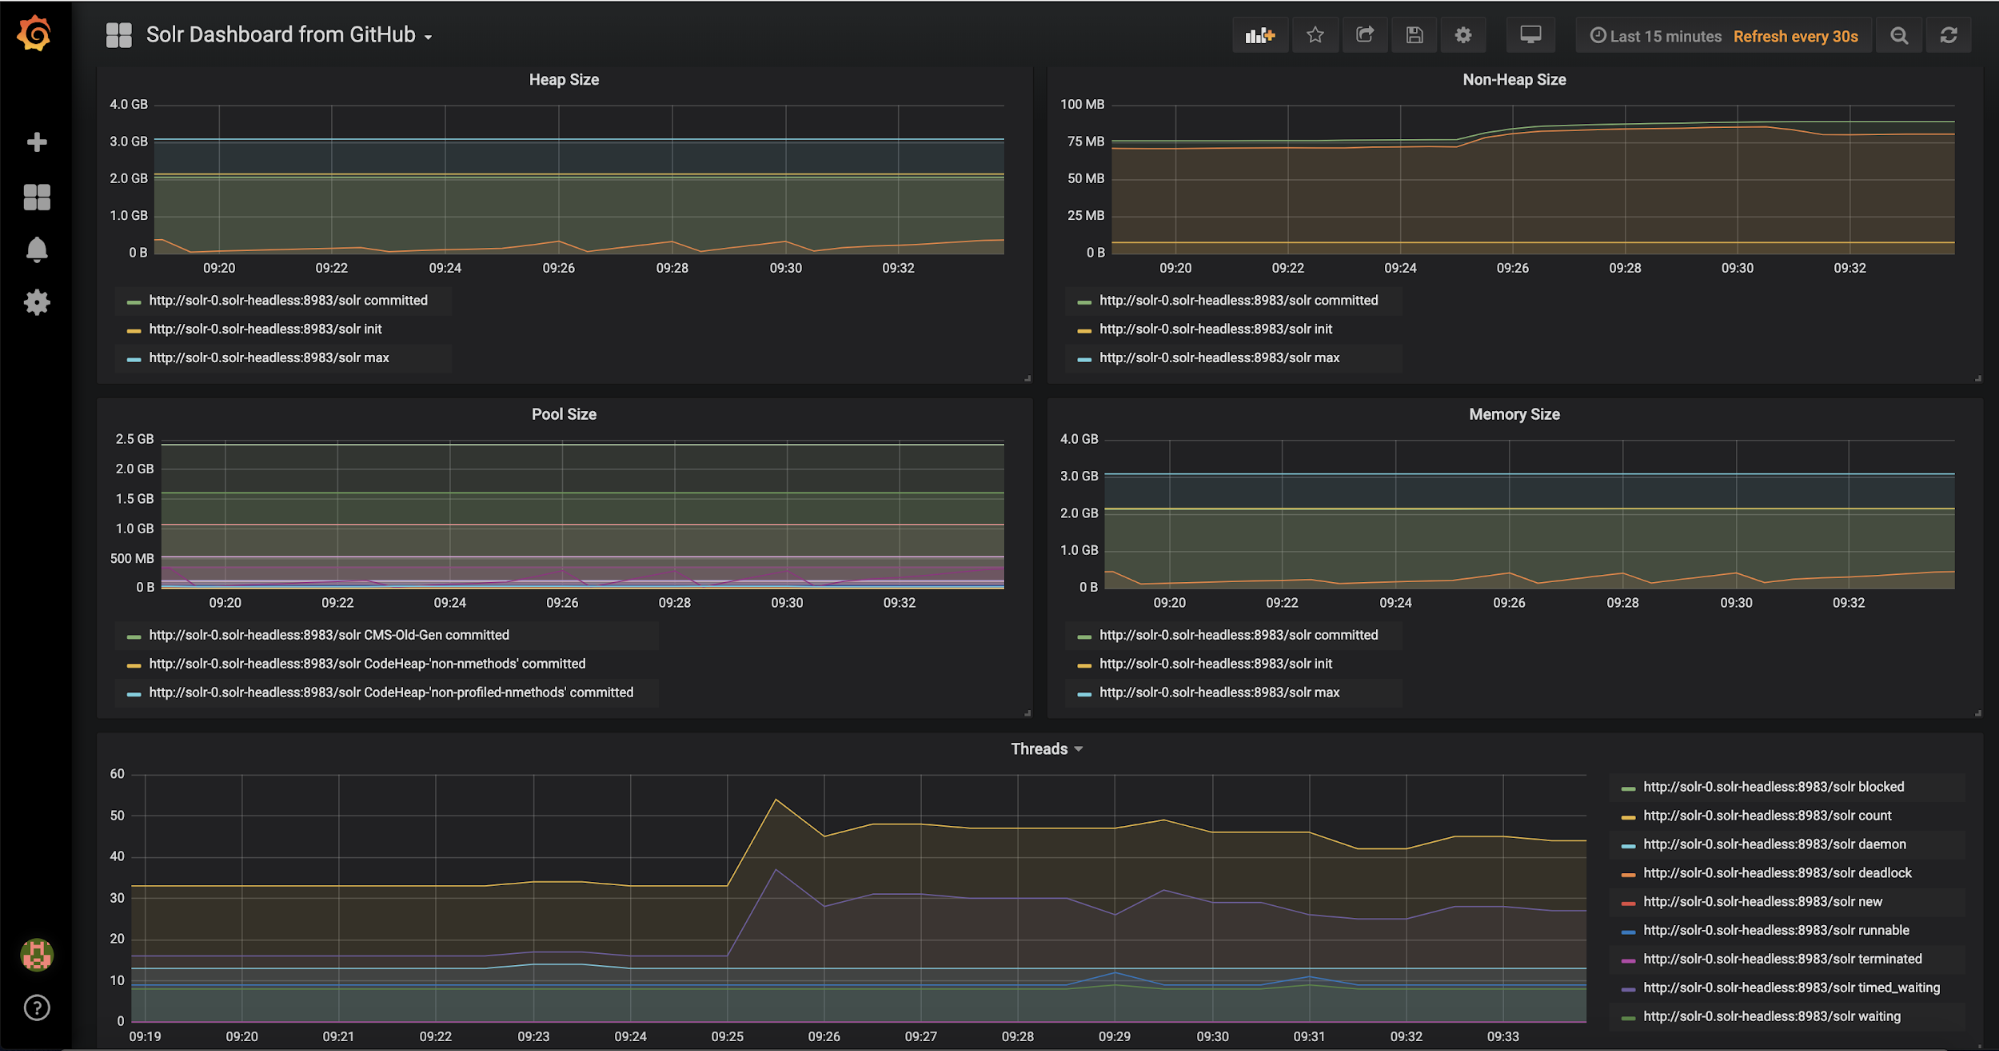
There are a number of filters at the top that can restrict the cores, collections, or replicas that can be viewed. Have a play and see what it tells you about your Solr instance.
Encrypting Traffic Between Solr Instances Using TLS
To encrypt traffic between the Solr instances we need to generate a private key, CSR, and then sign the CSR. We will be using the Kubernetes CA cert to sign our CSR.
For this we will be using the cfssl utility (https://github.com/cloudflare/cfssl), follow the installation instructions to set this up.
First, we need to generate a certificate for the hosts in our Solr cluster, so create a file called ssl_config.json with the contents:
{
    "hosts": [
        "solr-svc.default.svc.cluster.local",
        "solr-0.solr-headless.default.svc.cluster.local",
        "solr-0.solr-headless",
        "solr-1.solr-headless.default.svc.cluster.local",
        "solr-1.solr-headless",
        "solr-2.solr-headless.default.svc.cluster.local",
        "Solr-2.solr-headless"
    ],
    "key": {
        "algo": "rsa",
        "size": 2048
    }
}
From this configuration, we can then generate a private key and csr by running:
cfssl genkey ssl_config.json | cfssljson -bare server
This will create server-key.pem and server.csr files in your working dir. We then get Kubernetes to sign our csr. More detailed information on this is given here: https://kubernetes.io/docs/tasks/tls/managing-tls-in-a-cluster/, but for now we can run:
export MY_CSR_NAME="solr-certificate"
cat <<EOF | kubectl apply -f -
apiVersion: certificates.k8s.io/v1beta1
kind: CertificateSigningRequest
metadata:
  name: ${MY_CSR_NAME}
spec:
  groups:
  - system:authenticated
  request: $(cat server.csr | base64 | tr -d '\n')
EOF
We can now see the CSR in a pending state in Kubernetes:
kubectl get csr
NAME               AGE       REQUESTOR                      CONDITION
solr-certificate   1m        <requestor_username>           Pending
We can then approve the certificate:
kubectl certificate approve solr-certificate
certificatesigningrequest.certificates.k8s.io "solr-certificate" approved
The CSR has now been approved as we can see by running:
kubectl get csr
NAME               AGE       REQUESTOR                      CONDITION
solr-certificate   4m       <requestor_username>       Approved,Issued

kubectl get csr solr-certificate -o jsonpath='{.status.certificate}' | base64 --decode > server-cert.pem
We can then create a Kubernetes secret containing the certificate and the private key.
kubectl create secret tls solr-certificate --cert server-cert.pem --key server-key.pem
Now we configure solr to use this certificate, first we recreate the solr.yaml:
helm template --name "solr" . --set tls.enabled=true,tls.certSecret.name=solr-certificate,tls.importKubernetesCA=true > solr.yaml
And then apply the template
kubectl apply -f solr.yaml
Solr is now running using a self signed certificate, to test this we can port forward Solr:
kubectl port-forward solr-0 28983:8983
Visiting https://localhost:28983 will give us access to the Solr nodes, albeit with a certificate error as we haven’t trusted the Kubernetes ca.
In order to setup TLS, the Solr nodes have an init container configured that creates a keystore containing the private key and certificate from the configured secret. A truststore is also setup that imports the Kubernetes ca, or another ca from a secret, and configures Solr to use this truststore.
Wrap Up
If you stayed with us to this point, then give yourself a pat on the back! You should have a firm understanding of how to deploy and operate Solr in Kubernetes. In the second part of this series, we’ll dig deeper into auto-scaling tasks like adding replicas in response to increased query traffic, as well as running load tests on bigger datasets. For now, please try out the Solr Helm chart (https://github.com/lucidworks/solr-helm-chart or https://github.com/helm/charts) and let us know how it goes. Lastly, since we threw a lot of commands at you here is a cheat sheet to help with common tasks:
Command |
Notes |
|---|---|
gcloud container clusters get-credentials <cluster> |
Update kubectl config to connect to the GKE cluster named <cluster> |
gcloud container clusters describe <cluster> |
Get details about your GKE cluster |
kubectl config current-context |
See which cluster kubectl is configured to send commands to |
gcloud config list |
See your current GCloud config settings |
kubectl create clusterrolebinding cluster-admin-binding --clusterrole=cluster-admin --user=$(gcloud config get-value core/account) |
Get your current user cluster admin privileges |
helm template . --name solr > solr.yaml |
Generate the K8s manifest file locally from a Helm chart |
helm template . --set key=value ... |
Override a Helm chart config property when generating the template |
helm lint solr.yaml |
Run the Helm linter on a manifest |
kubectl apply -f solr.yaml |
Apply the k8s manifest to the cluster; k8s performs a diff and only applies changes |
kubectl get pods |
Get a list of pods from the default namespace |
kubectl get pods -l app=solr |
Get a list of pods using a label selector, such as app=solr |
kubectl logs <pod> |
Log from the pod named <pod> |
kubectl port-forward solr-0 28983:8983 |
Setup a port forward for local port 28983 to the solr-0 pod port 8983 |
kubectl get service <svc> -o |
Get the external IP address for a |
jsonpath='{.status.loadBalancer.ingress[0].ip}'
|
LoadBalancer service named <svc> |
kubectl exec -it solr-0 --container solr -- /bin/bash |
Get a BASH shell on the solr-0 pod |
kubectl describe po <pod> |
Get details about a specific pod named <pod> |
kubectl get pods -o wide |
Get a list of pods with more details, such as the nodeName |
kubectl delete po <pod> --force --grace-period 0 |
Forcefully kill a pod named <pod>; be careful with this! |
kubectl get svc -l app=solr |
Get a list of services with label app=solr; use any valid label selector |
gcloud auth configure-docker |
Allow your GCloud user to upload Docker images to your GKE cluster |
kubectl apply -f install/kubernetes/helm/helm-service-account.yaml helm init --service-account tiller |
Install Tiller component of Helm on your GKE cluster |
Be sure to check out these resources as well:
To learn more about building intent-driven search with Fusion on Kubernetes, contact us today.
LEARN MORE
Contact us today to learn how Lucidworks can help your team create powerful search and discovery applications for your customers and employees.