SOCIAL DISTANCING & THE CITY
How could our cities facilitate social distancing?
As countries take their first tentative steps towards loosening COVID-19 lockdown, society faces the difficult task of putting social distancing rules into practice.
With growing numbers returning to city streets, it is clear that public space (or lack of it) can hamper our ability to keep a safe distance.
The Social Distancing Dashboard is stepping up to this challenge.
It offers an overview of different factors affecting our ability to respect social distancing rules.
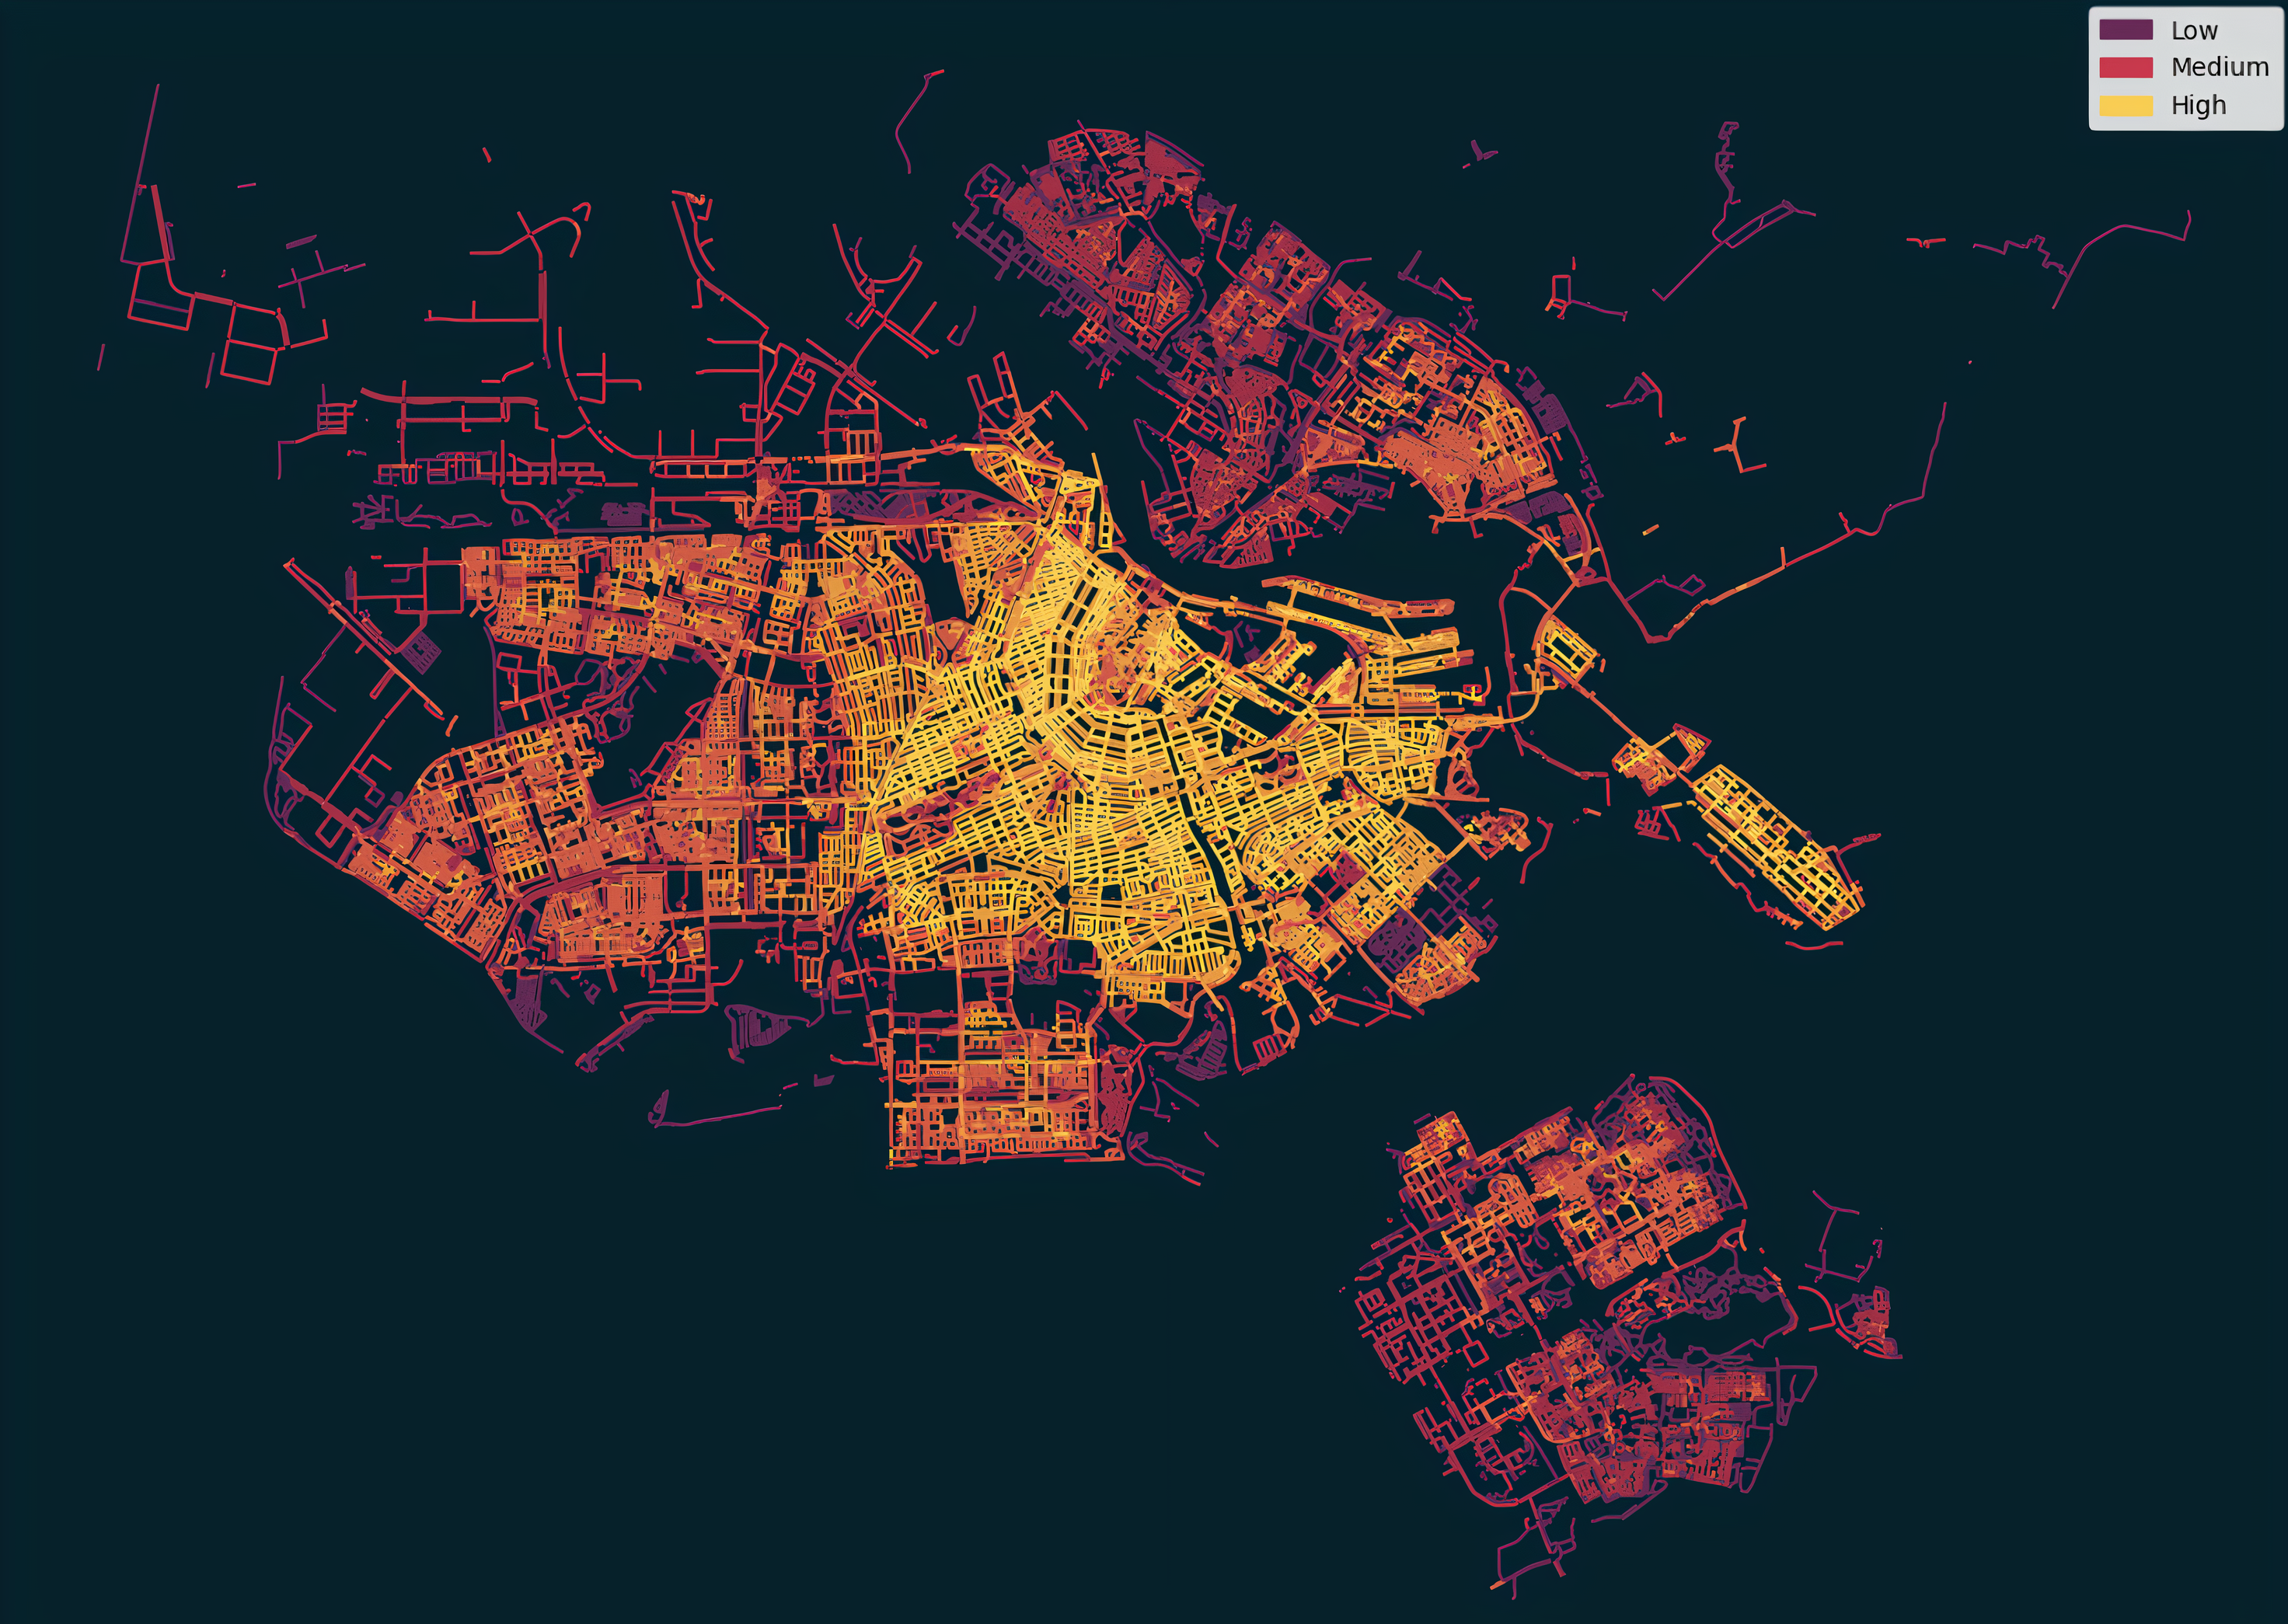
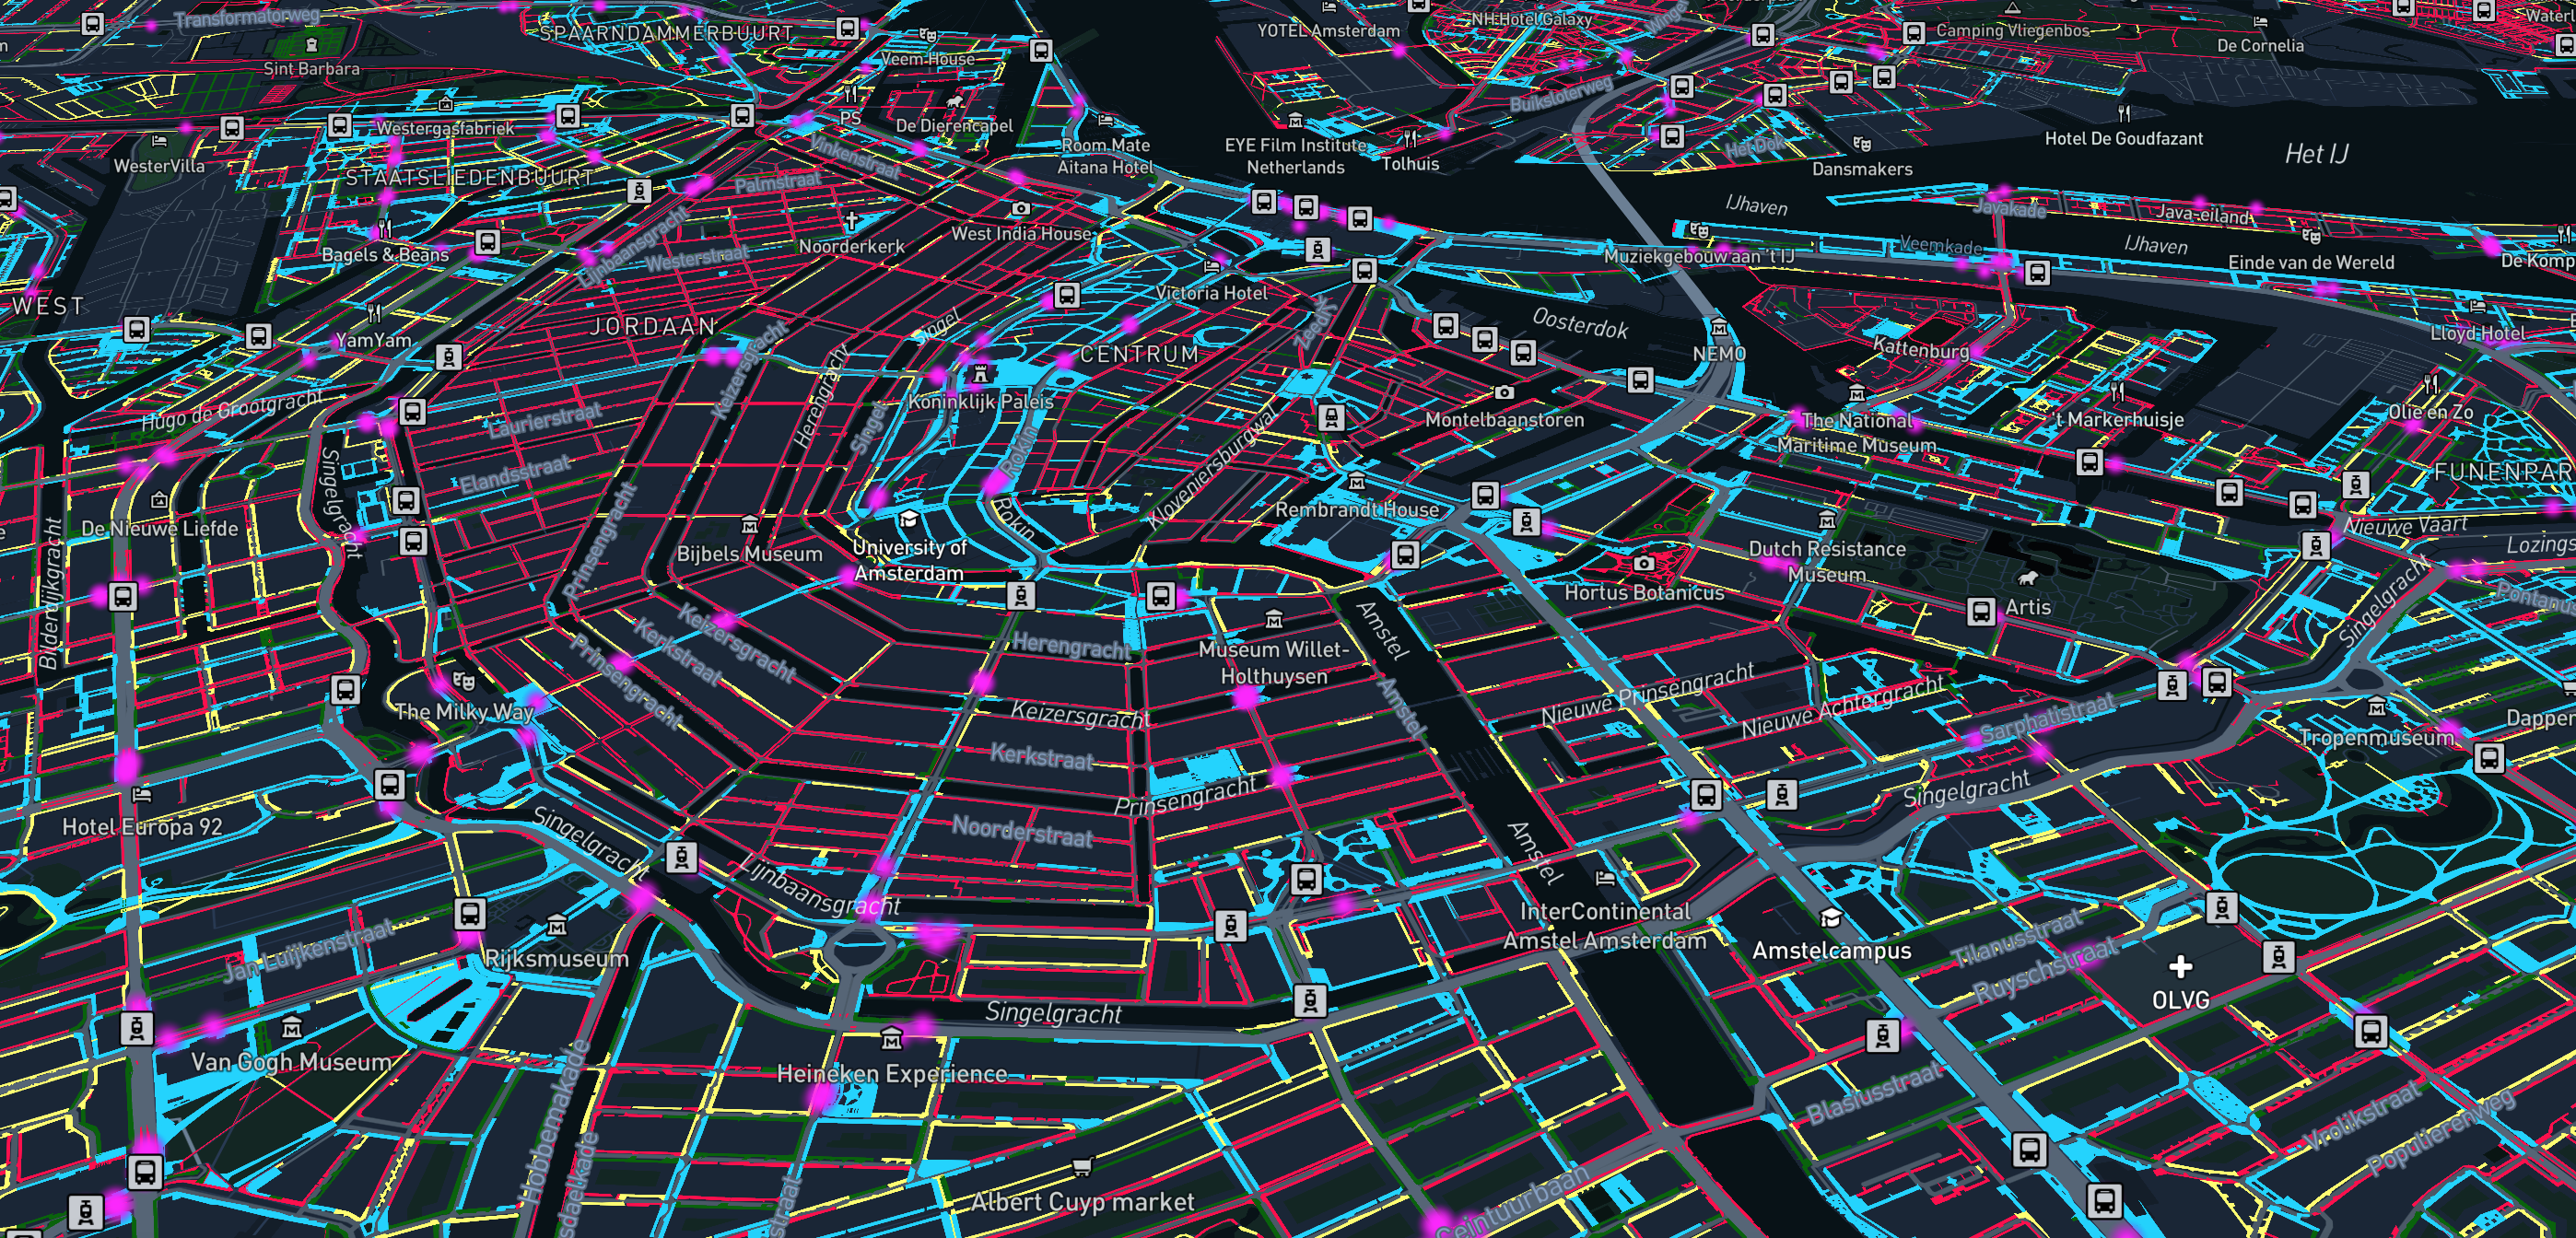
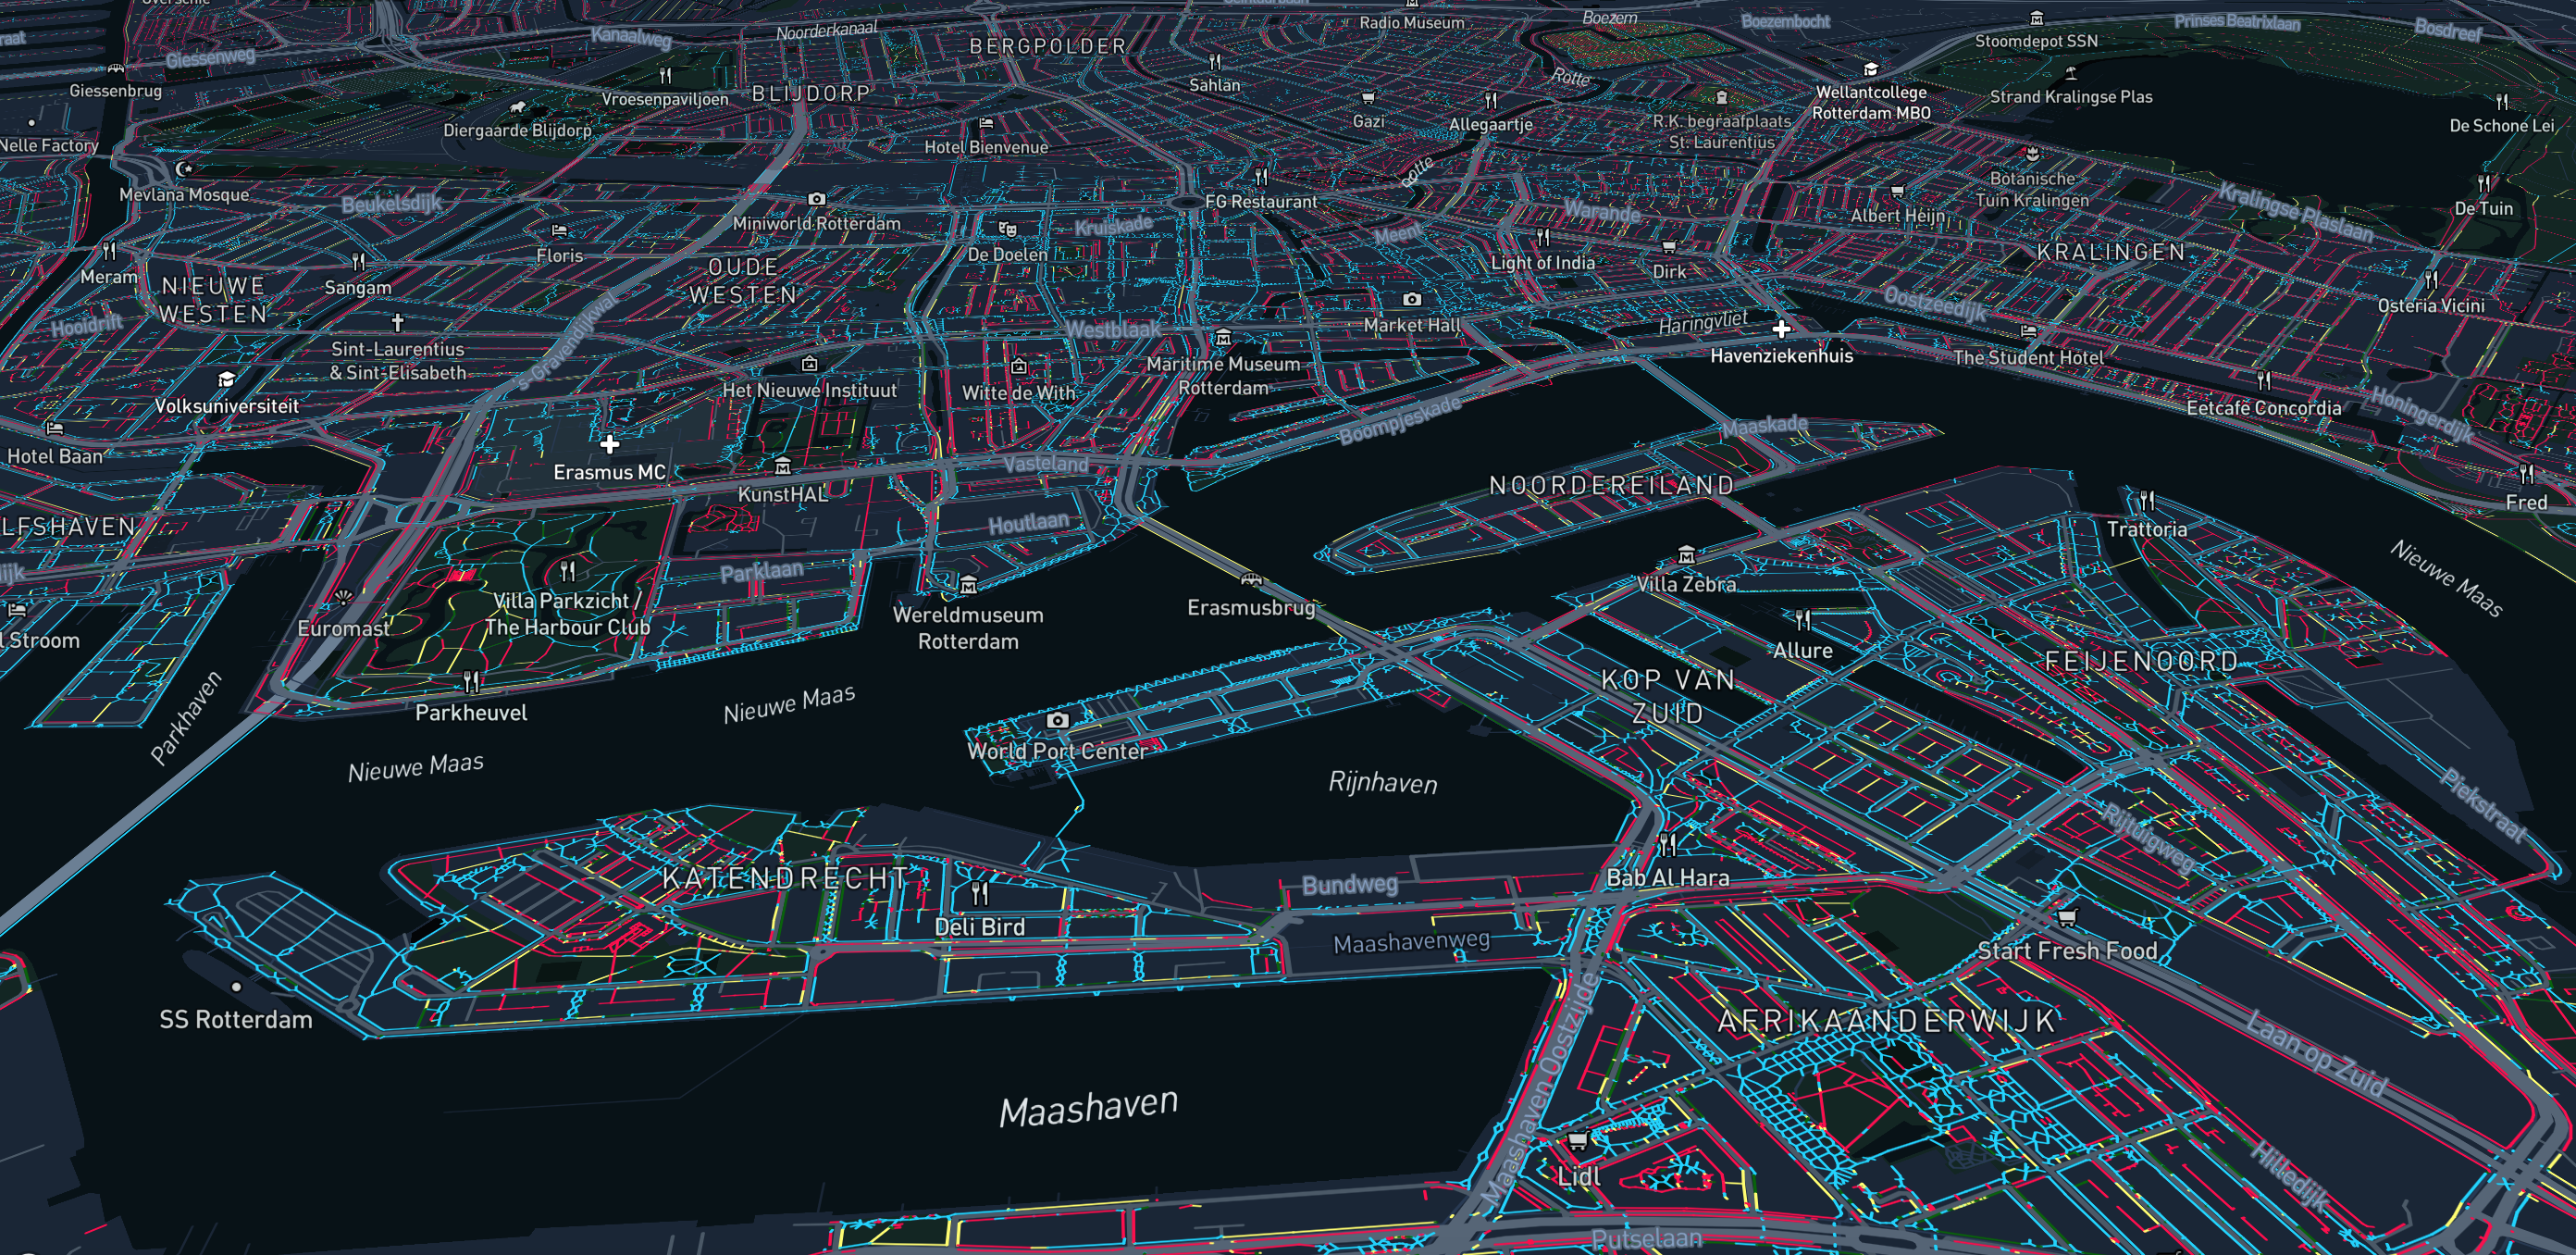
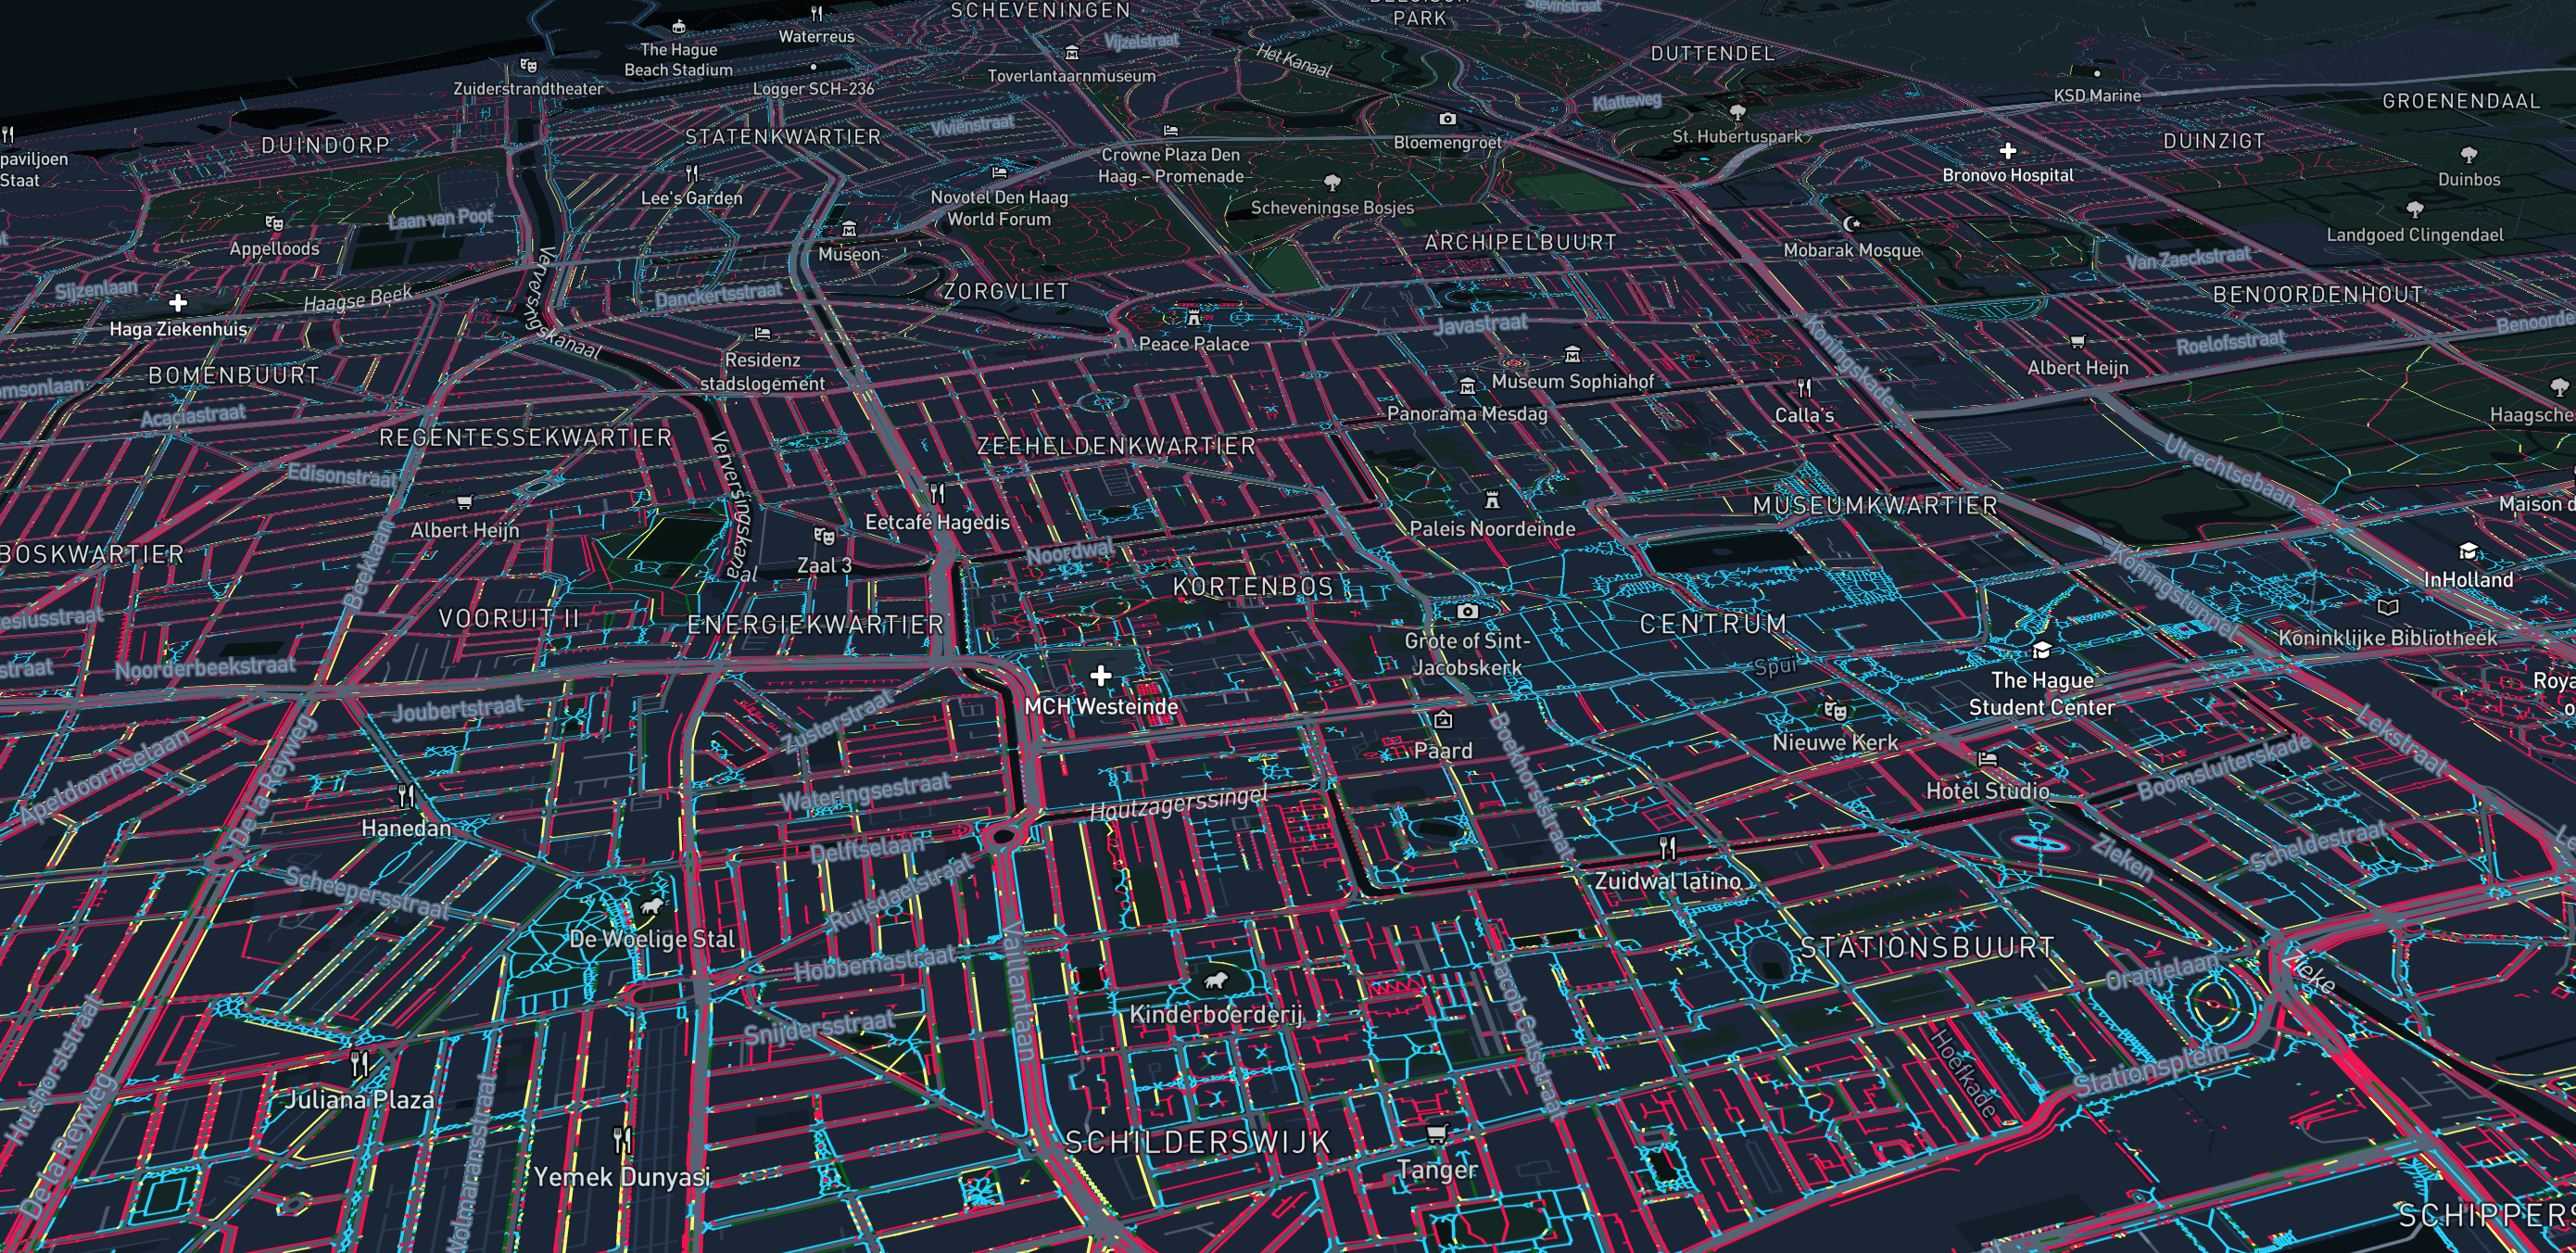
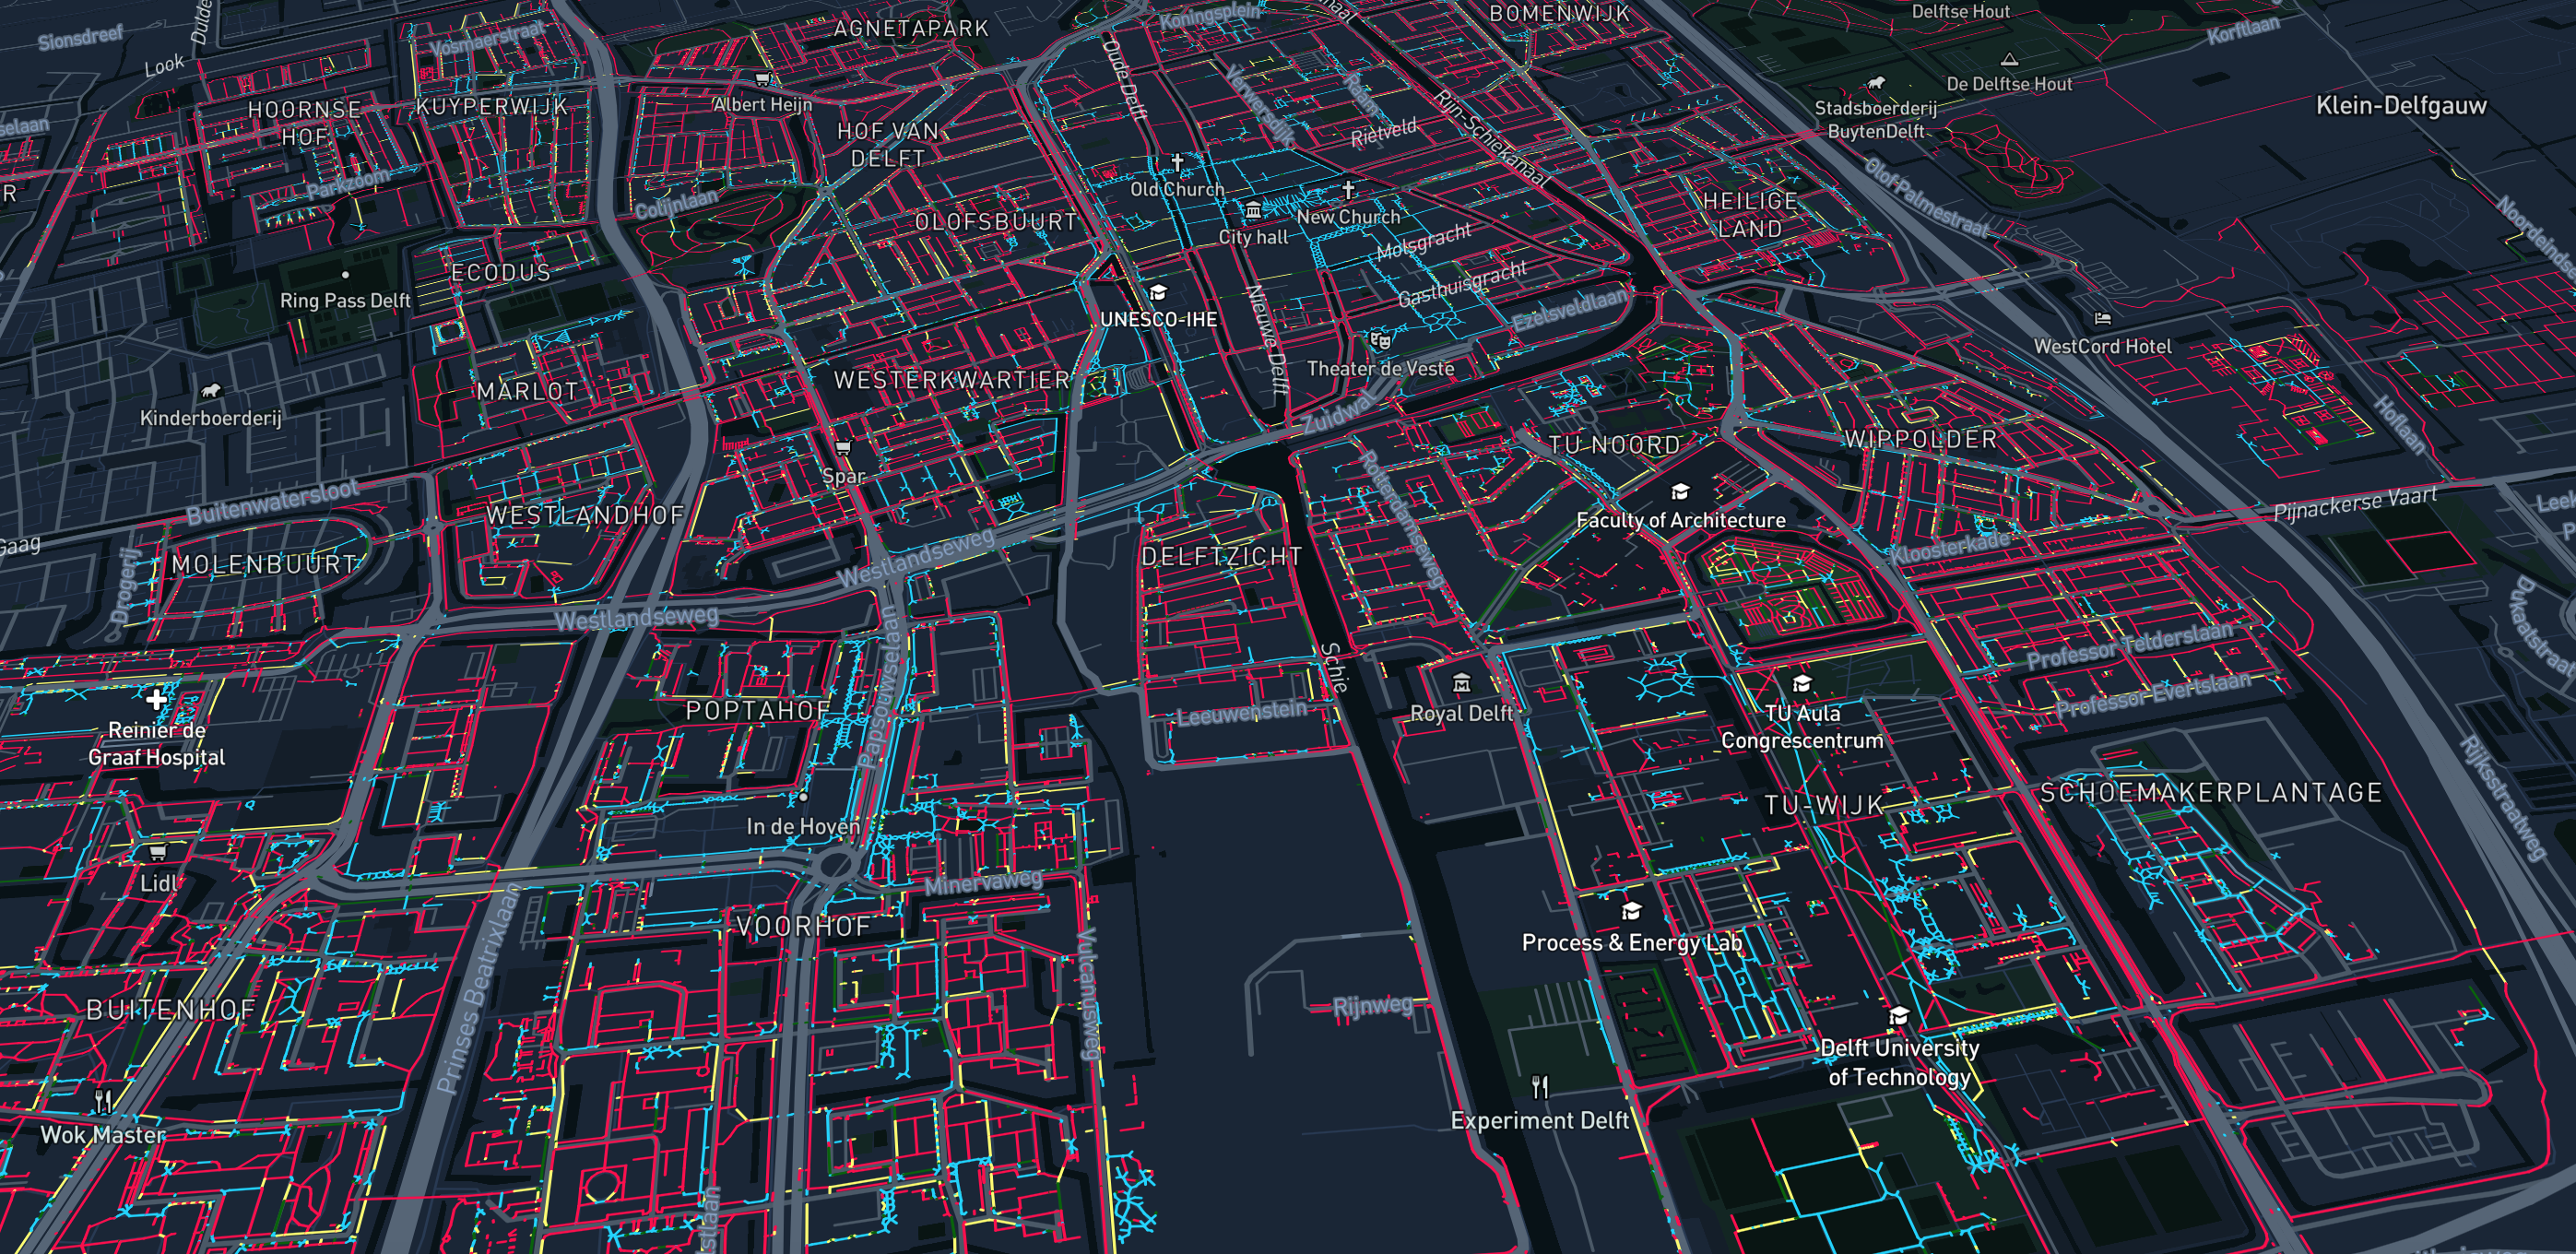
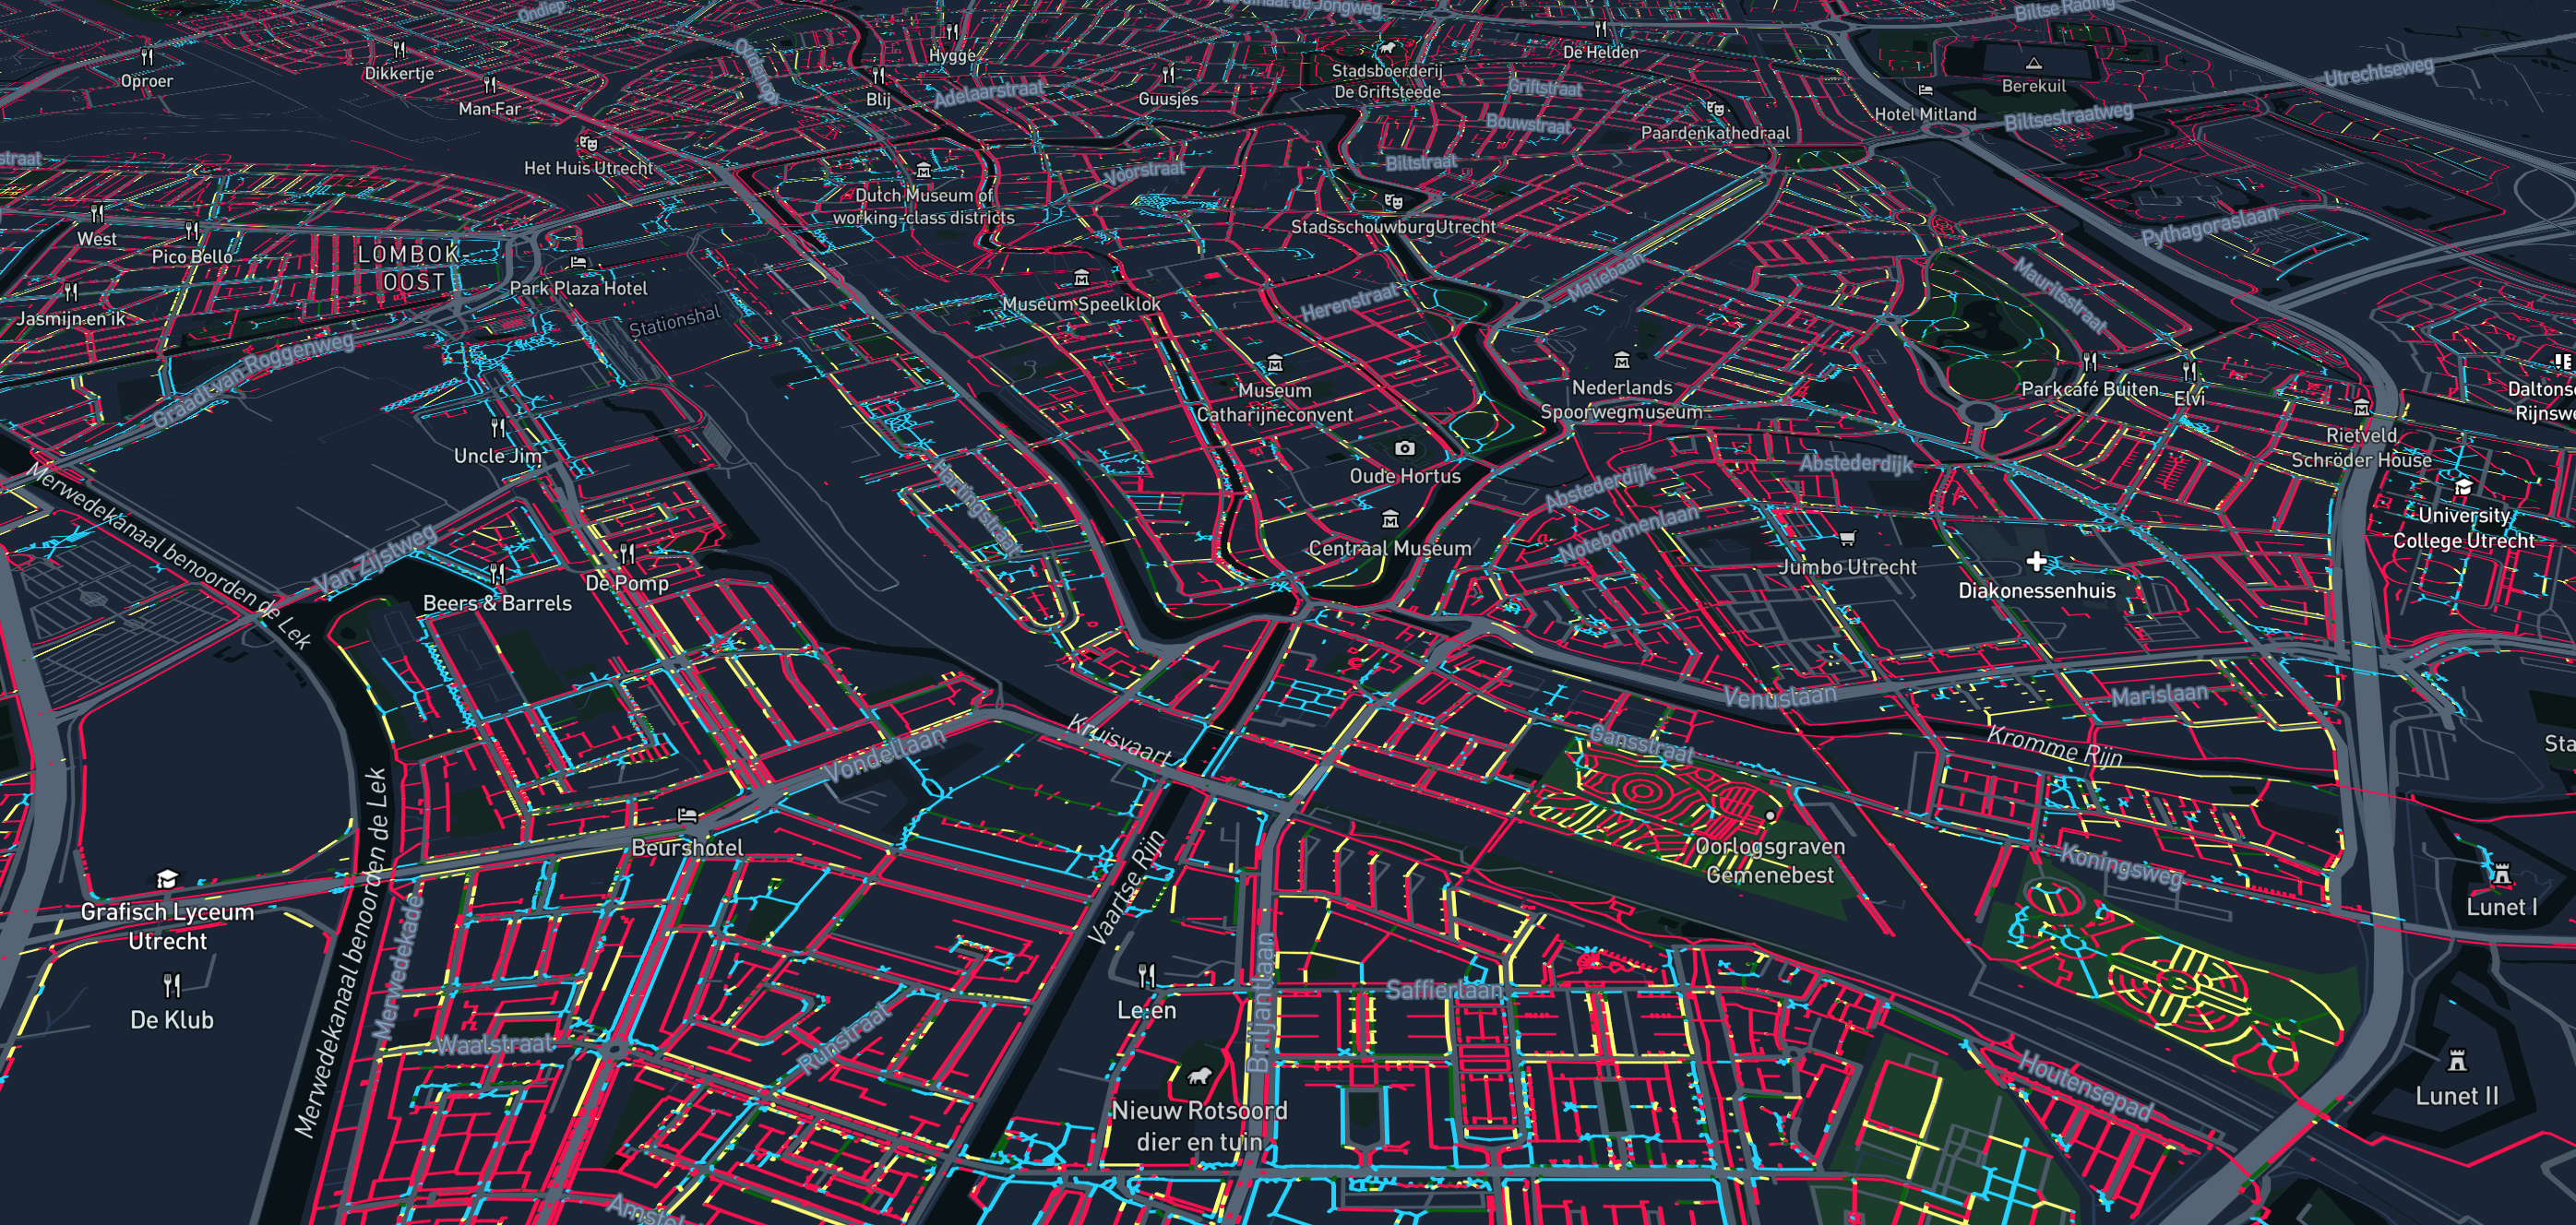
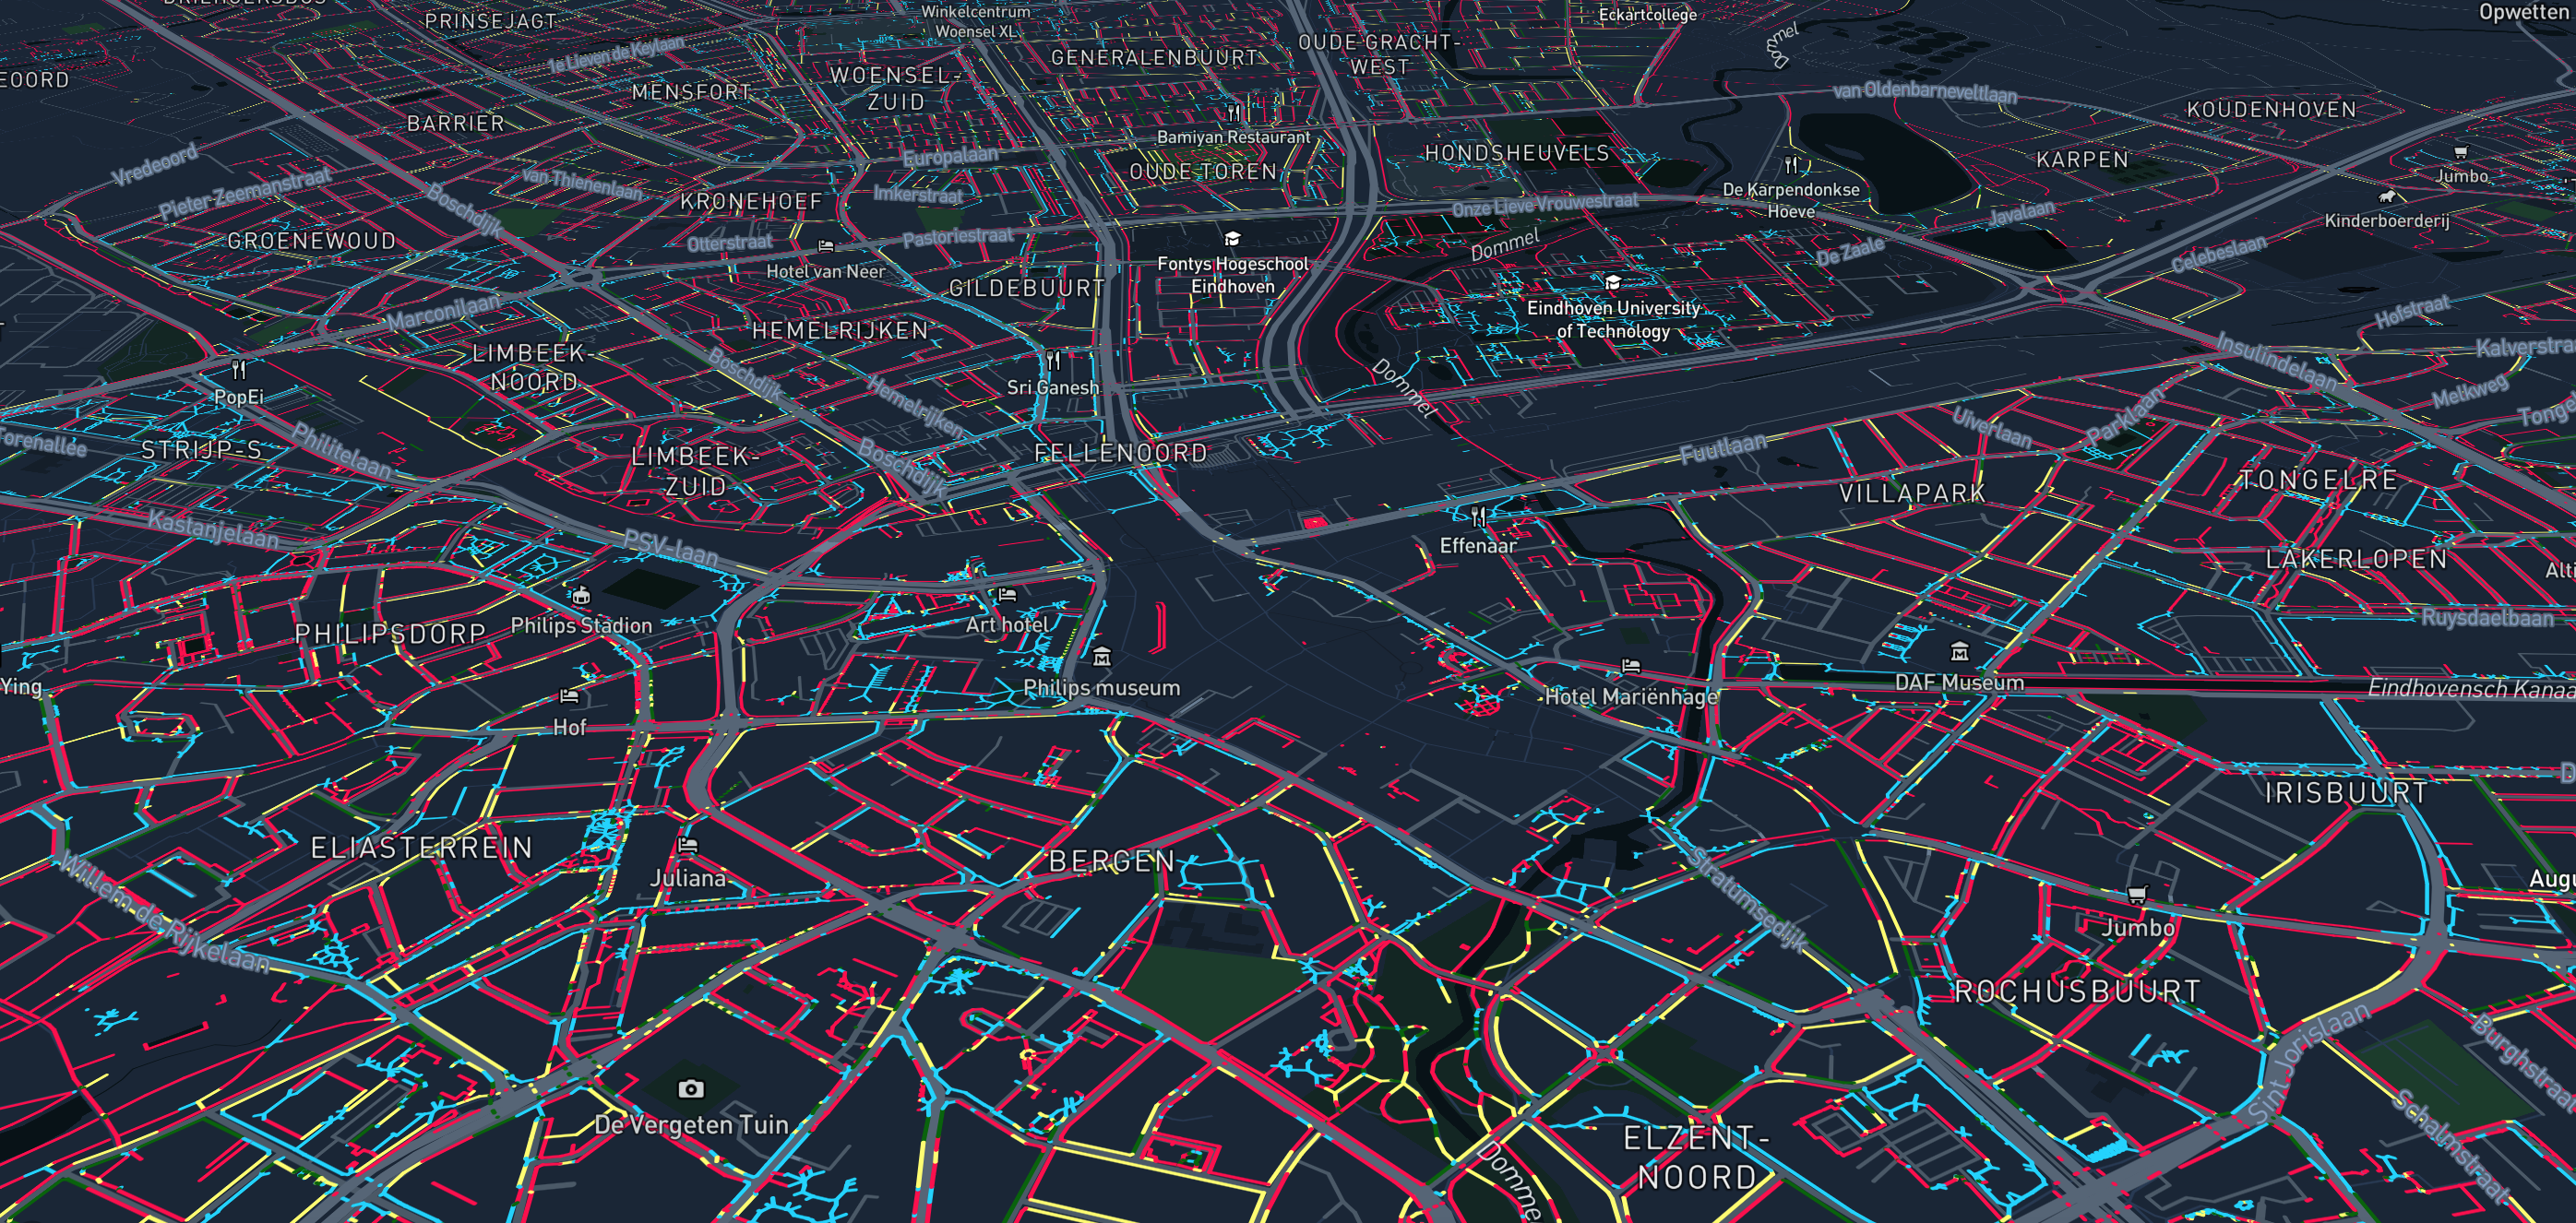
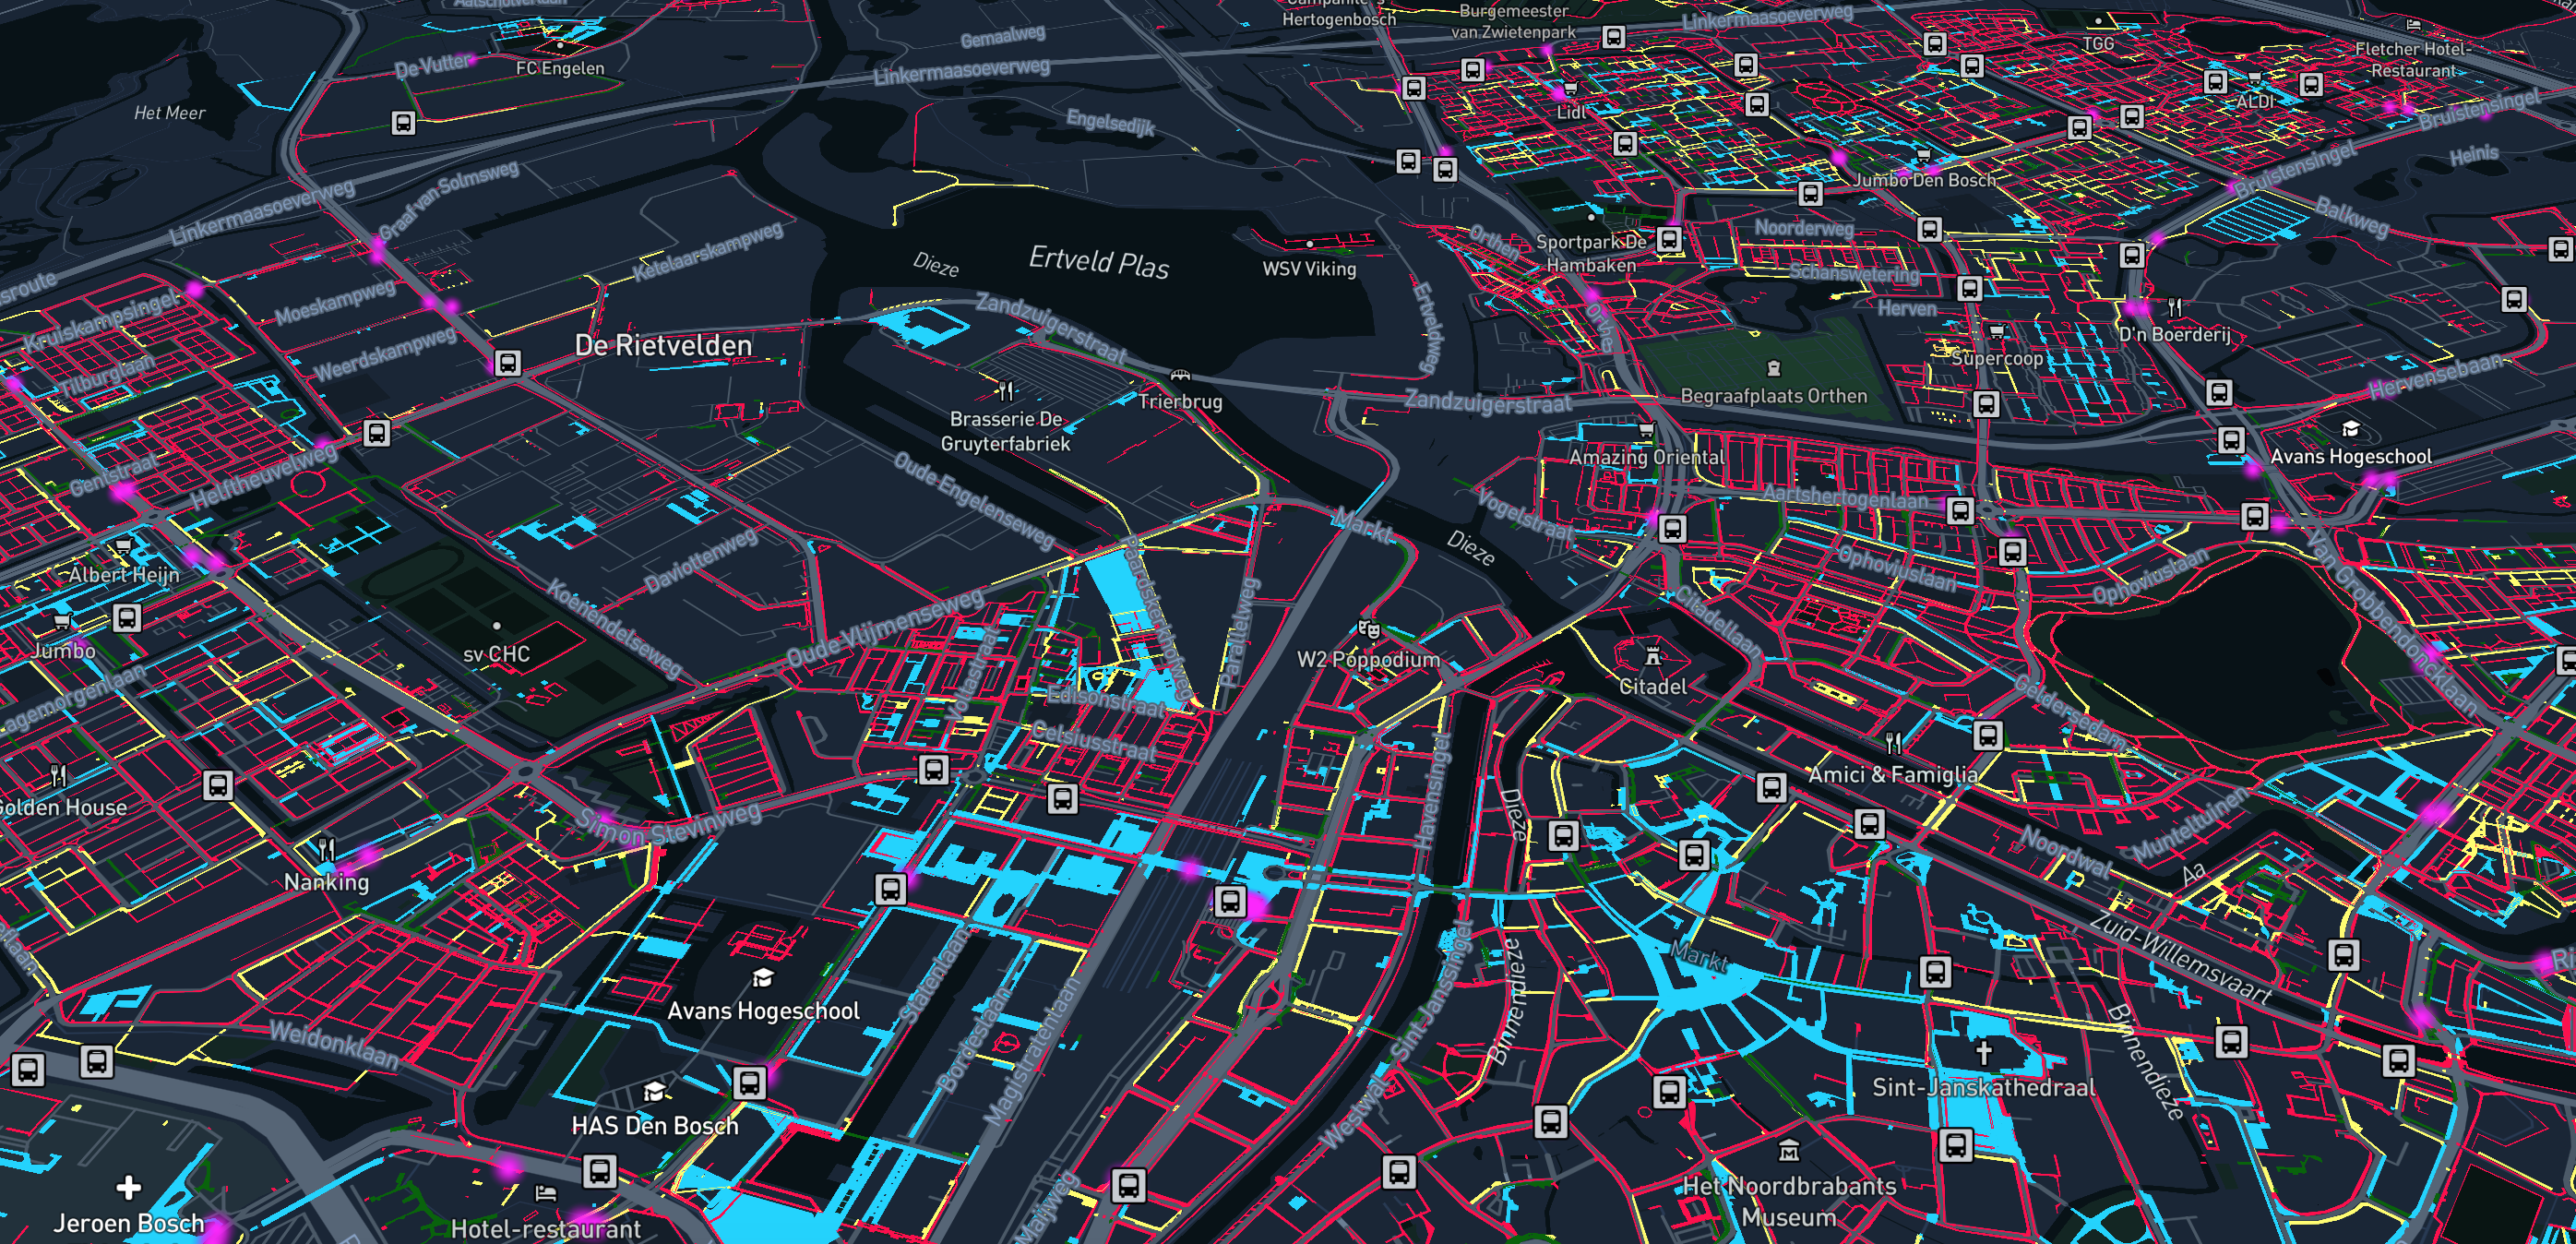
By developing high-resolution maps, we are highlighting detailed information relevant to social distancing in an urban setting – such as the width of the footpath and the location of bus stops and other transport hubs.
The resulting dynamic and color-coded maps are available for use by policymakers, charged with making decisions on public health,
and city planners, tasked with making COVID-19 related interventions in the urban space.
The dashboard is also relevant to city residents – especially those in risk groups – who want to navigate the city streets as safely as possible.
Find out more in our latest article in Urban Studies Journal
Does the way we design, build, and use cities influence the spread and containment of airborne diseases like COVID19? How could the configuration of the street network, pedestrian movement, and human activities along streets impact our exposure to infectious viruses?
To look at these questions, a collaboration between researchers from TU Delft (Achilleas Psyllidis, Roos Teeuwen, Alessandro Bozzon) and MIT Senseable City Lab (Fábio Duarte, Arianna Salazar Miranda, Tom Benson) was formed.
The result of this collaboration is documented in a scientific article, published in Urban Studies, titled: “Cities and infectious diseases: Assessing the exposure of pedestrians to virus transmission along city streets”.
Data Sources
Basisregistratie Grootschalige Topografie (BGT)
The digital map of the Netherlands. It contains the digital layout of the physical environment, including building, roads, waterways, terrains and railway lines. The map is accurate to 20 centimetres.
Centraal Bureau voor de Statistiek (CBS)
The Dutch statistical office provides the District and Neighborhood Map (2019), an up-to-date version of the digital geometry of the boundaries of Dutch neighborhoods, districts and municipalities.
Open Street Map
(OSM)
Open Street Map is a collaborative project. It contains the digital layout of the physical environment, and the geo-location and description of several Points of Interest (POI) types, e.g. public transport hubs.
Methodology
Sidewalk Width and the measures against SARS-CoV-19
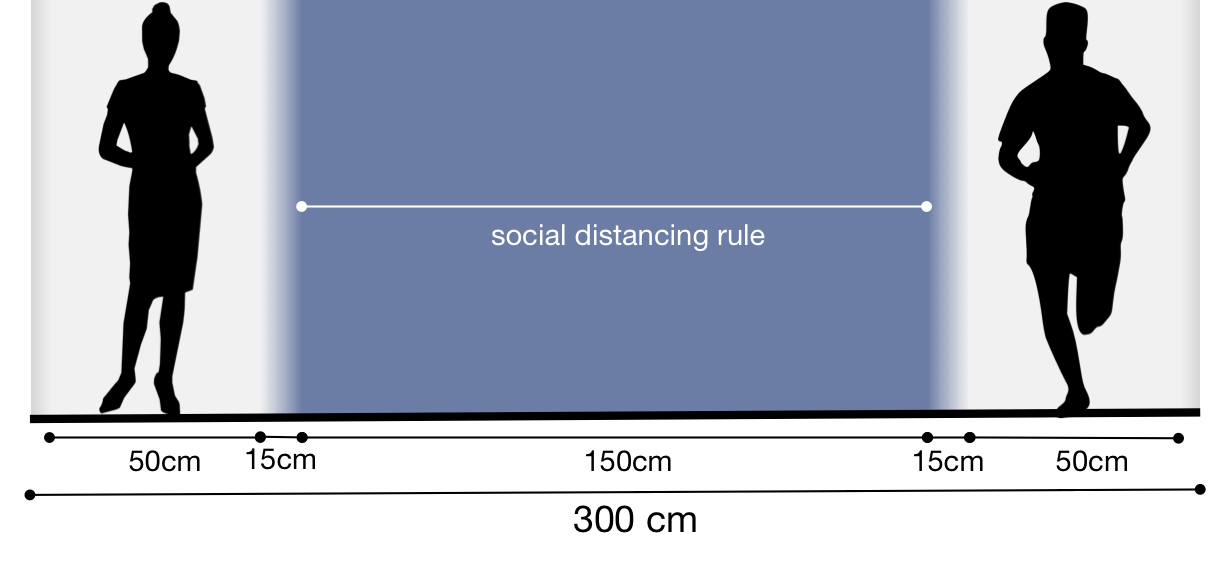
The Dutch measures against coronavirus include a recommendation to keep at least 1.5 meters distance from other people.
To calculate the risk profile of a sidewalk’s segment, we assumed that a person occupies 50 cm, allowing 15 cm of comfort space from each side. To allow for two people to walk side-by-side on the sidewalk (either in the same or opposite directions), a sidewalk should be between 2.5 meters and 3 meters wide.

Sidewalk Width Calculation (Centerlines)
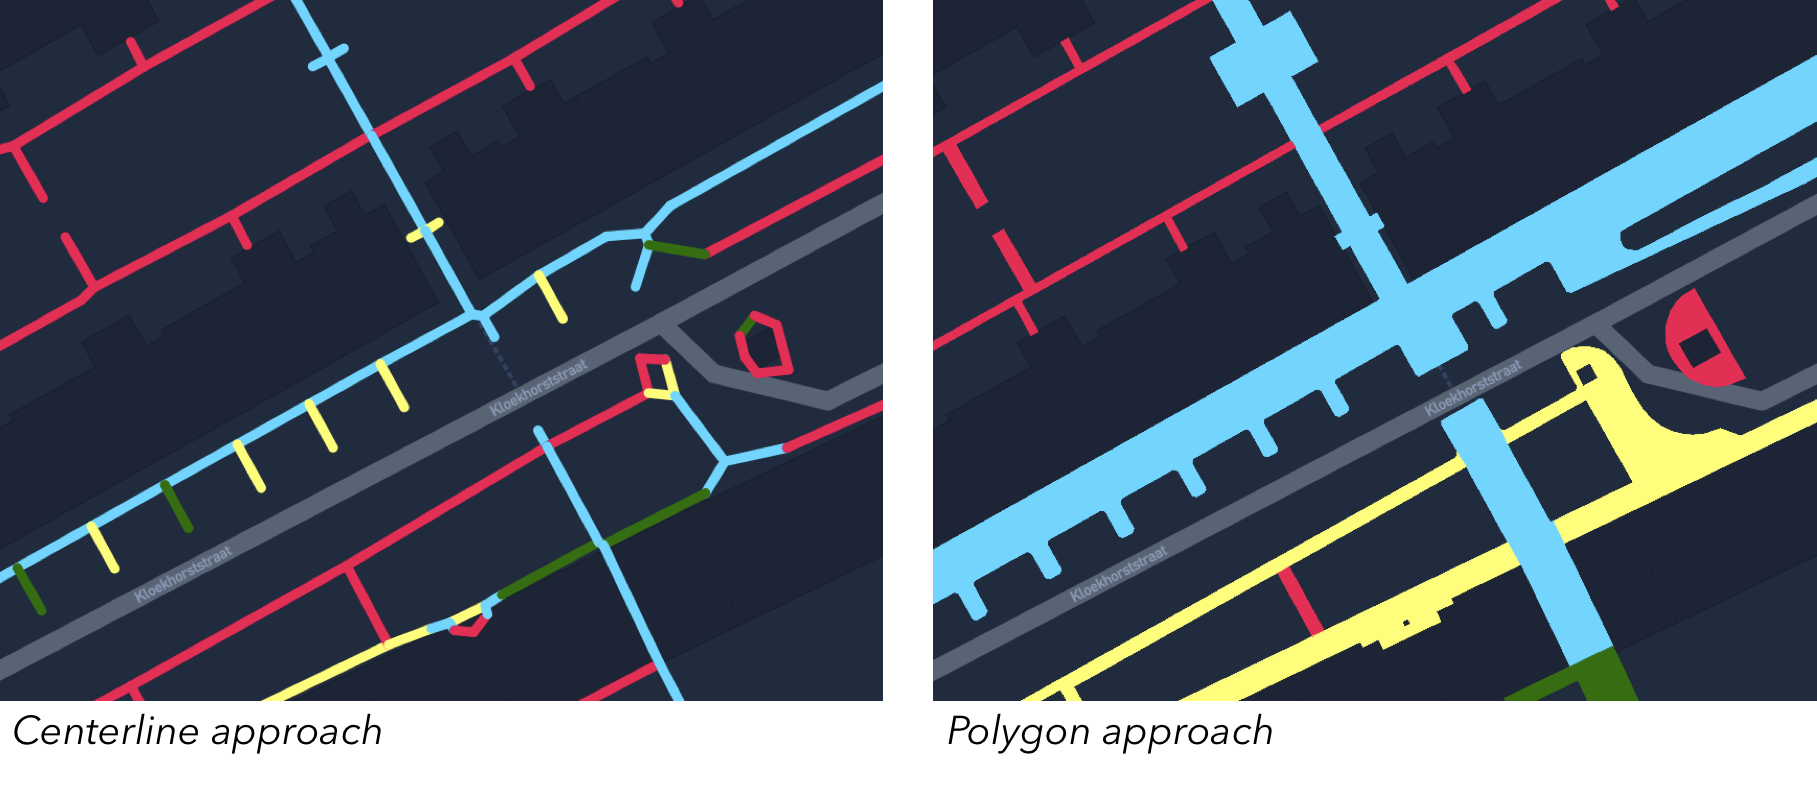
We extended the method developed by Amelia Harvey for New York City sidewalks and processed the Basisregistratie Grootschalige Topografie (BGT) data. We extracted the road (wegdeel) geometries with footpad function (function=voetpad“). This, in general, excludes surfaces occupied by trees and vegetation. The resulting dataset contains the centerline of each sidewalk, together with information about its width.
Sidewalk Width Calculation (Polygons)
We further processed the Basisregistratie Grootschalige Topografie (BGT) data. This time, we used the polygon geometries with both “function=voetpad” and “function=voetgangersgebied”. Then, for each polygon geometry, we calculated the average width of all its parts. This calculation results in a dataset of polygons. These polygons maintain their original BGT shapes, which are in general closer to reality, and are color-coded based on their average width in meters.
Data from BGT are processed automatically, so the computation of sidewalk width might contain some mistakes.
Sidewalk Profile
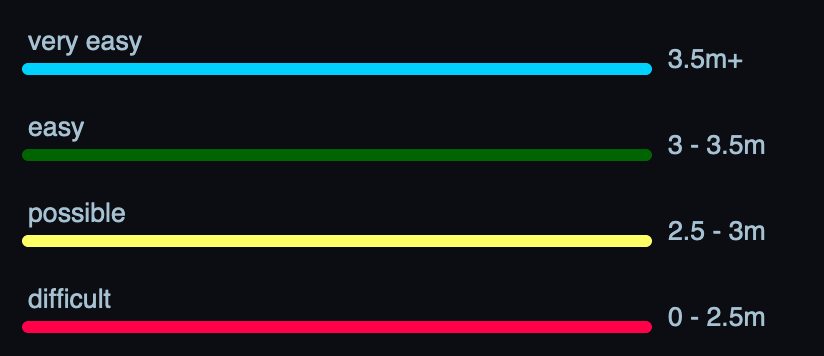
Sidewalks are classified into 4 categories:
- Width is greater than 3.5m – social distancing is Very Easy
- Width is between 3m and 3.5m – social distancing is Easy
- Width is between 2.5m and 3m – social distancing is Possible, but side-by-side walking is not recommended.
- Width is smaller than 2.5m – social distancing is Difficult.
The associated profile might not reflect the current status of mobility in the analyzed city. As a response to social distancing regulations, several cities have already deployed interventions like closing streets to traffic, thus widening the space available to pedestrian.
The associated profile might not reflect the actual situation in the real-world. Sidewalks where social distancing is very easy can get crowded!
Public Transport Modalities (Bus, Metro, Train, Tram)
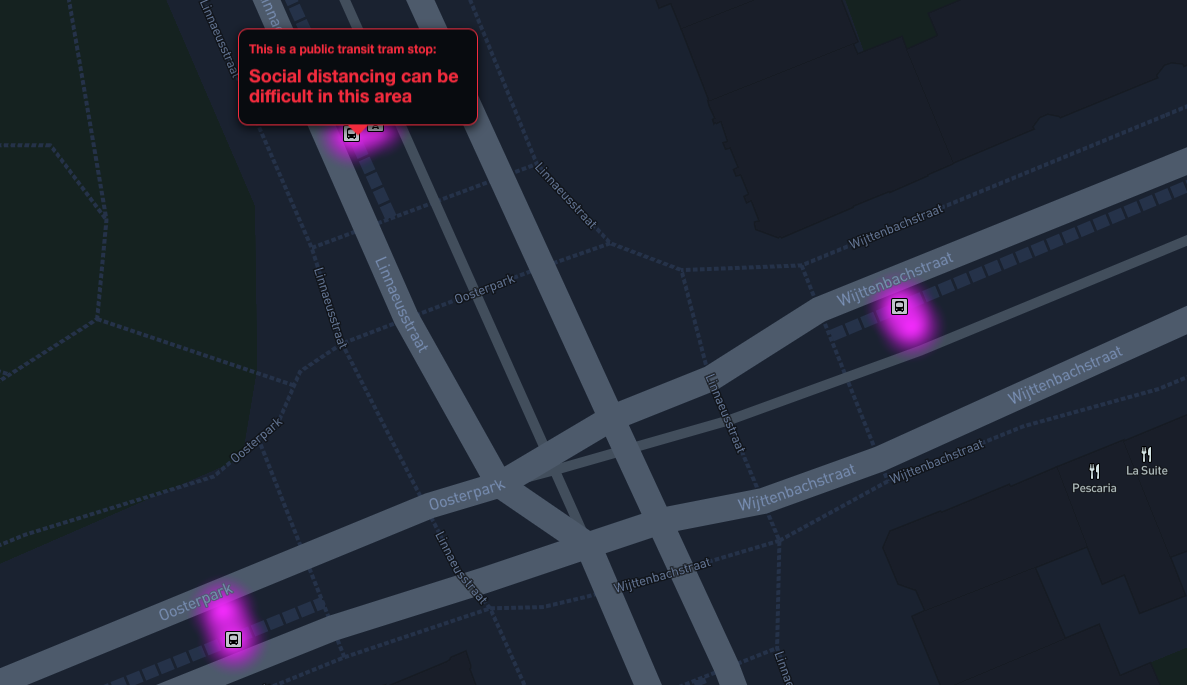
As crowdedness is a major risk factor, public transport hubs constitute inevitably an issue for social distancing.
Using POIs from OpenStreetMap, we enrich the map with the location of bus stops, metro stops, tram stops, and train stations.
Pedestrian Areas
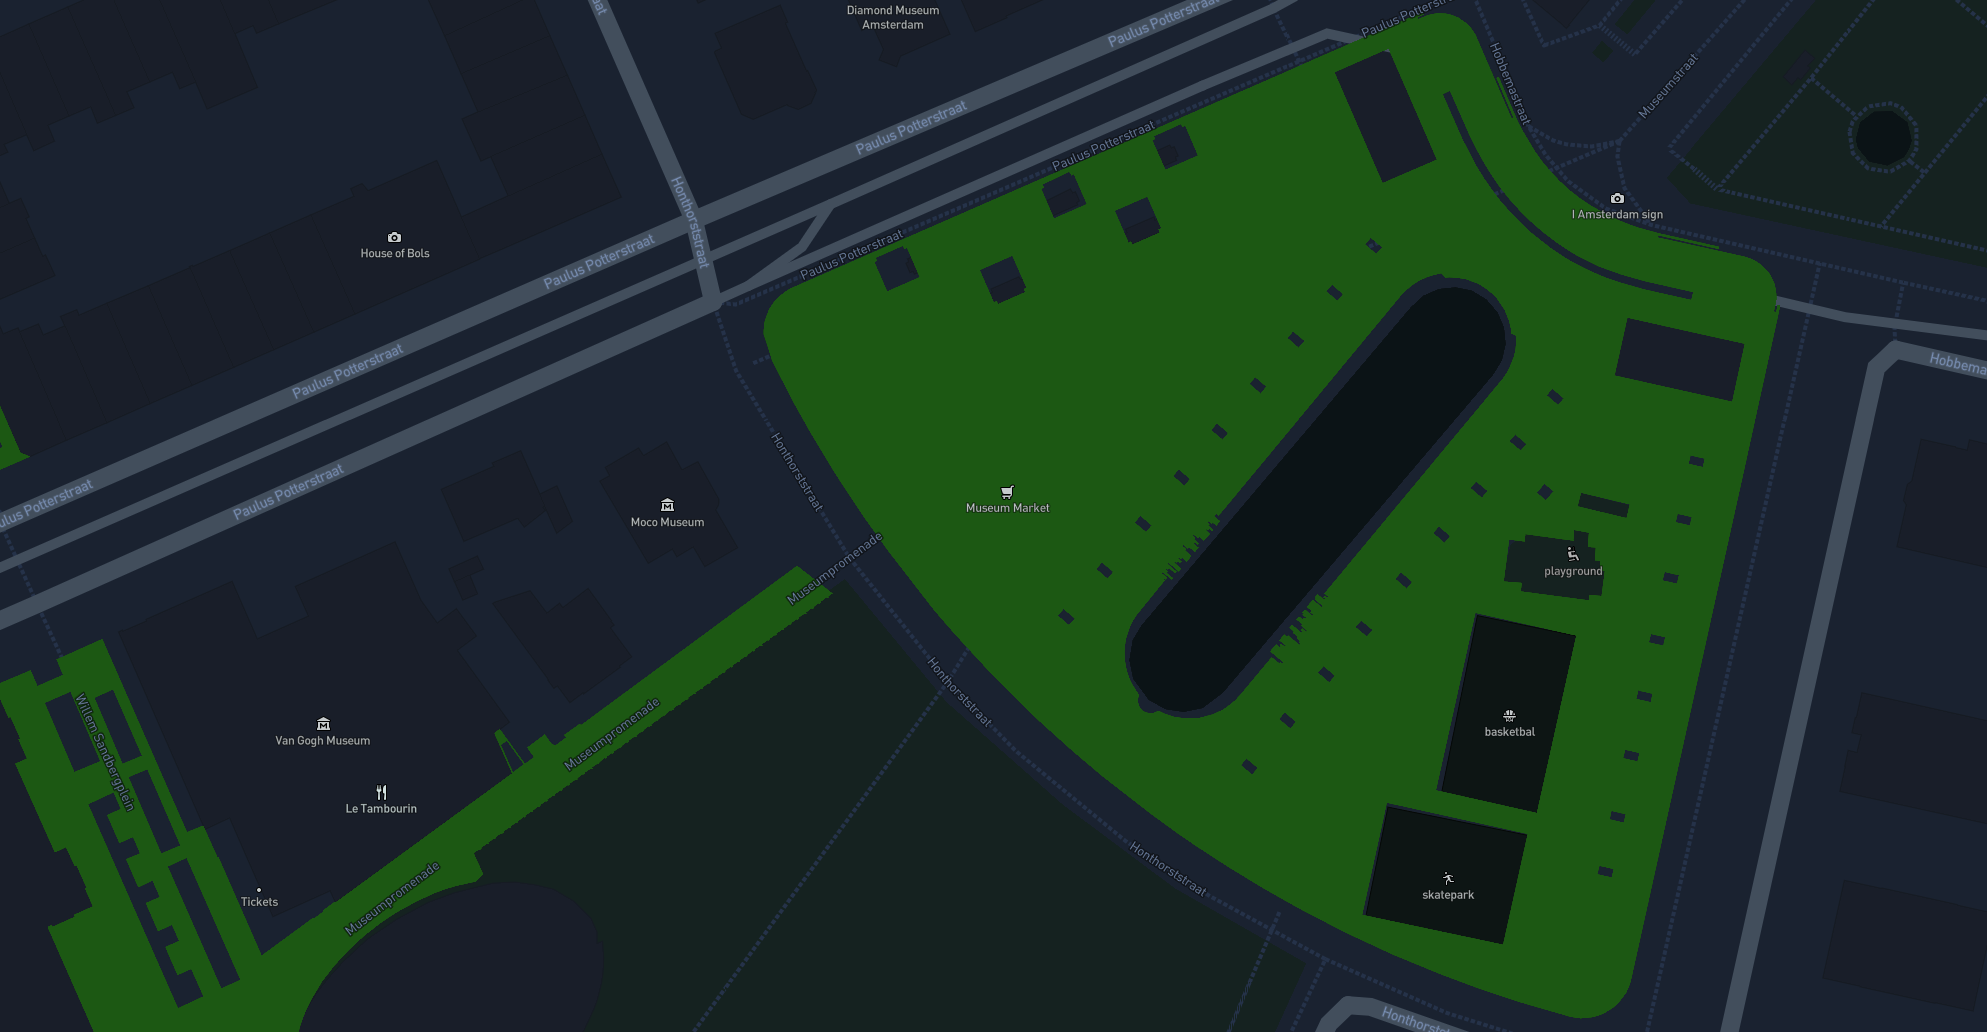
Once more, we processed the Basisregistratie Grootschalige Topografie (BGT) data, and extracted geometries with “function=voetgangersgebied” (pedestrian area). These geometries generally represent large public spaces closed to traffic, and without specific walking paths.
Analytics
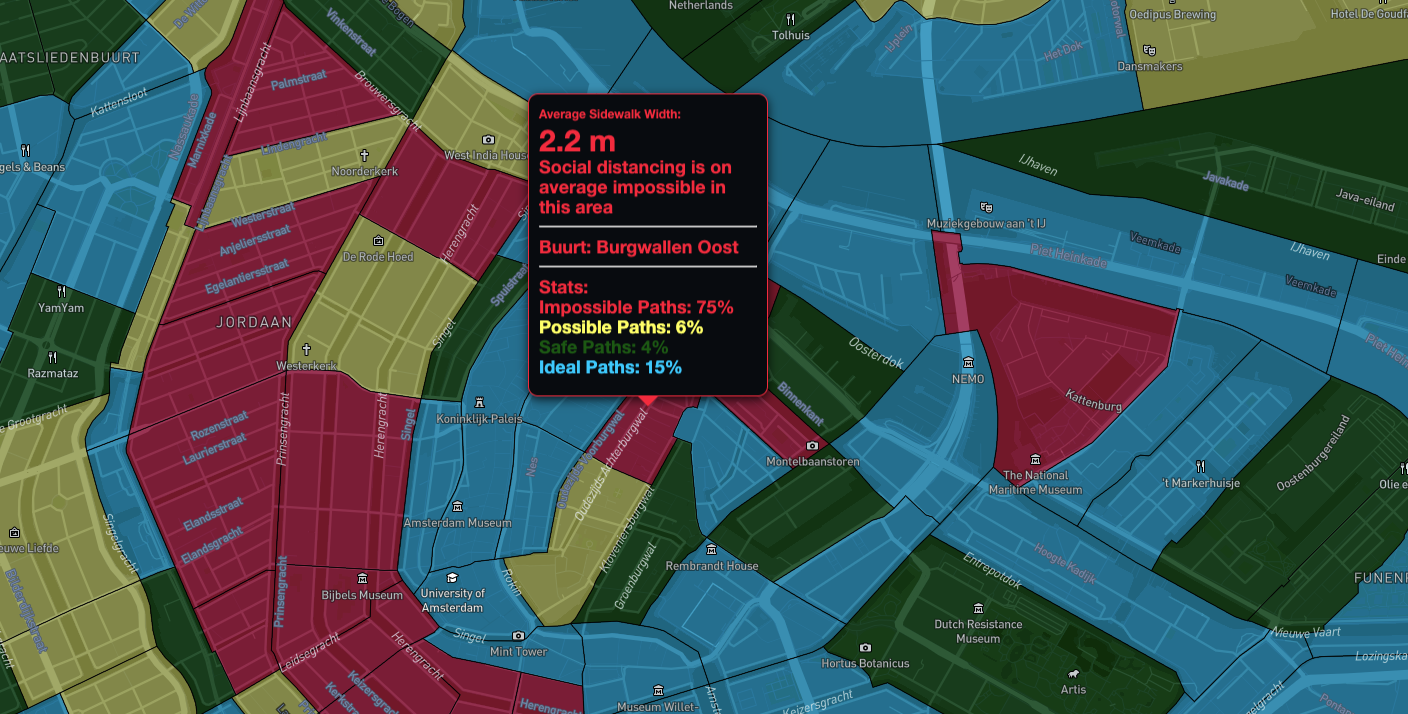
Thanks to the high spatial resolution of the obtained datasets, it is possible to perform analyses at different spatial resolutions (i.e. postcode-6 areas, neighborhoods, district, city, region). In the example, we aggregate sidewalks at the neighborhood level, calculating the proportion (in length) of segments belonging to one of the four risk profiles.
Map-based Interactive Visualization
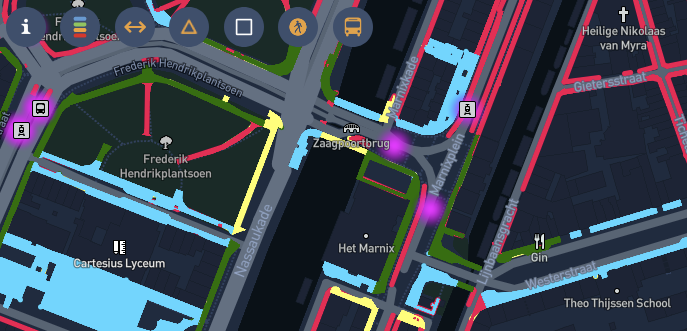
The resulting datasets can be explored through a map-based interactive visualization implemented with Mapbox with a style inspired by the work of Amelia Harvey. The visualization currently includes the following layers:
- Sidewalk centerline layer
- Sidewalk polygon layer (limited cities)
- Neighborhoods
- Pedestrian Areas
- Public Transport Modalities
The Team

Dr. Achilleas Psyllidis
Assistant Professor – Principal Investigator
Location Intelligence, Urban Analytics, Spatial data science, Location-based services

Roos Teeuwen
PhD Student
Geographic Information Systems, Urban planning, Spatial decision support systems

Vasileios Milias
PhD Student
Urban Data Science, Machine Learning, Smart Cities

Shahin Sharifi
PhD Student
Spatial Data Mining, Deep Neural Networks, Software Engineering

Sihang Qiu
PhD Student
Crowdsourcing, Human Computation, Conversational Agents

Carlo van der Valk
Research Engineer
Software engineering, Backend development, Social data, User modeling

Prof. Alessandro Bozzon
Full Professor
Crowdsourcing, Human computation, User modeling, Social data, Smart Cities

Prof. Gerd Kortuem
Full Professor
Internet of Things, Data-centric design, Smart Cities
The SocialGlass research program is developed in collaboration with the Delft University of Technology and the Amsterdam Institute for Advanced Metropolitan Solutions

