1. Introduction
The COVID-19 pandemic has changed daily travel in countries and cities around the world. During the first year of the pandemic, many countries and cities reported large increases in cycling. Many cities responded to the COVID-19 pandemic by providing additional space for cyclists through pop-up bicycle lanes and residential streets closed to motor vehicle traffic. However, some cities reported declines in cycling—mainly in places that traditionally had a high share of cycling commuters among their cyclists. Stay-at-home orders and remote working and learning reduced all forms of commuting, including bicycle commuting.
In this paper, we focus on cycling trends in Western Europe and North America. We ask two questions: First, what were the national changes in cycling levels in 13 countries during 2021, the second year of the pandemic, and how do they compare to cycling levels in the same countries in 2020 and 2019? Second, how did the COVID-19 pandemic affect cycling levels and bicycle planning in cities in Europe, the USA, and Canada? Local responses have determined the supply of cycling infrastructure during the pandemic and will determine the prospects of cycling in the future.
To answer the first question, we reviewed the emerging literature and analyzed available data from bicycle counters aggregated to the national level for the USA, Canada, and eleven countries in Western Europe. We update by a full year our previous research on the impact of COVID-19 on cycling [
1].
To answer the second question, we conducted case studies of 14 large cities in Canada, the USA, the United Kingdom, Germany, Belgium, France, and Spain. For each city, we analyzed trends in cycling levels and bicycle planning before and during the COVID-19 pandemic. Finally, we note each city’s plans for future cycling policies, which have been affected by experiences during COVID-19 in most of the case study cities. The article concludes by drawing key lessons from the experiences during the COVID-19 pandemic.
2. Previous Findings
The existing literature examining COVID-19 impacts on cycling was published from late 2020 to early 2022 but only includes data to the end of 2020 [
1,
2,
3,
4,
5,
6,
7,
8]. The studies we reviewed reported a wide range of percentage changes in cycling levels from 2019 and 2020, but, overall, net increases. In all countries, cycling levels were subject to large fluctuations across different months of the year corresponding to the different timing of COVID-19 outbreaks and the resulting lockdowns, closures, and reduced travel overall. Almost all studies reported large increases in recreational cycling, especially on off-road paths and greenways, but decreases in bicycle trips to work, school, university, and shopping. Corresponding to variation by trip purpose, there were large increases in weekend cycling and large decreases in weekday morning cycling.
Some cities that had high levels of work, school, and university bicycle commutation in 2019 reported decreases in 2020 due to lockdowns, closures, and remote working and learning. However, because most cities and countries reported a reduction in overall travel, the bicycle share of trips usually increased even when absolute cycling levels fell. That was especially the case in cities with high levels of public transport use, with some passengers switching to cycling to avoid the risk of contracting COVID-19 in the confined, shared spaces in buses and trains [
1,
9,
10]. Indeed, the natural social distancing cycling allows was one important reason for increased cycling during COVID-19. Except in extremely strict lockdowns (such as requirements to stay at home), cycling provided an ideal form of outdoor physical activity substituting for gyms, swimming pools, and organized sports activities suspended for long periods during COVID-19. Cycling also facilitated stress relief, getting outdoors, and socializing (at a distance)—important reasons for cycling found in one survey [
11]. While cycling, overall, increased, bikesharing decreased in many cities around the world, at least in the earlier phases of COVID-19, when a primary cause of transmission was widely considered to be touching surfaces contaminated by the COVID-19 virus. Thus, using the same bicycle just used by another person was considered unsafe by some former riders. In addition, many bikesharing trips are for commutation or short trips around town, trips purposes that were less frequent in 2020.
COVID-19 also had an important impact on government cycling policies, mostly at the local level, but sometimes triggering additional state/provincial or national funding. Some policies were introduced specifically as a response to COVID-19, often as temporary or trial measures [
3,
5,
6,
7,
8,
12,
13,
14]. Some measures were continued implementation of existing plans, but sometimes at an accelerated rate. Examples of measures taken during COVID-19 include: pop-up bicycle lanes (usually protected from motor vehicle traffic); reductions in speed limits, usually in residential neighborhoods but sometimes citywide; closures of streets to non-local traffic; banning motor vehicles from some streets (usually on certain days or times of day); widening of existing lanes and paths to accommodate increased cycling volumes; installation of more permanent bicycle paths and lanes; and discounts on bikesharing charges. Several studies have examined the impacts of such measures [
3,
5,
6,
12,
13,
14]. In most cases, the measures increased cycling safety, reduced cycling stress, and increased cycling levels, but there was variation from case to case, even within the same city.
3. Data and Methods
The first part of our analysis examines national aggregate data for 13 countries in Europe and North America. For that analysis, we relied on data provided by Eco-counter, an international company that operates automatic bicycle trip counters at key locations in European and North American cities. The Eco-counter data come from 310 sites in Europe and 125 sites in North America. The data from each counter is validated for accuracy by Eco-counter. We used their database both for our earlier analysis of trends from 2019 to 2020 [
1] as well as for the extension of our national-level comparison to 2021 in this new article. Eco-counter reported weekly percentage changes in cycling levels in each of 13 European and North American countries in 2020 and 2021 relative to the same weeks in 2019. The 13 countries included the USA, Canada, Belgium, France, Germany, Austria, Sweden, UK, Ireland, Italy, Spain, and Portugal. We converted the week-by-week Eco-counter data to month-by-month averages in order to increase the accuracy of the estimates. In order to facilitate overall comparisons among the 13 countries, we also present Eco-counter’s annual national percentage changes in cycling levels between 2019 and 2021, for entire weeks, weekends, and weekdays only. The annual percentage changes are based on differences between the sums of weekly counts for all 52 weeks of each year.
The second part of our analysis comprises case studies of COVID-19 impacts on cycling levels and government policies in 14 cities. We selected large cities that had strongly promoted cycling even prior to COVID-19. From among those cities, we focused on choosing cities that had implemented especially innovative and successful pro-cycling responses to the COVID-19 pandemic, as identified by the European Cyclists’ Federation (ECF), the League of American Bicyclists (LAB), and professional colleagues we consulted. However, we also included some traditionally pro-cycling cities that continued implementing more of the same measures as before, and also intend to continue them after COVID-19. The 14 cities chosen are located in various parts of the USA (Portland, Austin, Washington), Canada (Vancouver, Montréal), and Europe (London, Brussels, Berlin, Munich, Freiburg, Strasbourg, Paris, Barcelona, and Sevilla). The cities had a wide range of cycling levels prior to COVID-19, from a low of 2% in Austin, Texas to a high of 34% in Freiburg, Germany. The cities also varied in how long they have vigorously promoted cycling, ranging from roughly one to six decades.
Information for the case studies came primarily from remote video conversations and extensive email exchanges over the period January to April 2022 with bicycle planners, academics, and cycling advocates from each city. In addition, the cycling experts in each city read over successive drafts of the case studies to ensure their accuracy and completeness. Most of the information provided by these experts is unpublished, relying on internal government data and planning documents. That information was supplemented by published information available for a few cities, mostly related to past cycling levels and policies—including media reports, websites, presentations, government documents, and journal articles.
4. Results
4.1. Results of Aggregate, National Analysis, 2019–2021
As shown in
Figure 1, there was great variability among countries and over time in month-by-month changes in cycling levels in the 13 countries included in the Eco-counter dataset from January 2019 to December 2021. Increases are indicated by lines above the 0% horizontal axis (positive), while declines are shown by lines below the 0% axis (negative). The largest percentage declines (relative to 2019) were in periods of full lockdowns with stay-at-home orders, but even less severe restrictions—closed offices, shops, restaurants, schools, and universities—greatly reduced travel overall, including cycling. There were often large increases in cycling after lockdowns, usually exceeding levels in the same months of 2019 prior to COVID-19. As reflected in
Figure 1, some countries were affected by COVID-19 more than others or at different times. In general, the extent of fluctuations in 2021 were considerably less than in 2020, perhaps because COVID-19 outbreaks were less fatal than in 2020—due to the widespread availability of COVID-19 vaccines—and required less severe restrictions. Overall, monthly cycling levels in both 2020 and 2021 were higher than in 2019, as indicated by most of the country trend lines lying above the 0% horizontal axis for most months. Cycling levels in 2021, however, were not as high as in 2020, indicating a slight decline from 2020 to 2021.
By aggregating the monthly data of
Figure 1 into annual totals,
Figure 2 shows more clearly the average annual changes in cycling levels for each of the 13 countries. Total cycling increased between 2019 and 2021 in 11 of the 13 countries, but with considerable variation in the percentage changes. The largest percentage increases in cycling were in Italy (+27%), the UK (+23%), Portugal (+19%), Spain (+16%), and France (+15%). The two countries with decreases were Finland (−7%) and Germany (−3%).
Figure 2 also shows that growth in cycling was concentrated on weekends, with all 13 countries reporting increases between 2019 and 2021. Weekend-cycling growth ranged from 55% in the UK and 49% in Ireland to only 4% in Finland and Germany. By comparison, 4 of the 13 countries saw declines in cycling on weekdays between 2019 and 2021. Weekday cycling decreases ranged from 4% in Canada to 15% in Ireland. Decreases in cycling on weekdays in those countries were probably due to remote working and learning in addition to periodic travel restrictions during full or partial lockdowns. Weekday cycling increases ranged from 1% in the USA and Sweden to 24% in Italy. In these 11 countries, reduced cycling to work, school, and universities was evidently more than offset by increases in cycling for other trip purposes. Moreover, in some countries, workplaces, stores, schools, and universities were gradually re-opened in 2021.
4.2. Case Studies
The aggregate, country-level data just examined provide an overall picture of the situation of cycling during the COVID-19 pandemic, but they do not reflect the situation in specific cities, which can vary greatly even within the same country. Moreover, they provide no information at all about local government policies to encourage cycling during COVID-19. Thus, we supplement the aggregate analysis with case studies of 14 large cities. The case-study approach enables a detailed examination of the situation in each city, with specific examples that are inevitably missing in an aggregate analysis.
For each case study, we first provide contextual information about trends in the city’s cycling levels and policies in the decades prior to COVID-19. That provides an essential basis from which to examine the city’s cycling trends and policies during the COVID-19 pandemic, which is at the center of each case study. Finally, we examine each city’s plans for future investment in cycling infrastructure and programs. In many cities, those plans have been modified as a result of the COVID-19 pandemic, sometimes involving new policies that had been tried out during COVID-19, and sometimes involving the expanded or accelerated implementation of plans that had been made before COVID-19. The case studies all have that basic three-part structure, but they vary considerably from each other in length and content according to the amount and kind of information that was available for each city.
Table 1 provides an overview of our case-study cities, listing their population size, cycling share of daily trips prior to COVID-19, changes in cycling levels between 2019 and 2021, as well as key policies implemented in 2020 and 2021. We first examine three cities in the USA: Portland, Oregon on the West Coast; Austin, Texas in the South; and Washington, DC on the East Coast. Then, two cities in Canada: Vancouver on the West Coast and Montréal in eastern Canada. Our European cities are in five countries: the UK (London); Belgium (Brussels); France (Paris and Strasbourg); Spain (Sevilla and Barcelona); and Germany (Berlin, Munich, and Freiburg).
As noted in our methods section, the information from these case studies comes primarily from cycling planners, engineers, and organizations in each of the cities. That is especially true for the most recent information and future plans. The same cycling experts also provided the photographs included as illustrations in this article. At the beginning of each case study, we have inserted an endnote to list the professional contacts who provided information for that city. We insert endnotes within each case study with references to specific documents, websites, and presentations used for supplemental information.
4.2.1. Portland, Oregon
With about 650,000 residents (2.5 million metro), Portland has been at the vanguard of cycling among large American cities. From 2000 to 2019, Portland quadrupled its daily number of bicycle commuters (from 4775 to 19,052) and increased the bicycle-mode share of work commuters from 1.8% to 5.2% [
15,
16,
17]. The transformation of Portland into one of America’s top cycling cities was the result of several coordinated long-term pro-cycling policies. From 2000 to 2019, for example, the network of cycling facilities increased from 363 km to 633 km [
18]. The network included low-stress facilities for all ages and abilities: 56 km of buffered bicycle lanes, 25 km of physically separated, protected bicycle lanes, 162 km of neighborhood greenways (bicycle boulevards), and 138 km of off-road multi-use paths [
18]. The expanded neighborhood greenways were accompanied by slower speed limits for cars (30 km/h) and indirect routing for cars to discourage through car traffic in residential neighborhoods. In addition, the supply of on-street bicycle parking was expanded, often through so-called bicycle corrals, which converted car parking spaces into bicycle parking spaces. The expanded and improved cycling infrastructure, combined with reduced speed limits in residential neighborhoods, greatly enhanced cycling safety. The 2019 cyclist injury rate—total injuries relative to total bicycle trips—was less than half the rate in 2000. Finally, the city launched Biketown in 2016, a Nike-sponsored bikesharing system with 1000 bicycles [
18].
Cycling appears to have declined sharply during the COVID-19 pandemic, although it is difficult to obtain representative numbers. The only available data come from Ecocounters installed at the two busiest crossings for cyclists on bridges of the Willamette River. They report a 49% decline in bicycle trips from 2019 and 2021 [
15]. The extensive closings of universities, schools, and businesses at various times, as well as shifts to remote working and learning, may help explain the especially sharp decline in bicycle crossings at those two bridges, as they are mainly used by daily bicycle commuters to work and university.
Portland did not undertake any special COVID-19-related pro-cycling measures but continued to pursue its ongoing efforts to expand and improve the bikeway network [
15]. From 2019 to early 2022, the city added another 20 km to its bikeway network and plans to add another 125 km in the coming 3–4 years [
15]. Those numbers, however, do not reflect the continuing qualitative improvement throughout the bikeway network, with many unprotected bicycle lanes being converted into either protected or buffered bicycle lanes, and with buffered bicycle lanes converted into protected bicycle lanes. Portland also continues its focus on intersection safety treatments to better protect cyclists when crossing. In addition, two new pedestrian–cyclist bridges facilitate crossings over two inner-city freeways. Complementing those infrastructure improvements, Portland has been comprehensively reducing speed limits throughout the city, including the implementation of slow streets with speed limits varying from 25 km/h to 30 km/h. Not only have cars been slowed down, but their space on roadways has been reduced, with many five-lane arterials reduced to three lanes for cars, providing space for protected bicycle lanes on both sides of the streets [
15].
The area served by the 1000-bicycle Biketown bikesharing system was increased by 25% in early 2022, and all of the bicycles are now electric bicycles. Bicycle parking has been expanded and improved, reaching a total of 7444 city-managed bicycle racks (14,888 spaces) in early 2022 [
15]. The city adds about 150–200 additional bicycle racks every year. The city also requires commercial and multi-unit residential buildings to provide minimum levels of bicycle parking.
In short, Portland has done virtually all the right things to make cycling safer, lower-stress, more convenient, and more feasible for all ages and abilities, including risk-averse and vulnerable persons. The city’s pro-cycling plans for the coming years would be even more effective if they were complemented by more car-restrictive measures such as reduced supply, increased price, and shortened duration of on-street parking—both in the city center and in outlying commercial areas. The city might also consider establishing car-free zones in parts of the city center.
4.2.2. Austin, Texas
With about a million residents (2.2 million metro), Austin, Texas is the most pro-cycling large city in the American South. From 2010 to 2019, the city expanded its network of conventional on-street bicycle lanes from 134 km to 473 km [
19]. In 2012, Austin installed its first protected bicycle lanes, following Dutch design guidelines [
19,
20]. By 2019, there were 265 km of protected on-road lanes, neighborhood bikeways (bicycle boulevards), and off-road urban trails, which the city considers its network of especially safe and low-stress cycling facilities for all ages and abilities [
19]. One focus of that network is serving short trips (up to 5 km), which are largely found in the city center, where the bicycle mode share of trips is almost 6% [
19].
In 2020 and 2021, during COVID-19, Austin built 13 fully protected intersections (all four sides) and nine partially protected intersections (at least one side), increasing to 33 the number of such protected intersections in Austin [
19]. Such protected intersections force motor vehicles to make turns at lower speeds, increase the visibility of cyclists, provide shorter crossing distances for cyclists, and offer space for cyclists to wait for the green traffic signal to cross the intersection. From 2019 to the end of 2021, protected on-street lanes grew from 43 km to 90 km and the all-ages-and-abilities bicycle network grew from 265 km to 358 km, almost 100 additional km in just two years. Conventional on-street bicycle lanes grew to 480 km by the end of 2021, an increase of only 5 km [
19]. As part of its package of COVID-19 measures, Austin also implemented 30 km of slow and shared streets in 2020 [
20].
The large increase in protected cycling facilities is indicative of Austin’s planned future focus on expanding its low-stress, protected facilities for all, with only minimal growth planned for unprotected on-street lanes. As of March 2022, 260 km of additional all-ages-and-abilities bicycle-network projects are planned through 2026, with a total network of more than 620 km of such cycling facilities. At least 21 additional protected intersections are planned in the coming years, as the city engineers consider them an integral part of the expansion and improvement in protected bicycle lanes. Annual funding to expand protected facilities will roughly triple between 2020 and 2025, from USD 3 million to USD 9 million [
19,
20].
The results of Austin’s large investment in improved bicycle infrastructure have been impressive. The American Community Survey (ACS) of the US Census reports a 49% increase in daily bicycle commutes to work between the 5-year average for 2006–2010 and the 5-year average for 2016–2020, thus over a 10-year period [
17]. ACS uses 5-year averages for its estimates to increase their accuracy. Eco-counter data from several locations in Austin show a 150% increase in bicycle trips (all trip purposes) between 2015 and 2019, and 18% further growth from 2019 to 2021 (during COVID-19) [
19]. In short, both Census ACS data and Eco-counter data confirm that Austin’s investment in expanded and improved cycling infrastructure has been very successful. That accomplishment is all the more impressive because Austin had been a typically low-density, car-oriented Texas city when the city’s cycling program began.
4.2.3. Washington, DC
Cycling has increased in Washington, DC (690,000 population) over the last two decades. The share of all trips made by bicycle increased five fold, from about 1% in the late 1990s to 5% in 2018 [
21]. Counts of bicyclists crossing bridges across the Potomac and Anacostia Rivers detected a 320% increase in cyclists between 2000 and 2018. Data from the American Community Survey (5-year averages) of the US Census show that the number of daily bicycle commuters more than doubled between 2010 and 2020 and that the bicycle share of work commuters increased correspondingly, from 2.3 to 4.8% [
22]. Facilitating that growth in cycling, Washington greatly expanded its bikeway network from only 5.1 km of unprotected bicycle lanes in 2001 to 120.7 km of regular, unprotected bicycle lanes, 19.3 km of protected bicycle lanes, and 33.8 km of shared bus-bicycle lanes in 2019 [
21,
22].
During the COVID-19 pandemic, Washington reduced speed limits on 41.8 km of neighborhood streets to 24 km/h (15 mph) and closed the streets to through traffic in a slow-streets program [
21]. Slower car travel speeds and lower volumes of car traffic made those streets more attractive and safer for cyclists. In addition, Washington reduced the general speed limit in the city to 32 km/h (20 mph)—unless otherwise posted. In contrast to other cities, Washington did not implement any pop-up bicycle lanes during COVID-19. However, the city continued to expand its network of bikeways, building 19.3 km of protected bicycle lanes and 6.4 km of regular bicycle lanes in 2020 and 2021 combined. The rate of construction of new bikeways was much higher in 2020 and 2021 compared to the years 2017 and 2019, when 4.8 km were built each year [
21].
Use of Washington’s bikesharing program, Capital Bikeshare (CaBi), declined sharply during the pandemic, with 38% fewer riders in 2020 compared to 2019. CaBi ridership was slightly higher in 2021 than in 2020, but still 25% lower than in 2019 [
23]. Despite lower ridership, CaBi continued its physical expansion in Washington, adding 23 more docking stations and 600 e-bikes to its bicycle fleet [
21]. Counts of cyclists for 2020 and 2021 are only available for a trail along the Anacostia River in the eastern part of the city. The counts detect declines in cycling in 2020 compared to 2019 (−32%), but significant increases in 2021 compared to 2019 levels (+113%) [
24].
In the coming six years, Washington plans to spend USD 36 million to build 96.6 km of protected bicycle lanes to make crucial connections to close gaps in the city’s bikeway network. The city also plans improvements and upgrades for 33.8 km of off-road trails in the city. Washington will expand CaBi over the next six years by investing USD 19 million to add 80 stations and 3500 electric bicycles, which would more than double the number of bicycles in its bikesharing fleet [
21]. A recent regional survey indicated that 26% of respondents planned to cycle more after the pandemic than they did before 2020, suggesting a revival of the strong growth in cycling in Washington during the two decades prior to COVID-19.
4.2.4. Vancouver, Canada
With 660,000 residents (2.6 million metro), Vancouver is one of Canada’s leading cycling cities. City travel surveys report a doubling in the cycling share of trips (all trip purposes) from 4.4% in 2013 to 8.8% in 2019, the year just before COVID-19 [
25,
26,
27]. The Canadian Census also reports a large increase in cycling in Vancouver, with total daily bicycle commuters increasing from 3.7% in 2006 to 6.1% in 2016, the latest Census data available [
28].
Since 2000, Vancouver has greatly increased the extent and quality of its bikeway network. Especially since 2010, the city has focused on expanding and improving cycling facilities “for all ages and abilities,” corresponding to the stated goal of the city’s latest bicycle plan [
26]. From 2010 to 2019, off-street bicycle paths grew from 59 km to 73 km; physically separated, protected on-street bicycle lanes grew from 16 km to 24 km; and local street bikeways grew from 125 km to 172 km. In 2019, these three kinds of facilities together provided a network of 269 km of safe, convenient, and low-stress cycling facilities intended to attract a broad spectrum of Vancouverites to ride a bicycle [
25].
Vancouver and Portland have been the two North American cities renowned for pioneering the establishment of networks of local street bikeways, also designated as bicycle boulevards, neighborhood greenways, and urban greenways in other cities [
27]. Local-street bikeways always feature reduced speed limits (usually 30 km/h or less) combined with traffic-calming infrastructure modifications that force motor vehicles to slow down and often divert through motor-vehicle traffic away from local residential streets. Local street bikeways are usually on residential streets with low traffic volumes. On busy arterial streets, Vancouver has focused on installing protected on-street bicycle lanes, combined with protected, specially signalized and marked intersection crossings for cyclists (see
Figure 3 and
Figure 4) [
25]. Paved off-street multi-use trails and paths provide especially pleasant, low-stress, and safe cycling conditions because they are often in parks or along bays, lakes, and rivers, and thus even further removed from motor vehicle traffic. They are usually shared with pedestrians and other non-motorized users, but often with physical separation of cyclists from pedestrians. Vancouver also has regular, unprotected bicycle lanes, which increased from 51 km in 2010 to 57 km in 2019. Shared traffic lanes (with motor vehicles) indicated by chevrons or “sharrows” grew from 37 km to 41 km [
27].
The COVID-19 pandemic provided further impetus for expansion and improvement to the bikeway network. For example, 5 km of local-street bikeways were added to the city’s bikeway network in 2020 and 2021 (reaching a total of 176 km), and 2 km were added to the city’s system of protected on-street bicycle lanes (reaching a total of 26 km) [
29]. Several innovative measures were introduced during COVID-19, some of which are being made permanent. For example, the city installed many pop-up bicycle lanes, such as a 2 km stretch of Beach Avenue that has since been converted into a permanent protected bicycle lane, separated from motor vehicle traffic with concrete barriers (see
Figure 5 and
Figure 6) [
30]. That upgrade has attracted the most bicycle traffic of any city facility, with almost 14,000 cyclists on some days [
25]. In addition, over 40 km of local streets were officially designated as slow streets, with speed limits of 30 km/hr. Streets near schools and parks also have 30 km/h speed limits [
31].
Another COVID-19 experiment was the implementation of car-free streets adjacent to three schools during school hours, a program that will be expanded to more schools in the coming years [
31]. The City of Vancouver greatly expanded its cycling education program, which is delivered in partnership with the local school board and HUB Cycling, a local advocacy organization. Free cycling courses are now available to all 6th and 7th grade students in public schools. City-supported cycling promotion and events also increased. The Bike-to-Shop program, for example, provided discounts and free gifts for customers arriving by bicycle.
Eco-counter data indicate almost no change in total bicycle trips in Vancouver between 2019 and 2020 (1.37 m vs. 1.34 m trips) [
27]. The City of Vancouver reports increases on recreational routes, especially on weekends, and decreases in cycling on commutation routes during weekday rush hours, but those two opposing trends appear to have canceled each other out.
More improvements are scheduled in the coming years. The city’s already extensive networks of local-street bikeways and protected bicycle paths will be further expanded, including the conversion of some of the pop-up lanes into permanent protected lanes [
26]. The slow-streets program will be expanded into a slow-neighborhood-zone program (mostly 30 km/h) covering entire neighborhoods instead of individual streets, similar to the low traffic neighborhoods in Greater London. Some key cycling connections will be improved. For example, the eight-lane Granville Connector Bridge will be reduced to six lanes for cars, with the freed-up roadway space used for wide protected bicycle lanes and sidewalks on both sides of the bridge [
25]. This ‘connector’ will address a major gap in the city’s active transport infrastructure, linking with greenways and protected facilities on either side of False Creek. Finally, the region’s transport agency, Translink, will be working with Vancouver and other local governments in the Metro Vancouver region to deliver an 850 km major bikeway network to better connect communities across the region and implement complete, connected bikeway networks for each of the region’s 26 designated urban centers [
25].
4.2.5. Montréal, Canada
Montréal has long been one of the top three cycling cities in Canada, together with Ottawa and Vancouver [
32,
33]. The Canadian Census reports an increase in the bicycle share of daily work commuters from 1.8% in 2001 to 3.9% in 2016 (the latest Census year available) [
28,
34]. The bicycle-mode share is much higher, however, in some central areas of the city: 14.5% in Le Plateau-Mont Royal, 8.8% in Rosemont-La Petite Patrie, and 7.8% in Outremont [
28]. For the period 2015 to 2019, automated counter data indicate a 10% increase in total bicycle trips in the warmer months of May to October and an 83% increase in total bicycle trips from 2015–2019 in the coldest months of January and February, revealing almost a doubling in mid-winter cycling. Confirming the spatial pattern of the Census bicycle mode shares, a 2018 travel survey by the City of Montréal found that 5% of all trips in the city center were made by bicycle, compared to only 1% in the eastern and western parts of the city [
32].
Montréal’s cycling successes are attributable to its many innovative pro-bicycle policies, some of which have been pathbreaking in North America. For example, Montréal was the first large city to develop an extensive network of physically separated on-street bicycle lanes (PBLs), most of which are bi-directional [
35]. The city started building PBLs in 1988 and gradually expanded them, with 82 km by 2015 and 111 km by 2019 (see
Figure 7) [
32]. Other types of cycling infrastructure in Montréal also grew from 2015 to 2019: conventional, unprotected on-street bicycle lanes (from 214 km to 334 km), lanes shared with motor vehicles on lightly traveled streets and 30 km/h speed limits (from 181 km to 276 km) (see
Figure 8), and off-street bicycle paths and multi-use paths shared with pedestrians (from 271 km to 287 km). The total cycling network grew by 34%, from 748 km to 1001 km [
32].
In addition to being North America’s leader in PBLs, Montréal also introduced the first large-scale bikesharing system in 2009. Called BIXI, the system started off with 3000 bicycles and 300 stations and has since expanded to 7270 regular bicycles and 2395 e-bicycles (pedelecs) at 794 stations [
32].
Automated bicycle counters in Montréal report a 2% increase in cycling volumes between 2019 and 2020 (the first year of COVID-19) but a decline of 8% from 2020 to 2021. A special Quebec Ministry of Transport (QMOT) survey found that Montréal residents rode their bicycles as often in 2020 as in 2019, similar to the trends detected by bicycle counter data [
36,
37]. The survey also found large differences in cycling impacts from 2019 to 2020 among different locations in the city, with increases averaging 12% at four locations but decreases averaging 38% at three locations. The increases were on recreational routes and in residential neighborhoods, while the decreases were on work and university commutation routes [
36,
37]. The increases were on weekends, and the decreases mainly on weekdays. COVID-19 also had an important impact on BIXI bikesharing ridership. After having risen from 3.5 million trips in 2015 to 5.7 million trips in 2019, ridership plummeted to only 3.3 million in 2020, but then rebounded to 5.8 million in 2021 [
32].
Montréal implemented many pro-cycling measures in 2020 and 2021. Some of them were temporary, such as the 29 km of bidirectional protected pop-up bicycle lanes installed for summer 2020 at the peak of the COVID-19 crisis in Montréal, the hardest hit of all Canadian cities [
33]. Those pop-up lanes were removed in the winter of 2020–2021, but some were re-installed as permanent protected bicycle lanes in summer 2021, sometimes converted from bi-directional pop-up lanes to one-directional PBLs—in opposite directions on both sides of the same streets. PBLs expanded from 111 km at the end of 2019 to 156 km at the end of 2021, including 26 km of extra-wide PBLs that are part of the new express bikeway network REV (Réseau Express Vélo) [
32]. By comparison, there was almost no growth in off-street bicycle paths, multi-use paths, and shared lanes on lightly traveled streets barely increased. Painted bicycle lanes expanded slightly from 286 km to 301 km, and some existing lanes were widened. Shared bus–bicycle lanes increased from 7 km to 11 km. The city also expanded its network of vélorues (bicycle streets) from 3 km to 8 km. Vélorues are comparable to Fahrradstrassen in Germany or Fietsstraaten in the Netherlands, where bicyclists have priority over motor vehicles for the entire width of the streets, which have speed limits of no more than 30 km/h [
32,
33].
The pro-cycling mayor Valerie Plante was re-elected in November 2021 in a landslide based on her commitment to further expanding and improving the cycling network in Montréal, especially protected bicycle lanes [
32,
33]. The new REV expressway network, for example, is scheduled to expand to 17 express bicycle routes and 184 km of wide PBLs by 2027. The latest plans also call for a doubling in the overall bikeway network by 2027 (1815 km). The City of Montréal has set a goal of increasing the bicycle mode share of trips to 15% in central boroughs. Given that commitment to massive investment in cycling infrastructure, it seems certain that cycling will grow significantly in the coming years, reinforcing Montréal’s decades-long reputation as a leading cycling city in North America.
4.2.6. London, UK
The COVID-19 pandemic brought about the most rapid transformation of the streetscape in Greater London in recent decades, resulting in a sharp rise in both walking and cycling [
38]. The UK Department of Transport estimates that total cycling distance traveled increased by 46% in Greater London in 2020 (compared to 2019) [
39,
40,
41]. Transport for London (TfL) reported a 22% increase in bicycle trips in Outer London and a 7% increase in Inner London. On some weekends in 2021, cycling levels rose by more than 200% [
40].
In the decade prior to the COVID-19 pandemic, Greater London more than tripled the length of protected on-street bicycle lanes from 50 km to 162 km (see
Figure 9) [
39]. In the twelve months after the outbreak of COVID-19 in London, the city built 100 km of additional protected bicycle lanes, yielding 260 km of protected bicycle lanes by March 2021 [
40]. Most new bicycle lanes installed during COVID-19 were created rapidly using plastic wands (flexposts) to separate cyclists from motor traffic. It is expected that more permanent barriers will be installed on most of the new bicycle lanes in the coming years, along with further expansion of the protected bikeway network.
TfL data show that where new protected bicycle lanes were installed, cycling levels increased by up to 70% [
40]. The percentage of the Greater-London population living within 400 m of the high-quality cycle network increased from 12% in 2019 (prior to COVID-19) to 19% in December 2021 [
40,
42]. The accessibility to protected bicycle lanes is projected to rise to 35% by 2025, requiring an increase in the network of protected cycling facilities to more than 400 km [
42]. In short, the extent of the protected bikeway network in Greater London is planned to expand dramatically by 2025, partly stimulated by the special incentives during the COVID-19 pandemic. Over the longer term, Greater London’s Strategic Cycling Plan aims for 70% of the population to live within 400 km of a high-quality bikeway by 2041 [
38,
41].
A second and equally important development has been the rapid implementation of almost a hundred so-called low-traffic neighborhoods, or LTNs, across many London boroughs (see
Figure 10) [
39,
43]. Most LTNs are located in Inner London, where the default speed limit is 20 mph in residential areas. LTNs use a combination of bollards, large wooden planters, and enforcement cameras to reduce speeds and to prevent motor traffic cutting through entire residential areas. Data collected for academic surveys and local government agencies show significant increases in walking and cycling, decreases in car use, and reductions in injury rates for pedestrians and cyclists, especially among children [
43]. The program has helped address the rapid rise in through traffic on narrow residential streets, which almost doubled over the past decade, facilitated by navigation apps such as Waze and Google [
43].
A third element of London’s transformation has been the School Streets program, which excludes all but residential traffic from streets surrounding schools at drop-off and pick up times [
38,
39]. More than 500 School Streets are already in place and many more are in the process of being installed. School cycle- and scooter-parking zones have frequently been filled up following the establishment of School Streets.
As in most of the case-study cities we examine in this article, Greater London’s expansion of its protected bikeway network, implementation of LTNs, and the School Streets program had already been begun prior to COVID-19, including plans for future expansion. Yet COVID-19 provided an important stimulus to speed things up due to increased public and political support.
4.2.7. Brussels, Belgium
Brussels, Belgium’s largest city and the seat of the European Union, does not have a history of cycling [
44,
45]. In 2010, only 3.5% of all trips in the city were made by bicycle. Since 2010, however, the city has vigorously promoted cycling [
46]. Based on bicycle counts from 2010 to 2019 and the recent increases in cycling during the COVID-19 pandemic, local planners estimate that the share of trips by bicycle had reached about 10% in early 2022 [
47].
During the COVID-19 pandemic, cycling rates increased rapidly. Overall, the city’s bicycle counters detected an increase in the number of bicycle trips by 64% between 2019 and 2020 and an additional 20% increase between 2020 and 2021 [
44,
47]. As in many other cities, trends in cycling varied by location and time of day. Indeed, counters registered declines in commuter bicycle trips from 2019 to 2020, especially during rush hour and in locations close to schools, universities, or office centers. Even many of those locations, however, reported large increases in cycling from 2020 to 2021, with 10% more bicycle trips during commute hours in 2021 than in 2019, thus more than rebounding from the decline in 2020 [
44,
47].
The city implemented several pro-bicycle measures in response to the COVID-19 pandemic. The city built 50 km of pop-up bicycle lanes that closed gaps in the cycling network to better connect the city center to the rest of the city (see
Figure 11) [
47]. The pop-up bicycle lanes were built in locations identified for future bicycle lanes in Brussels’ regional transport plan that had been passed in March 2020, just as the pandemic hit. Pop-up bicycle lanes were clearly marked and, wherever possible, separated from traffic with concrete barriers or planter boxes. Pop-up-lanes typically take up one car travel lane (3 m) and are marked at a safe distance from parked cars (80 cm) [
44]. The bicycle lanes are about 1.3 m wide. The city’s goal is to make pop-up bicycle lanes permanent in the future because they account for 33% of the current bikeway network. The pop-up bicycle lanes also constitute 17% of the planned cycling network for Brussels in 2030, which will have roughly 250 km of bikeways in total [
47]. According to local laws, pop-up bicycle lanes can remain in effect for 2 years and then need to obtain an official building permit in order to be made permanent.
In response to a national lockdown in Belgium in March 2020, the city banned car traffic from a large park (Bois de la Cambre) that had served as a car commuter thoroughfare [
47]. A large part of the park still remains car free, and thus especially convenient and safe for cyclists. In addition, on January 1 2021, the city established a maximum speed limit of 30 km/h on most streets in Brussels. Compared to 2020, roadway fatalities dropped by 50% and severe injuries declined by 20% [
44].
The city plans to remove 65,000 street parking spaces for cars by 2030 [
46]. In addition, the city plans to establish low-car traffic areas throughout the city. In August 2022, roads in the city center will be reconfigured so that traversing the center by car will be difficult, while routes for cyclists and public transport will be improved and made more direct. Motorists will still be able to enter many roadways at a low speed, but they will not be able to traverse the city center easily or quickly. This sort of car-restrictive measure is also being implemented by 60 other jurisdictions in Belgium, with motor-vehicle traffic slowed down or kept out of their city centers to prioritize walking, cycling and public transport. The Brussels 2030 transport plan calls for further expansions in cycleway infrastructure, a significant increase in bike parking, and expanded traffic calming over the coming 8 years with the goal of having 15% of local trips (<5 km) made by bicycle in 2030 [
46].
In Brussels, the COVID-19 pandemic allowed a jump start on expanding the bikeway network through pop-up bicycle lanes. Other measures that restrict car use, planned prior to COVID-19, further increase cycling’s attractiveness.
4.2.8. Paris, France
Paris is France’s capital and largest city, with 2.2 million inhabitants. It has not traditionally been a cycling-friendly city [
48,
49,
50]. However, during the last 25 years, the city has promoted cycling with measures such as Vélib’, its innovative and trend-setting bikesharing program, which for many years was the largest bikesharing system in the world, with a total of 20,000 bicycles [
39]. Paris also greatly expanded its bikeway network from only 5 km in 1995 to 293 km in 2004, and then to 1038 km in 2019 [
39]. The network comprises mainly on-street bicycle lanes, but also more than 115 km of protected bicycle lanes and over 80 km of off-street paths (see
Figure 12,
Figure 13 and
Figure 14).
As the bikeway network expanded, cycling levels increased by 60% from 1997 to 2004, and then by 250% from 2004 to 2019 [
39]. That is a six-fold increase over the entire 24-year period. The percentage of trips made by bicycle in Paris rose from 0.4% in 1991 to 1.4% in 2001 and 5.0% in 2019 [
39]. The city has also provided financial incentives for purchasing e-bikes and e-cargo bikes—paying one third of the purchase price for 85,000 bicycles between 2009 and 2022 (up to EUR 400 for e-bikes and EUR 600 for e-cargo bikes) [
48]. In addition, the city has made efforts to reduce car travel in the city by increasing the cost of car parking and removing car-parking spaces, converting car travel lanes into bus-priority lanes, and banning motor vehicles from roadways along the embankments of the Seine River, which flows through the center of Paris [
39,
50].
Cycling levels in Paris increased sharply during the pandemic, with cycling levels about 60% greater in 2020 and 2021 than in 2019 [
51]. Vélib’ also saw strong increases in ridership, with 56% more trips in 2020 than in 2019. The number of trips made by electric-powered Vélib’ bicycles more than quadrupled between 2020 and 2019. Compared to cyclists in 2019, cyclists during the COVID-19 pandemic were more likely to be former public transport passengers, women, from Paris suburbs, commuters, and from lower income groups [
51]. In response to the pandemic, the City of Paris installed 52 km of pop-up bicycle lanes that were separated from motorized traffic by concrete barriers (see
Figure 15) [
50,
51]. A recent analysis showed that the pop-up lanes connected crucial gaps in the city’s growing bicycle network—in particular linking the inner city to the periphery. Moreover, compared to the bikeway network in 2019, pop-up bicycle lanes were more likely to be bi-directional and physically separated from motor-vehicle traffic [
52].
In addition, Paris implemented many measures that had been planned prior to the pandemic. In May 2020, for example, the city transformed Rue de Rivoli from a road that prioritized car travel to a street for bicycles that restricts automobile access to one lane only (see
Figure 16) [
1,
50,
52]. In August 2021, the city reduced the speed limit to 30 km/h on most city streets, which made then safer, lower-stress, and more comfortable for cycling [
49].
In 2021, the City of Paris passed a new bicycle plan for the next five years, called “Paris 100% Cyclable” [
53]. As part of the plan, the City of Paris will make all pop-up bicycle lanes permanent. By 2026, the city plans to build over 130 km of additional protected bicycle lanes, open over 390 km of one-way streets for motor vehicles to two-way bicycle traffic, and to add 130,000 new bicycle-parking spaces in public spaces. In total, the city plans to spend EUR 250 million on bicycle promotion between 2021 and 2026 [
53]. With the summer Olympic Games scheduled to take place in Paris in 2024, the city is aiming to significantly increase cycling [
53].
4.2.9. Strasbourg, France
The city of Strasbourg (population 290,000) has had the highest bicycle share of trips of all French cities for decades: increasing from 7% in 1997 to 16% in 2019 [
54,
55]. Strasbourg published its first bicycle plan in 1978 and created new plans in 1994, 2010, and 2020 [
54]. Strasbourg is part of the Eurometropole region, which has 510,000 inhabitants and 33 jurisdictions [
55]. Bicycle planning has been coordinated across jurisdictional boundaries within the region. Prior to the COVID-19 pandemic, the region had 700 km of bikeways, but with important gaps in connectivity—mostly between the city center and the suburbs areas, and in deprived neighborhoods [
54]. Since 2008, the city has implemented cycling infrastructure and traffic calming whenever possible during street improvement projects [
55].
Strasbourg implemented few new policies in direct response to the COVID-19 pandemic. The city built six pop-up bicycle lanes and initiated a public relations campaign that promoted cycling as the ideal mode of transport for commuting and social distancing during the COVID-19 pandemic [
54]. Available bicycle counter data show a 19% increase in cycling in Strasbourg between 2019 and 2021.
A new city government took office in spring 2020. It decided to establish an accelerated cycling program for the next 5 years, but that pro-cycling plan is not directly related to the COVID-19 pandemic. The program is called “Plan Vélo’’ and aims to expand and improve the network of bikeways as well as complementary programs and services related to cycling [
56]. A budget of EUR 100 million was allocated to implement this plan. Plan Vélo focuses on connecting the bikeways between cities and villages in the Eurometropole area. The goal is to add 120 km of bikeways by 2026, upgrade 20 large intersections, and close 50 crucial gaps in the current bikeway network [
56]. This will include the elimination of car travel lanes and on-street car parking on many roads. The plan also calls for expanding the area’s longer distance “cycle highways” network called Vélostras, including the important Vélostras 1 ring that connects many bikeways [
56]. Vélostras was launched in 2013 and will eventually be 130 km long. About 90 km of the planned Vélostras network already exists, but often at lower quality, so that much of the work will entail upgrading the existing parts of the network to higher design standards [
54,
56].
The region plans to roughly double the regional modal share of cycling from 11% in 2020 to 20% by 2030. The City of Strasbourg itself had already reached 16% by 2020 [
56]. Currently, 30% of trips shorter than 5 km are made by car. The new Plan Vélo aims to shift those trips to more sustainable travel modes—including cycling. Following the example of many European cities, since 2020 Strasbourg has been offering a subsidy of EUR 300–500 for purchases of e-bikes, with the amount depending on type and cost of the e-bikes [
54].
4.2.10. Seville, Spain
Seville, Spain provides a good example of how quickly it is possible to improve bikeway networks and raise cycling levels if there is strong political support for doing so [
57,
58]. From 2003–2011, two successive coalition governments were elected that were led by Social Democrats (PSOE), joined by the Greens and Communists [
18]. With the vigorous support of cycling advocacy groups, the coalition governments strongly promoted cycling and launched the expansion and improvement of Seville’s protected bikeway network from only 12 km in 2003 to 133 km in 2011 [
18]. In addition, free on-street bicycle parking was expanded (5700 spaces), and an extensive bikesharing system (2600 bicycles) was introduced. An indication of the greater safety of the new bikeways is that the rate of cyclists killed or seriously injured per million trips fell by 90% (a 10-fold improvement), which might help explain why the percentage of women cyclists rose from 25% to 36%. The annual number of bicycle trips in Seville increased five-fold from 2003 to 2011, and the bicycle-mode share of trips rose from less than 1% to 5.6% [
18].
Unfortunately, that dramatic success was slowed down when the pro-car, anti-cycling Conservative Party came into power in 2011–2014 [
59]. The new government did not halt bikeway projects already underway. Thus, the bikeway network continued to expand from 133 km in 2011 to 162 km in 2015 and the bikesharing system and bicycle-parking programs were maintained as well [
18,
59]. However, the new city government lifted restrictions on car use, such as the car-free zone in the historic city center, which immediately increased motor-vehicle traffic and sharply reduced cycling. It also refused to introduce traffic calming in residential neighborhoods and eliminated the entire professional staff of 15 cycling planners and engineers. The cycling share of trips fell from 5.6% to 4% [
57,
58].
Although the Social Democrats returned to power in 2015, they were less able to promote cycling than earlier because they were not joined by other members of the former coalition, and thus held only a slim majority [
18]. They only slightly expanded the network of protected bikeways from 162 km in 2015 to 180 km in 2019 [
18]. Cycling levels remained far behind 2011 levels, mainly due to the lack of any car-restraint policies and a slowdown in bicycle-network expansion. The city did not introduce any special pro-cycling policies during COVID-19 (2019–2022) [
57,
58]. Nevertheless, Sevilla’s system of protected bikeways further expanded by 4.4 km, and there were extensive improvements in the design of some existing bikeways. They were widened and moved from the sidewalk level to the street level, but still physically separated from motor vehicle traffic.
In sharp contrast to many other European cities, including neighboring Valencia, cycle trips fell by 7% in Seville from 2019 to 2021 [
57,
58]. Part of the reason is the boom in the use of stand-up e-scooters, which doubled in ridership from 2019 to 2021, rising from 15% to 37% of cycling levels. In addition, however, the Seville government has not been willing or able to implement policies that effectively restrict car use and further promote cycling beyond current levels. Thus, the COVID-19 pandemic was a “missed opportunity” for promoting cycling in Seville, which had demonstrated such impressive progress and attracted so much international attention as a model cycling city from 2003–2011 [
58].
The future may be a bit brighter, however. “Next Generation” funds from the European Union have recently become available to further expand cycling facilities, especially to build connections between the City of Seville and its surrounding suburbs, thus tapping into a suburban population that is roughly the same number as the city itself [
57,
58]. In addition, the city plans to continue the engineering design improvements to existing bikeways, as described earlier, to ensure conformance to the most advanced, up-to-date standards.
4.2.11. Barcelona, Spain
Barcelona, with 1.7 million inhabitants (5.3 million in the metro area), has strongly promoted cycling over the past three decades [
60,
61]. For example, the supply of bicycle lanes increased from only 10 km in 1990 to 116 km in 2015 [
60,
62,
63,
64]. Then, from 2015 to 2019, the city removed about 3000 car-parking spots to increase the total length of bicycle lanes to 209 km, almost doubling the network of lanes in only four years. In addition to bicycle lanes, cyclists in Barcelona can ride on traffic calmed streets with speed limits of 30 km/h or lower, which include more than half of all city streets. Barcelona is well-known for its superblocks, 400 × 400 m areas of multiple city blocks that prioritize pedestrians and cyclists while discouraging vehicular through traffic with physical barriers, one-way traffic, and reduced speed limits. The average number of bicycle trips per weekday in Barcelona increased almost six-fold over the 15-year period from 2004 to 2019 (from 30,000 to 167,000) [
62]. Over the same period, the bicycle share of trips in the city quadrupled, rising from 0.7% to 2.9%. Over the shorter period of 2009–2019, the average number of weekday cycling trips doubled for the region, and the share of trips made by bicycle increased from 0.9 to 1.6% [
62].
During the COVID-19 pandemic, the number of weekday bicycle trips decreased in Barcelona (−8%) and the region (−6%) [
62]. As trip making during the week declined overall and more strongly for other modes of transport, the percentage of trips made by bicycle increased slightly (from 2.9% to 3.1% in the city and 1.6% to 1.7% regionally). Bicycle counters along the 550 km long regional trail network (Bicivia) captured bicycle trips on weekends as well. Data show a 34% increase in cycling on the trails during 2021 and 2020 compared to 2019 [
63]. The counters detected fewer cyclists in the city center, but the increases in outlying areas more than offset the decreases. Working and learning from home and a sharp decline in tourism decreased the number of trips made in the city center. In addition, Barcelona’s popular bikesharing system (Bicing) closed for one month in March 2020 at the onset of the pandemic. Bicing ridership remained much lower in 2020 than in 2019. For example, ridership in June 2020 was only 69% of June 2019 ridership [
64].
In response to the COVID-19 pandemic, the city installed 21 km of pop-up bicycle lanes by removing car travel lanes. The city also closed 12 km of roadways to motorized traffic [
64]. The new bicycle lanes could be quickly installed because, already in 2019, the city had identified locations for future bicycle lanes (see
Figure 17). The city intends to make the pop-up bicycle lanes permanent [
60,
61]. Moreover, the new 2020 urban mobility plan calls for an additional 33 km of bicycle lanes by 2023 to reach a total network length of 273 km [
63,
64]. In addition, design and safety improvements will be made to 12 km of existing bicycle lanes. In the coming years, the city hopes to further expand the bikeway network through local neighborhood initiatives that are supported with funds of the city’s participatory budgeting process, where residents in neighborhoods help decide how to spend city funds allocated to their neighborhood. Since 2019, Bicing bikesharing has added 2000 electric bicycles that are very popular, averaging 11 trips per day compared to 6–7 trips per day for Bicing’s non-motorized bicycles. The city plans to add another 2000 electric bicycles to the Bicing fleet by the end of 2022 [
64].
Since Autumn 2021, citizen activists in Barcelona have been expanding Bicibús, a very popular bicycle-to-school activity that started in the Sarrià district. Every Friday, parents and children cycle together to one of seven schools, fully occupying formerly busy city streets. The bicibus movement has thrust cycling into the spotlight, capturing the attention of the local and global media [
60].
The 2020 Urban Mobility Plan sets the complementary goals of doubling the number of trips by bicycle and reducing the number of car trips by 25% by 2024. The overall goal is to increase the combined percentage of trips by foot, bicycle, or public transport from 74% in 2020 to 82% in 2024 [
64]. The city will directly encourage this intended reduction in car use by pedestrianizing 32 km of streets, expanding traffic calming with speed limits of 30 km/h or lower throughout the city, installing 70 more kilometers of bus lanes, and decreasing the share of parking that is free (from 40% to 10%) [
64].
4.2.12. Berlin, Germany
Berlin is Germany’s largest city (3.5 m inhabitants) and capital. The share of trips by bicycle increased from 10% in 1998 to 18% in 2018 [
65,
66]. Berlin has a polycentric settlement structure with strong neighborhood centers. As a result, more than half of all daily trips are shorter than 5 km and could easily be made by bicycle [
66]. In 2018, Berlin adopted a new mobility law to reverse a decades-long trend towards increasing car use. The law prioritizes walking, cycling, and public transport with the goal of increasing traffic safety and equitable accessibility, reducing air pollution, noise, and traffic congestion, fighting global climate change, and distributing public space more fairly among transport modes [
67].
During the COVID-19 crisis, permanently installed bicycle counters detected an increase by 22% in cycling from 2019 to 2020 [
68]. In 2021, cycling levels were lower than in 2020, but still 14% higher than in 2019. There is great variability in trends among bicycle counters, with some reporting almost 30% more cyclists in 2021 compared to 2019, and others detecting decreases. Counters with less cycling in 2021 than in 2019 are typically along bicycle-commuter routes, such as the counter at Jannowitzbrücke (a bridge over the Spree River) [
68]. In response to COVID-19, Berlin built 25.9 km of pop-up bicycle lanes along key arterial roads with multiple car travel lanes in each direction. The city’s intent is to make most of these pop-up bicycle lanes permanent [
65,
66]. In August 2020, Berlin also pedestrianized a 500 m stretch of Friedrichstrasse, the main shopping street in the center of the city, but included bi-directional bicycle lanes in the center of the street (see
Figure 18) [
65,
66].
Berlin also continued the implementation of bicycle-friendly policies that were not in direct response to the pandemic. For example, in 2020, the city built an additional 6500 bicycle parking spaces and expanded the number and length of its bicycle priority streets (Fahrradstrassen) from 3.2 km in 2020 to 11.1 km in 2021. In 2020, the city hired seven additional staff members to work on cycling issues (up from a total of six employees working on cycling issues in 2017 and 14 in 2019). To finance these pro-cycling measures, the city increased funding for cycling by 74%—to EUR 31 million per year in 2020 and 2021—compared to 2019 [
66,
67].
In 2021, Berlin adopted its latest cycling master plan, which is based on the 2018 Mobility Law [
67]. The plan sets a goal of at least 23% of all trips in Berlin to be made by bicycle by 2030. The plan calls for the creation of a tightly knit bikeway network that is no more than 400 m from 80% of Berlin residents, workplaces, and educational facilities. The main network will consist of 865 km of priority routes (up from 494 km currently). In streets with fast car traffic (speed limit more than 30 km/h) these priority routes will consist of protected bicycle lanes wherever possible, and lanes will be at least 2.00 m wide (ideally 2.50 m) so that cyclists can pass one another [
67]. Additionally, the main bikeway network will include 100 km of bicycle expressways, which will be especially wide to accommodate fast cycling (ideally 3.00 m for cycling paths or lanes and 4.00 m for bidirectional bicycle infrastructure). Complementary local networks of bikeways (1506 km in length including 2.00 m to 2.30 m wide cycling paths or lanes along roadways with fast traffic) will connect to the main network, yielding a total of 2371 km of bikeways in Berlin by 2030. The city will also increase the number of bicycle-priority streets (Fahrradstrassen) within the main bikeway network and some local networks, and more one-way streets will be opened for bidirectional travel for bicyclists, thus increasing the flexibility of travel by bicycle [
67].
Finally, the city plans to build 100,000 more bicycle-parking spaces by 2025 in public areas and at public-transport stations and stops. Other goals in the bicycle plan include better communication, monitoring, and evaluation of cycling activities [
67].
4.2.13. Munich, Germany
With 1.5 million inhabitants (metro 2.6 million), Munich is Germany’s third largest city [
69]. The share of daily trips by bicycle in Munich increased from 10% in 2002 to 18% in 2017—the year of Munich’s most recent travel survey [
70]. In 2019, the City of Munich had 500 km of bicycle lanes, 450 km of traffic-calmed streets (with a speed limit of 30 km/h or less), and 260 km of off-road bicycle paths or shared-use trails in parks. In 2019, grassroots cycling-advocacy groups collected 160,000 signatures on petitions (Radentscheid and Altstadt Radlring) to the city council to make Munich more bicycle friendly [
71]. That convinced the Munich City Council to formally adopt a new Bicycle Plan to accelerate its efforts to promote cycling. The specific goals of the new policy are to create a new city-wide bicycle-priority network, to improve cyclist safety at intersections, to provide more bicycle parking, and to improve the safety and comfort of existing and new bicycle infrastructure along main streets. The 2019 plan will be financed by EUR 25 million in additional funding for walking and cycling per year [
71,
72].
Permanently installed bicycle counters measured a 19% increase in bicycle trips in Munich between 2019 and 2020 [
73]. That increase was sustained in the 2021, as counters measured roughly the same number of cyclists as in 2020. In response to the COVID-19 pandemic, the city installed 4.6 km of pop-up bicycle lanes in 2020 along critical corridors without existing bikeway infrastructure (see
Figure 19). The pop-up bicycle lanes were implemented as a pilot project with the goal to improve cyclist safety. In winter 2020/2021, the lanes were discontinued while data were analyzed. After demonstrating positive safety outcomes, the lanes were re-installed in 2021 and will now be made permanent [
70,
72].
While pop-up bicycle lanes received a lot of media attention, the focus during 2020 and 2021 was on laying the groundwork for implementing the city’s 2019 Bicycle Plan. Most of the projects included in that plan will be built in the coming years, as the typical duration of a bikeway infrastructure project in Munich is roughly 3 years from initial planning to completion [
69]. These projects include widening protected bicycle lanes to 2.30 m. That will provide more space for cyclists to pass each other and for the fast-growing number of electric cargo bicycles, which are wider than normal bicycles. Munich’s older bicycle lanes, which were only 1.30 m wide, will also be upgraded and widened [
70]. Munich will gain additional roadway space for cycling by removing some car travel lanes and on-street car parking spaces. Munich greatly expanded the number of bicycle parking spaces in the city—building 3600 bicycle parking spaces in 2020 alone. Planning for new cycleways has been greatly enhanced by the creation of a new Mobility Department in the city administration that hired 30 additional city staff to work on cycling issues (up from a total of 15 employees in 2019, reaching 45 in 2021) [
70]. Continuing a program that started in 2017, the city subsidized the purchase of e-bikes and e-cargo bikes in 2020 and 2021 by paying for 25% of the cost of an electric bicycle, up to EUR 1000. The program saw an increase in demand in 2020 and 2021, with over 3300 electric bicycle purchases subsidized [
70]. In 2020, the city opened a new 240 m long pedestrian and cyclist bridge across 37 rail tracks approaching Munich central station to provide a crucial new connection for cyclists [
70].
In the coming years, Munich will continue to implement the projects in its 2019 Bicycle Plan. The ultimate goal is to raise the city’s bicycle mode share of trips from 18% to 25% by 2025—and to reduce the share of trips by car from 35% to 20% [
70]. Other goals include a car-free historic town center and a circumferential ring bikeway of 2.3–2.8 meter-wide protected bicycle lanes around the historic center [
71]. The city also intends to build radial cycling expressways connecting the city center to outer areas of the city and its surrounding region. In a 2021 survey, 19% of Munich residents say that they want to ride bicycles more often after the pandemic is over, suggesting strong growth in future years [
70].
4.2.14. Freiburg, Germany
With its 230,000 inhabitants, Freiburg is the gateway to Germany’s Black Forest area and one of Germany’s most bicycle-friendly cities [
74]. The share of trips made by bicycle in Freiburg increased from 15% in 1982 to 34% of trips in 2016 [
75]. Freiburg’s oldest permanent bicycle counter, installed in 2013 close to the city’s main train station, detected a 44% increase in the number of cyclists between 2013 and 2019 [
76]. Cycling in Freiburg is safe and convenient. All areas of Freiburg are accessible by bicycle, thanks to a network of over 450 km of bikeways along all major roadways as well as traffic calming of over 75% of the city’s streets, with speed limits reduced to 30 km/h or lower [
74,
75].
Freiburg continued to implement bicycle-friendly policies during the COVID-19 pandemic but not specifically in response to COVID-19 [
74,
75]. The main reason was that Freiburg was already so bicycle-friendly prior to the COVID-19 pandemic. On a few roadways that had more than one car travel lane per direction and no bicycle lanes, Freiburg installed permanent rather than pop-up bicycle lanes (e.g., Schlossbergring). Freiburg’s three permanent bicycle counters, including the oldest counter at the main train station, showed a decline of 11% of bicycles in 2020 compared to 2019 [
76]. The bicycle counters are located along commuting routes. The main reason for the decline in bicycle trips was remote working and learning from home, especially during periods of lockdowns, where offices, businesses, stores, universities, and schools were closed. In 2021, cyclist levels were higher than in 2020, but still 8.5% lower than in 2019, prior to the COVID-19 pandemic [
76]. Although not a response to COVID-19, Freiburg’s bikesharing system Frelo completed its first full year of operation in 2020. It served 330,000 trips that first year and 375,000 in 2021, with the increase partly due to an expansion from 74 to 85 docking stations and 530 to 615 bicycles [
75].
As part of its long-term improvement in cycling conditions, Freiburg implemented bicycle-friendly policies during COVID-19. For example, the city installed 700 new bicycle parking spots in the city center in 2020 and 2021. In late 2020, Freiburg increased its budget for cycling measures to EUR 8 million per year in 2021 (from roughly EUR 1.2 million per year 2015 through 2020) as part of the city’s ambitious policy aimed at improving active travel [
75]. The policy was a response to a grass-roots citizen petition that collected 40,000 signatures in three months in fall 2020, demanding more bicycle-friendly city policies. The new policy calls for wider and protected bicycle lanes and paths, better connectivity of the bikeway network, safer intersections, and a stronger commitment to reduce car travel. In addition, Freiburg will work more closely with neighboring jurisdictions to improve bikeway connections between the city and its surrounding region [
75]. Key to that effort will be a new network of 90 km of bicycle expressways. In cooperation with the German federal government, Freiburg is studying the effects of the city’s new extra-wide bicycle lanes implemented along major roadways by significantly narrowing car travel lanes to make space for wider bicycle lanes [
74].
In 2019, Freiburg passed a new climate mobility plan to reduce CO
2 emissions—as part of the city’s role as a pilot community in the state of Baden Wuerttemberg [
77]. The plan calls for a 40% reduction in CO
2 emissions from 2010 by 2030. The plan explicitly includes bicycle promotion. It also focuses on a reduction in driving. As a first step, the city has increased the cost of residential parking permits from EUR 30 per year to EUR 240–480, with higher prices for larger vehicles [
78].
In short, Freiburg was one of Germany’s top cycling cities long before COVID-19, built on its pro-cycling policies during COVID-19, and has plans to vigorously promote cycling and discourage driving in the coming years.
5. Summary and Discussion
Consistent with previous studies, we found that the two main impacts of COVID-19 on cycling were changes in cycling levels and the introduction of expanded and improved cycling facilities financed by increased government funding [
1,
7,
12,
13,
14,
35]. Our analysis shows that impacts varied greatly from country to country and from city to city. Similar to previous studies, we found that overall cycling levels increased in almost all countries from 2019 to 2020. Our updated 2021 data, however, show that cycling declined slightly from 2020 to 2021 in most countries. For the entire period 2019 to 2021, we found that cycling increased in 11 of the 13 countries (see
Figure 2). All countries reported increased cycling on weekends (mostly for recreation, exercise, and sports). In all countries, cycling on weekdays either increased much less than on weekends or actually declined (in four countries). Those are the overall changes from 2019 to 2021, but, as shown in
Figure 1, there were large month-to-month fluctuations in each country, with the timing depending on the severity of the COVID-19 outbreak and the extent of the resulting closures and travel restrictions.
Changes in cycling levels varied considerably among the 14 case study cities. The largest decrease was in Portland, with slight declines in Sevilla and Freiburg. The largest increases were reported in Brussels, Paris, and London, with smaller increases reported for Strasbourg, Munich, and Berlin. The other 6 six cities reported small changes in cycling levels, usually with increases in recreational cycling offsetting declines in daily cycling for utilitarian purposes such as trips to work, education, and shopping. Correspondingly, cycling increased in residential neighborhoods, in parks, and on off-road greenways but decreased in city centers and on the main commutation routes to commercial districts and university campuses. Bikesharing in many of the cities suffered declines in ridership in 2020, but most systems rebounded in 2021, sometimes exceeding 2019 levels of ridership.
The case studies were most useful for identifying changes in local-government policies toward cycling during the COVID-19 pandemic. In all 14 cities, the bikeway network expanded, often with corresponding improvements in facility design to increase cycling safety and comfort and reduce traffic stress for cyclists. Most cities introduced pop-up bicycle lanes to quickly increase the supply of cycling facilities, usually carried out by removing traffic lanes or parking lanes for motor vehicles. In addition, all of the cities continued their previously planned expansion and improvement of permanent cycling facilities, sometimes at an accelerated rate. Of the nine European cities, London, Paris, and Brussels expanded their cycling networks the most, and they also experienced the largest increases in cycling. Of the five North American cities, Montréal expanded facilities the most, including innovative measures such as bicycle priority streets (Vélorues) and a new bicycle-expressway network (Réseau Express Vélo).
Since most of the new facilities in the 14 cities were physically separated from motor-vehicle traffic, they also increased cycling safety, especially relative to unprotected on-street facilities. Cycling safety was also increased by the reduction in city-wide speed limits on local streets to 30 km/h or less in Portland, Washington, Montréal, Paris, and Brussels. Vancouver, Portland, Austin, Washington, London, and Paris introduced or expanded programs of slow streets, low-traffic neighborhoods, and slow zones, which had speed limits of 20–30 km/h, restricted through motor-vehicle traffic, and gave priority to pedestrians and cyclists. Speed reduction measures were less necessary in Strasbourg, Freiburg, Munich, and Berlin because almost all of their local streets were already traffic-calmed to 30 km/h, with many portions of those streets—designated as play streets—yet further traffic calmed, with speed limits of 7–10 km/h.
These improvements in cycling conditions were possible due to local government support, which was crucial not only for funding but also for implementing potentially controversial policies such as reallocating roadway space from motor vehicles to bicycles. The COVID-19 pandemic presented local governments with a unique crisis situation that generated public support for drastic measures and enabled car-restrictive policies (such as lane removals, speed reductions, and road closures) that would have been far more difficult to implement under normal circumstances, mainly due to motorist opposition.
In several cities, local elections or public referenda provided increased political support and funding for cycling. For example, pro-cycling mayors and city councils were elected or re-elected in Paris, Strasbourg, Munich, Barcelona, and Montréal. In Freiburg, Munich and Berlin, voters approved pro-cycling referenda that budgeted large increases in cycling funding for expanded and improved cycling. In addition to those cities, most of the other case-study cities also increased funding for cycling facilities and programs, even without the political push of elections and referenda. Thus, the crisis of COVID-19 offered a unique opportunity for many cities to promote cycling. In most cases, the increased support for cycling fit into the cities’ previous plans to promote sustainable transport, increased traffic safety, and reduced air pollution, noise, energy use, and CO2 emissions. As noted at the end of each of the 14 case studies, almost all of the cities have ambitious plans for future expansion and improvement of cycling infrastructure and programs.
6. Conclusions
Cycling is probably the most sustainable urban transport mode, feasible not only for short trips but also for medium-distance trips too long to cover by walking [
35,
39]. Cycling causes virtually no environmental damage, promotes health through physical activity, takes up little space and is economical, both in direct user costs and public-infrastructure costs. Cycling is also socially equitable because it is affordable and physically possible for most of the population, increasing accessibility and mobility options. Thus, cycling is environmentally, socially, and economically sustainable.
Cycling already makes an important contribution to sustainable cities and has the potential to contribute more. Even in sprawled North American cities, roughly half of all trips are 5 km or shorter, and thus could be covered by bicycle if safe and convenient cycling facilities are provided [
79]. Shifting car trips to bicycle trips would greatly improve the sustainability of cities and their transport systems [
39]. It is crucial, however, that governments implement a coordinated package of attractive cycling facilities and programs complemented by disincentives to car use, such as those implemented during COVID-19.
The success of cycling in European cities is largely attributable to extensive car-restrictive measures as well as government taxation and pricing policies that discourage car use by making it less convenient and more expensive. In addition to implementing pro-cycling policies, US and Canadian cities need to implement some of the car-restrictive policies that have been so successful in Europe. These include making car parking more difficult and expensive by reducing car-parking supply, limiting duration of parking, and increasing the hourly price for on-street parking. In addition, it is crucial to reduce motor-vehicle speeds and traffic volumes in residential neighborhoods, in particular. As shown in many of our case-study cities, traffic calming, slow streets, resident-only streets, bicycle streets, and shared streets would improve cycling and walking safety as well as encourage more walking and cycling. Even the five bicycle-friendly North American cities included as case studies in this article could do much more in this respect. Most other North American cities have implemented even fewer, if any, car-restrictive measures to complement their expanded and improved bikeway networks. It is the combination of cycling incentives and car disincentives that is the most effective way to encourage more and safer cycling.
The overriding lesson from COVID-19 is that many pro-cycling and car-restrictive policies thought impossible before the pandemic were indeed possible to implement due to the public and political support generated by a crisis situation. The documented success of those COVID-19 policies should encourage transport planners, government officials, and politicians to build on those policies in the coming years. Although less dramatic and sudden than the COVID-19 pandemic, environmental, economic, and social crises plague virtually every city, every country, and the world as a whole. Examples of these other crises are climate change, air pollution, preservation of non-renewable resources, energy shortages, social inequality in mobility and accessibility options, and public-health problems stemming from a lack of physical activity and the appalling annual toll of traffic fatalities and serious injuries. These other crises deserve at least as much political and public commitment to finding a solution as has been evident with the COVID-19 pandemic. Shifting car trips to cycling would be an especially cost-effective and quick way to help deal with many of the world’s most important crises.


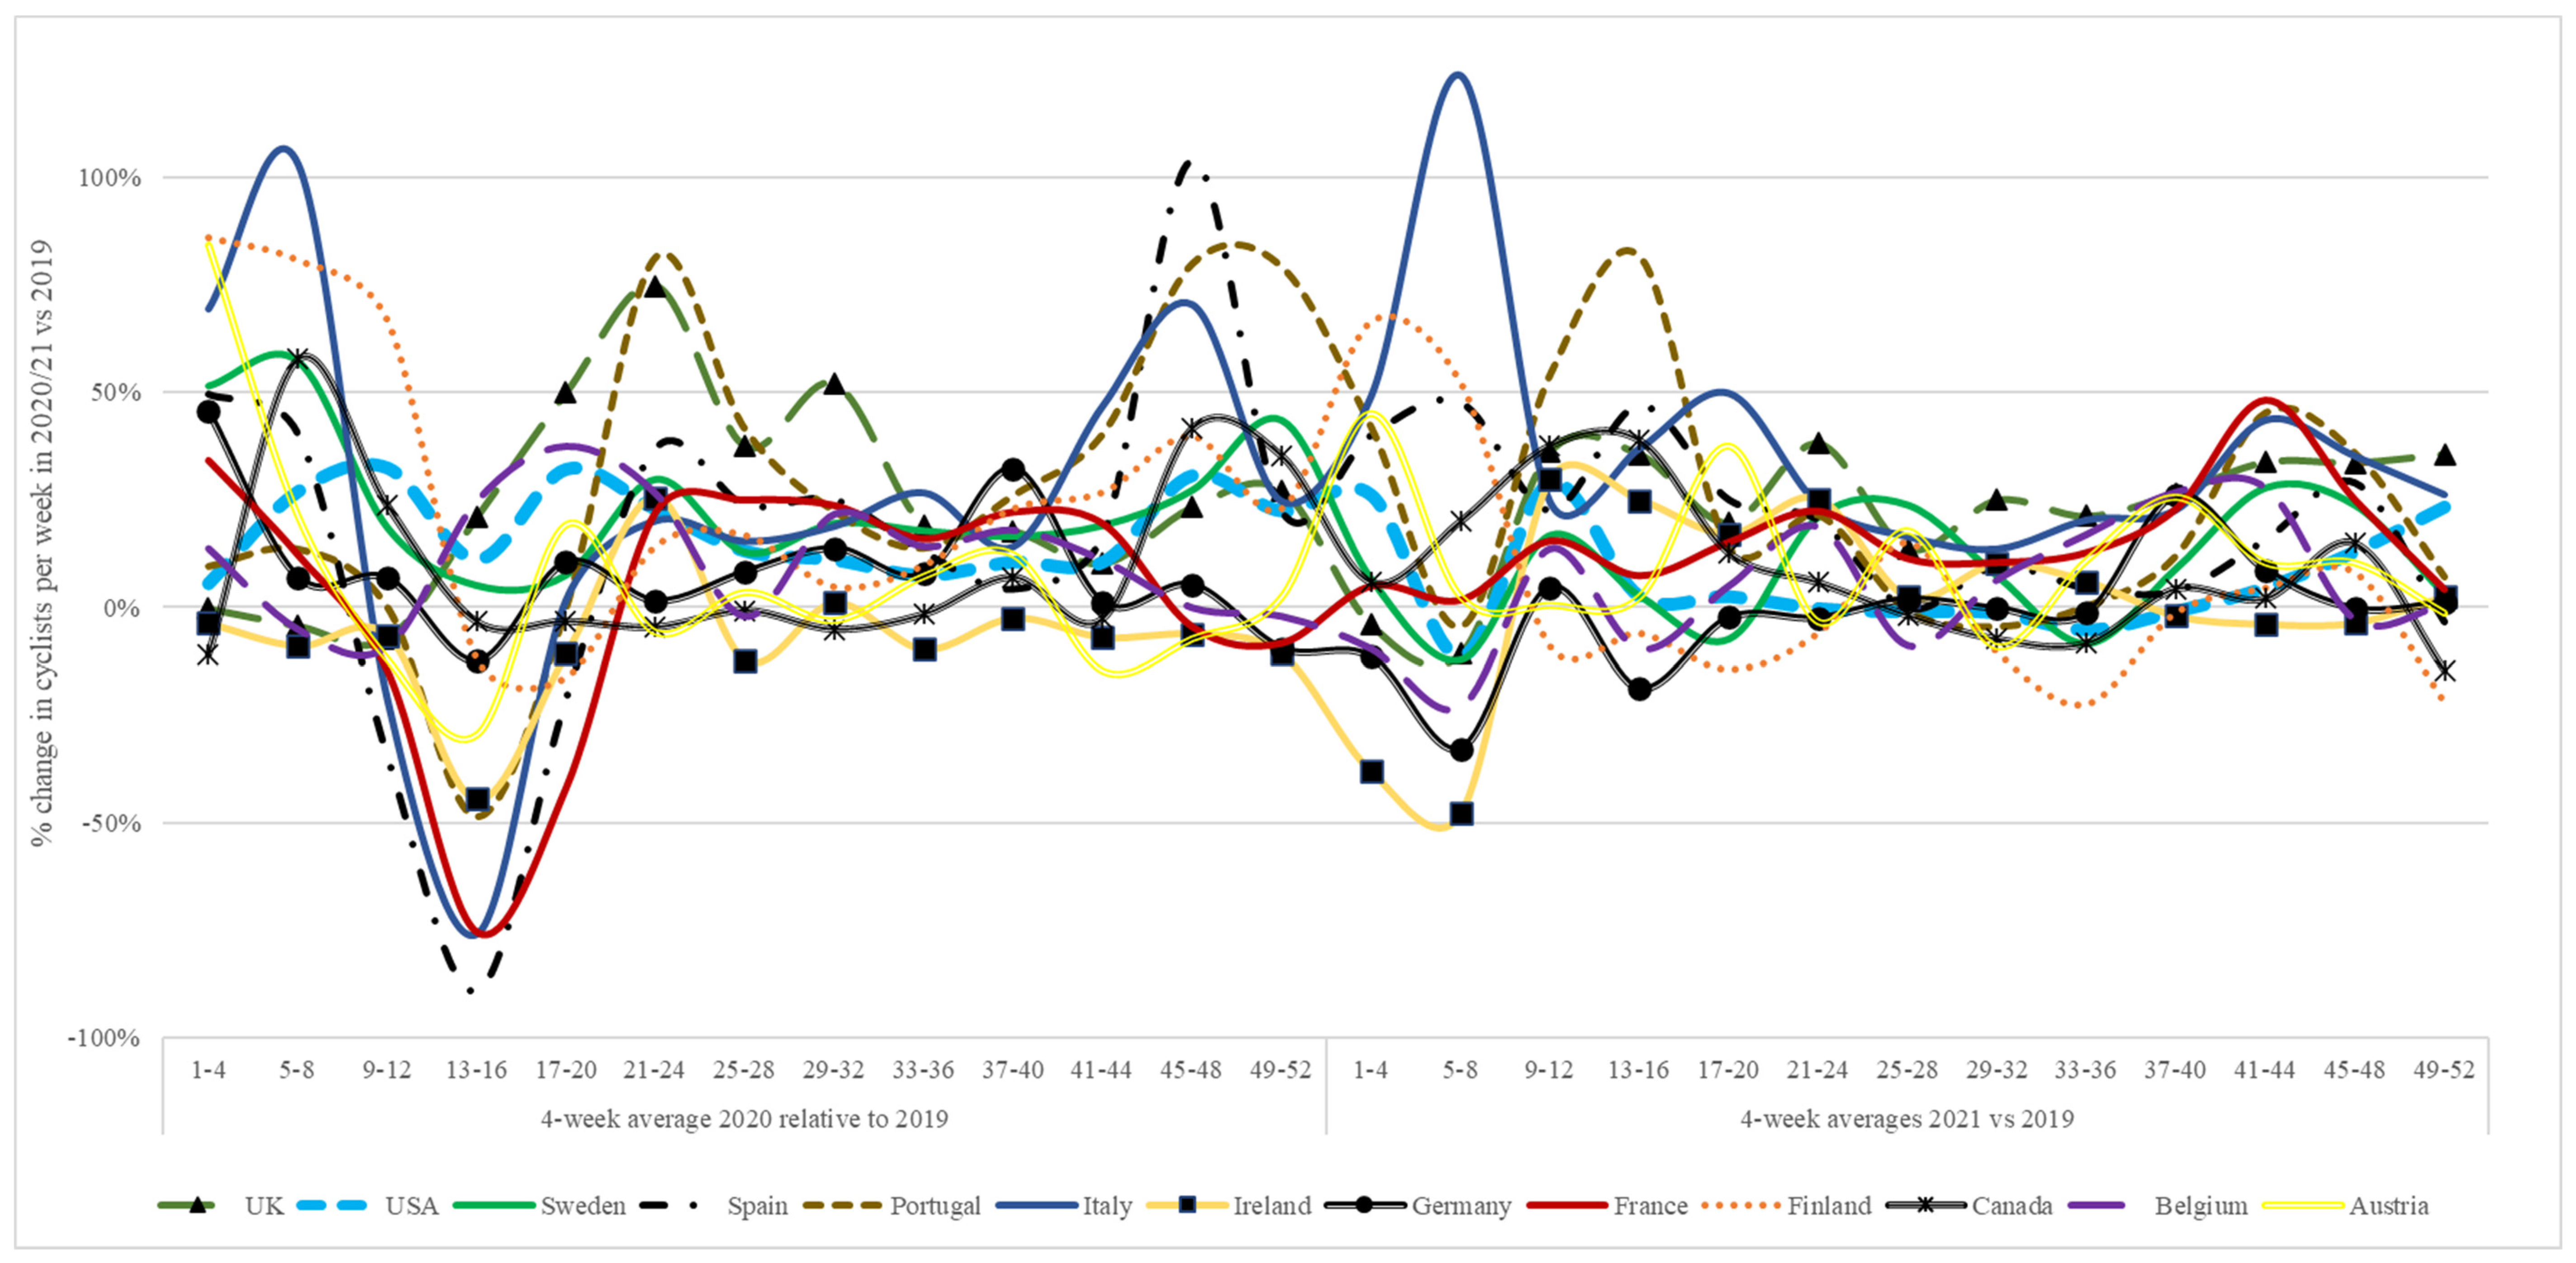
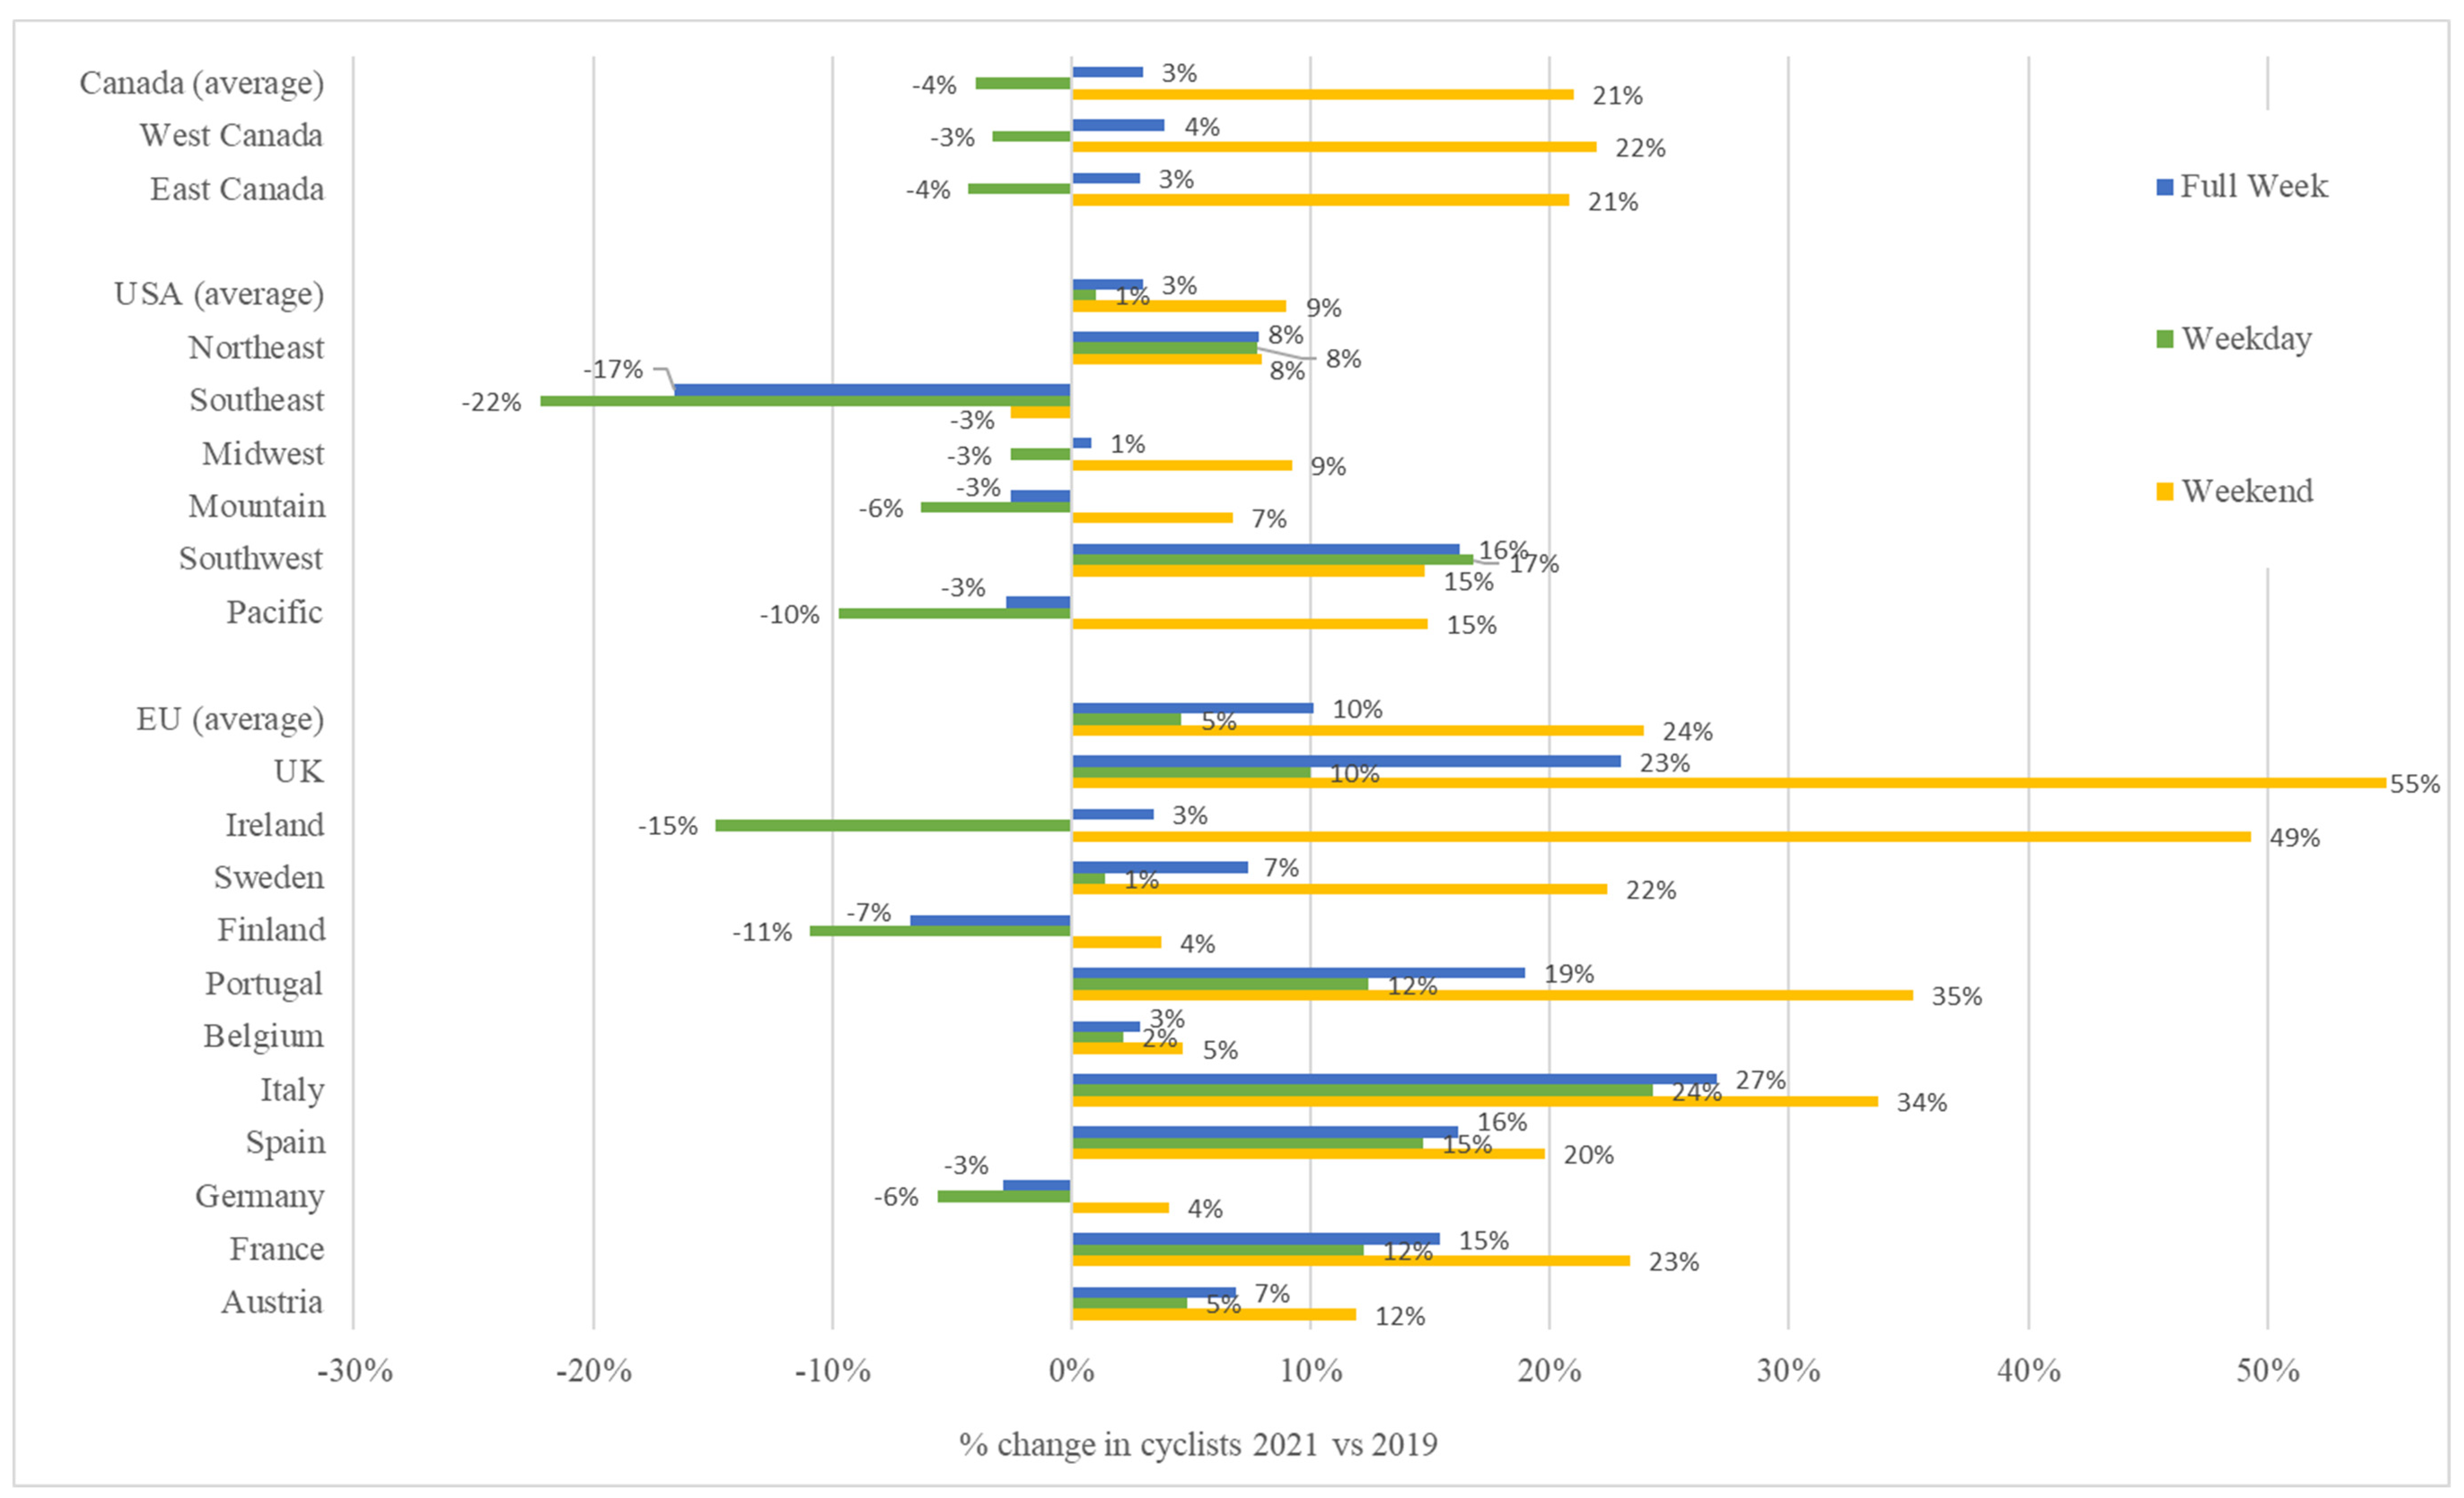
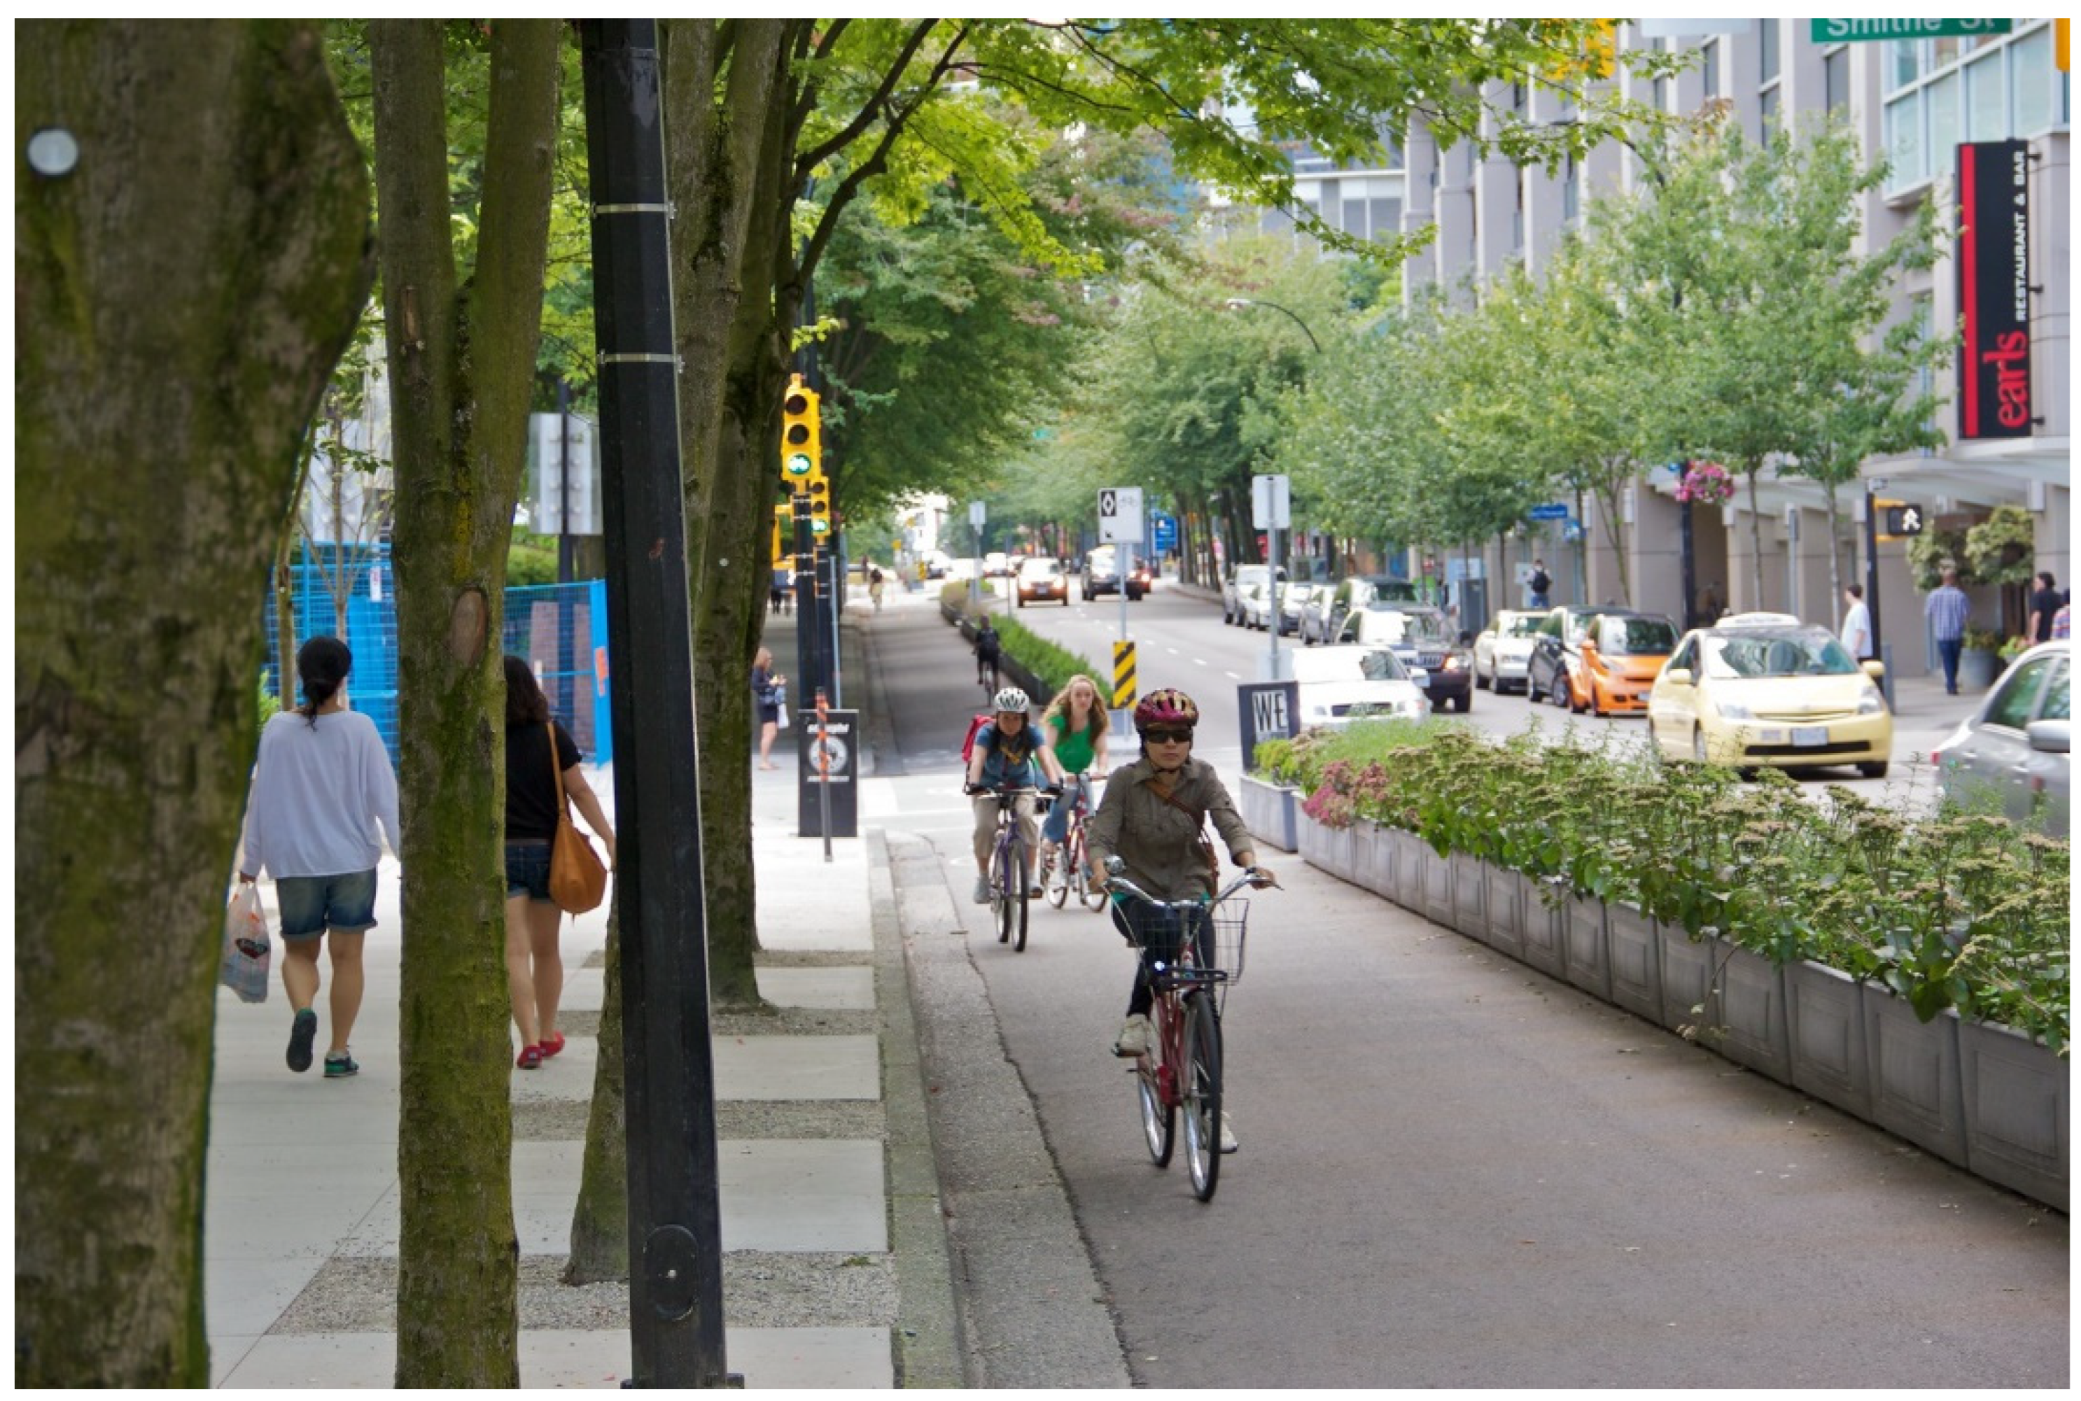
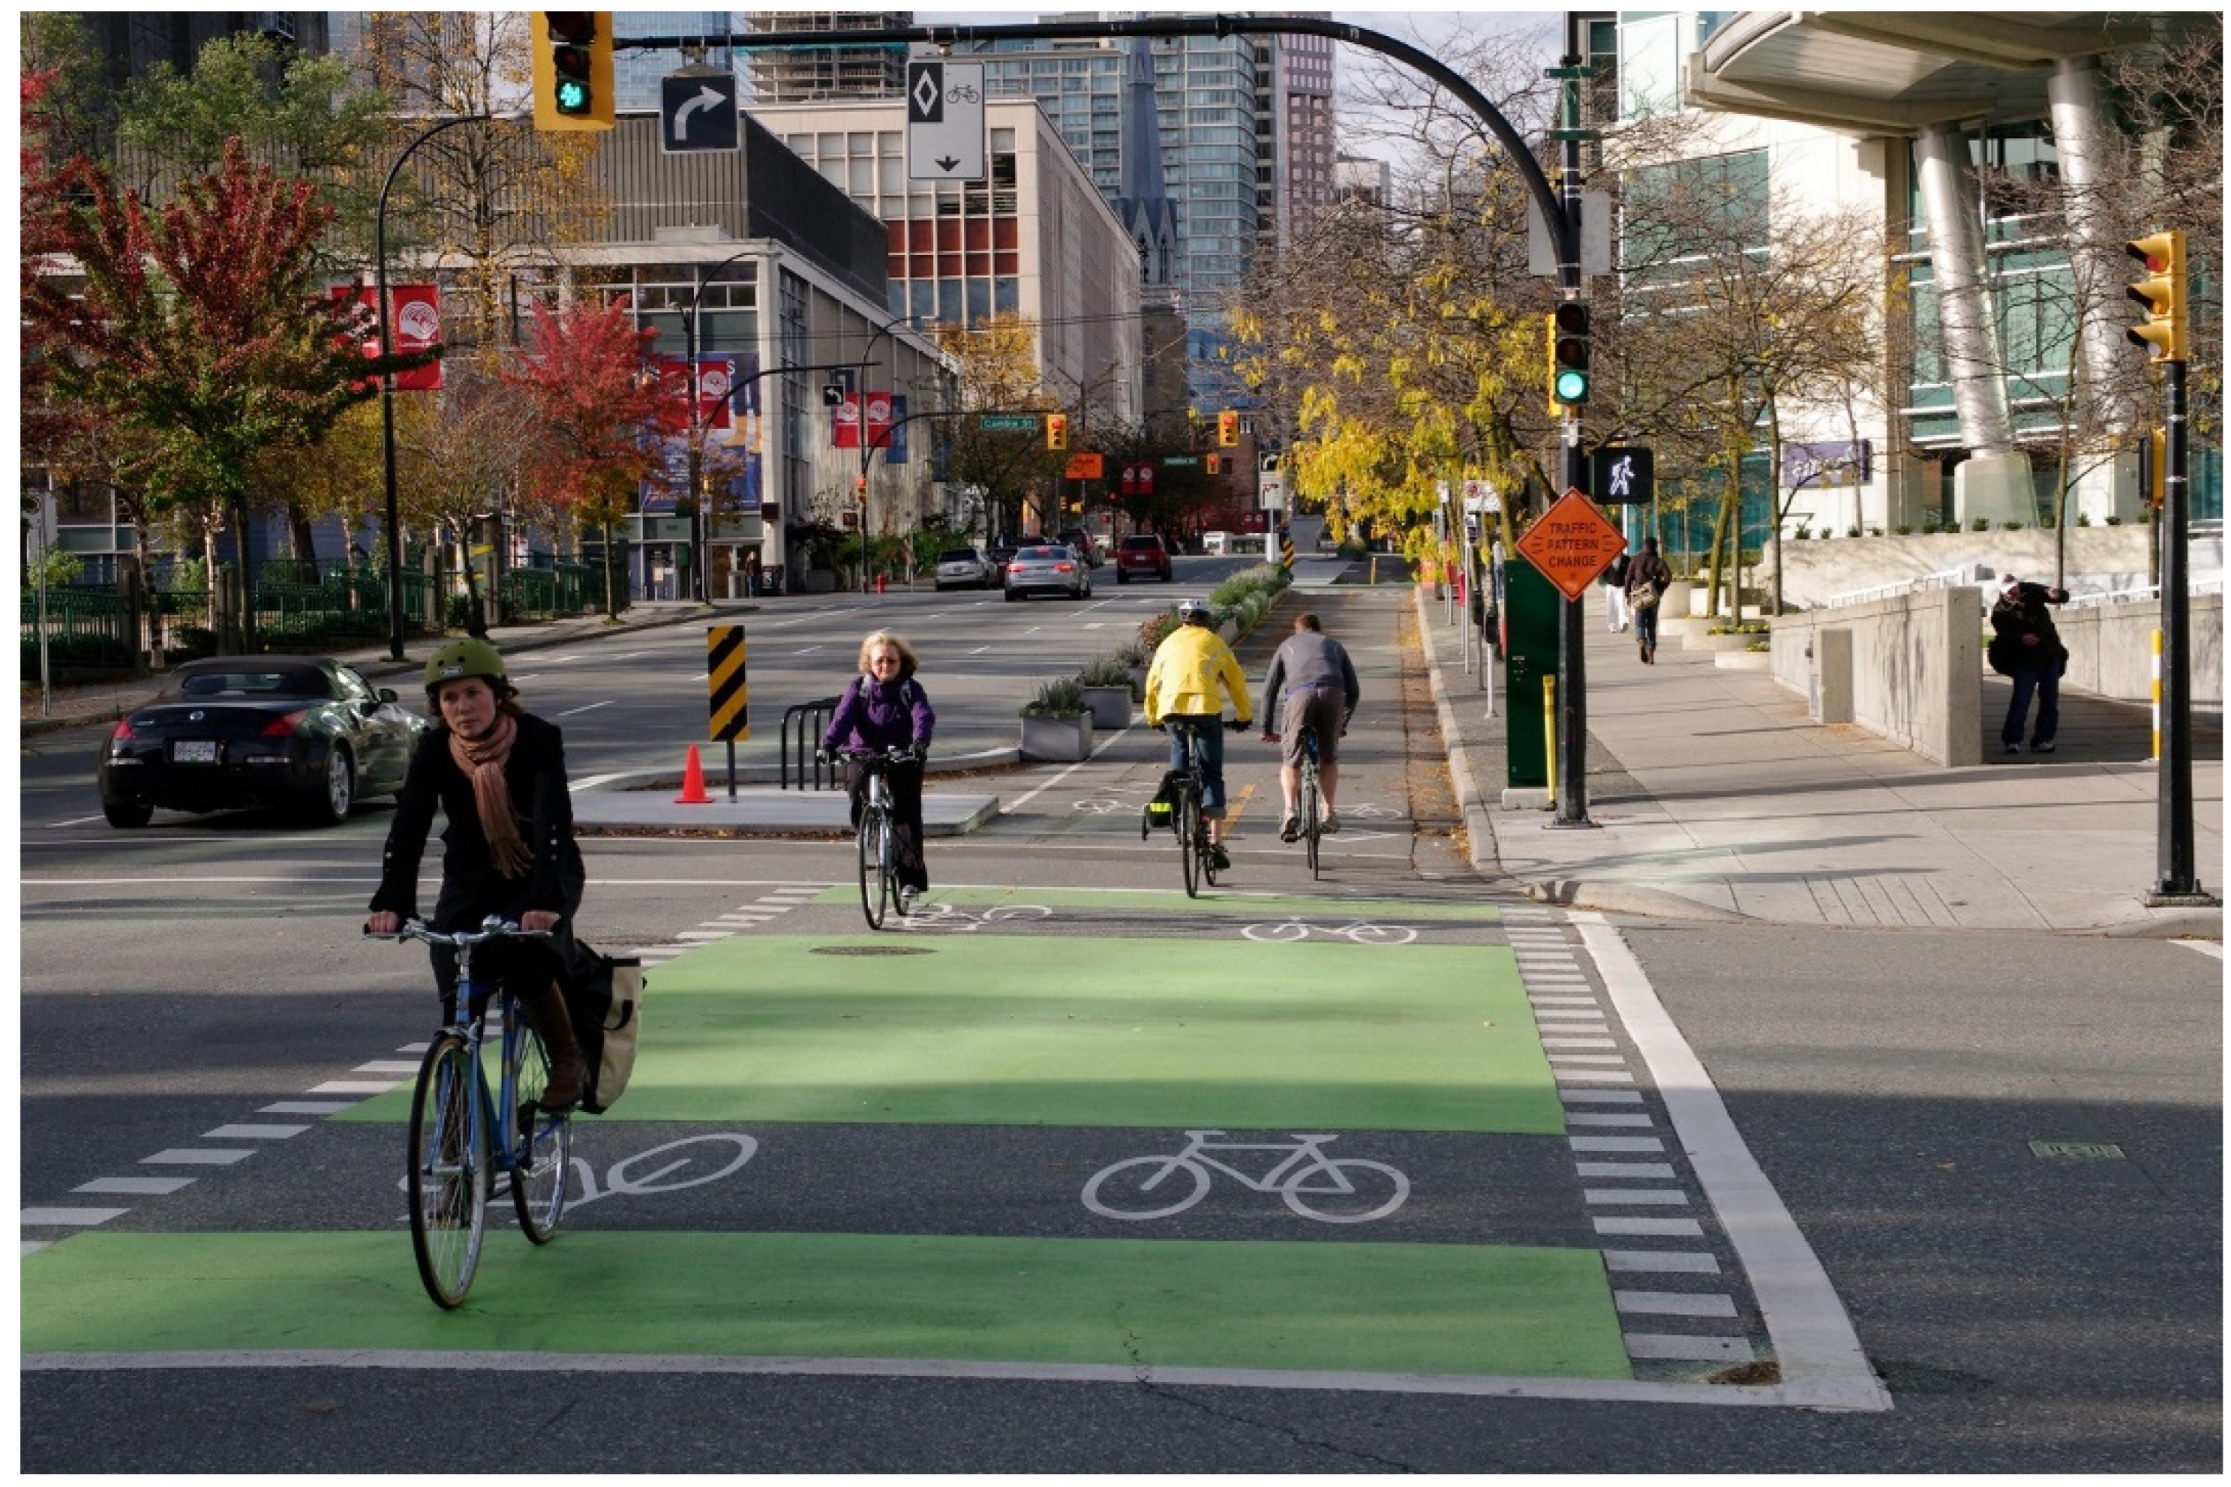
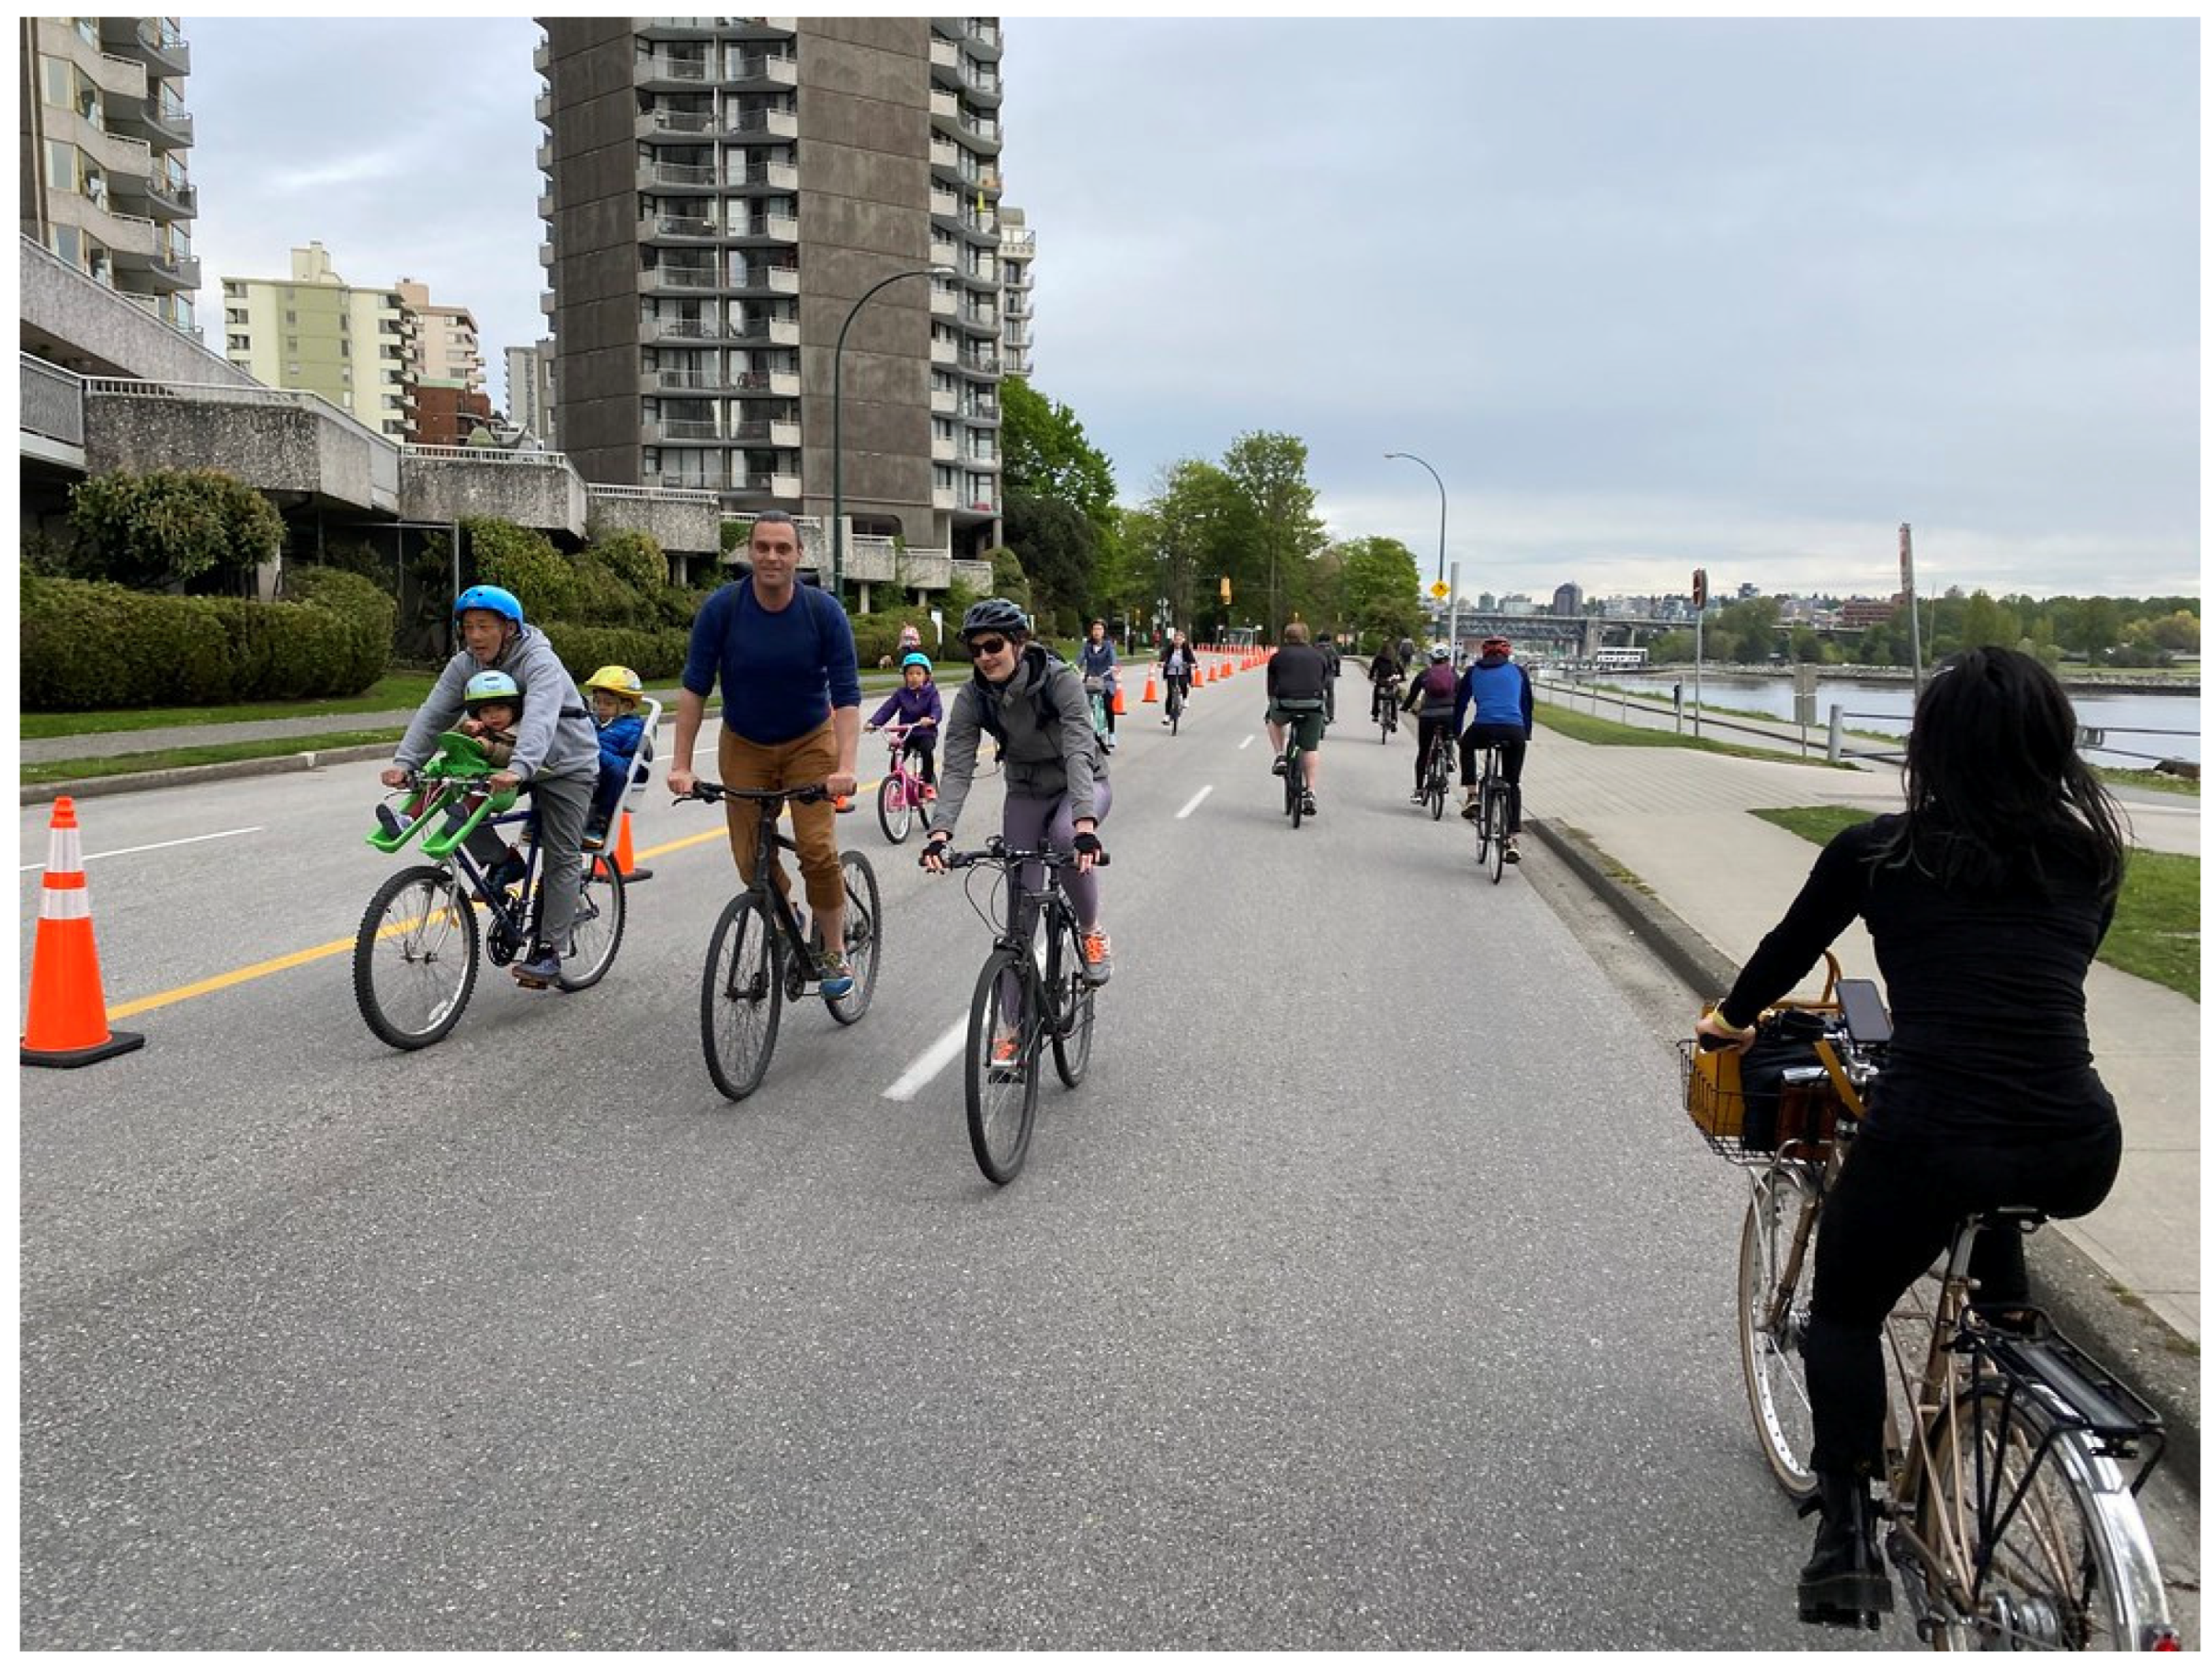
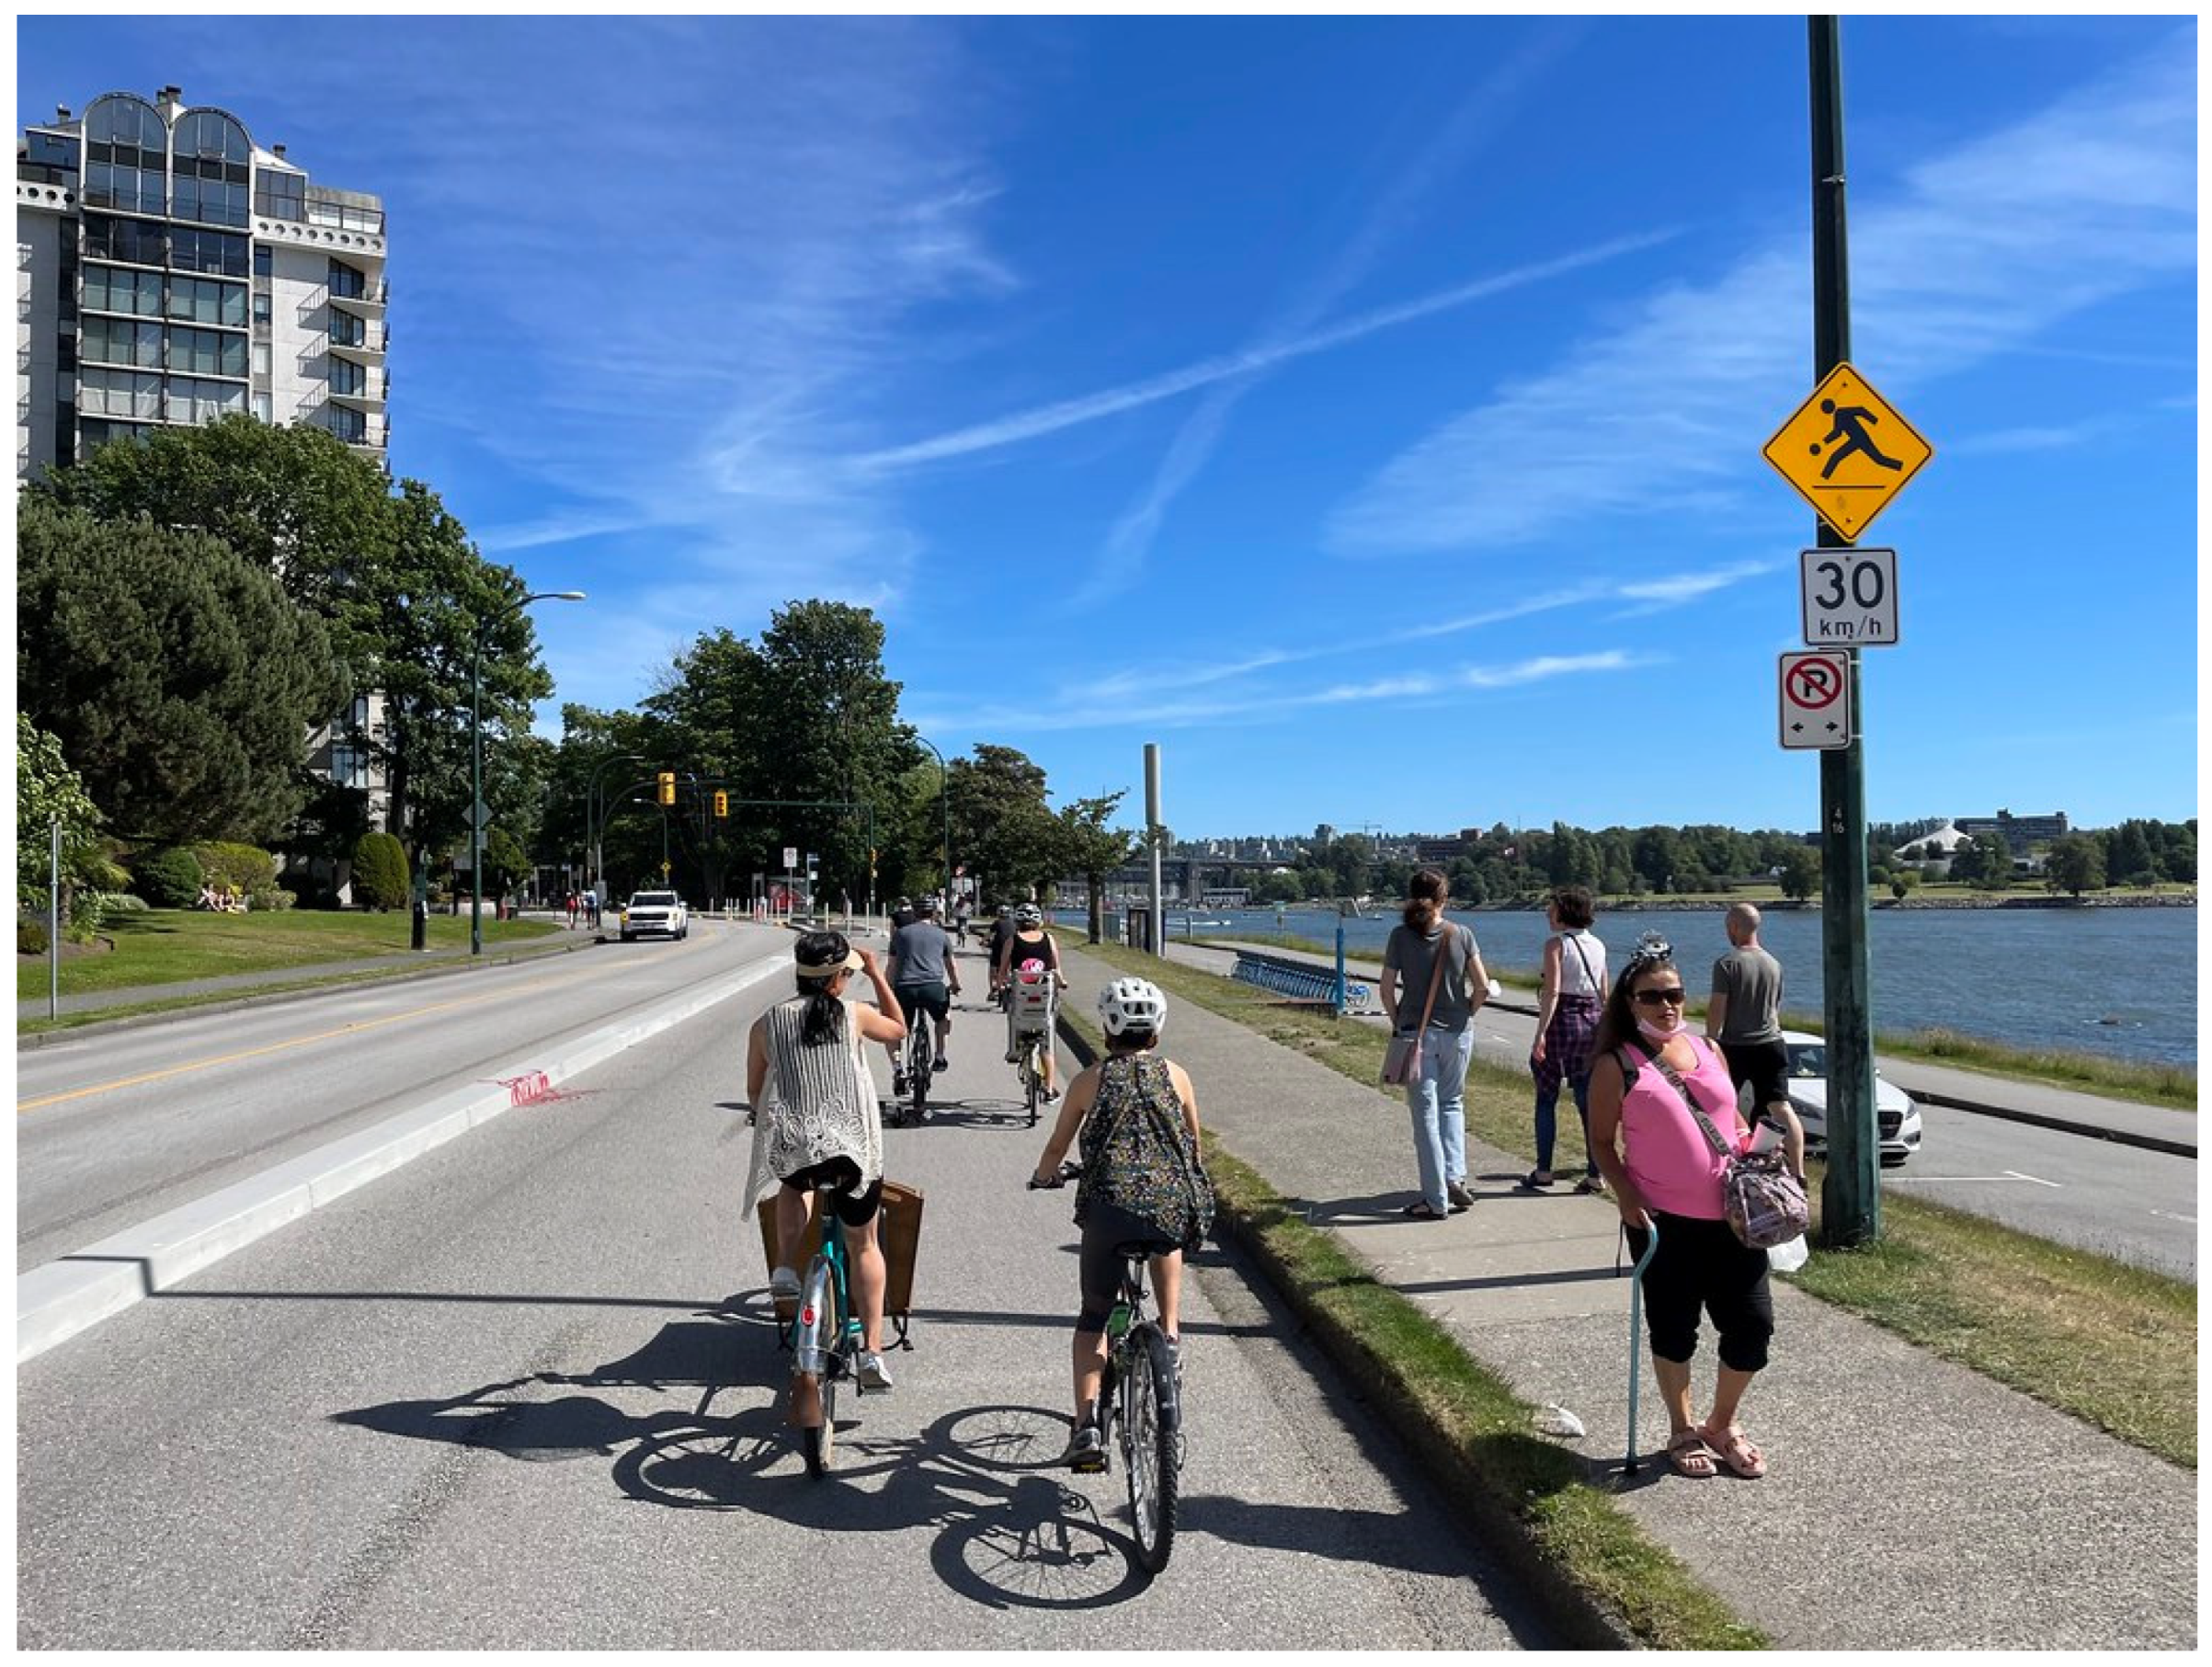
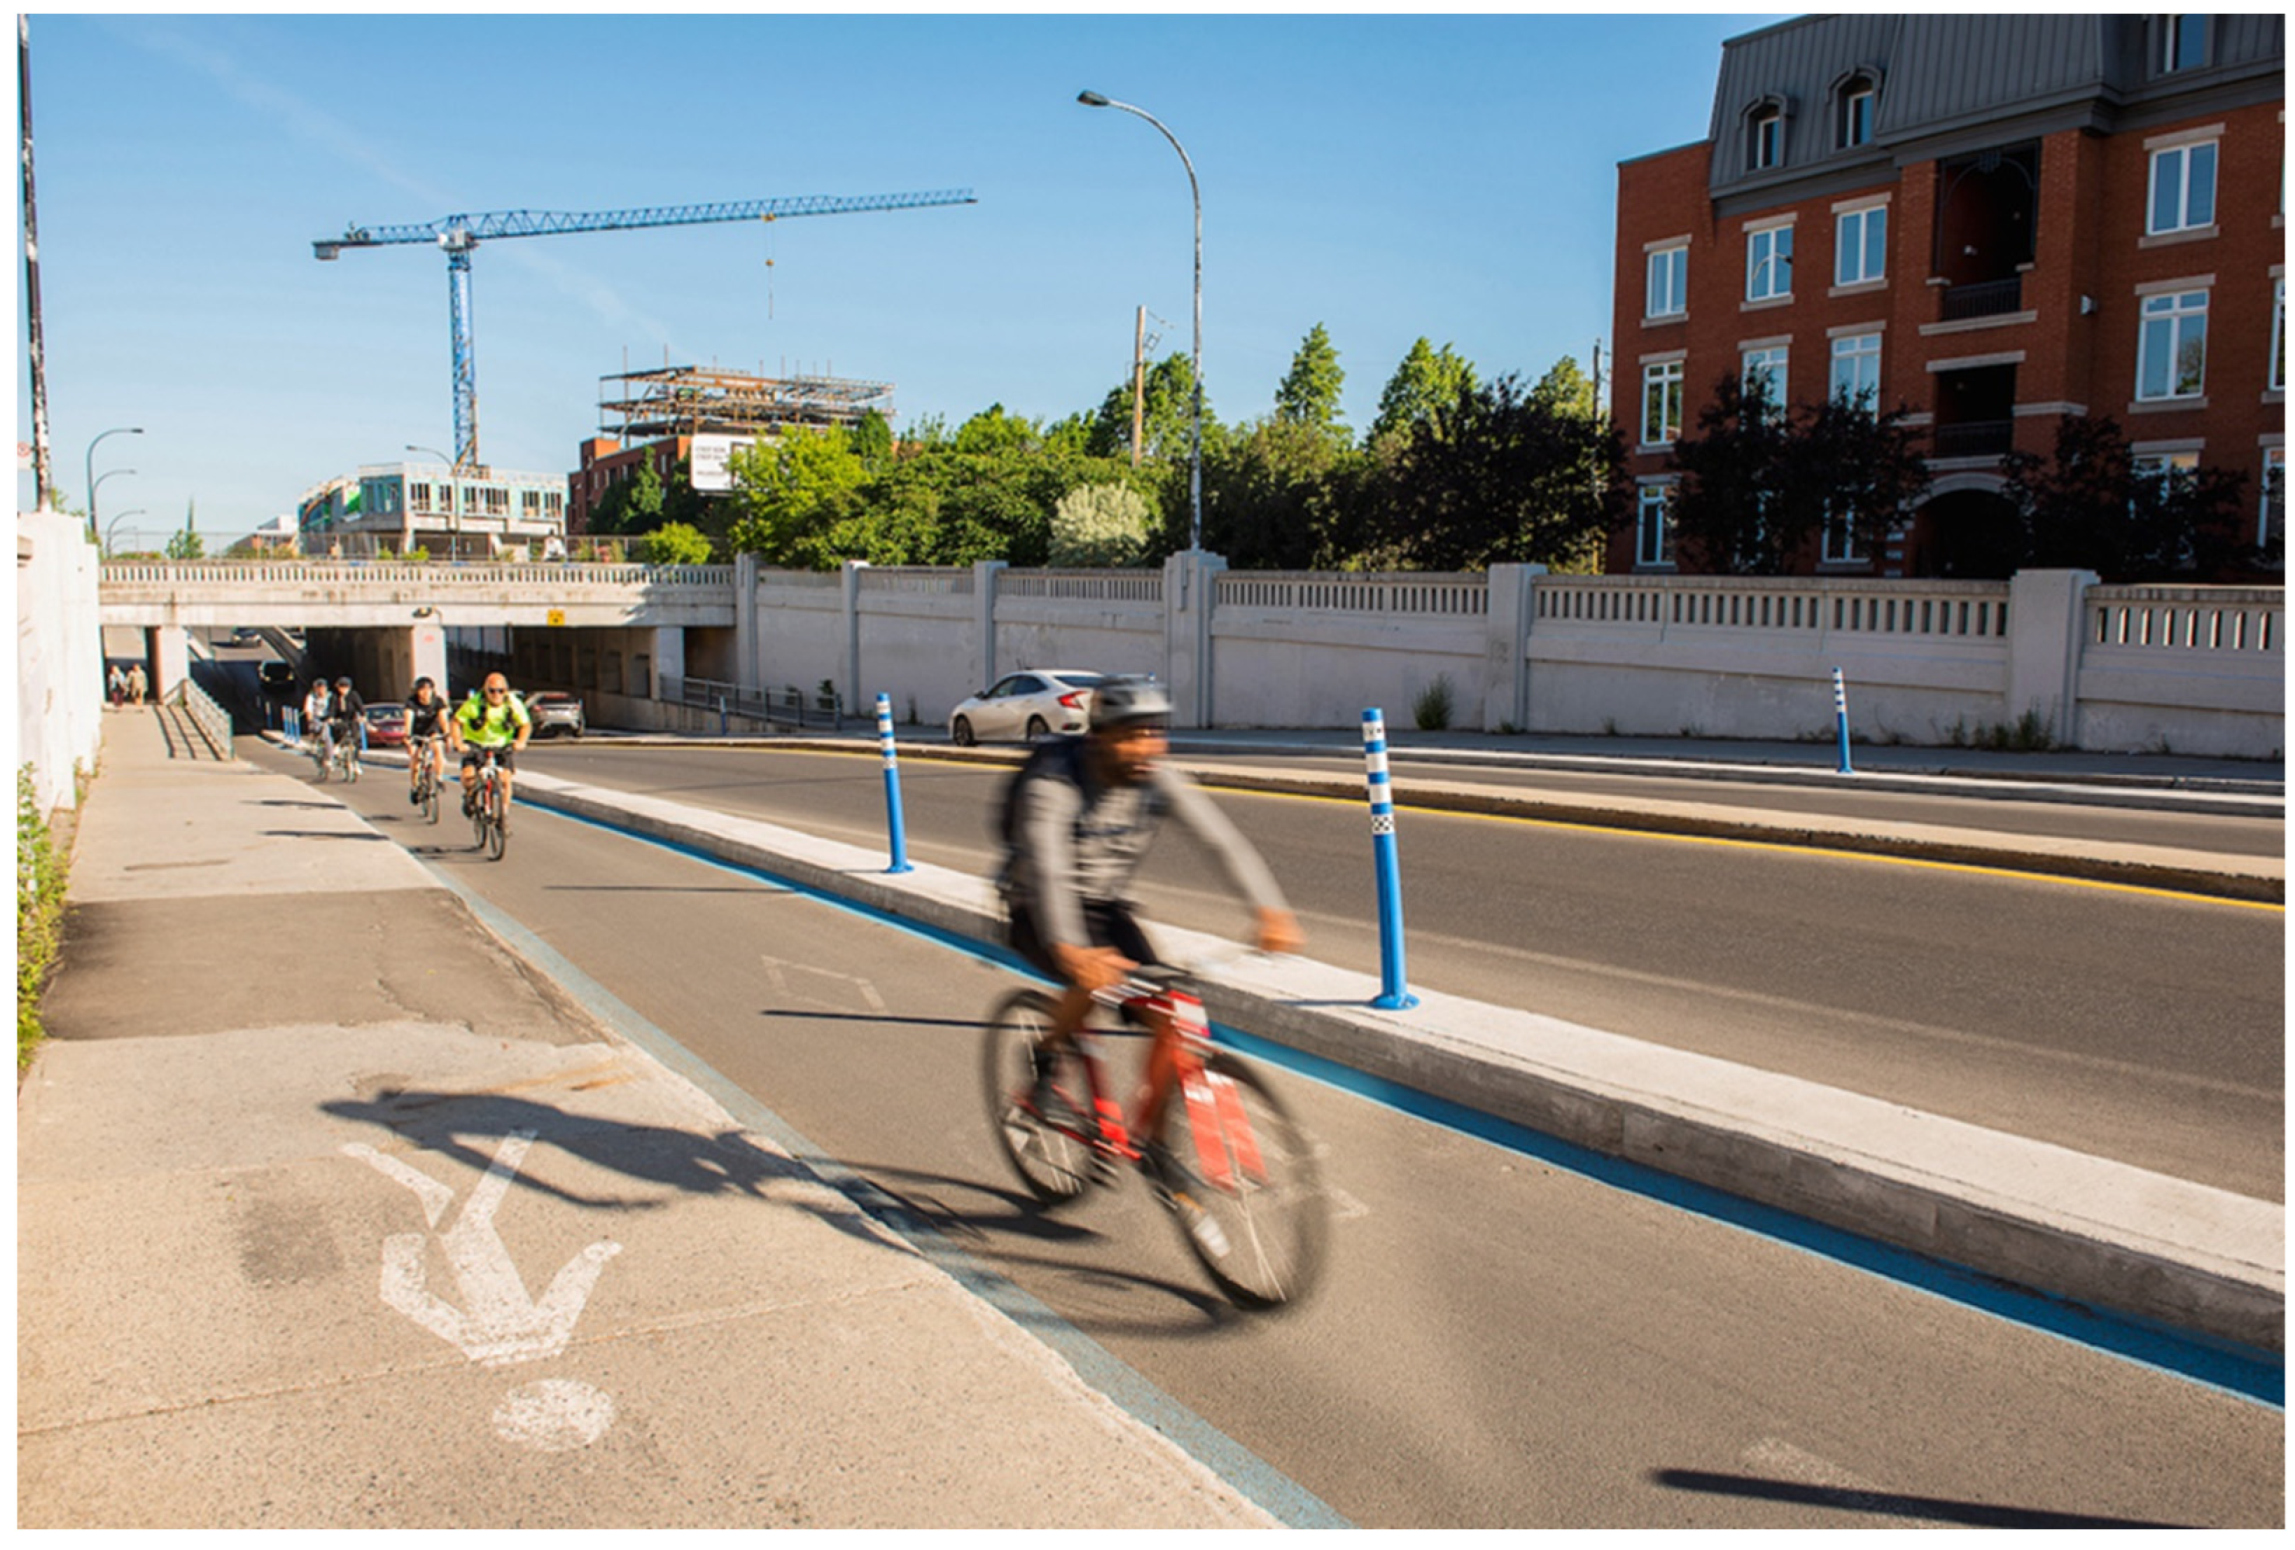
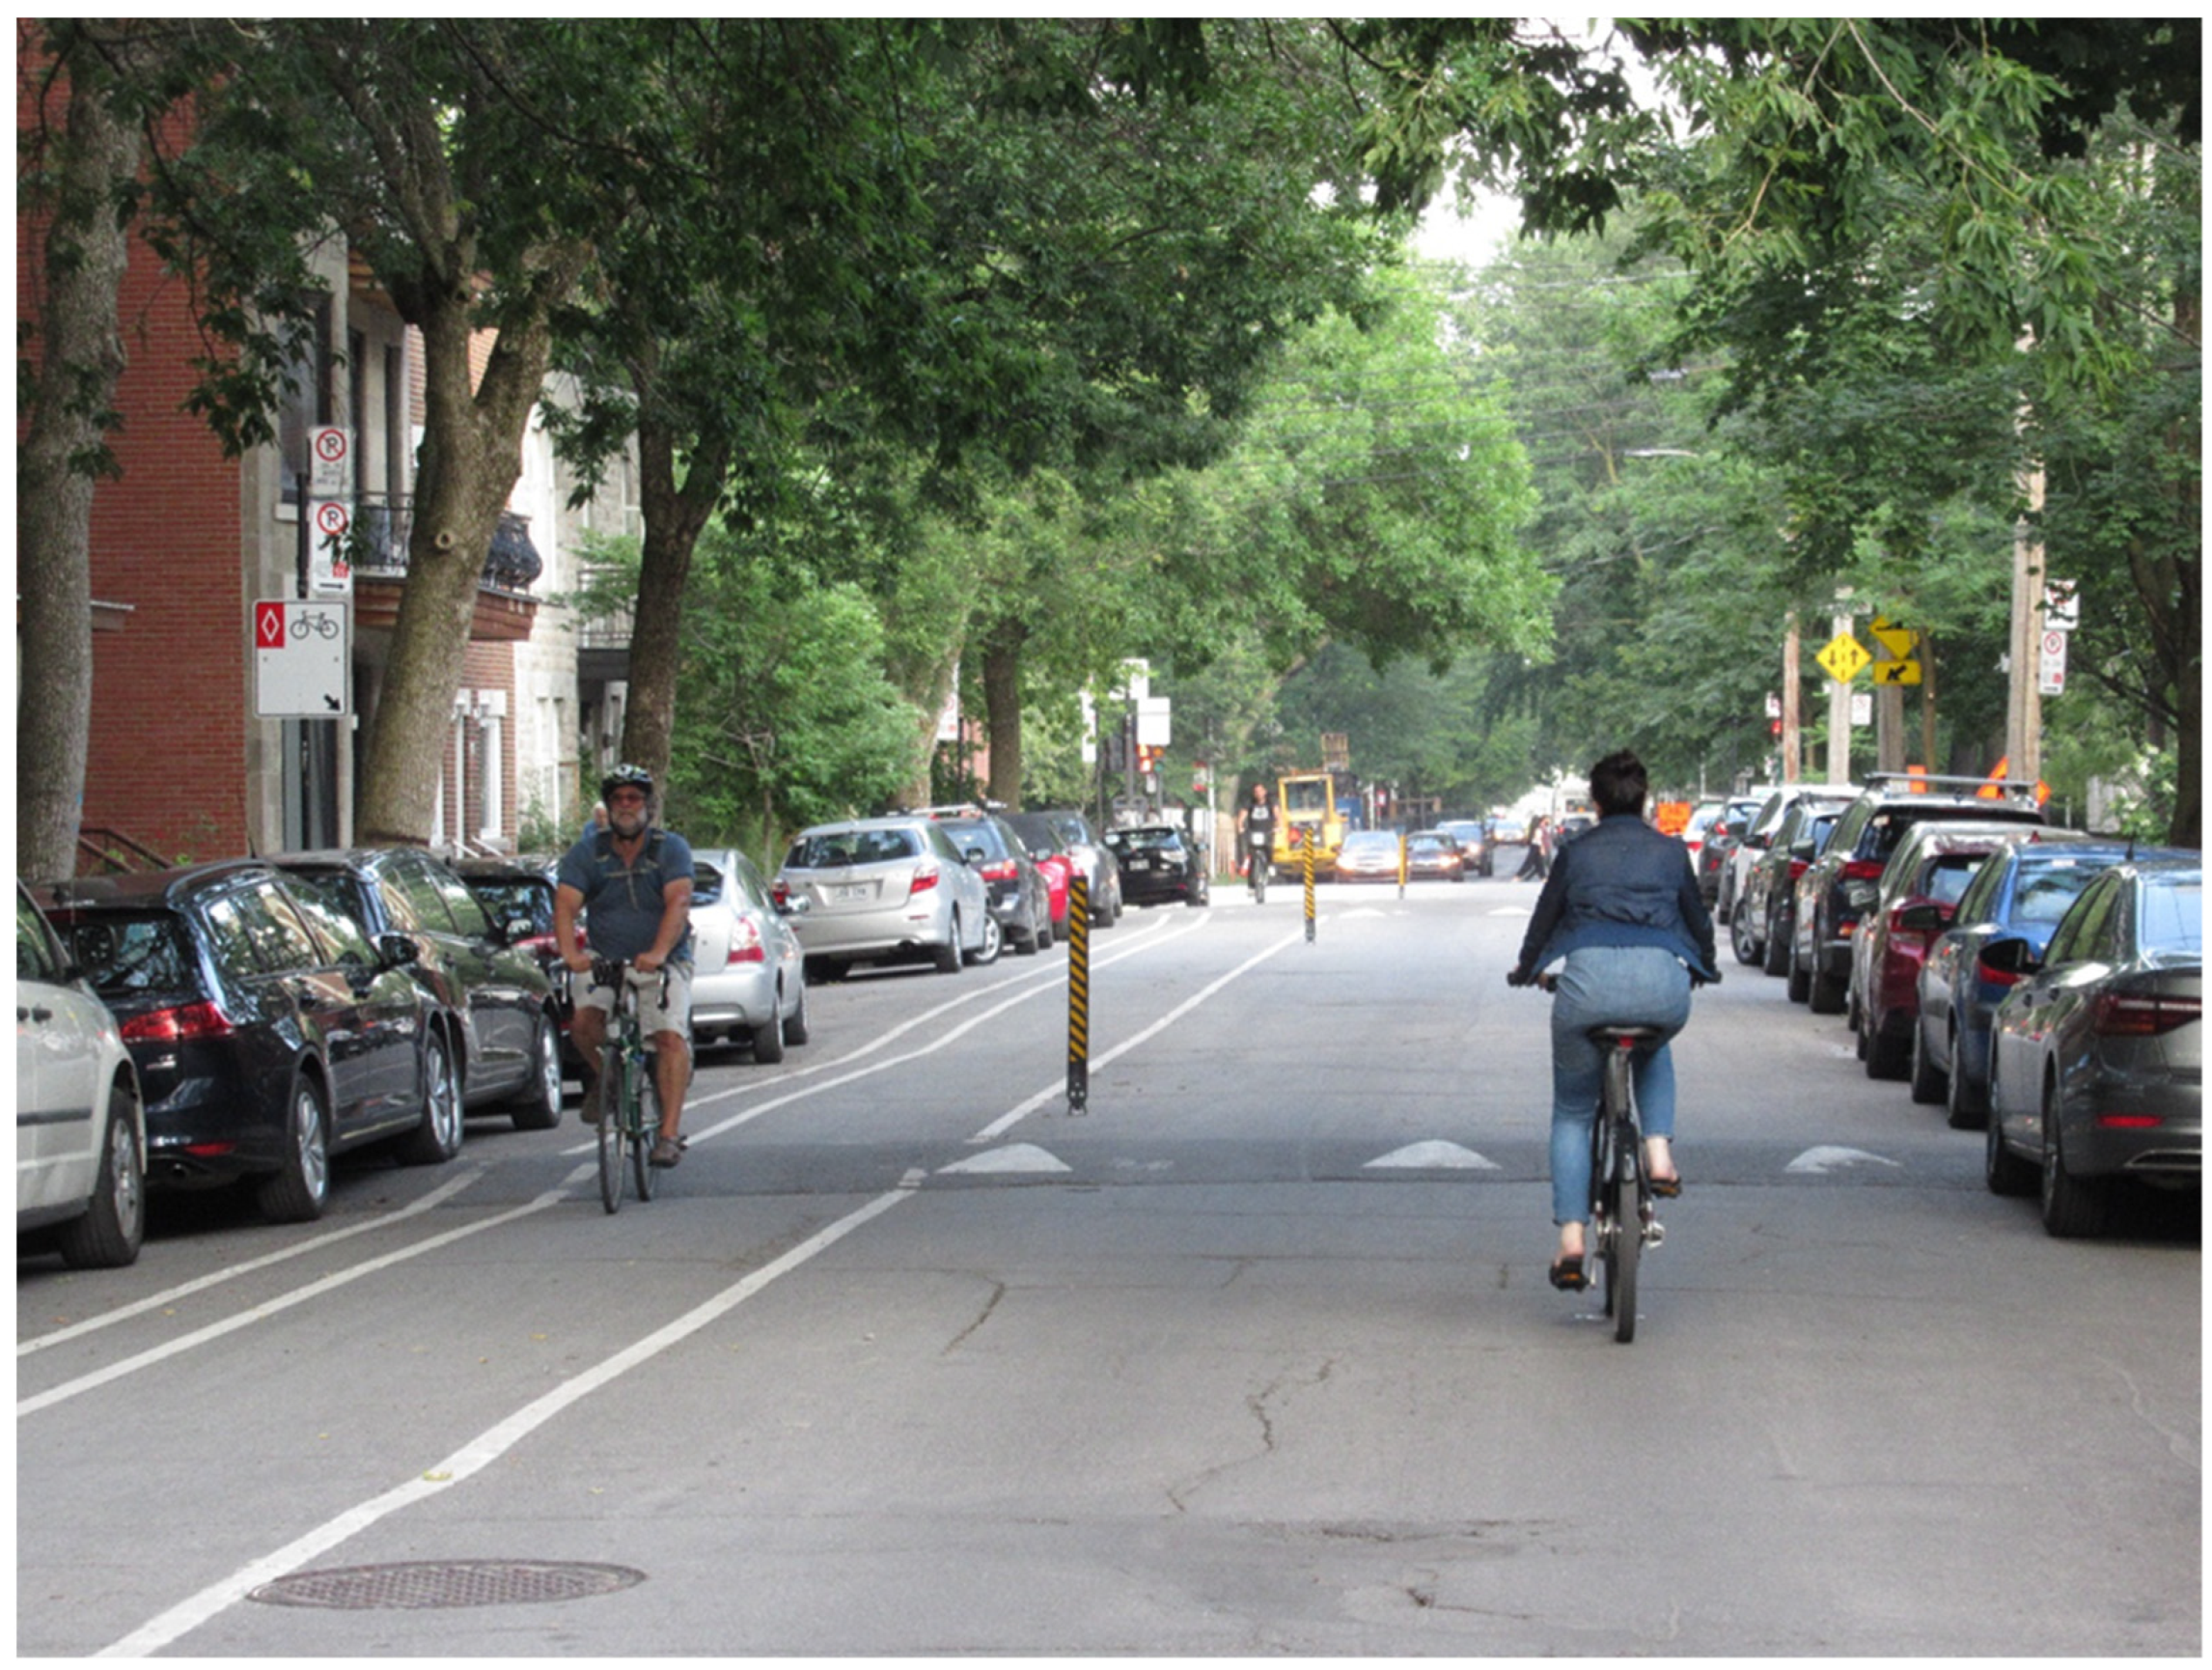
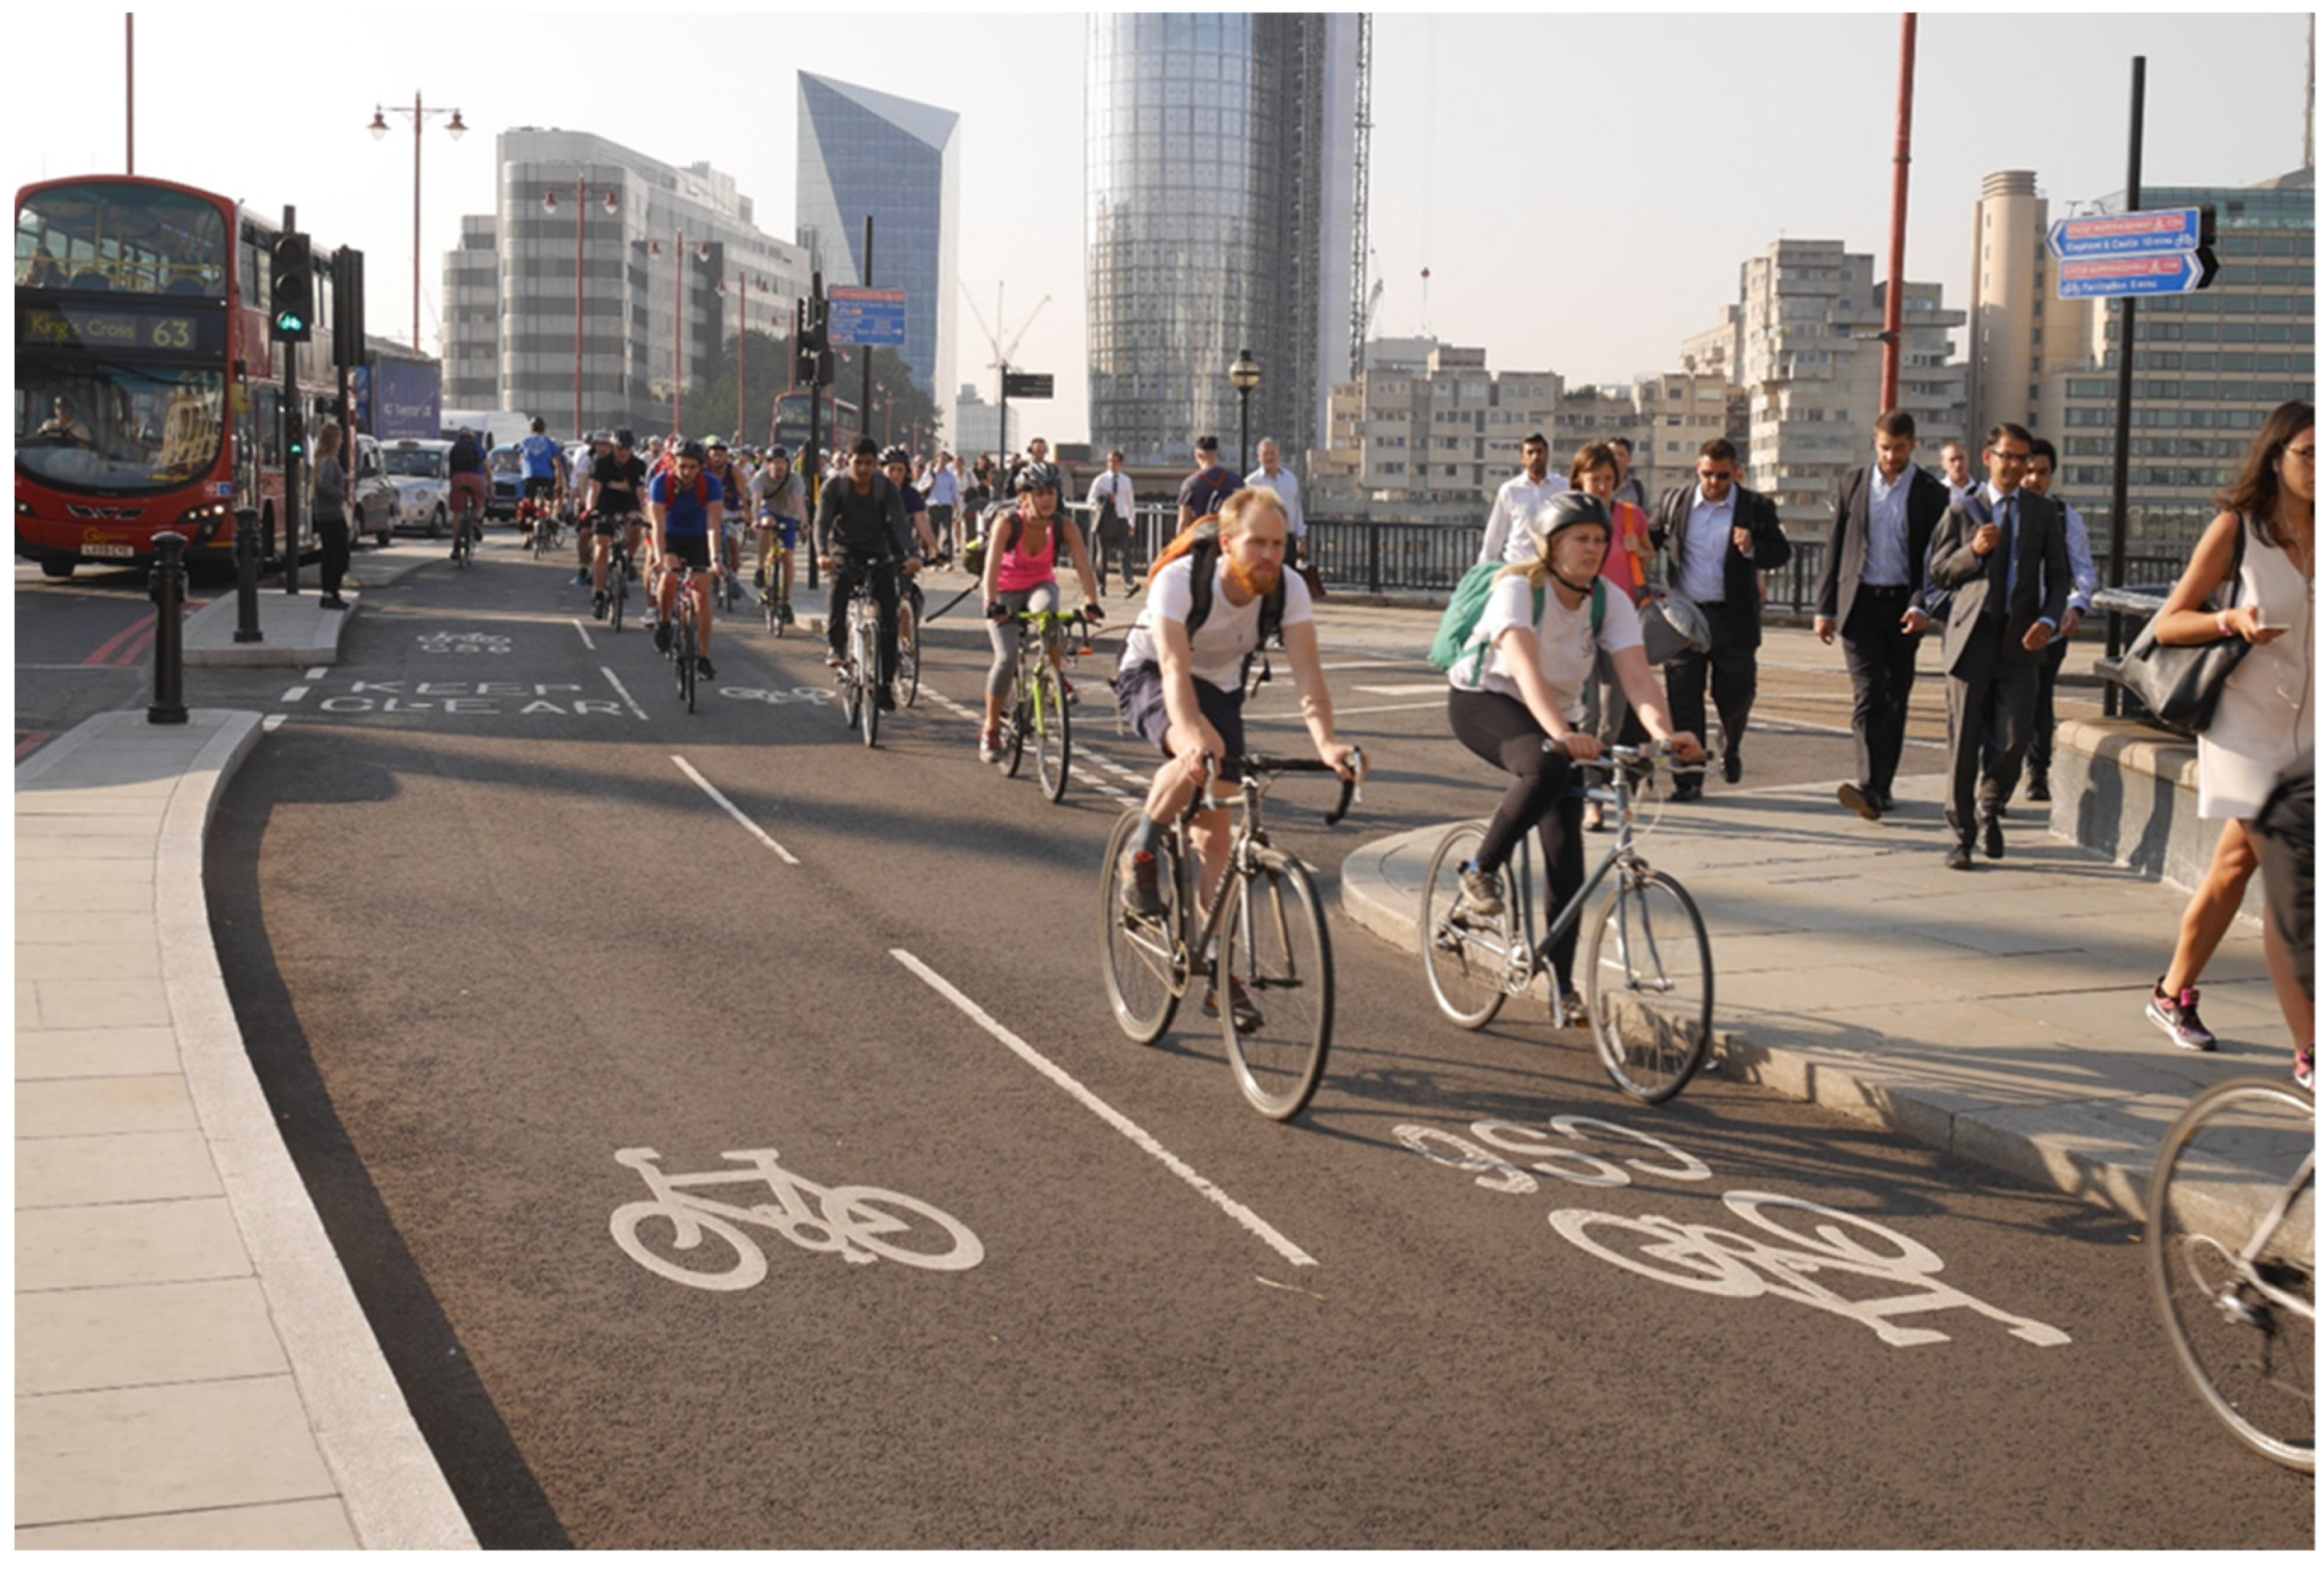
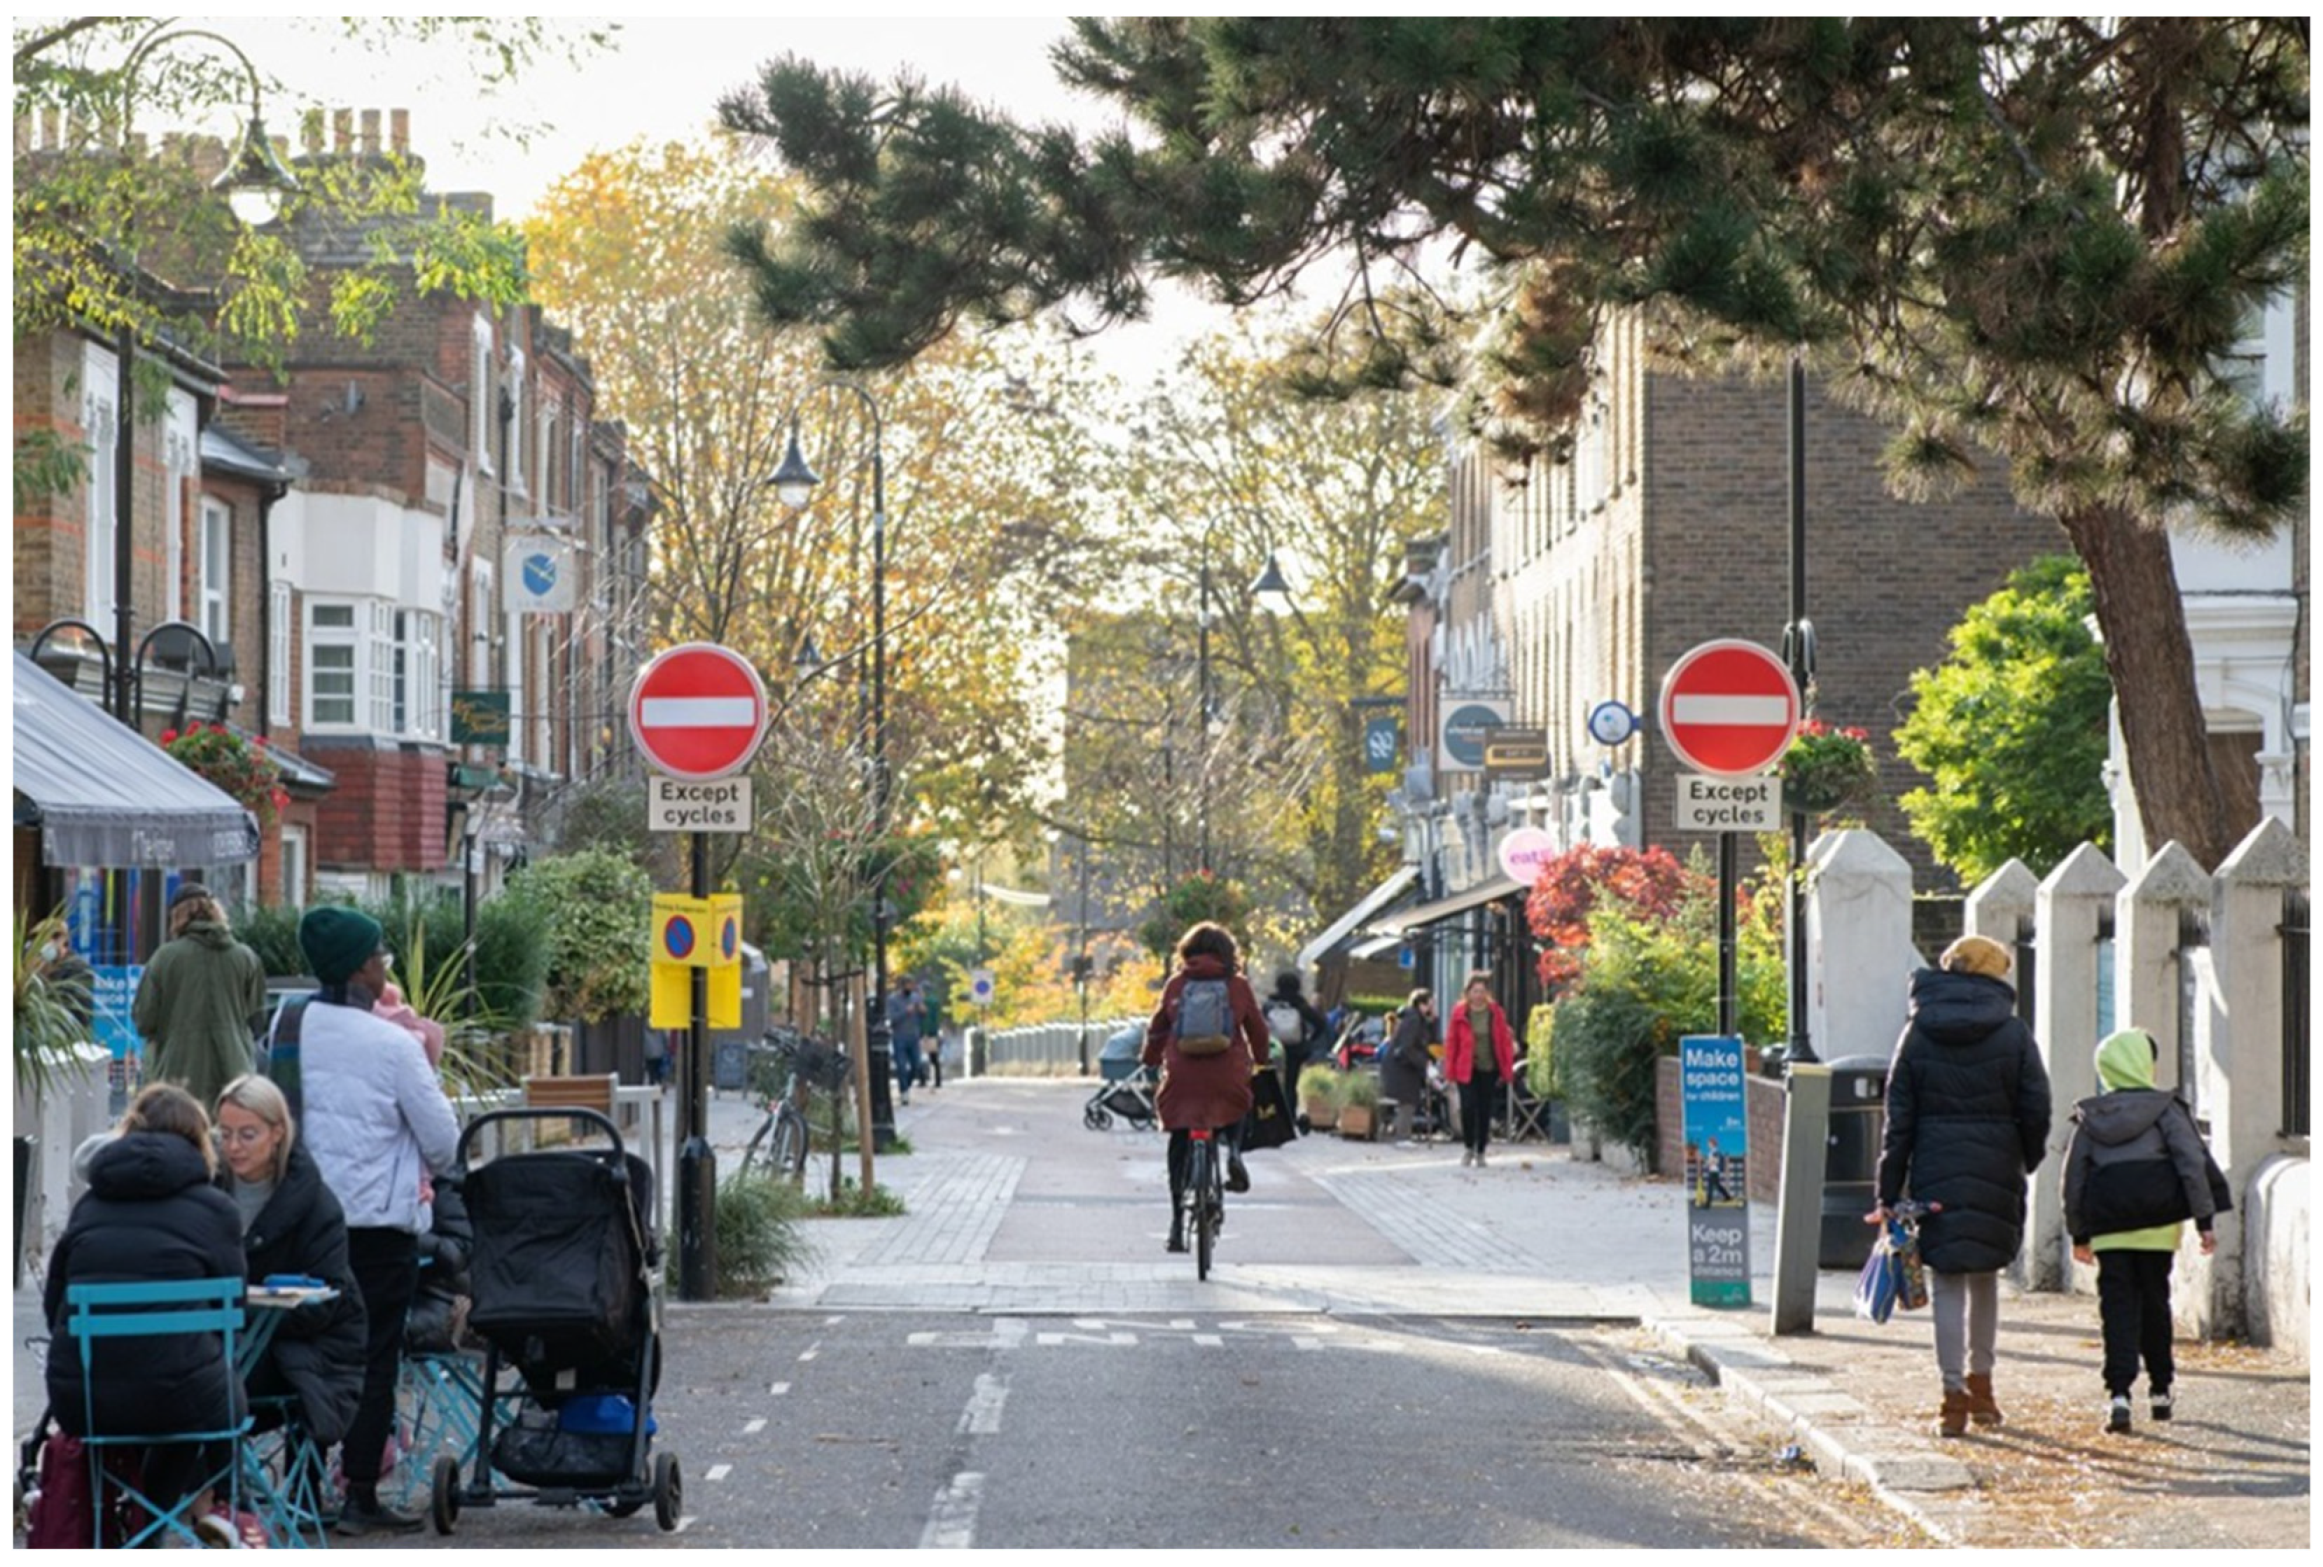
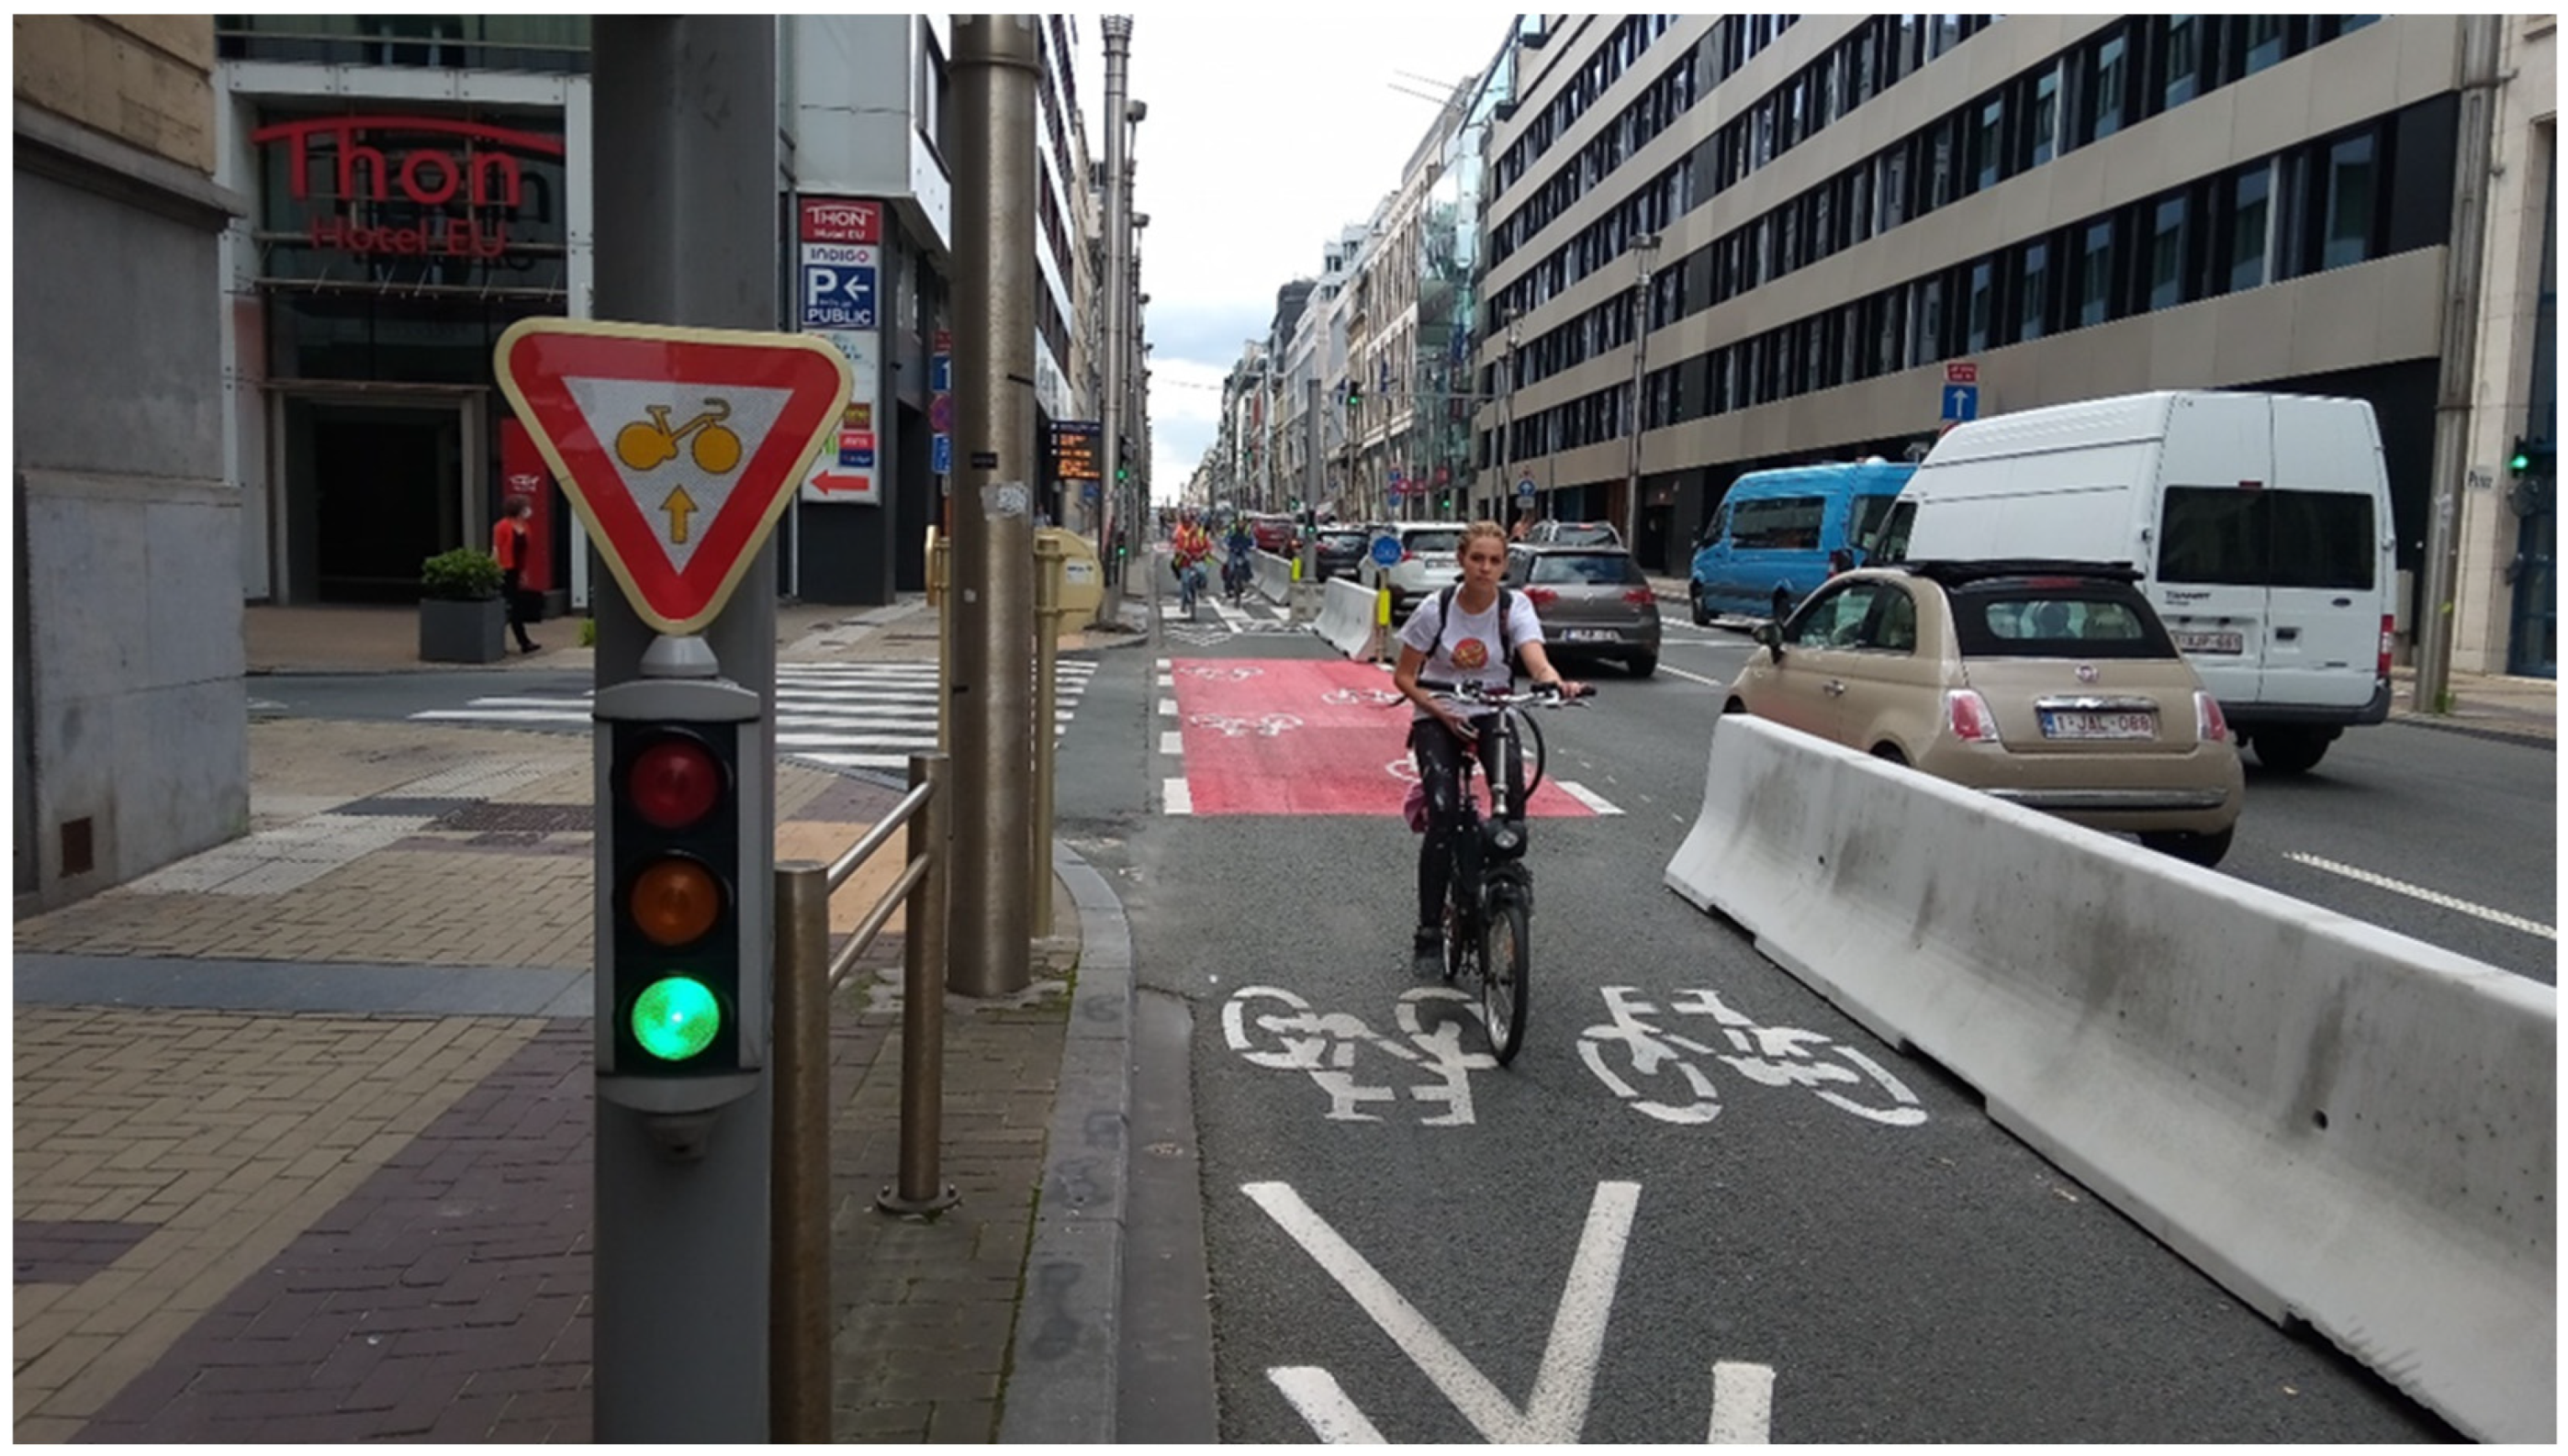
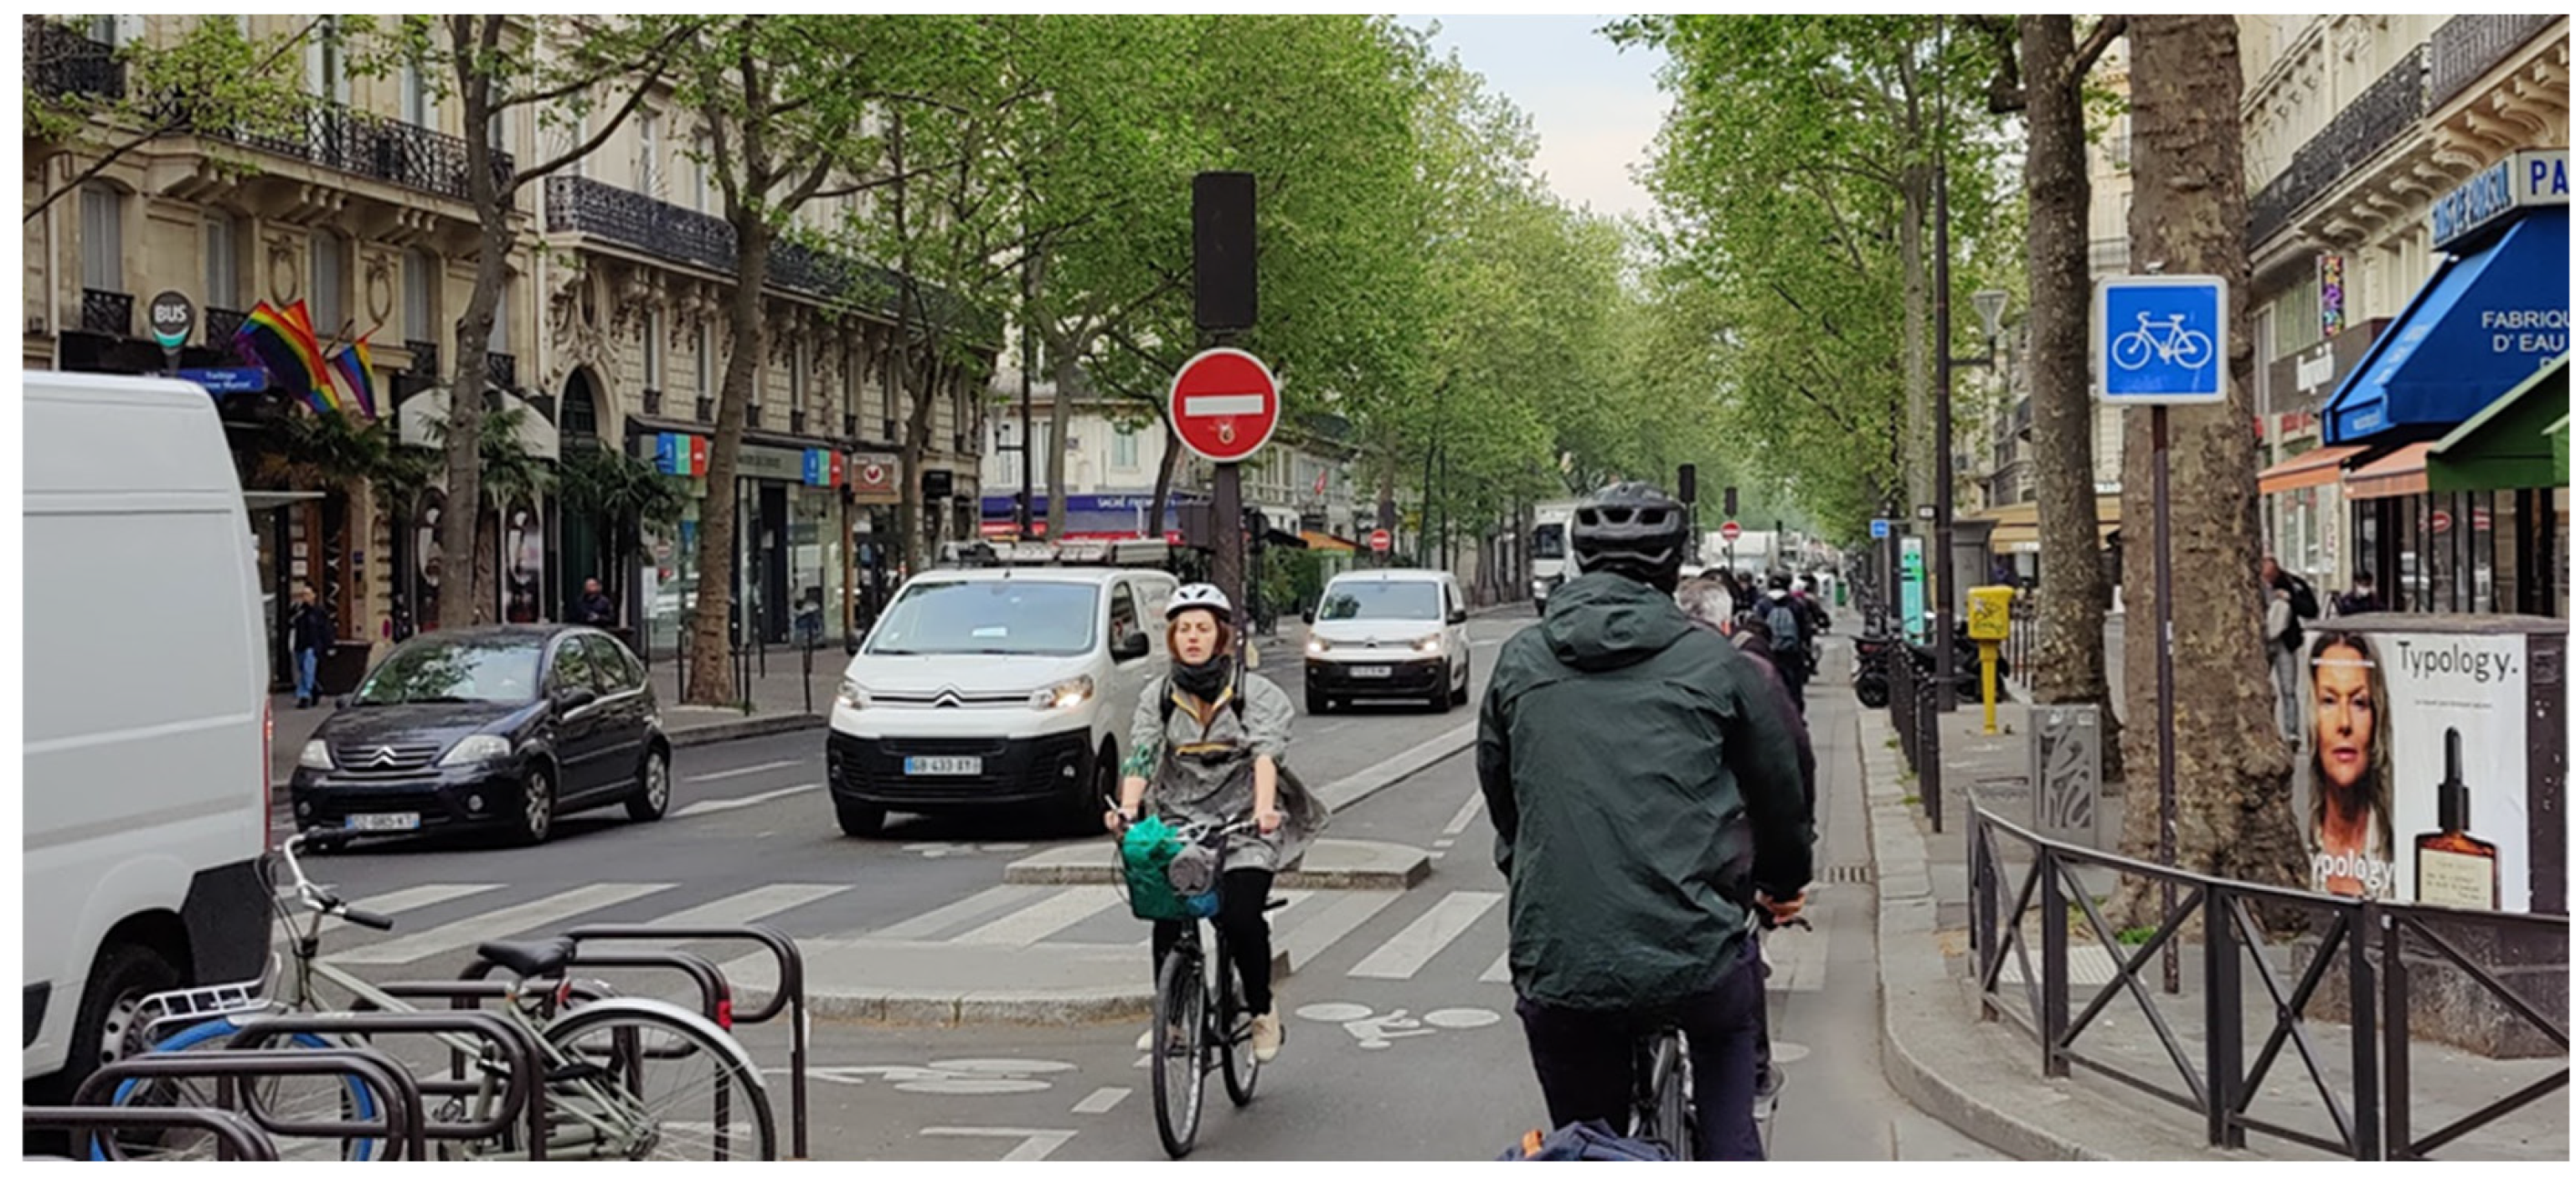
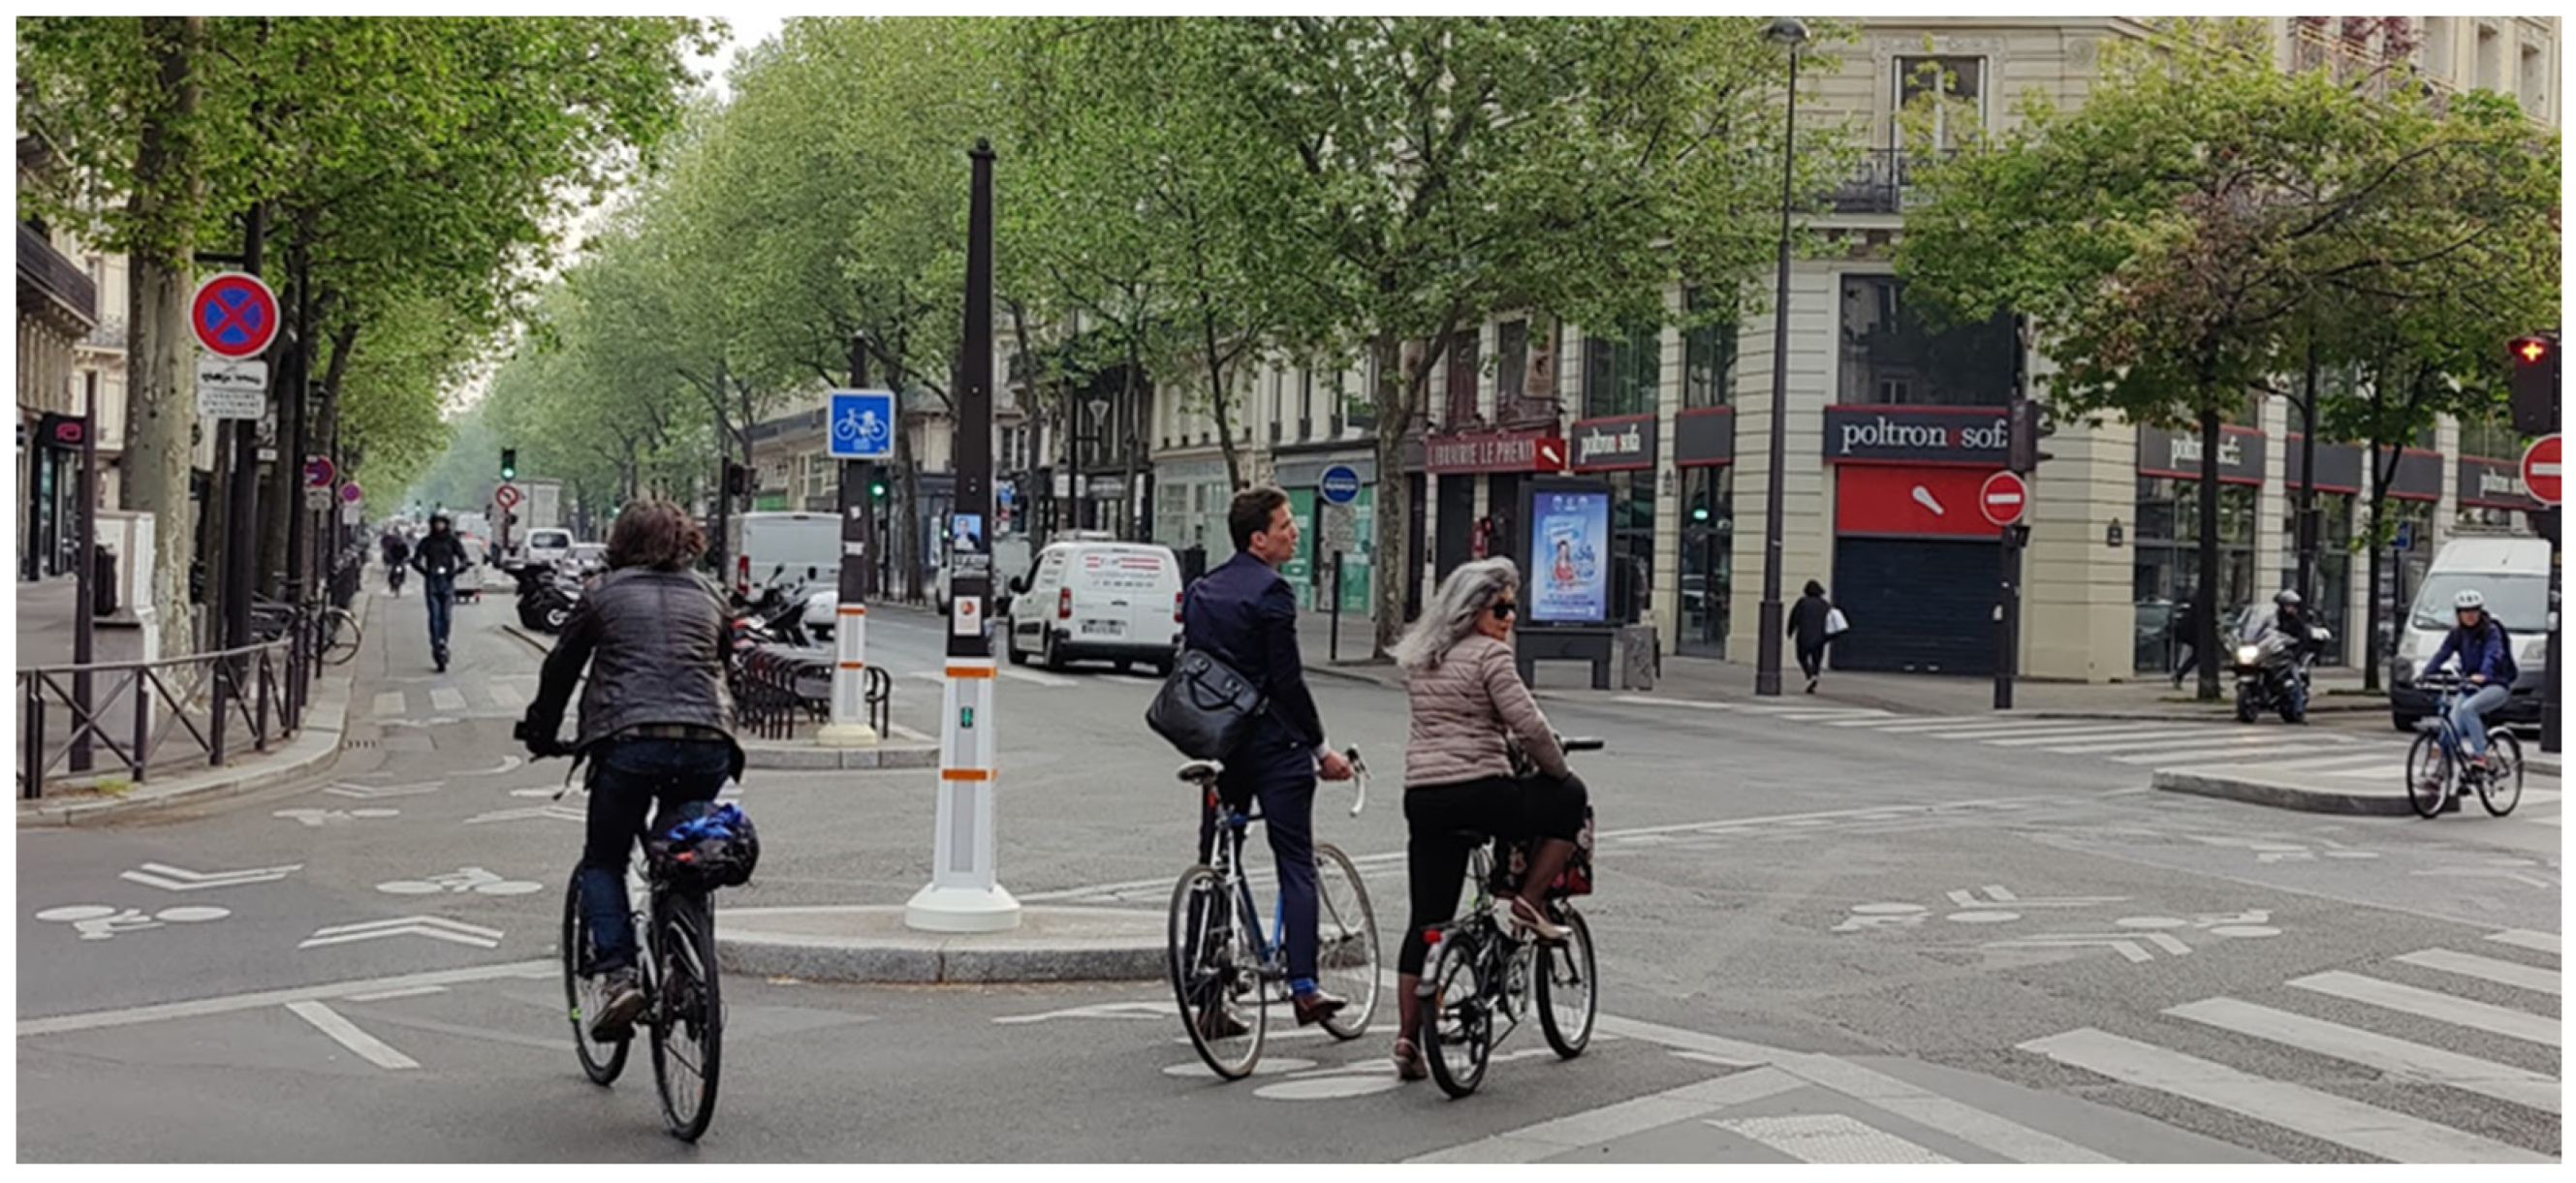
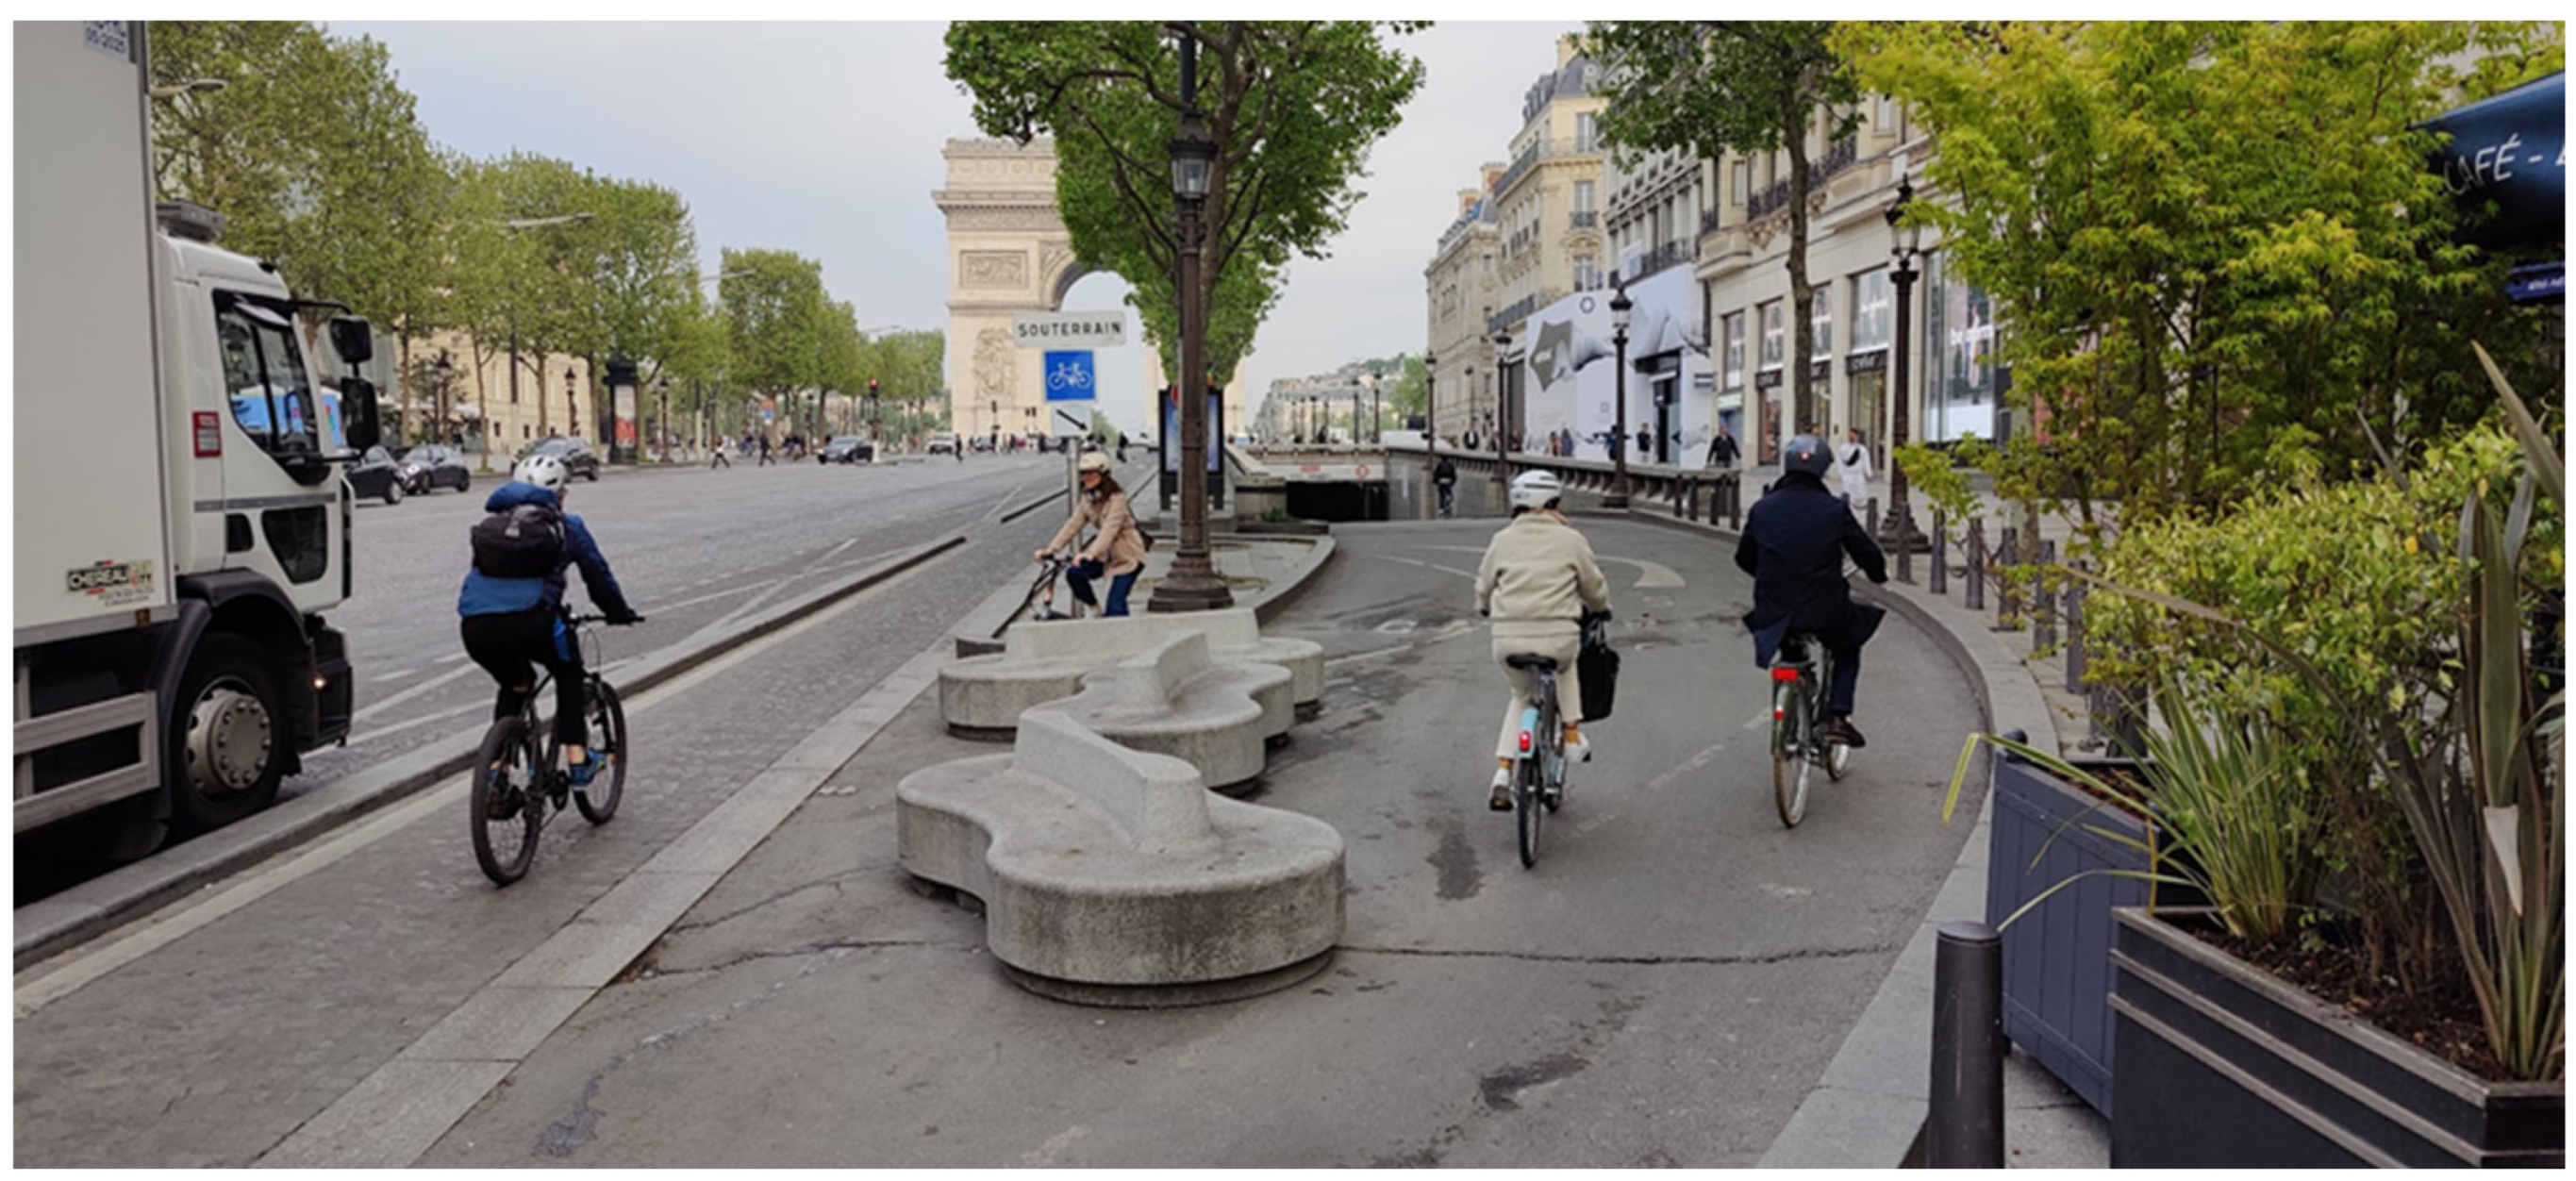
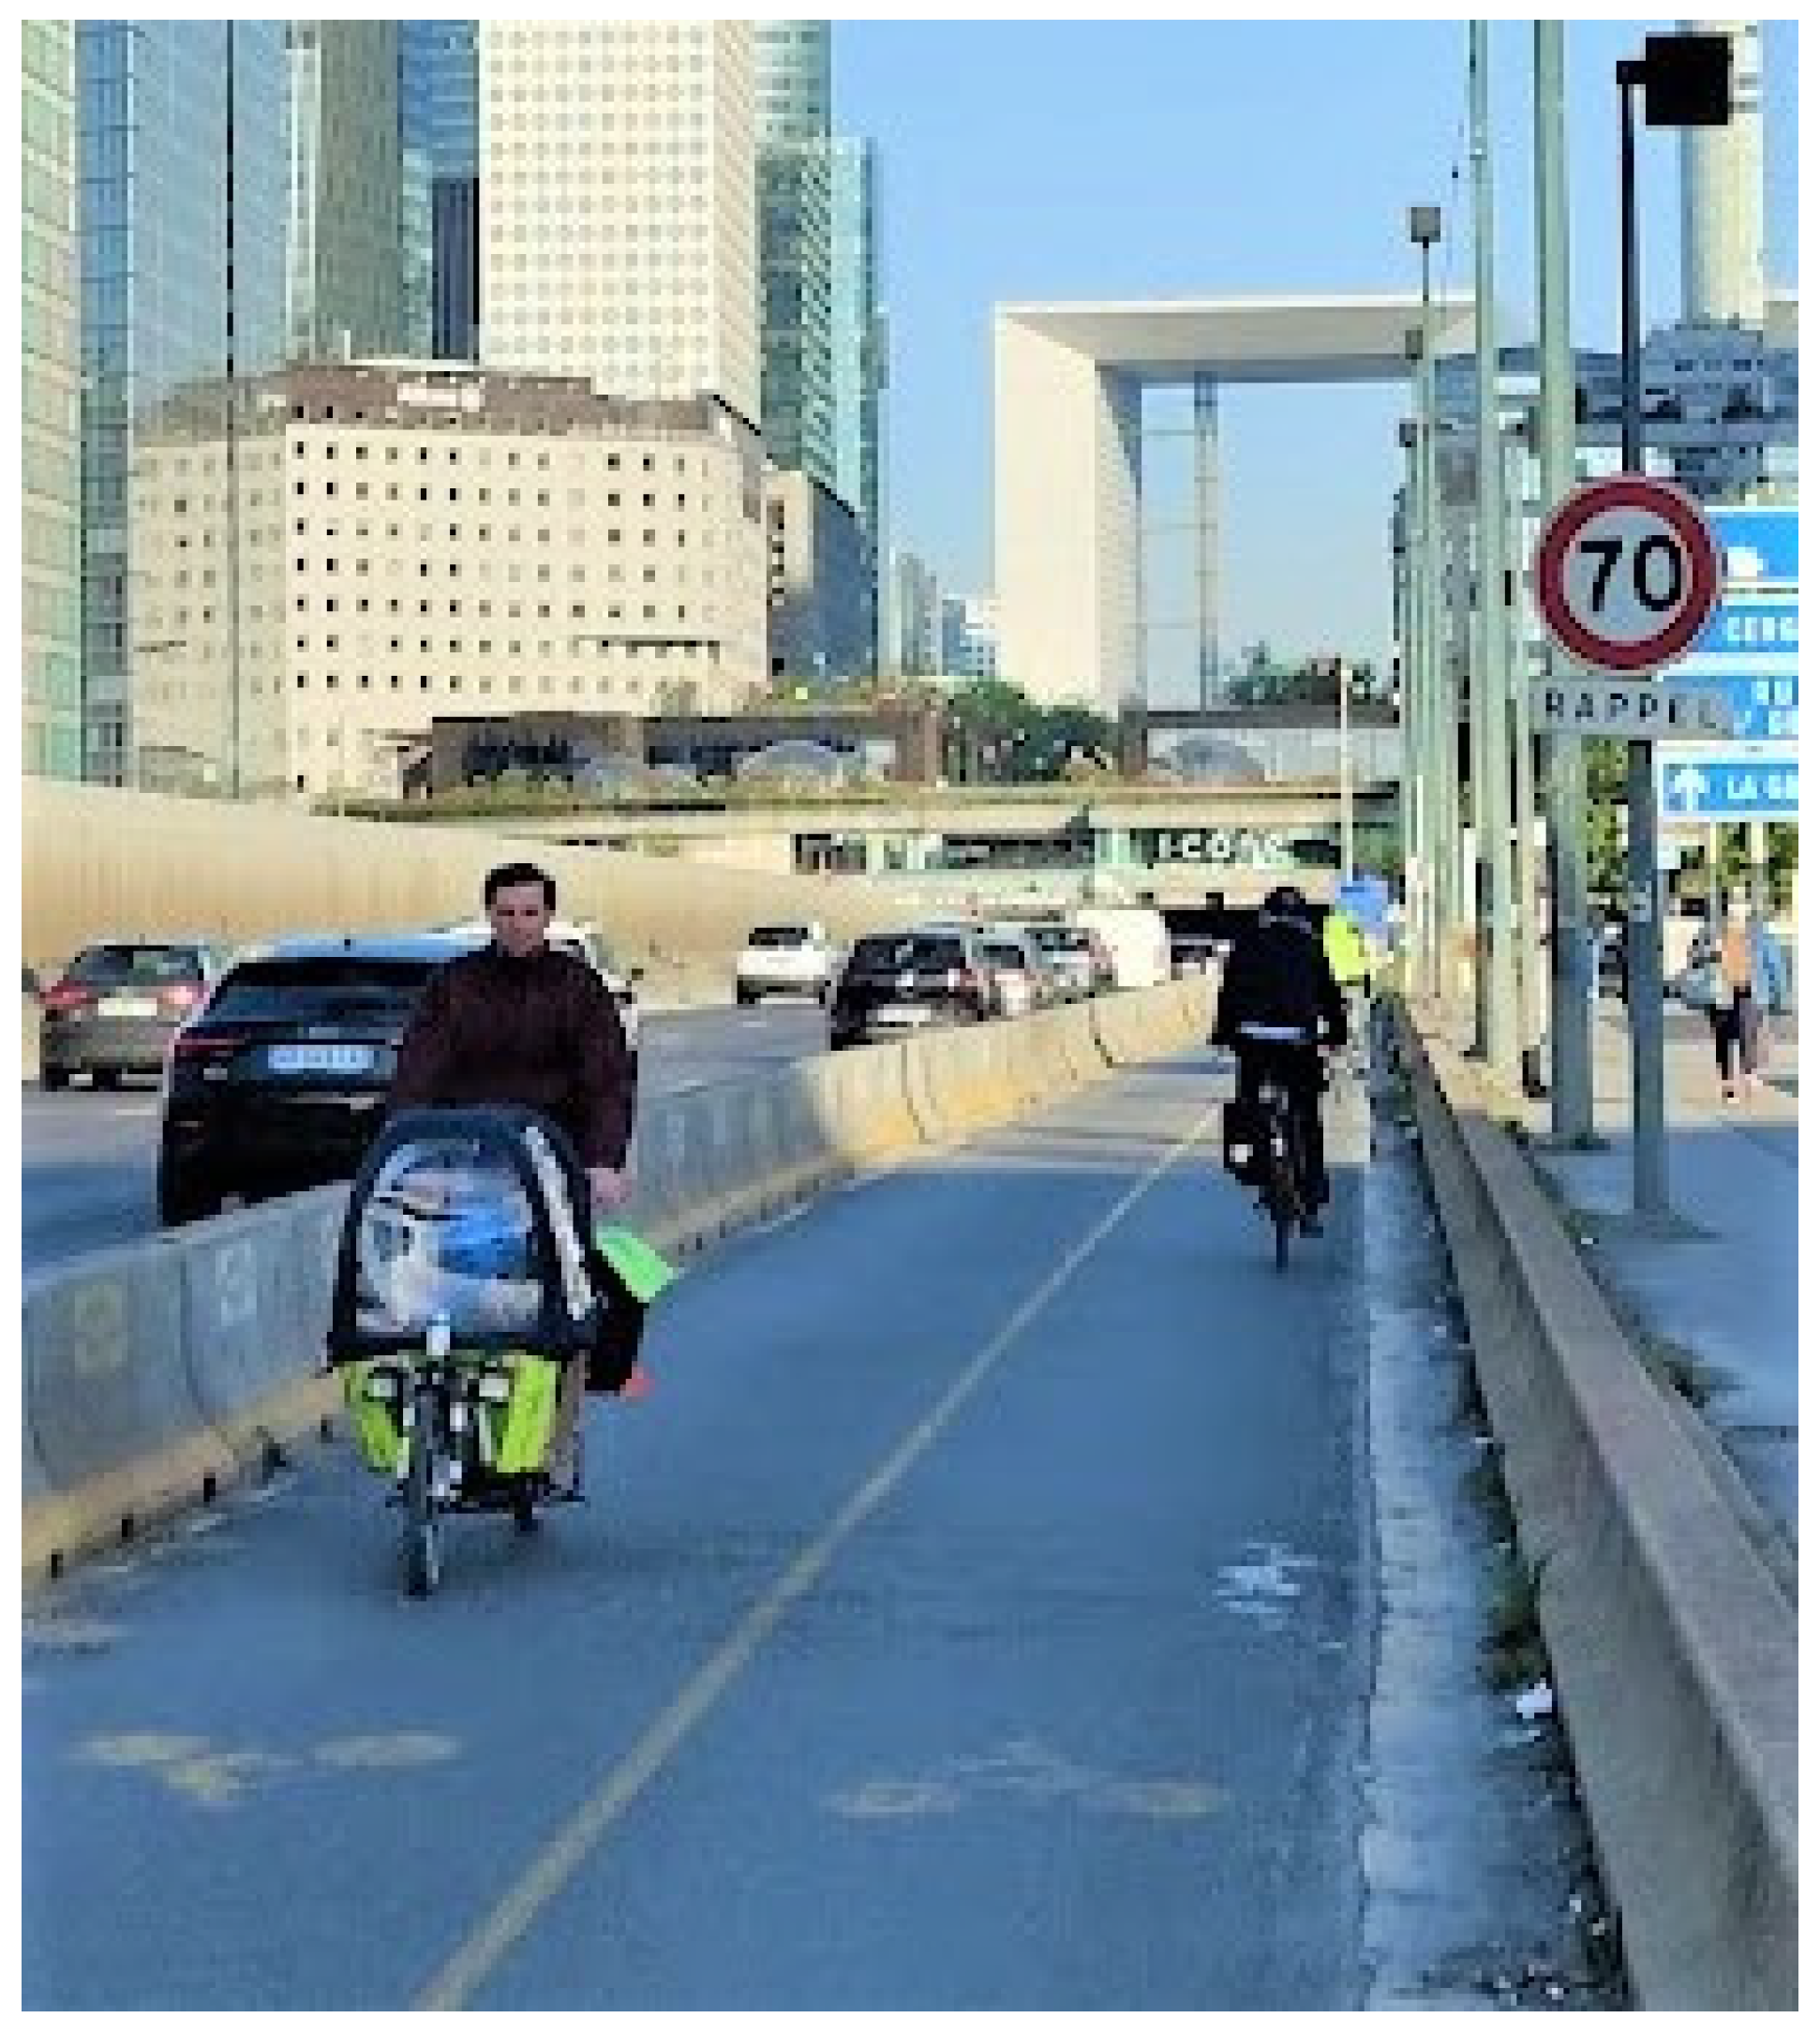
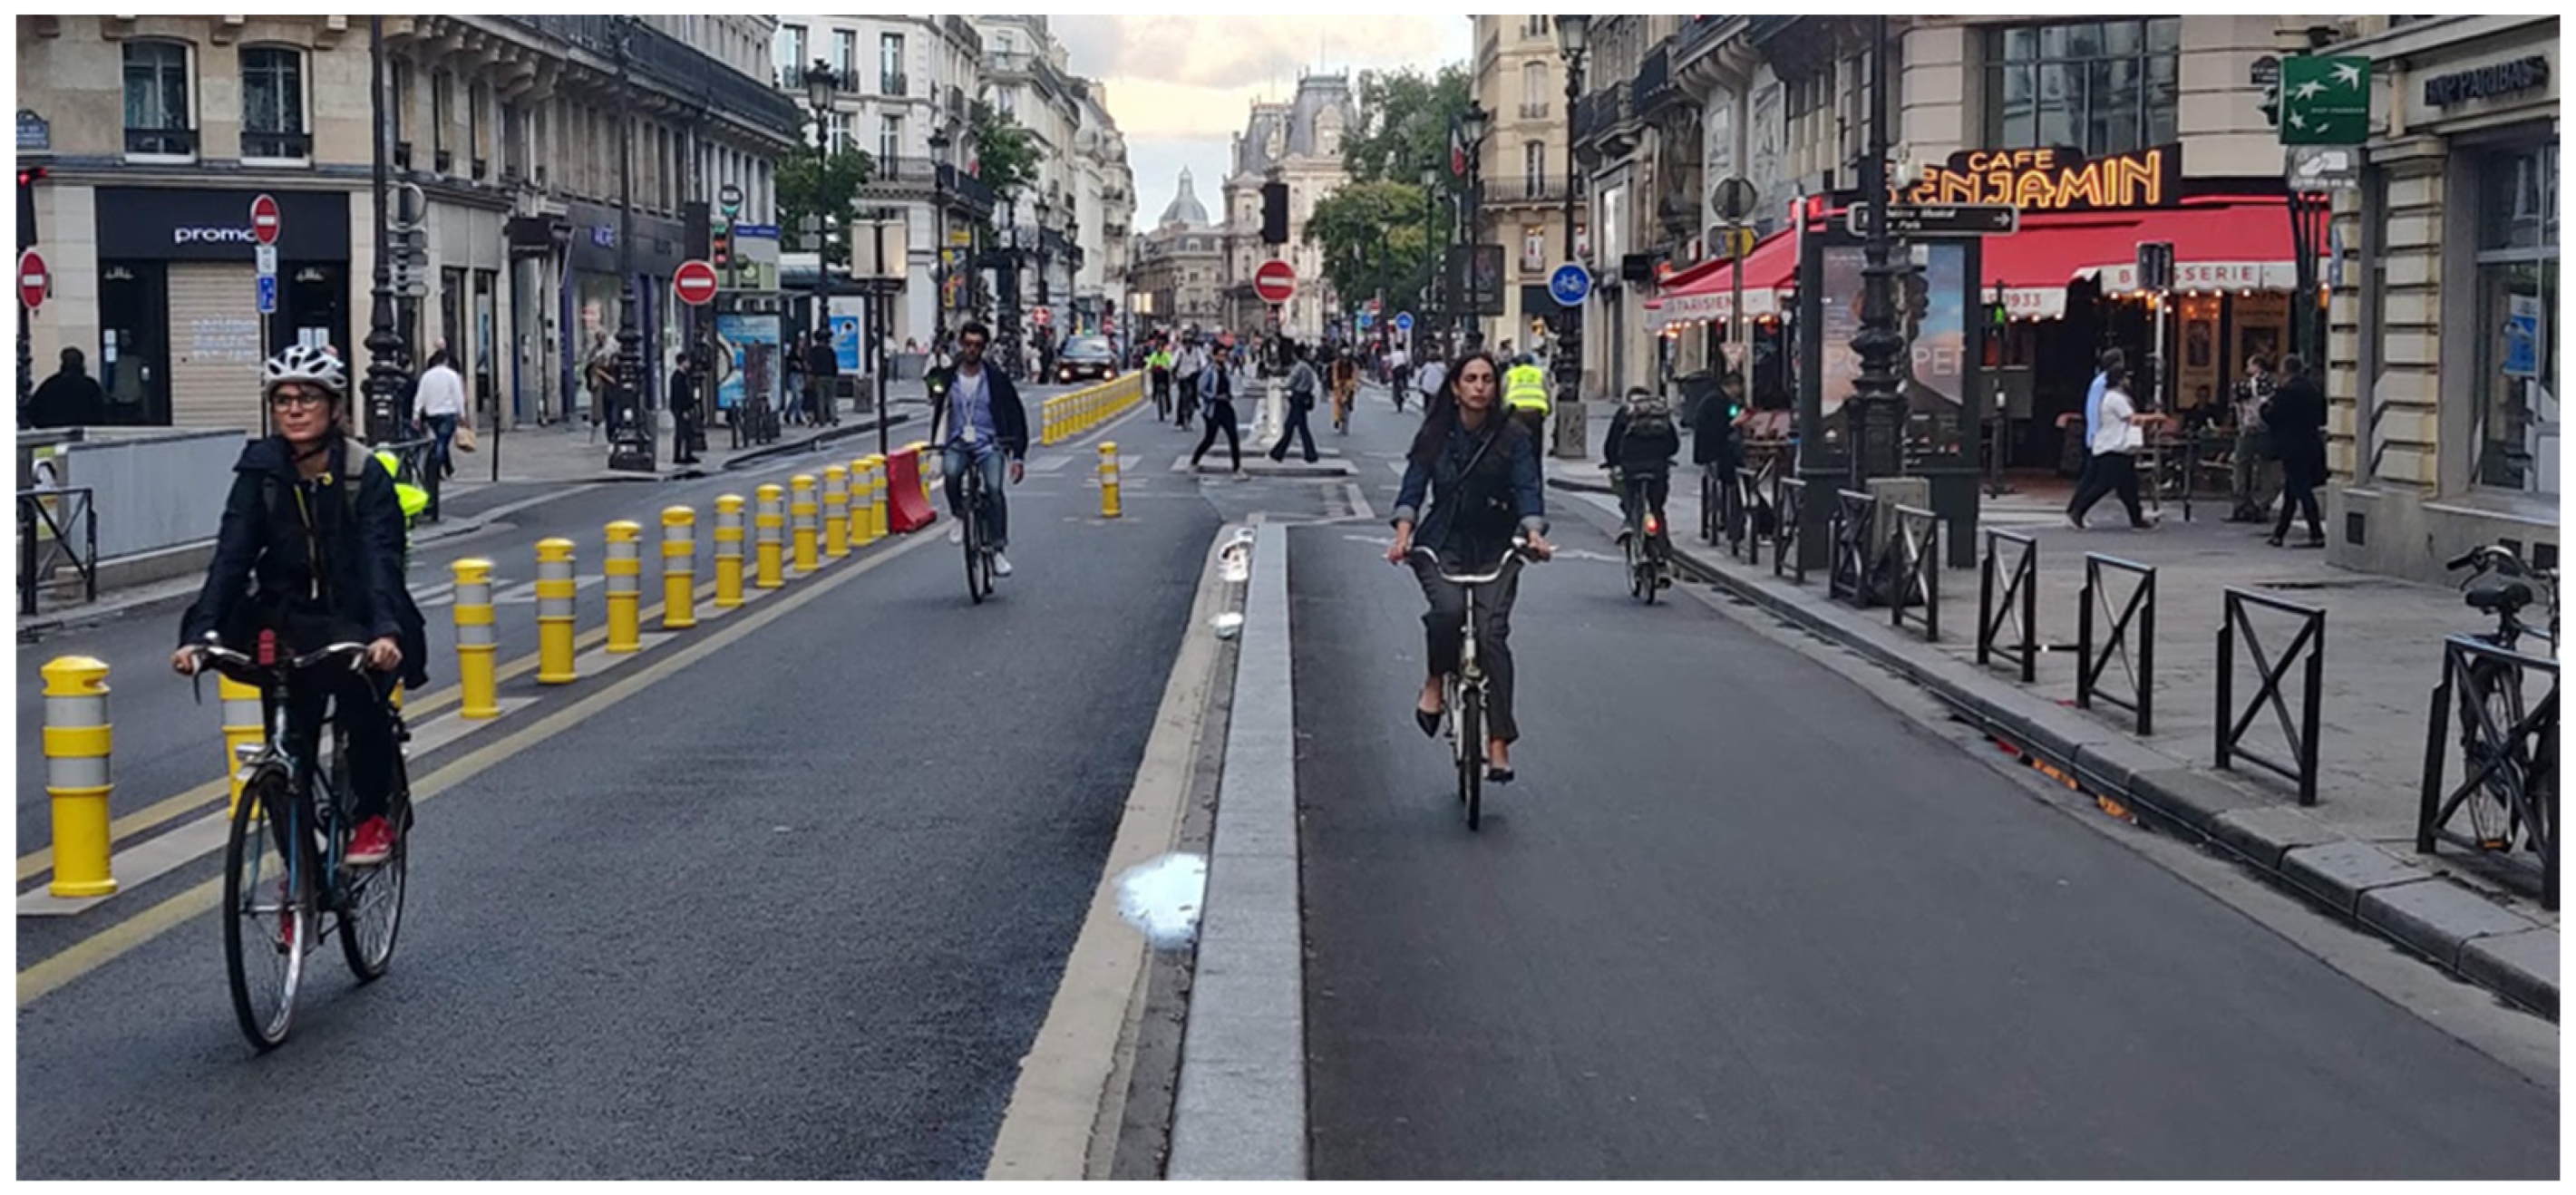
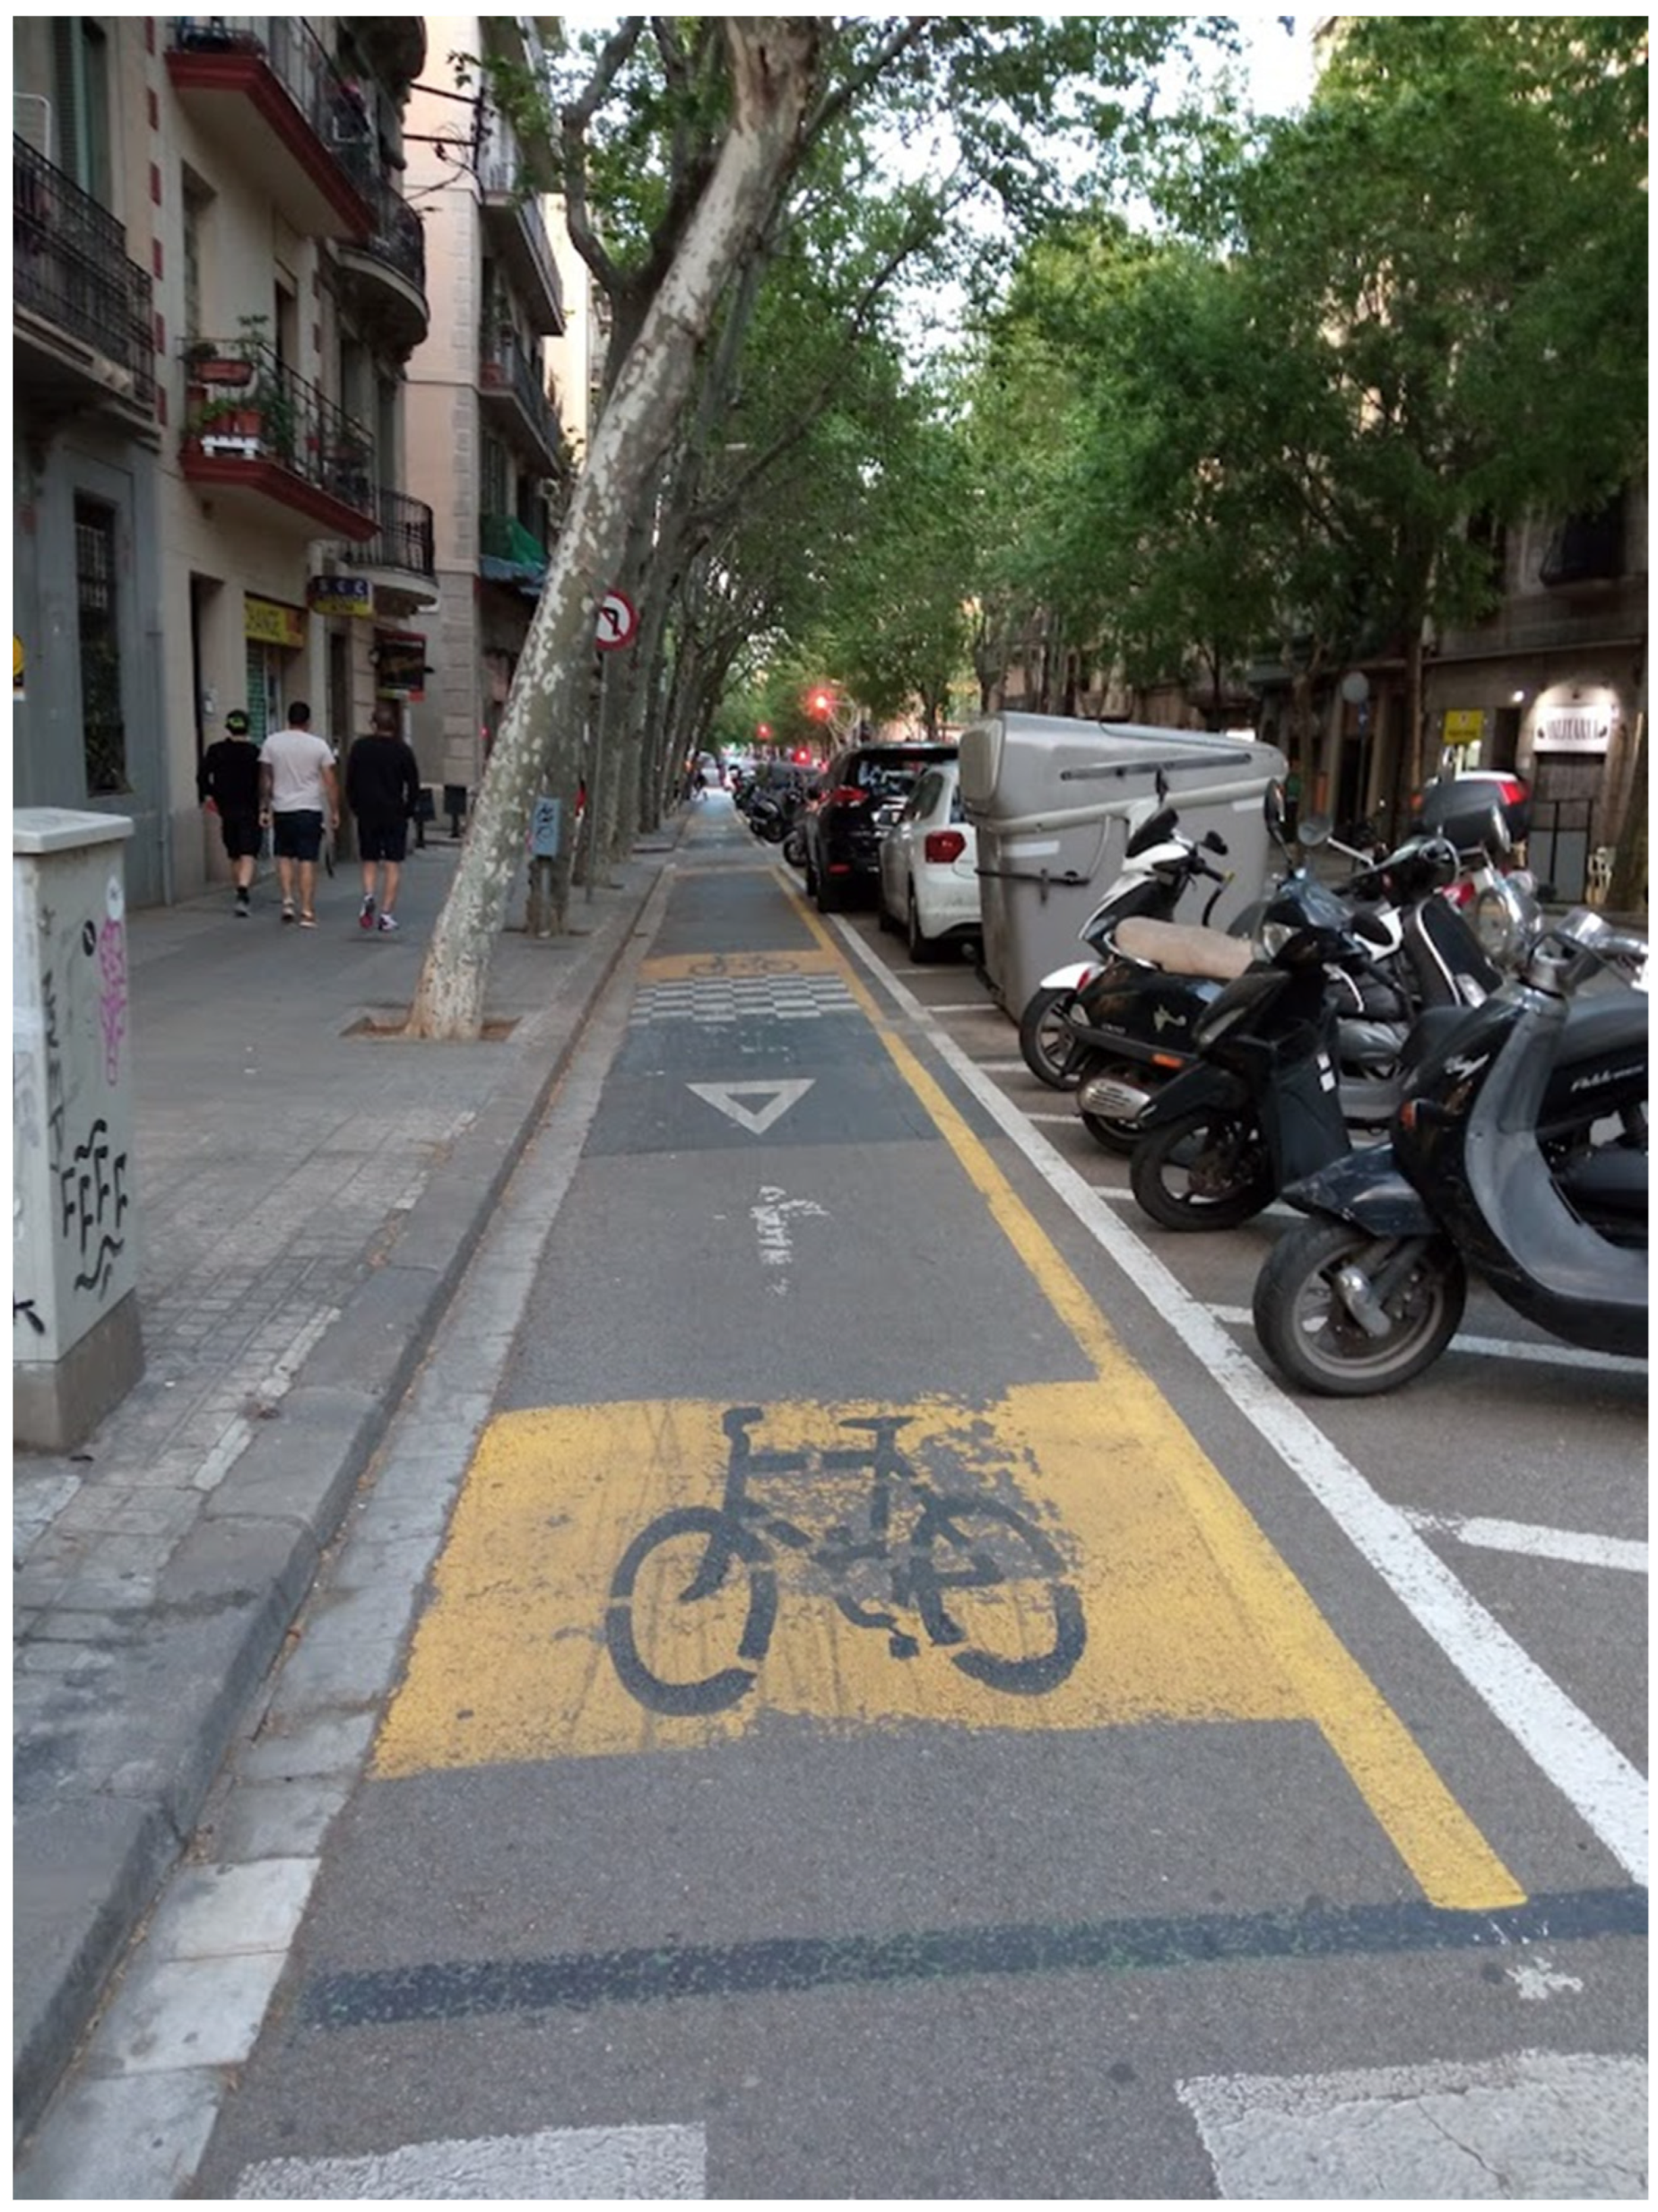
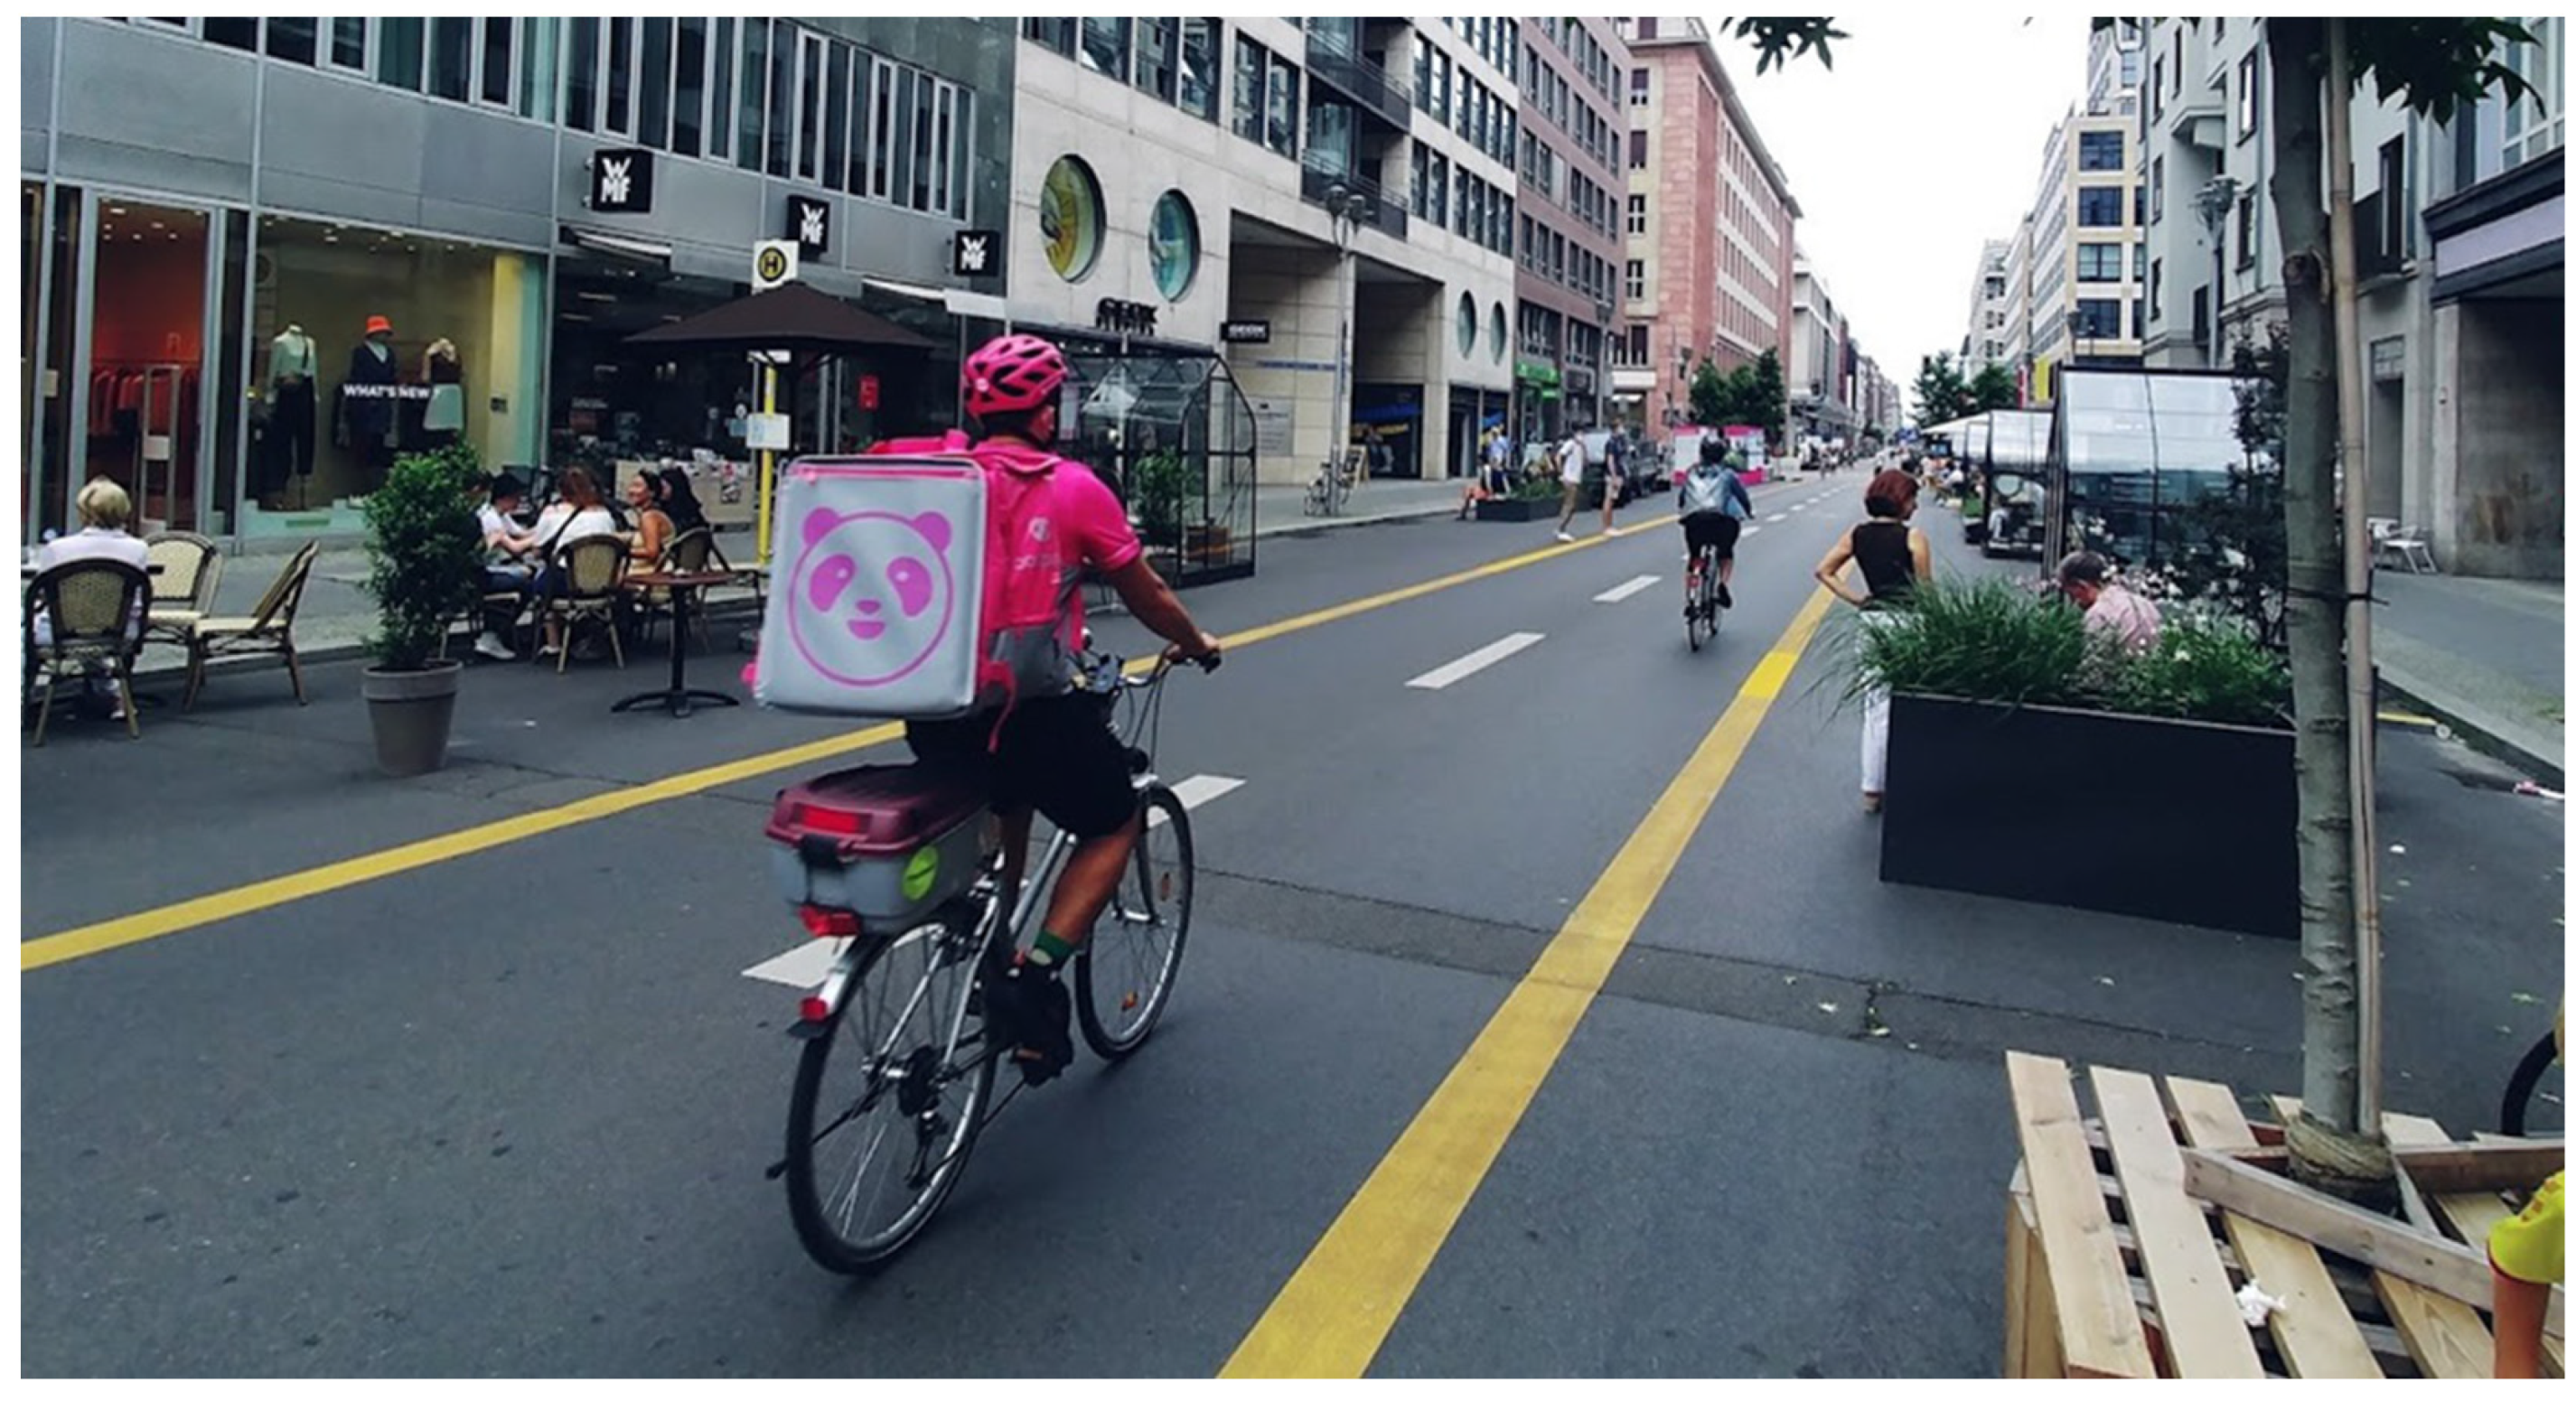
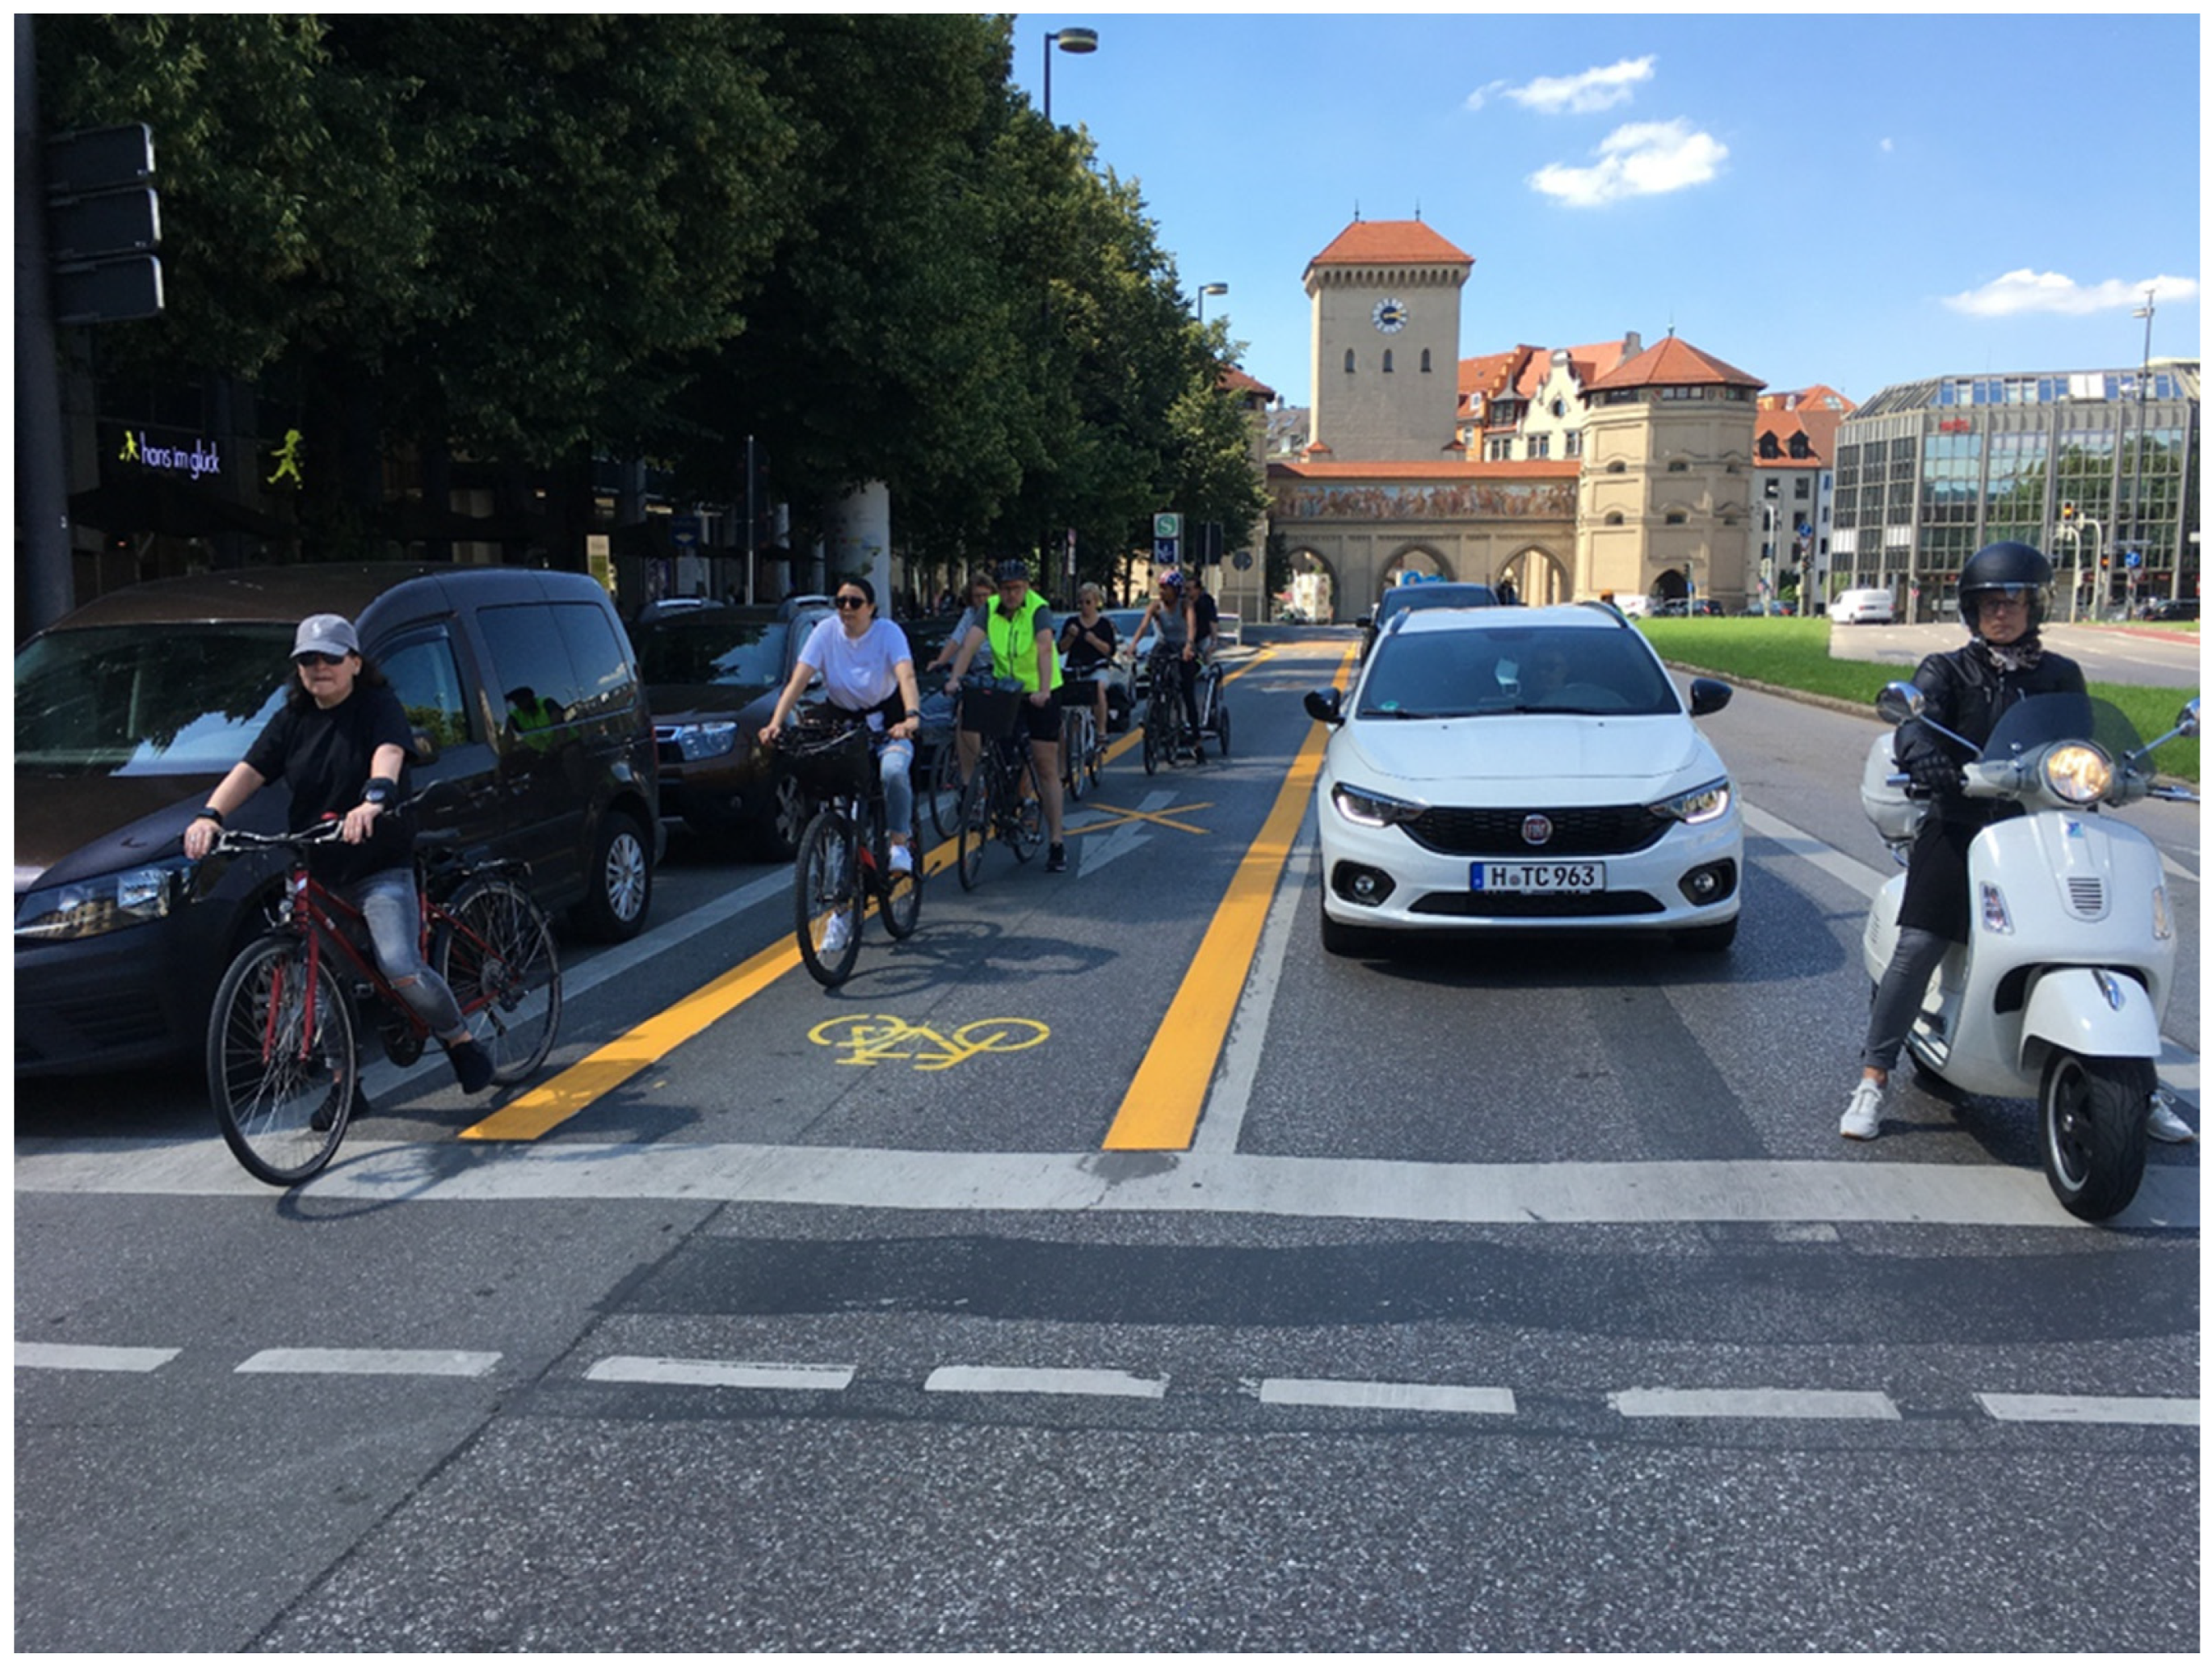