Brain, other CNS and intracranial tumours incidence statistics

Cases

New cases of brain tumour each year, 2016-2018 average, UK.

Proportion of all cases

Percentage brain tumour is of total cancer cases, 2016-2018, UK


Age

Peak rate of brain tumour cases, 2016-2018, UK


Trend over time

Change in brain tumour incidence rates since the early 1990s, UK


Brain, other CNS and intracranial tumours is the 9th most common cancer in the UK, accounting for 3% of all new cancer cases (2016-2018).[1-4]

In females in the UK, brain, other CNS and intracranial tumours is the 7th most common cancer (4% of all new female cancer cases). In males in the UK, it is the 11th most common cancer (3% of all new male cancer cases).

52% of brain, other CNS and intracranial tumours cases in the UK are in females, and 48% are in males.

Brain, other CNS and intracranial tumours incidence rates (European age-standardised (AS) rate Open a glossary item) for persons are significantly higher than the UK average in Northern Ireland and similar to the UK average in all other UK constituent countries.

For brain, other CNS and intracranial tumours, there are few established risk factors therefore differences between countries largely reflect differences in diagnosis and data recording.

Brain, Other CNS and Intracranial Tumours (C70-C72, C75.1-C75.3, D32-D33, D35.2-D35.4, D42-D43, D44.3-D44.5), Average Number of New Cases Per Year, Crude and European Age-Standardised (AS) Incidence Rates per 100,000 Population, UK, 2016-2018

  England Scotland Wales Northern Ireland UK
Female Cases 5,359 563 321 201 6,444
Crude Rate 19.0 20.2 20.3 21.1 19.3
AS Rate 19.4 19.7 19.5 22.2 19.5
AS Rate - 95% LCL 19.1 18.8 18.2 20.4 19.2
AS Rate - 95% UCL 19.7 20.7 20.7 24.0 19.7
Male Cases 4,868 478 303 194 5,843
Crude Rate 17.7 18.1 19.7 21.0 17.9
AS Rate 19.4 19.4 20.2 24.5 19.5
AS Rate - 95% LCL 19.0 18.4 18.9 22.5 19.2
AS Rate - 95% UCL 19.7 20.4 21.5 26.4 19.8
Persons Cases 10,227 1,042 625 394 12,288
Crude Rate 18.4 19.2 20.0 21.1 18.6
AS Rate 19.3 19.6 19.9 23.3 19.5
AS Rate - 95% LCL 19.1 18.9 19.0 21.9 19.3
AS Rate - 95% UCL 19.5 20.3 20.8 24.6 19.7

95% LCL and 95% UCL are the 95% lower and upper confidence limits around the AS Rate Open a glossary item
Percentages of all new cancer cases on this website use only malignant tumours in their denominator, though for ‘brain, other CNS (central nervous system) and intracranial tumours' the numerator includes tumours that are malignant and non-malignant.
 

References

  1. Data were provided by the National Cancer Registration and Analysis Service (part of Public Health England), on request through the Office for Data Release, July 2021. Similar data can be found here: https://www.ons.gov.uk/peoplepopulationandcommunity/healthandsocialcare/conditionsanddiseases/bulletins/cancerregistrationstatisticsengland/previousReleases
  2. Data were provided by ISD Scotland on request, April 2020. Similar data can be found here: http://www.isdscotland.org/Health-Topics/Cancer/Publications.
  3. Data were published by the Welsh Cancer Intelligence and Surveillance Unit, Health Intelligence Division, Public Health Wales https://phw.nhs.wales/services-and-teams/welsh-cancer-intelligence-and-surveillance-unit-wcisu/cancer-incidence-in-wales-2002-2018/, March 2021.
  4. Data were provided by the Northern Ireland Cancer Registry on request, May 2020. Similar data can be found here: http://www.qub.ac.uk/research-centres/nicr/.

About this data

Data is for UK, 2016-2018, ICD-10 C70-C72, C75.1-C75.3, D32-D33, D35.2-D35.4, D42-D43, D44.3-D44.5.

Data was not available for Wales in 2018 for ICD-10 D32-D33, D35.2-D35.4, D42-D43, D44.3-D44.5, therefore the 2018 data was extrapolated using the 2017 figures.

Last reviewed:

Brain, other CNS and intracranial tumours incidence is related to age, with the highest incidence rates being in older people. In the UK in 2016-2018, on average each year almost a quarter of new cases (23%) were in people aged 75 and over.[1-4] In contrast to most cancer types, brain, other CNS and intracranial tumours also occur relatively frequently at younger ages.

Age-specific incidence rates remain relatively stable from infancy to around age 25-29, before increasing steadily. The highest rates are in in the 85 to 89 age group for females and males.

Incidence rates are significantly higher in females than males in some, younger, age groups and higher in males than females in some, older age groups. The gap is widest at age 35 to 39, when the age-specific incidence rate is 1.2 times higher in females than males.

Brain, other CNS and intracranial tumours (C70-C72, C75.1-C75.3, D32-D33, D35.2-D35.4, D42-D43, D44.3-D44.5), Average Number of New Cases per Year and Age-Specific Incidence Rates per 100,000 Population, UK, 2016-2018

For brain, CNS and intracranial tumours, like most cancer types, incidence increases with age. This largely reflects cell DNA damage accumulating over time. Damage can result from biological processes or from exposure to risk factors. A drop or plateau in incidence in the oldest age groups often indicates reduced diagnostic activity perhaps due to general ill health.

References

  1. Data were provided by the National Cancer Registration and Analysis Service (part of Public Health England), on request through the Office for Data Release, July 2021. Similar data can be found here: https://www.ons.gov.uk/peoplepopulationandcommunity/healthandsocialcare/conditionsanddiseases/bulletins/cancerregistrationstatisticsengland/previousReleases
  2. Data were provided by ISD Scotland on request, April 2020. Similar data can be found here: http://www.isdscotland.org/Health-Topics/Cancer/Publications.
  3. Data were published by the Welsh Cancer Intelligence and Surveillance Unit, Health Intelligence Division, Public Health Wales https://phw.nhs.wales/services-and-teams/welsh-cancer-intelligence-and-surveillance-unit-wcisu/cancer-incidence-in-wales-2002-2018/, March 2021.
  4. Data were provided by the Northern Ireland Cancer Registry on request, May 2020. Similar data can be found here: http://www.qub.ac.uk/research-centres/nicr/.

About this data

Data is for UK, 2016-2018, ICD-10 C70-C72, C75.1-C75.3, D32-D33, D35.2-D35.4, D42-D43, D44.3-D44.5.

Data was not available for Wales in 2018 for ICD-10 D32-D33, D35.2-D35.4, D42-D43, D44.3-D44.5, therefore the 2018 data was extrapolated using the 2017 figures.

Last reviewed:

Brain, other CNS and intracranial tumours European age-standardised (AS) Open a glossary item incidence rates for females and males combined increased by 39% in the UK between 1993-1995 and 2016-2018.[1-4] The increase was larger in females than in males.

For females, brain, other CNS and intracranial tumours AS incidence rates in the UK increased by 51% between 1993-1995 and 2016-2018. For males, brain, other CNS and intracranial tumours AS incidence rates in the UK increased by 27% between 1993-1995 and 2016-2018.

Over the last decade in the UK (between 2006-2008 and 2016-2018), brain, other CNS and intracranial tumours AS incidence rates for females and males combined increased by 11%. In females AS incidence rates increased by 16%, and in males rates increased by 6%.

Brain, Other CNS and Intracranial Tumours (C70-C72, C75.1-C75.3, D32-D33, D35.2-D35.4, D42-D43, D44.3-D44.5), European Age-Standardised Incidence Rates, UK, 1993 to 2018

Brain, other CNS and intracranial tumours incidence rates have increased overall in all broad age groups in females and males combined in the UK since the early 1990s.[1-4] Rates in 0-24s have increased by 22%, in 25-49s have increased by 37%, in 50-59s have increased by 24%, in 60-69s have increased by 26%, in 70-79s have increased by 44% and in 80+s have increased by 112%.

Brain, Other CNS and Intracranial Tumours (C70-C72, C75.1-C75.3, D32-D33, D35.2-D35.4, D42-D43, D44.3-D44.5), European Age-Standardised Incidence Rates per 100,000 Persons Population, By Age, UK, 1993-2018

Data on malignant tumours have been collected by UK cancer registries for many decades, but data on non-malignant brain tumours were not consistently collected until the early 2000s. This means trends starting before the early 2000s are not reliable for non-malignant brain tumours.

References

  1. Data were provided by the National Cancer Registration and Analysis Service (part of Public Health England), on request through the Office for Data Release, July 2021. Similar data can be found here: https://www.ons.gov.uk/peoplepopulationandcommunity/healthandsocialcare/conditionsanddiseases/bulletins/cancerregistrationstatisticsengland/previousReleases
  2. Data were provided by ISD Scotland on request, April 2020. Similar data can be found here: http://www.isdscotland.org/Health-Topics/Cancer/Publications.
  3. Data were published by the Welsh Cancer Intelligence and Surveillance Unit, Health Intelligence Division, Public Health Wales https://phw.nhs.wales/services-and-teams/welsh-cancer-intelligence-and-surveillance-unit-wcisu/cancer-incidence-in-wales-2002-2018/, March 2021.
  4. Data were provided by the Northern Ireland Cancer Registry on request, May 2020. Similar data can be found here: http://www.qub.ac.uk/research-centres/nicr/.

About this data

Data is for UK, 1993-2018, ICD-10 C70-C72, C75.1-C75.3, D32-D33, D35.2-D35.4, D42-D43, D44.3-D44.5.

Data was not available for Wales in 2018 for ICD-10 D32-D33, D35.2-D35.4, D42-D43, D44.3-D44.5, therefore the 2018 data was extrapolated using the 2017 figures.

Last reviewed:

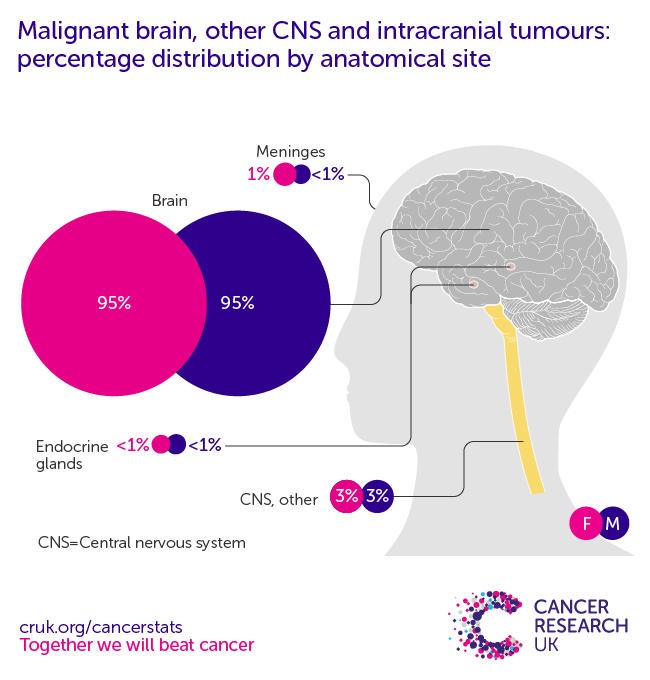
The most common specific location for malignant brain, other CNS and intracranial tumours in the UK is the brain (2016-2018).[1-4] Variation of incidence by anatomical site may reflect the physical size of each site, and differences in risk factor exposure by site, among other factors.

Download this data

Cases and percentages may not sum due to rounding

The most common specific location for benign brain, other CNS and intracranial tumours in the UK is the meninges (2016-2018).[1-4] Variation of incidence by anatomical site may reflect the physical size of each site, and differences in risk factor exposure by site, among other factors.

Download this data

Cases and percentages may not sum due to rounding

References

  1. Data were provided by the National Cancer Registration and Analysis Service (part of Public Health England), on request through the Office for Data Release, July 2021. Similar data can be found here: https://www.ons.gov.uk
  2. Data were provided by ISD Scotland on request, April 2020. Similar data can be found here: http://www.isdscotland.org/Health-Topics/Cancer/Publications.
  3. Data were published by the Welsh Cancer Intelligence and Surveillance Unit, Health Intelligence Division, Public Health Wales, March 2021. https://phw.nhs.wales/services-and-teams/welsh-cancer-intelligence-and-surveillance-unit-wcisu/cancer-incidence-in-wales-2002-2018/.
  4. Data were provided by the Northern Ireland Cancer Registry on request, June 2020. Similar data can be found here: http://www.qub.ac.uk/research-centres/nicr/

About this data

Data is for UK, 2016-2018, ICD-10 C70-C72, C75.1-C75.3, D32-D33, D35.2-D35.4, D42-D43, D44.3-D44.5. For some cases the specific location of the cancer is not recorded, this may be due to clinical or data recording factors.

Last reviewed:

The number of new brain, other CNS and intracranial tumours cases on average each year in the UK is projected to rise from around 12,600 cases in 2023-2025 to around 13,600 cases in 2038-2040.[1]

Brain, other CNS and intracranial tumours incidence rates are projected to fall by 3% in the UK between 2023-2025 and 2038-2040, to 18 cases per 100,000 people on average each year by 2038-2040.[1] This includes a similar decrease for males and females.

For females, brain, other cns and intracranial tumours European age-standardised (AS) Open a glossary item incidence rates in the UK are projected to fall by 3% between 2023-2025 and 2038-2040, to 18 cases per 100,000 per year by 2038-2040.[1] For males, AS rates are projected to fall by 4% between 2023-2025 and 2038-2040, to 18 cases per 100,000 per year by 2038-2040.[1]

Brain, other CNS and intracranial tumours (C70-C72, C75.1-C75.3, D32-D33, D35.2-D35.4, D42-D43, D44.3-D44.5), Observed and Projected Age-Standardised Incidence Rates, by Sex, UK, 1993-2040

Download the data table (xlsx)

References

Calculated by the Cancer Intelligence Team at Cancer Research UK, February 2023. Age-period-cohort modelling approach described here, using 2020-based population projections (Office for National Statistics) and observed cancer incidence (1975-2018 for England, Scotland and Wales, 1993-2018 for Northern Ireland).

About this data

Projections are based on incidence data from 1975-2018 (England, Scotland and Wales) and 1993-2018 (Northern Ireland) (D codes projections based on data from 2005-2018); the above figure presents all UK data from 1993-2018 (observed) and 2019-2040 (projected). Number of new cases and age-standardised rates are presented as annual averages for each 3-year rolling period. ICD-10 codes C70-C72, C75.1-C75.3, D32-D33, D35.2-D35.4, D42-D43, D44.3-D44.5.

Projections are based on observed incidence rates and therefore implicitly include changes in cancer risk factors and diagnosis. Confidence intervals are not calculated for the projected figures. Projections are by their nature uncertain because unexpected events in future could change the trend. It is not sensible to calculate a boundary of uncertainty around these already uncertain point estimates. Changes are described as 'increase' or 'decrease' if there is any difference between the point estimates.

More on projections methodology

Last reviewed:

Brain, other CNS and intracranial tumours incidence rates (European age-standardised (AS) rates Open a glossary item) in England in females are similar in the most deprived quintile compared with the least, and in males are 8% lower in the most deprived quintile compared with the least (2013-2017).[1]

It is estimated that there are around 190 fewer cases of brain, other CNS and intracranial tumours each year in males in England than there would be if every deprivation quintile had the same age-specific crude incidence rates as the least deprived quintile.

Brain, Other CNS and Intracranial Tumours (C70-C72, C75.1-C75.3, D32-D33, D35.2-D35.4, D42-D43, D44.3-D44.5), Estimated Average Number of Fewer Cases per Year, by Deprivation Quintile, England, 2013-2017

Brain, Other CNS and Intracranial Tumours (C70-C72, C75.1-C75.3, D32-D33, D35.2-D35.4, D42-D43, D44.3-D44.5), European Age-Standardised Incidence Rates per 100,000 Population, by Deprivation Quintile, England, 2013-2017

No data are shown for females as the difference in age-standardised incidence rates between most and least deprived quintiles is not significant for females.

References

  1. Calculated by the Cancer Intelligence Team at Cancer Research UK, April 2020. Based on method reported in National Cancer Intelligence Network Cancer by Deprivation in England Incidence, 1996-2010 Mortality, 1997-2011 . Using cancer incidence data 2013-2017 (Public Health England) and population data 2013-2017 (Office for National Statistics) by Indices of Multiple Deprivation 2015 income domain quintile, cancer type, sex, and five-year age band.

About this data

Data is for England, 2013-2017, ICD-10 C21.

Last reviewed:

In the UK more than 9,700 people were still alive at the end of 2006, up to ten years after being diagnosed with a tumour in the brain, or other parts of the CNS (C70-C72).[1]

Brain and other parts of CNS (C70-C72), One-, Five- and Ten- Year Cancer Prevalence, UK, 31st December 2006

1 Year Prevalence 5 Year Prevalence 10 Year Prevalence
Male 1,448 3,633 5,456
Female 986 2,650 4,252
Persons 2,434 6,283 9,708

Worldwide, it is estimated that there were around 317,000 patients with these tumours were still alive in 2008, up to five years after their diagnosis of brain or other CNS tumour (C70-C72).[2]

References

  1. National Cancer Intelligence Network (NCIN). One, Five and Ten Year Cancer Prevalence by Cancer Network, UK, 2006. London: NCIN; 2010.
  2. Ferlay J, Shin HR, Bray F, et al. DM GLOBOCAN 2008 v1.2, Cancer incidence and mortality worldwide: IARC CancerBase No. 10 [Internet]. Lyon, France: International Agency for Research on Cancer; 2010. Available from http://globocan.iarc.fr. Accessed May 2011.

About this data

Data is for: All UK patients who had been diagnosed with brain cancer between 1997 and 2006, ICD-10 C70-72

Last reviewed:

There are presently no reliable data on the incidence of secondary brain, other CNS and intracranial cancers – tumours which have metastasised (spread) to these sites from elsewhere in the body. In some patients, brain, other CNS and intracranial metastases may not manifest clinically in the patient’s lifetime, or a formal diagnosis may not be obtained if the patient is extremely unwell with their primary cancer. Therefore current estimates of the number of secondary tumours are thought to be conservative.[1] However, data collection is improving, and in coming years it should be possible to report national data for the number of cancers in the brain, other CNS and intracranial region which started elsewhere in the body.[2]

The best current estimate is that secondary brain cancers occur in at least 6% of all cancer patients, with marked variation by primary cancer site.[1] The proportion ranges from less than 1% of patients with thyroid, liver, stomach, prostate, uterine or ovarian cancers, to 20% of those with lung cancer.[1,3] Based on this estimate, metastatic brain tumours are thought to outnumber primary malignant brain tumours by at least three to one.[1]

References

  1. Davis FG, Dolecek TA, McCarthy BJ, et al. Toward determining the lifetime occurrence of metastatic brain tumors estimated from 2007 United States cancer incidence data. Neuro-Oncology 2012;14(9):1171-77.
  2. Eastern Cancer Registry and Information Centre (ECRIC), National Brain Tumour Registry.  Personal communication, February 2013.
  3. Barnholtz-Sloan JS, Sloan AE, et al. Incidence proportions of brain metastases in patients diagnosed (1973 to 2001) in the Metropolitan Detroit Cancer Surveillance System. J Clin Oncol 2004;22(14):2865-72.

About this data

Data is for: USA, 2007

Last reviewed:

Cancer stats explained

See information and explanations on terminology used for statistics and reporting of cancer, and the methods used to calculate some of our statistics.

Citation

You are welcome to reuse this Cancer Research UK content for your own work.
Credit us as authors by referencing Cancer Research UK as the primary source. Suggested styles are:

Web content: Cancer Research UK, full URL of the page, Accessed [month] [year].
Publications: Cancer Research UK ([year of publication]), Name of publication, Cancer Research UK.
Graphics (when reused unaltered): Credit: Cancer Research UK.
Graphics (when recreated with differences): Based on a graphic created by Cancer Research UK.

When Cancer Research UK material is used for commercial reasons, we encourage a donation to our life-saving research.
Send a cheque payable to Cancer Research UK to: Cancer Research UK, 2 Redman Place, London, E20 1JQ or

Donate online

Acknowledgements

We are grateful to the many organisations across the UK which collect, analyse, and share the data which we use, and to the patients and public who consent for their data to be used. Find out more about the sources which are essential for our statistics.