


In this week’s blog we explore the latest weekly deaths data for the UK, covering deaths registered in the second week of 2021. Total deaths registered were similar to the previous week, with an increase in deaths mentioning COVID-19 and a corresponding fall in deaths which did not mention COVID-19.

This time of year typically sees higher numbers of registered deaths, with the average level higher than for any other week, so the level of ‘excess’ deaths above average has actually fallen.
Headlines were made this week when the UK sadly passed a tragic landmark of over 100,000 COVID-19 deaths (defined as deaths within 28 days of a positive test). The definition used by the ONS, and for most figures in this blog, instead defines COVID-19 deaths as those which mention COVID-19 on the death certificate. Under this measure the 100,000 was passed a few weeks ago – the figures included here cover the week ending 15th January, by which point COVID-19 deaths were at almost 104,000 in the UK.
Daily case numbers have continued to fall steadily over recent days, and encouragingly daily hospital admissions are also now falling (although concerns remain about hospital capacity in some parts of the UK). As the vaccination programme continues to accelerate, and tightened nationwide restrictions remain in place, there will hopefully be more positive news to come.
COVID-19 in the UK: Current position
COVID-19 case numbers continue to grab the headlines. While many cases show only relatively mild symptoms, and some are entirely asymptomatic, there will unfortunately be a proportion who will require hospital treatment and potentially intensive care. Sadly, while medical treatments continue to improve, a number of those admitted to hospital will tragically die. The progression from first infection, to developing serious symptoms requiring hospitalisation, to death occurring typically takes a number of weeks.
It is therefore very useful to look at the numbers of COVID-19 cases as an indicator of imminent hospitalisation requirements, and to look at hospitalisation figures themselves as an indicator of future rises in COVID-19 linked deaths.
The chart below compares these three figures for the UK as a whole (averaged over the 7 days to the date shown to smooth out variations, such as weekends and bank holidays). We have focussed on the figures for the past few months, given the very low levels of COVID-19 seen over the summer months.
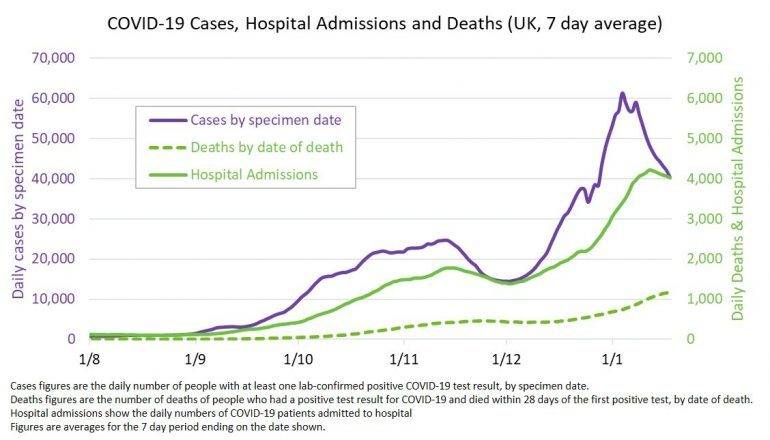
We can see how COVID-19 cases in the UK (purple line, left hand axis) increased steadily from early September, fell somewhat in late November, following a tightening of restrictions, before increasing rapidly since the start of December, potentially due to the new more transmissible variant and a (slight) loosening of restrictions for the festive period. New, more stringent, nationwide restrictions were brought in after Christmas, and it is encouraging to see that case numbers have continued to fall, although they are still at a high level.
There will not always be a direct correlation between cases and hospitalisations (solid green line, right hand axis), for example due to changing rates of infection across different age groups, who are likely to have differing levels of hospitalisation. However, hospitalisations (green line, right hand axis) have broadly followed case numbers (with some anticipated time lag) in the chart. While numbers also remain high, and there are reported pressure points in particular parts of the country, at the national level numbers have started to fall slightly.
COVID-19 deaths (dashed green line, right hand axis) are also following similar patterns, although the rate of increase since early December is less dramatic and closer to that seen over November. Note that, unlike in the rest of this blog, these death figures are based on date of death rather than date of registration, and count deaths within 28 days of a positive COVID-19 test. We are also seeing signs that deaths may also be levelling off somewhat, which is welcome news.
Weekly deaths remain above average seasonal levels
The latest statistics from the ONS include detailed breakdowns of deaths registered in England & Wales up to 15th January 2021. Combining this information with similar data from the corresponding statistical bodies in Scotland and Northern Ireland, we can examine emerging patterns in the data.
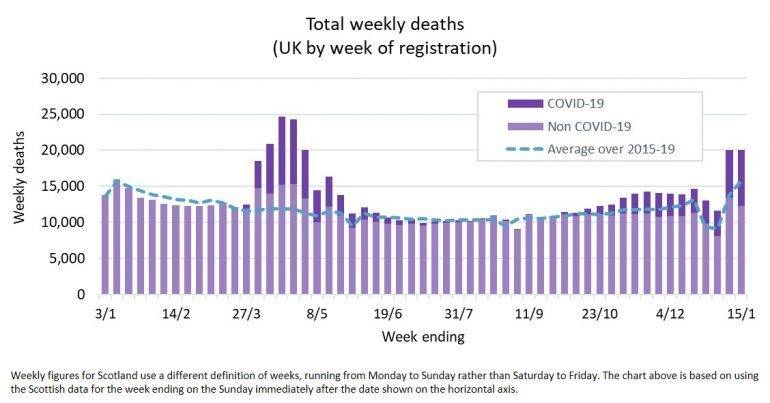
The final two weeks of 2020 saw unusually low registered deaths over the festive period, with some expected ‘catch-up’ in deaths in the first week of the new year. The second week of the year usually sees the highest deaths of any week – as seen in the dashed line which shows the average over the corresponding week in 2015 to 2019. However, the total weekly deaths seen in the latest week this year are actually close to those seen in the previous week, so we have not seen the expected increase.
Deaths directly attributable to COVID-19 have increased sharply
We focus on deaths where there is any mention of COVID-19 on the death certificate in the chart below.
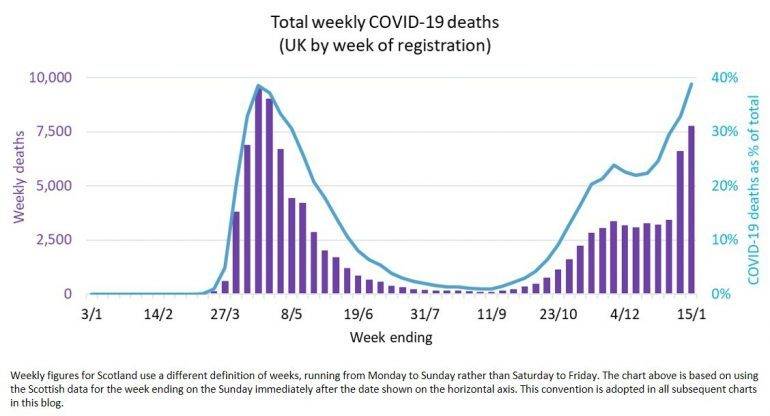
The number of registered deaths which mention COVID-19 on the death certificate has again increased, albeit not as significantly. Deaths mentioning COVID-19 accounted for almost 40% of all deaths registered over the week.
Deaths excluding those linked to COVID-19 are below average levels (again comparing to 2015-2019) as can be seen from the chart below.
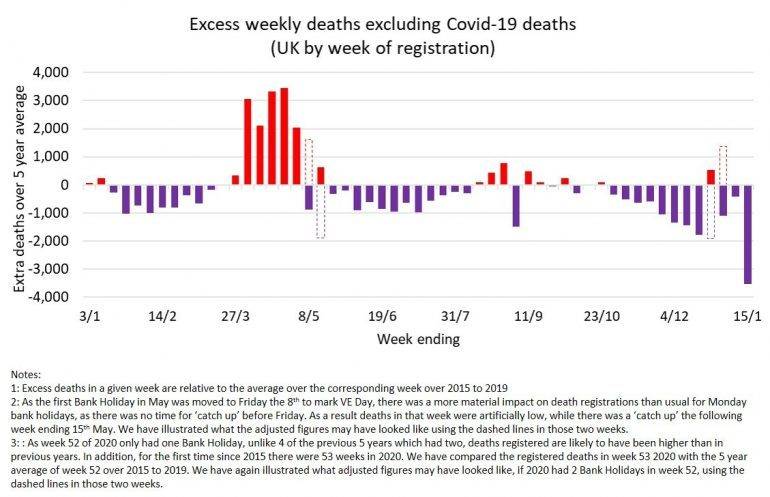
The bars shaded in red indicate weeks where total deaths were above average seasonal levels. This effect was particularly evident at the same time as the COVID-19 pandemic first hit the UK over April and May and was explored as ‘missed’ COVID-19 linked deaths in our earlier blog.
While the weeks around the turn of the year were impacted by variations in the timing of festive bank holidays, the latest week saw a signifcant drop in these non COVID-19 deaths, offsetting the rise seen in COVID-19 deaths. This fall continues the trend seen over the last quarter of 2020 of steadily falling non COVID-19 deaths.
As noted above, while cases and hospitalisations are now falling, they both remain high. We are likely to see further tragic COVID-19 deaths in the weeks ahead, and concerns remain that the impact of disruption to healthcare services during the pandemic may have consequences in the short to medium term. Offsetting that, the hope is that the continued rollout of vaccinations will help stem both the case levels and ultimately deaths.
We will be keeping a close eye on the emerging statistics in the weeks and months ahead.
“All of the team at Club Vita wish to extend our condolences to anyone who has personally been touched by bereavement in recent months. We know that these deaths leave behind people who are missing loved ones. Our thoughts are with you…”