Small hydropower—Small ecological footprint? A multi-annual environmental impact analysis using aquatic macroinvertebrates as bioindicators. Part 2: Effects on functional diversity
 Alberto Scotti
 Dean Jacobsen
 Roberta Bottarin1
- 1Institute for Alpine Environment, Eurac Research, Bozen, Italy
- 2Freshwater Biology Section, Department of Biology, University of Copenhagen, Copenhagen Ø, Denmark
Currently, across the entire European river network, there are an estimated 0.74 barriers per kilometer of river length, with hydropower production being the main cause of riverine habitat fragmentation. On the one hand, policy actions have been proposed by different institutions to limit this impact. On the other hand, the compelling need to produce energy from renewable/sustainable resources is further boosting the impoundment of rivers, since, globally, small hydropower plants are expected to contribute greatly to future energy needs. While a few studies have already analyzed the environmental impact of small hydropower plants by researching the structural communities of benthic macroinvertebrates, none have thus far assessed the potential impacts related to the functional diversity of these communities. Here, following a “Before-After-Control-Impact (BACI)” scheme, we implemented different methodologies to study the functional diversity of benthic communities sampled across 4 sites in a fish-free, glacier-fed stream of the Italian Central-Eastern Alps for 5 consecutive years. More specifically, the sampling sites were chosen in an area near the weir of a small “run-of-river” hydropower plant, which constituted the structure from which water was diverted to the turbine. Specific goals were to assess the potential variation in the functional traits of benthic macroinvertebrates in relation to the weir’s presence, investigate whether a variation in trait distribution was caused by alterations in the abundances of common and rare taxa, and quantify functional diversity in space and time through the application of specific indices. Our initial hypothesis of finding significant differences among the sampling sites after the start-up of the hydropower plant was not confirmed by our results, since the benthic communities at all sites continued to exhibit a largely similar set of traits and, consequently, functional diversity. Our results highlighted the need for a better understanding of the relationships between effect traits and ecological processes to establish thresholds from which a shift in these processes may occur. Hence, a better understanding of the assets and liabilities of already established small hydropower plants may be a guide for more conscious decisions concerning the establishment of new ones and/or changes in the management of already existing ones.
Introduction
Since the beginning of civilization, streams and rivers have been managed with the aim of controlling water to better sustain human settlements (Juuti et al., 2007). Currently, more than half of the surface freshwaters of our planet are exploited by human activities (Vitousek et al., 1997). Not surprisingly, for Europe, an intensively inhabited continent, estimations suggest that more than one million barriers currently fragment freshwater; for the whole continental river network, this means that 0.74 barriers per kilometer of river length are in place (Belletti et al., 2020).
Although many barriers are reported as obsolete or having an unknown purpose, barriers used for hydropower production, especially small barriers (<5 m height), are the most common cause of fragmentation in European streams and rivers (EEA, 2018). While on the one hand, European policies and environmental organizations are calling for establishing increasingly more kilometers of free-flowing rivers (European Commission, 2020; WWF, 2021), on the other hand, the high demand for energy from renewable resources is resulting in an increase in the number of barriers from hydropower plants, in particular weirs of small “run-of-river” (ROR) hydropower plants (Kuriqi et al., 2019; Zappa et al., 2019). Indeed, these hydropower schemes are reported to have a high unexploited potential capacity (Liu et al., 2019). Consequently, the implementation of these plants is already largely occurring worldwide and is expected to continue in the coming years (Couto and Olden, 2018).
Characterized by the absence of water storage systems, ROR hydropower plants utilize only the flow within the stream/river channel to produce energy: a proportion of the main flow is diverted through a barrier—the weir—to a turbine and then returned to the stream/river further downstream (Anderson et al., 2015). Desilter/desander tanks may also be part of the plants, allowing the deposition of suspended sediments before sending the water to the turbine. These sediments are then regularly flushed and returned to the stream/river downstream of the weir. Since ROR hydropower plants do not require the presence of large reservoirs, they are often perceived as benign in terms of environmental impact (Venus et al., 2020) and considered one the most cost-effective solutions for rural electrification in less developed areas (Manzano-Agugliaro et al., 2017). However, while some cases have indicated that the environmental impact of ROR hydropower schemes on riverine ecosystems is negligible [see Scotti et al. (2022) this issue], other cases have indicated that they have a detrimental effect on running-water environments (e.g., Wang et al., 2016; Bilotta et al., 2017). These studies assessed the impact of ROR hydropower plants by evaluating the community structure of aquatic macroinvertebrates and overlooked the functional-ecological aspect. To the best of our knowledge, a functional approach for evaluating the potential adverse impacts of ROR hydropower plants has never been applied.
The study of benthic communities with respect to functional characteristics complements taxonomic studies and has more predictive power when dealing with research questions concerning community ecology (Finn and Poff, 2005). The fundamental theoretical concept behind this approach is the notion of environmental filtering (Keddy, 1992): organisms are progressively filtered out from global and regional pools on the basis of their functional traits, i.e., tolerances or requirements. Thus, local communities possess the traits that are most adapted to specific (local) environmental conditions, while organisms with less adapted traits are present at a low abundance or not present at all (De Bello et al., 2021). In summary, the theory recognizes that traits, since they are selected across environmental gradients, may have a considerable impact during the assembly process of organismal communities (Keddy and Laughlin, 2021).
Here, the overarching goal of our study was to verify whether the presence of the weir of an ROR hydropower plant could constitute a factor introducing an abrupt “environmental gradient” in a semi-pristine running-water environment. Applying a BACI design scheme (Green, 1979) along four sampling sites, we investigated the functional features (i.e., traits) of aquatic macroinvertebrates of a glacier-fed stream where a ROR hydropower plant has been implemented. Studying aquatic insects’ functional traits allows us to assess their specific role in streams and rivers, linking them to the different ecosystem services they may offer (Suter and Cormier, 2015). For example, shredders and collectors—traits referring to the feeding type—are crucial to leaf decomposition in streams (Wallace and Webster, 1996), and merolimnic taxa—organisms whose adult stage moves to terrestrial habitats instead of remaining in the stream—impact the magnitude of the flow of organic matter moving from the water to the land, which potentially affects the productivity of terrestrial habitats near the streams (Suter and Cormier, 2015).
More specifically, in this study, we aimed to 1) identify the characteristic set of traits that benthic macroinvertebrate communities had in four sampling sites that differed in their relative position to the weir of the hydropower plant; 2) identify whether changes in community trait distribution were caused by the appearance or disappearance of common or rare taxa; 3) quantify the functional diversity of the benthic communities along the four sites by calculating a set of indices and assess whether a pattern of “specialization” following the potential new habitats created by the weir could be observed.
We hypothesized that 1) given the variety of habitats that a weir is reported to introduce (e.g., Csiki and Rhoads, 2010), a differentiation in the traits of the benthic macroinvertebrate communities of the four sites was anticipated; 2) the traits reported to be extremely sensitive to the environmental perturbation introduced by the weir were the ones most likely to disappear, especially if they were carried by rare taxa in the control site; 3) overall, following these two hypotheses, we expected each site to functionally diverge from each other (i.e., each site would be characterized by specific traits, see Table 1), but functionally converging on specific traits at the site level [i.e., the new environmental conditions would result in communities characterized by a few specific traits (see Table 1)]. A specific set of a priori hypotheses concerning specific traits, their connection and distribution within the habitats introduced by the weir of an ROR hydropower plant, and the expected behavior of functional diversity, is shown in Table 1.
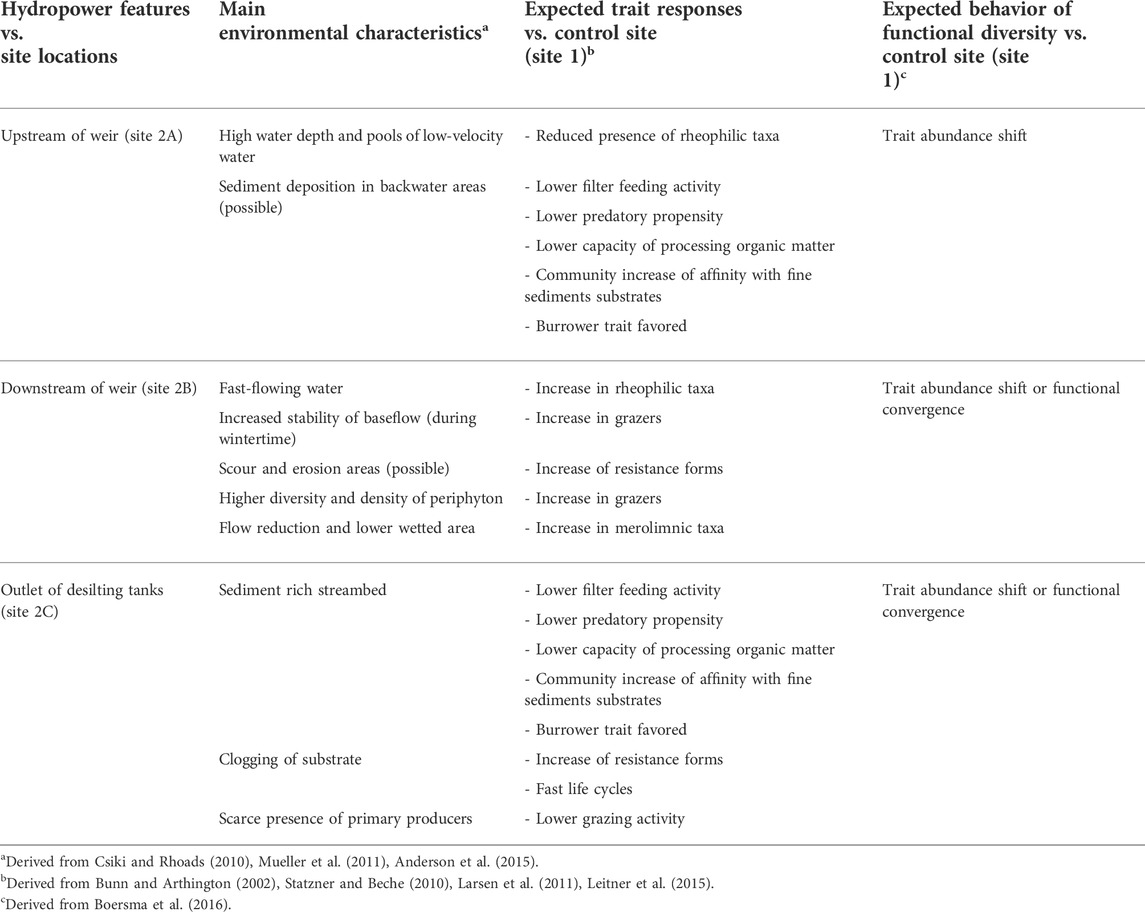
TABLE 1. Detailed set of a priori hypotheses relating sampling sites, main anticipated environmental characteristics, trait responses, and behavior of functional diversity. Site 1 is not reported, since it is the unimpacted control site.
Materials and methods
Experimental design
The Saldur stream (Figure 1) is a glacier-fed, fish-free tributary of the Adige River, the second longest river in Italy. It originates at the Matscher glacier (N 46°, E 10°, Italian Central-Eastern Alps) and is approximately 21.5 km long. Its catchment ranges from 921 m.a.s.l. to 3,738 m.a.s.l. and, according to the Köpper Geiger climate classification (Rubel et al., 2017), the climate spans from Et to Dfc following a decreasing elevational gradient. The whole catchment (101 km2) has been part of the International Long Term Ecological Research (ILTER) network since 2014 (site code IT-25). The water flow and geomorphology of the Saldur stream could be considered “near-pristine” until 2014, when an ROR hydropower plant was planned to be built (Figure 1). The hydropower plant started to produce energy in 2016. In addition, water is abstracted for the household and tourism sectors and aquaculture (Scotti and Bottarin, 2021).
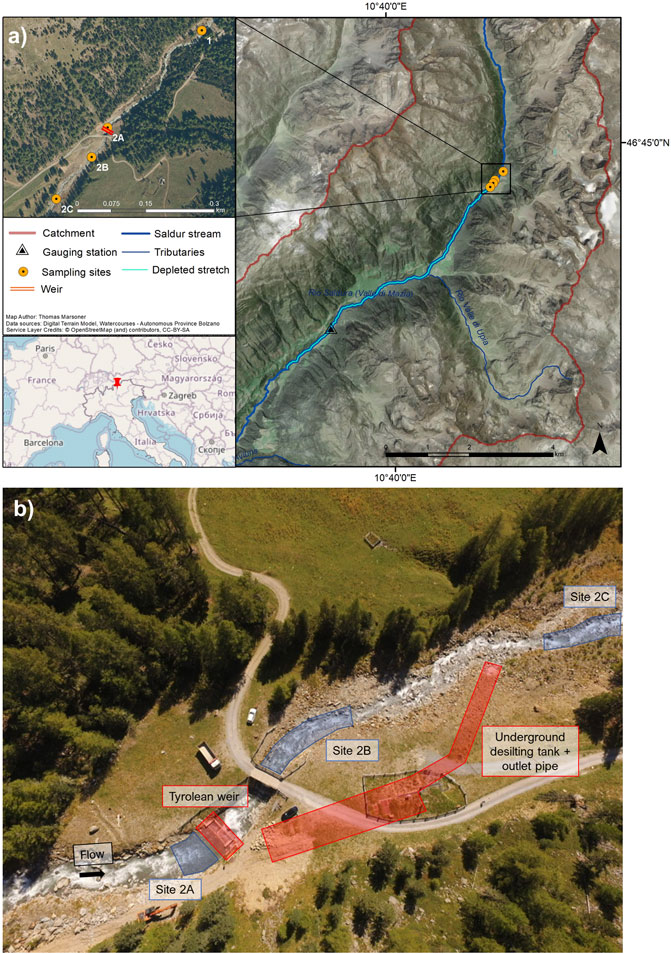
FIGURE 1. (A) Location of the Saldur stream and of the sampling sites along the longitudinal stream transect; (B) aerial view of the sampling sites (blue) and technical infrastructures (red) of the run-of-river hydropower plant.
We sampled benthic macroinvertebrates at 4 sites along the stream (Figure 1). Site 1 acted as the control site, while the sites in the water diversion area of the ROR hydropower plant, i.e., from 2A to 2C were selected based on their relative position to the technical infrastructures of the plant: site 2A was upstream of the weir, site 2B downstream of the weir, and site 2C approximately 150 m downstream of the weir and immediately downstream of the outlet pipe of the desilting tanks, respectively (Figure 1). Thus, sampling sites 2A, 2B, and 2C are considered impacted because they are potentially influenced by the activities of the hydropower plant, and 2B and 2C are located in the depleted stretch of the stream. downstream of the water diversion (Figure 1). More detailed information about the hydropower plant, the catchment, and the sampling sites is available in Scotti et al. (2022), Scotti and Bottarin (2021), and Scotti et al. (2019).
Fieldwork & laboratory activities
Benthic macroinvertebrates were collected twice a year at the 4 sites for 5 consecutive years from 2015 to 2019: in late April/mid-May (“early” sampling period) and in late September/mid-October (“late” sampling period). At each site and for each sampling occasion (10 in total), a total of 12 quantitative Surber samples (22 × 23 cm, mesh-size 500 µm) were collected within a 20–50 m segment of the stream. These samples were constituted by three subsamples, each made up of four pooled individual residents. The three subsamples were kept separated during the sorting and identification phases. The sampling effort consisted of perturbing the substrate of the stream (mainly macrolithal, stones of 20–40 cm; and mesolithal, stones of 6–20 cm) upstream of the Surber sampler for approximately 1 min. Each subsample was then filtered in the field using a 100 µm sieve net, preserved in plastic sealed bottles containing 70% ethanol, labeled and brought to the laboratory within the same day. To measure potential differences in discharge introduced by the hydropower plant, a gauging station located approximately 6 km downstream of the weir in the water-depleted stretch maintained by the Hydrographical Office of the Autonomous Province of Bolzano/Bozen provided water discharge data throughout the entire length of the study.
In the laboratory, samples were sorted without applying subsampling, and organisms were separated from the debris. All organisms were then counted and identified to the lowest possible taxonomic level, mostly genus, under a stereoscopic microscope at 50× magnification, referring to appropriate literature (Olmi 1978; Consiglio 1980; Ferrarese and Rossaro 1981; Rossaro 1982; Belfiore 1983; Nicolai 1983; Rivosecchi 1983; Lechthaler and Car, 2005; Lechthaler and Stockinger, 2005).
Further details about the fieldwork and laboratory activities are available in Scotti et al. (2022) and Scotti & Bottarin (2021).
Data analysis path
Initially, we performed the functional characterization of the benthic macroinvertebrate communities following the framework proposed by Brousseau et al. (2018); the selection of the traits, as well as the linked research questions, was based on the response of the organisms to a given environmental driver (Table 1), even though for some traits, an effect on some ecological processes was anticipated (e.g., feeding type in relation to cycling of organic matter). In summary, we considered 7 traits comprising a total of 43 trait categories: microhabitat/substrate preference (Moog et al., 1999), current preference (Schmedtje and Colling, 1996), feeding type (Moog, 1995), and mode of life; horo or merolimnic (Schmidt-Kloiber and Hering, 2015), locomotion and substrate relation (Tachet et al., 2010), resistance forms (Tachet et al., 2010), and potential number of cycles per year (Tachet et al., 2010). All traits were fuzzy coded, except for current preference and mode of life (nominal traits). Trait values were assigned following the taxonomic resolution of the faunal dataset, and the taxon entry tool of freshwatercology.info was used as consistent taxonomical reference for all the databases (Schmidt-Kloiber and Hering, 2015). When the taxonomic resolution was too refined for assigning a specific trait value, the coarser taxonomic level was considered (e.g., if for a species the trait values were missing, we assigned the trait values corresponding to the genus. If genus values were also missing, we assigned the trait values corresponding to family). Eventually, all the collected macroinvertebrates received trait values for all the selected traits. Supplementary Table S1 shows the complete list of trait and trait categories, including their abbreviations used in the figures.
As the first step of the analysis, using the functcomp function of the R package FD (Laliberté and Legendre, 2010), we calculated the average trait value weighted by the species’ relative abundances for each trait category—the Community Weighted Mean (CWM)—of each sample, keeping the sampling periods separated. To test the differences in CWM values among the different sites, these values were then used as an input for a profile analysis (Davidson and Davenport, 2002) by applying the pbg function of the profileR R package (Bulut and Desjardins, 2018), according to the procedure described by Bulut and Desjardins (2020) and using a set of techniques for univariate analysis. Each of the seven traits was tested separately, focusing on three null hypotheses: the parallelism of the profile of the trait categories of the four sites (representing four groups in the analysis, i.e., testing whether the variation of trait categories is constant among the sites), their equal levels (i.e., if the profiles are coincident) and whether the profiles are flat. Refer to Bulut and Desjardins (2020) for more details concerning this analysis.
As a second step, we again computed the CWM based on relative abundances after log transformation of the benthic macroinvertebrate data (CWM(LN)). In this way, the obtained values gave more importance to the signal of subordinate taxa (Cingolani et al., 2007; de Bello et al., 2007) and were much more dependent on taxa that were originally less dominant. Afterward, calculating the difference (CWMDIFF) between the CWM after log transformation and CWM on raw data, we could identify the trait categories carried by common or rare taxa at each site at each sampling occasion. A negative result of the subtraction (CWM > CWM (LN)) indicated that the specific trait category was mainly carried by common taxa; in contrast, a positive result of the subtraction (CWM < CWM (LN)) indicated that the specific trait category was mainly carried by rare taxa. The values of CWM, CWM(LN), and CWMDIFF calculated for all 10 sampling occasions were statistically tested per site to look for an effect of time through Friedman tests (Friedman, 1937)—assumptions of repeated-measures ANOVA could not be met – and the effect sizes were estimated through the calculation of Kendall’s W coefficients.
As the last step, a set of functional diversity indices was calculated through the mFD R package (Magneville et al., 2021), keeping sites, periods, and years separated. First, we computed the multidimensional functional spaces where the functional indices had to be calculated. Afterward, keeping the spaces with the highest quality, we quantified the functional indices (Magneville et al., 2022). The separation of these steps limited potential mistakes in the interpretation of the results and enhanced the standardization of the analysis (Villéger et al., 2017). First, with the function mFD::funct.dist, we calculated the functional trait-based distances between each pair of macroinvertebrate taxa to build the functional space where the functional indices were then computed. For this step, we used Gower distance—since we had fuzzy coded traits—and we assigned equal weight to all the traits. The trait-based distances were then used as input for a PCoA to create the multidimensional functional space where the indices could be calculated. This was performed with the mFD::quality.fspaces function, which was set to use both mean absolute deviation and root of mean square deviation to evaluate the quality of multidimensional spaces and scale the distances in the functional spaces so that trait-based distances and distances in the functional space had the same maximum. After selecting the functional space with the best quality, we were able to quantify, using the Kruskal–Wallis test included in the function mFD::traits.faxes.cor, the correlation between the functional axes of the space and the trait categories of the benthic macroinvertebrates. Then, we calculated a set of alpha diversity indices in the multidimensional space of best quality: functional richness—FRic (Villéger et al., 2008), functional identity—FIde (Mouillot et al., 2013), functional dispersion—FDis (Laliberté and Legendre, 2010), functional divergence—FDiv (Villéger et al., 2008), functional evenness—FEve (Villéger et al., 2008), functional originality—FOri (Mouillot et al., 2013), and functional specialization—FSpe (Mouillot et al., 2013). As a final step, the variation in these functional indices across the sampling sites was then tested by performing a one-way ANOVA on each of the indices separately, considering the 10 different sampling occasions, using the function anova_test of the R package rstatix (Kassambara, 2020). Prior to this step, we had checked for normality of data with a qq-plot and tested the homogeneity of data with Levene’s test.
All data were processed using Microsoft R Open software, version 4.0.2. (Microsoft, R Core Team 2020), and the graphics were produced with the ggplot2 R package (Wickham, 2011).
Results
The CWM values calculated for each trait category showed very similar patterns across all sampling sites throughout the 5 experimental years, as tested through the profile analysis (Figure 2; Table 2, which represents the averages of the 5 years). Indeed, all traits resulted in parallel, non-flat profiles and equal levels; thus, for the sampling sites no significant differences could be detected when comparing trait distributions across space (Table 2). The “mode of life” trait could not be tested since it had just two categories, but the site profiles completely overlapped (Supplementary File S1).
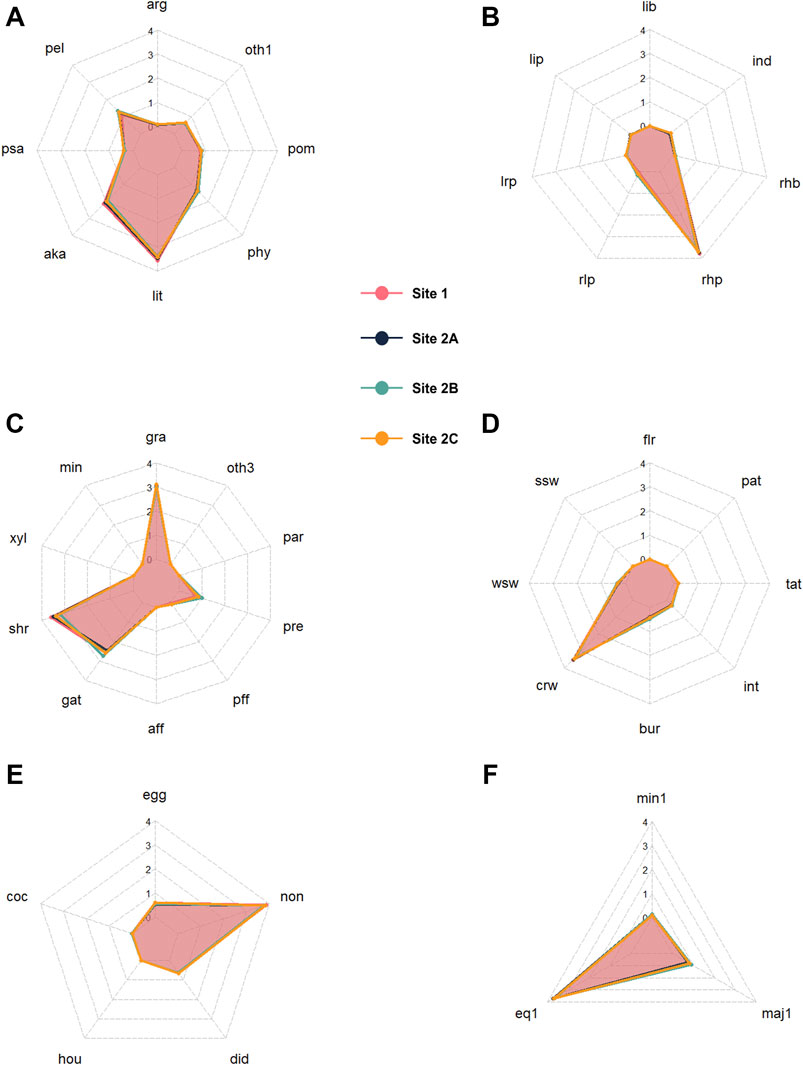
FIGURE 2. CWM values for each site and trait category, pictured as averages of the entire study period (5 years) for (A) microhabitat/substrate preference; (B) current preference; (C) feeding type; (D) locomotion and substrate relation; (E) resistance forms; and (F) potential number of cycles per year. Refer to Supplementary Table S1 for the abbreviations of trait categories and to Supplementary File S1 for the entire dataset of CWM values.
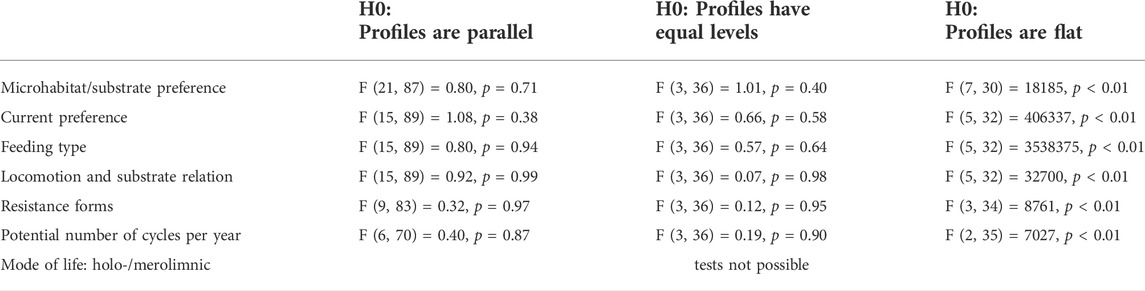
TABLE 2. Report of the profile analysis: for all the tested traits, profiles were parallels, with equal levels, not flat. For further details concerning the analysis, refer to Bulut and Desjardins (2020). (H0 = null hypothesis).
When looking at the variable time, a slight effect on trait distribution was found at all sites (with α =0.05) when analyzing the variations in CWM (Table 3). However, this effect was not statistically significant when calculated for CWM(LN) and CWMDIFF (see Table 3; Figure 3, where the averages of the 5 years are shown). Thus, CWM indicated a generalized difference in distributions of traits—both in control and impacted sites—while the other two indices indicated the opposite (Table 3). It is remarkable that, despite the contrasting results, no differences were highlighted when considering the control vs. impacted sites for the same index. Similarly, Kendall’s W was small for all the indices at all the sites, suggesting that the trait distributions included some traits that were particularly present in the communities and others that were completely absent (see CWM and CWM(LN), Table 3) and that trait categories were equally carried by common and rare taxa (see CWMDIFF, Table 3).
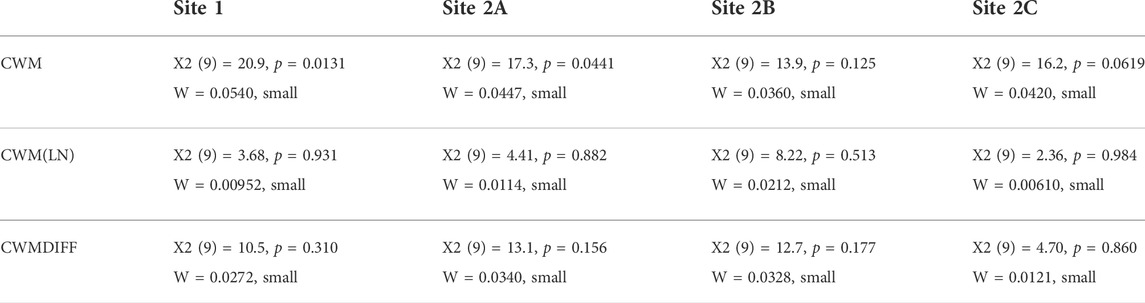
TABLE 3. Summary of the Friedman tests and Kendall’s W of CWM, CWM(LN), and CWMDIFF calculated per each site.
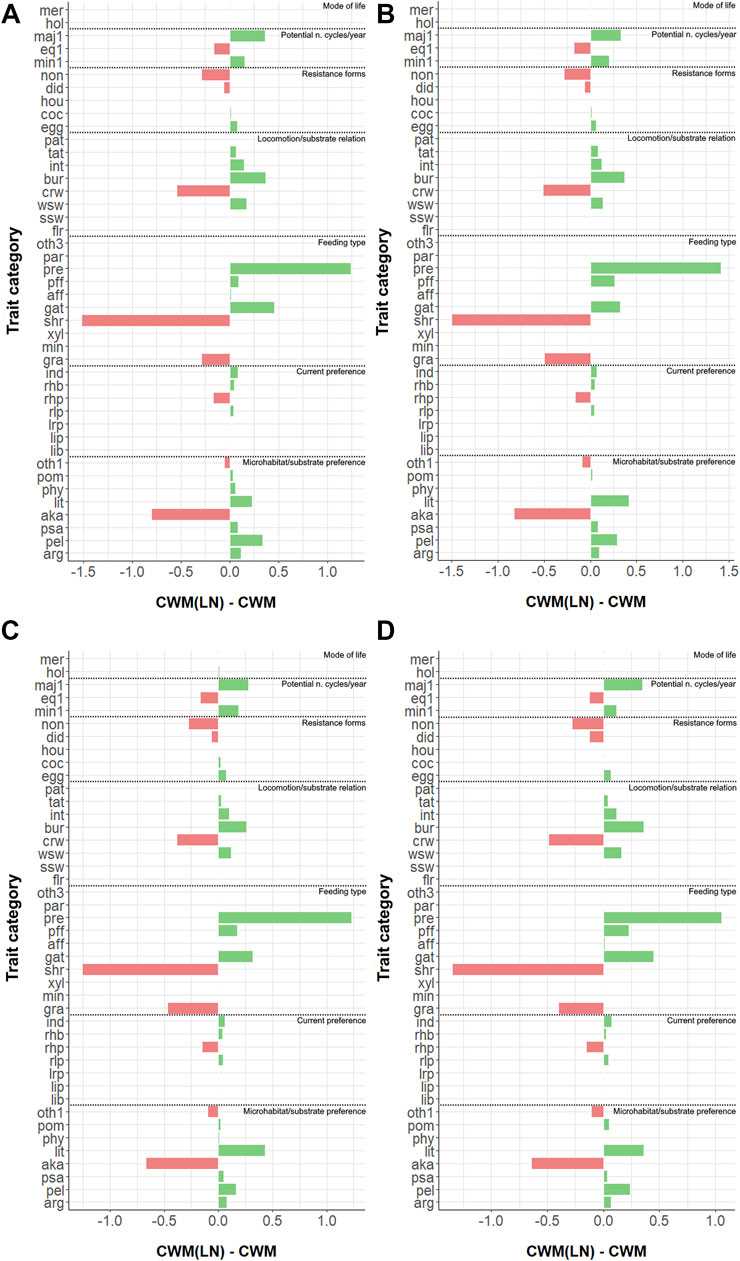
FIGURE 3. Measured differences between CWM(LN) and CWM (=CWMDIFF) for all trait categories for (A) site 1; (B) site 2A; (C) site 2C; and (D) site 2D. Refer to Supplementary Table S1 for the abbreviations of trait categories.
After the calculation of the functional trait-based distances (Supplementary File S1), among the 21 axes created by the PCoA, the highest quality ones considering both mean absolute deviation (mad) and root of mean square deviation (rmsd) were numbers 9, 10, 11, and 12 (Supplementary Table S2) and were then used to create the 4-D functional space where the functional indices were calculated. However, prior to this step, the correlation test between the functional axes and the traits had revealed that no traits were significantly correlated to these axes—despite being the ones with the best quality. Thus, a gradient in the distribution of traits along the sampling sites could not be identified.
The entire set of functional indices calculated showed similar values among all the sites (Figure 4; Supplementary Table S3), and the one-way ANOVA indicated nonsignificant differences (α =0.05) for all the indices (Table 4). The complete set of selected indices and their variation by sites is represented in Figure 4.
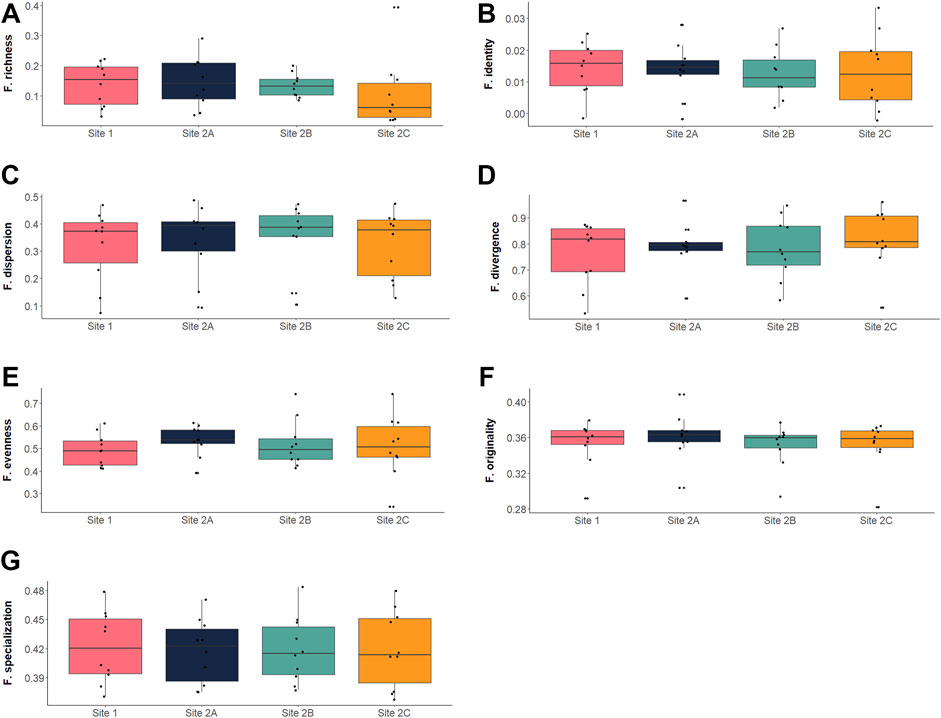
FIGURE 4. Boxplots representing the functional diversity values for the calculated indices: (A) functional richness (Villéger et al., 2008); (B) functional identity (Mouillot et al., 2013); (C) functional dispersion (Laliberté & Legendre, 2010); (D) functional divergence (Villéger et al., 2008); (E) functional evenness (Villéger et al., 2008); (F) functional originality (Mouillot et al., 2013); (G) functional specialization (Mouillot et al., 2013). Each black dot represents an observed value at each of the 10 sampling occasions (10 dots per site per index).
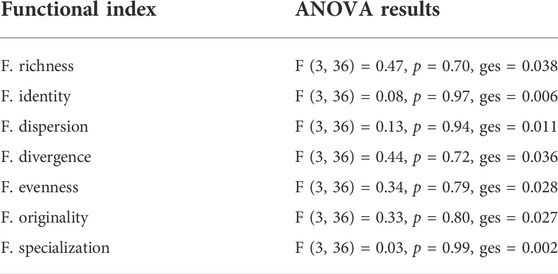
TABLE 4. Summary of the ANOVA results for the calculated functional indices. None of the indices changed significantly (with α = 0.05) across the sampling sites. See also Figure 4 and refer to text to have additional references on each index.
The complete dataset that includes a set of intermediate results used as inputs for further analyses (i.e., calculated CWM, CWM(LN) and CWMDIFF for each site and sampling occasion, functional trait-based distances used for creating the functional spaces) is included in the Supplementary File S1.
Discussion
When planning the present study and analysis, we considered some crucial aspects of trait-based ecology: 1) we applied a multiple-trait approach, including only traits for which we could provide explicit a priori hypotheses (Lefcheck and Duffy, 2015; see Table 1); 2) the selection of these traits was based on the response of the benthic macroinvertebrates to a clear potential environmental driver – the weir of the ROR hydropower plant (Brousseau et al., 2018; see Table 1); 3) the weir could be defined as an indirect gradient (Austin and Smith, 1990), since its presence could influence the physical environment experienced by the macroinvertebrates; 4) we analyzed entire communities, since the link between environmental conditions and traits is generally clearer at the community level (see Ackerly et al., 2002). Overall, the application of this framework allowed us to have a straightforward interpretation of the outcomes of the study; our results showed that the presence of the weir did not constitute an environmental filter able to change the functional features of the benthic macroinvertebrates (Diaz et al., 1998). Thus, this study supplements and supports the results that Scotti et al. (2022), found concerning the nondetectable impact of the same weir on the taxonomic community structure of benthic macroinvertebrates.
Concerning our first hypothesis, we were unable to identify different sets of traits at the different sampling sites (see Table 2; Figure 2). Although we hypothesized that the presence of the weir could affect the macroinvertebrate communities at sites 2A, 2B, and 2C in specific ways (Table 1), none of these sites exhibited differences when compared to each other or to the control site. Similar to the explanation given when considering taxonomic community structure only (Scotti et al., 2022), we can argue that the weir did not contribute to a change in the environmental features of the sites (especially in regard to discharge variations and sediment balance); no traits were filtered out and the functional community profiles of the sites remained almost identical (Figure 2). The main reason for this result is most likely that the ecological dynamics of the Saldur stream remained strongly driven by glacial melting (Scotti et al., 2022; Scotti et al., 2019). Considering the functional aspect, this phenomenon emerged when analyzing CWM values and trait distributions: the Kendall’s W of CWM and CWM(LN) was “small” (Table 3) at all sites. This means that among the trait categories, only some were particularly present in our communities; this scenario is anticipated in harsh environments (Gobbi et al., 2017), where a set of particular traits normally allow the success of the taxa. However, other authors (Pistón et al., 2019) argued that the link between traits and the environment could be multifaceted, so that several combinations of traits may result in a similar fitness level. In this sense, the weir did not constitute either a “finer” environmental filter than the one operated by the glacier-fed stream itself or a major “disturbance” able to select new combinations of traits (see Table 2; Figure 2).
Consequently, concerning our second hypothesis, we could not identify differences in trait distributions derived from variations in common and rare taxa. Indeed, the variation in CWMDIFF was never significant at any site (Table 3). However, it was remarkable that while CWM (LN) did not show any significant variation, the opposite occurred for CWM. The likely reason for this divergence in the variation of the two indices is given by Peres-Neto et al. (2017): the fact that a dominant taxon whose abundance—and related traits—changes along a transect, even though not as a direct response to a gradient, has the consequence of overestimating the effect of the environment on the community traits expressed as CWM values. As shown by Scotti et al. (2022), the analysis of the taxonomic variations of the benthic communities of this study indeed showed a noticeable difference in densities of benthic macroinvertebrates among consecutive years of sampling, a trend also found in other studies where differences in snowpacks in consecutive years greatly influenced the abundances and emerging behaviors of some benthic macroinvertebrates (Finn and Poff, 2008). Additionally, the fact that, in the present study, the significant variations over time of the CWM (Table 3) were independent from the potential gradient introduced by the weir was confirmed by the fact that the control site (site 1) also showed a significant variation in the CWM. In conclusion, and given the comparison of these results with the CWM(LN) results (de Bello et al., 2021), the variation in the abundances of benthic macroinvertebrates ultimately led to a slight overestimation of the effect of the environment on benthic community traits. Nevertheless, we argue that the choice of CWM as a tool of analysis was relevant for the ecological question being asked (Zelený, 2018).
In contrast to what we expected, but as a direct consequence of these results, the third hypothesis was not corroborated by our findings. Significant changes in functional divergence of the sites and variation in specialization/identity/originality of the impacted sites were not detected (Figure 4; Table 4). Instead, all functional indices exhibited comparable values throughout time (Supplementary Table S3) and sites (Supplementary Table S3; Figure 4), thus not supporting the explicit a priori hypotheses we produced in Table 1.
In summary, we were unable to detect an effect of the weir of the ROR hydropower plant on the distribution of single traits or on the “benthic functional community” as a whole (i.e., functional indices). A possible limitation of our study may be the usage of trait databases. Indeed, this choice may affect the output of the study in a twofold way: 1) we could not consider intraspecific variability, which is increasingly recognized as a factor conditioning overall trait variation (Albert et al., 2010; Siefert et al., 2015); 2) the very local scale of our study could not cope well with trait data collected at much larger scales (Cordlandwehr et al., 2013; de Bello et al., 2021). However, especially for this last issue, we used trait datasets applied in studies of aquatic ecology in Europe at different spatial scales (e.g., Schülting et al., 2016; Scotti et al., 2020). Moreover, when different databases were available for the same trait, we chose the ones more targeted to the environmental and habitat conditions of the Saldur stream (e.g., for microhabitat/substrate preference and feeding type).
Despite these limitations, as described also for the taxonomic part (Scotti et al., 2022), we can confidently say that the weir of the ROR hydropower plant did not introduce a perturbation to the riverine ecosystems, even when investigating the functional aspect of benthic macroinvertebrate communities. This result also suggests that key ecosystem functions in which benthic macroinvertebrates participate, such as detritus decomposition, or depend on, such as periphytic algae production, were unaffected by the weir of the ROR hydropower plant. Future studies may be targeted at exploring not only (or mainly) the mechanistic effects on response traits but also at disentangling more explicitly the potential changes in ecosystem processes caused by variations in effect traits (Brousseau et al., 2018). Moreover, the sharing of good practices and experiences among professionals and managers of hydropower plants may help in the identification of thresholds from which ecological processes may suffer a shift, especially in relation to situations where multiple-cascade systems of small hydropower plants are in place (Kuriqi et al., 2021). In conclusion, our study was conducted in a fish-free, glacier-fed, high-gradient stream that contributed to a “buffer” potential disruptive effect on the environment introduced by the ROR hydropower plant. However, this situation is common for many small hydropower plants across the European Alps and for those that may be built in the coming years. Especially in light of the increasing number of plants whose construction is anticipated and given the paucity of studies on the topic (Couto and Olden, 2018), we argue that more researchers should aim to assess, in the long term, the impact of ROR hydropower plants, particularly from a functional point of view. Moreover, an important aspect would be the reporting of the design scheme, power capacity, and size of the systems under study (Kelly Richards et al., 2017). In this way, a more conscious differentiation between small hydropower plants that represent added value for the environment in terms of sustainable energy production and those that represent a serious disruptive factor for aquatic ecosystems will become increasingly possible.
Data availability statement
Dataset used for this study is permanently stored by PANGAEA - Data Publisher for Earth and Environmental Science, and it is publicly accessible at this web address: https://doi.pangaea.de/10.1594/PANGAEA.922524.
Author contributions
AS: conceptualisation, methodology, software, formal analysis, investigation, resources, data curation, writing—original draft, writing—review and editing, visualisation, supervision; DJ: conceptualisation, methodology, resources, writing—review and editing, supervision; RB: conceptualisation, methodology, investigation, resources, writing—review and editing, supervision, project administration, funding acquisition.
Funding
Eurac Research internal funds, with the support of the Autonomous Province of Bolzano/Bozen.
Acknowledgments
We thank the Hydrographical Office and the Environment and Climate Agency of the Autonomous Province of Bolzano/Bozen for proving data of discharge and the technical details of the small hydropower plant under study. Moreover, the authors thank Thomas Marsoner for producing the map in Figure 1 and Christian Brida for guidance with ggplot2. In addition, we thank Johannes Klotz, Agnese Martinelli, Arianna Peron, Karin Plank, Alexia Rottensteiner, Igor Zanvettor for providing help during the fieldwork and in the lab. The site Matsch|Mazia belongs to the national and international long term ecological research networks (LTER-Italy, LTER Europe, and ILTER). The authors thank the Department of Innovation, Research and University of the Autonomous Province of Bozen/Bolzano for covering the Open Access publication costs.
Conflict of interest
The authors declare that the research was conducted in the absence of any commercial or financial relationships that could be construed as a potential conflict of interest.
Publisher’s note
All claims expressed in this article are solely those of the authors and do not necessarily represent those of their affiliated organizations, or those of the publisher, the editors and the reviewers. Any product that may be evaluated in this article, or claim that may be made by its manufacturer, is not guaranteed or endorsed by the publisher.
Supplementary material
The Supplementary Material for this article can be found online at: https://www.frontiersin.org/articles/10.3389/fenvs.2022.904547/full#supplementary-material
References
Ackerly, D., Knight, C., Weiss, S., Barton, K., and Starmer, K. (2002). Leaf size, specific leaf area and microhabitat distribution of chaparral woody plants: Contrasting patterns in species level and community level analyses. Oecologia 130 (3), 449–457. doi:10.1007/s004420100805
Albert, C. H., Thuiller, W., Yoccoz, N. G., Douzet, R., Aubert, S., and Lavorel, S. (2010). A multi-trait approach reveals the structure and the relative importance of intra- vs. interspecific variability in plant traits. Funct. Ecol. 24 (6), 1192–1201. doi:10.1111/j.1365-2435.2010.01727.x
Anderson, D., Moggridge, H., Warren, P., and Shucksmith, J. (2015). The impacts of 'run-of-river' hydropower on the physical and ecological condition of rivers. Water Environ. J. 29 (2), 268–276. doi:10.1111/wej.12101
Austin, M. P., and Smith, T. M. (1990). “A new model for the continuum concept,” in Progress in theoretical vegetation science (Dordrecht: Springer), 35–47. doi:10.1007/978-94-009-1934-1_4
Belletti, B., Garcia de Leaniz, C., Jones, J., Bizzi, S., Börger, L., Segura, G., Castelletti, A., van de Bund, W., Aarestrup, K., Barry, J., Belka, K., Berkhuysen, A., Birnie-Gauvin, K., Bussettini, M., Carolli, M., Consuegra, S., Dopico, E., Feierfeil, T., Fernández, S., Fernandez Garrido, P., Garcia-Vazquez, E., Garrido, S., Giannico, G., Gough, P., Jepsen, N., Jones, P. E., Kemp, P., Kerr, J., King, J., Łapińska, M., Lázaro, G., Lucas, M. C., Marcello, L., Martin, P., McGinnity, P., O’Hanley, J., Olivo del Amo, R., Parasiewicz, P., Pusch, M., Rincon, G., Rodriguez, C., Royte, J., Schneider, C. T., Tummers, J. S., Vallesi, S., Vowles, A., Verspoor, E., Wanningen, H., Wantzen, K. M., Wildman, L., and Zalewski, M. (2020). More than one million barriers fragment Europe's rivers. Nature 588 (7838), 436–441. doi:10.1038/s41586-020-3005-2
Bello, F., Lepš, J., Lavorel, S., and Moretti, M. (2007). Importance of species abundance for assessment of trait composition: An example based on pollinator communities. Community Ecol. 8 (2), 163–170. doi:10.1556/comec.8.2007.2.3
Bilotta, G. S., Burnside, N. G., Turley, M. D., Gray, J. C., and Orr, H. G. (2017). The effects of run-of-river hydroelectric power schemes on invertebrate community composition in temperate streams and rivers. PloS one 12 (2), e0171634. doi:10.1371/journal.pone.0171634
Boersma, K. S., Dee, L. E., Miller, S. J., Bogan, M. T., Lytle, D. A., and Gitelman, A. I. (2016). Linking multidimensional functional diversity to quantitative methods: A graphical hypothesis-evaluation framework. Ecology 97 (3), 583–593. doi:10.1890/15-0688
Brousseau, P.-M., Gravel, D., and Handa, I. T. (2018). On the development of a predictive functional trait approach for studying terrestrial arthropods. J. Anim. Ecol. 87 (5), 1209–1220. doi:10.1111/1365-2656.12834
Bulut, O., and Desjardins, C. D. (2020). Profile analysis of multivariate data: A brief introduction to the profileR package. PsyArXiv Prepr. doi:10.31234/osf.io/sgy8m
Bulut, O., and Desjardins, C. D. (2018). profileR: Profile Analysis of Multivariate Data in R. R package version 0.3-5. Available at: https://CRAN.R-project.org/package=profileR.
Bunn, S. E., and Arthington, A. H. (2002). Basic principles and ecological consequences of altered flow regimes for aquatic biodiversity. Environ. Manag. 30 (4), 492–507. doi:10.1007/s00267-002-2737-0
Cingolani, A. M., Cabido, M., Gurvich, D. E., Renison, D., and Díaz, S. (2007). Filtering processes in the assembly of plant communities: Are species presence and abundance driven by the same traits? J. Veg. Sci. 18 (6), 911–920. doi:10.1111/j.1654-1103.2007.tb02607.x
Cordlandwehr, V., Meredith, R. L., Ozinga, W. A., Bekker, R. M., Groenendael, J. M., and Bakker, J. P. (2013). Do plant traits retrieved from a database accurately predict on-site measurements? J. Ecol. 101 (3), 662–670. doi:10.1111/1365-2745.12091
Couto, T. B., and Olden, J. D. (2018). Global proliferation of small hydropower plants - Science and policy. Front. Ecol. Environ. 16 (2), 91–100. doi:10.1002/fee.1746
Csiki, S., and Rhoads, B. L. (2010). Hydraulic and geomorphological effects of run-of-river dams. Prog. Phys. Geogr. Earth Environ. 34 (6), 755–780. doi:10.1177/0309133310369435
Davison, M. L., and Davenport, E. C. (2002). Identifying criterion-related patterns of predictor scores using multiple regression. Psychol. methods 7 (4), 468–484. doi:10.1037/1082-989x.7.4.468
de Bello, F., Carmona, C. P., Dias, A. T., Götzenberger, L., Moretti, M., and Berg, M. P. (2021). Handbook of trait-based ecology: From theory to R tools. Cambridge: Cambridge University Press.
Diaz, S., Cabido, M., and Casanoves, F. (1998). Plant functional traits and environmental filters at a regional scale. J. Veg. Sci. 9 (1), 113–122. doi:10.2307/3237229
EEA (2018). WISE water framework directive (data viewer). Available at: https://www.eea.europa.eu/data-and-maps/dashboards/wise-wfd (Accessed 02 25, 2022).
European Commission (2020). COM(2020) 380 final: EU biodiversity strategy for 2030 – bringing nature back into our lives. Available at: https://eur-lex.europa.eu/resource.html?uri=cellar:a3c806a6-9ab3-11ea-9d2d-01aa75ed71a1.0001.02/DOC_1&format=PDF (Accessed 02 25, 2022).
Ferrarese, U., and Rossaro, B. (1981). Chironomidi, 1 (Diptera, chironomidae: Generalità, diamesinae, prodiamesinae). Italy: Consiglio Nazionale delle Ricerche.
Finn, D. S., and Leroy Poff, N. (2005). Variability and convergence in benthic communities along the longitudinal gradients of four physically similar Rocky Mountain streams. Freshw. Biol. 50 (2), 243–261. doi:10.1111/j.1365-2427.2004.01320.x
Finn, D. S., and Poff, N. L. (2008). Emergence and flight activity of alpine stream insects in two years with contrasting winter snowpack. Arct. Antarct. Alp. Res. 40 (4), 638–646. doi:10.1657/1523-0430(07-072)[finn]2.0.co;2
Friedman, M. (1937). The use of ranks to avoid the assumption of normality implicit in the analysis of variance. J. Am. Stat. Assoc. 32 (200), 675–701. doi:10.1080/01621459.1937.10503522
Gobbi, M., Ballarin, F., Brambilla, M., Compostella, C., Isaia, M., Losapio, G., et al. (2017). Life in harsh environments: Carabid and spider trait types and functional diversity on a debris-covered glacier and along its foreland. Ecol. Entomol. 42 (6), 838–848. doi:10.1111/een.12456
Green, R. H. (1979). Sampling design and statistical methods for environmental biologists. Hoboken, NJ, USA: John Wiley & Sons.
Juuti P. S., Katko T., and Vuorinen H. (Editors) (2007). Environmental history of water (London: IWA Publishing).
Kassambara, A. (2020). rstatix: Pipe-Friendly framework for basic statistical tests. R. package version 0.6.0. Available at: https://CRAN.R-project.org/package=rstatix.
Keddy, P. A. (1992). Assembly and response rules: Two goals for predictive community ecology. J. Veg. Sci. 3 (2), 157–164. doi:10.2307/3235676
Keddy, P. A., and Laughlin, D. C. (2021). A framework for community ecology: Species pools, filters and traits. Cambridge: Cambridge University Press.
Kelly-Richards, S., Silber-Coats, N., Crootof, A., Tecklin, D., and Bauer, C. (2017). Governing the transition to renewable energy: A review of impacts and policy issues in the small hydropower boom. Energy Policy 101, 251–264. doi:10.1016/j.enpol.2016.11.035
Kuriqi, A., Pinheiro, A. N., Sordo-Ward, A., Bejarano, M. D., and Garrote, L. (2021). Ecological impacts of run-of-river hydropower plants-Current status and future prospects on the brink of energy transition. Renew. Sustain. Energy Rev. 142, 110833. doi:10.1016/j.rser.2021.110833
Kuriqi, A., Pinheiro, A. N., Sordo-Ward, A., and Garrote, L. (2019). Influence of hydrologically based environmental flow methods on flow alteration and energy production in a run-of-river hydropower plant. J. Clean. Prod. 232, 1028–1042. doi:10.1016/j.jclepro.2019.05.358
Laliberté, E., and Legendre, P. (2010). A distance-based framework for measuring functional diversity from multiple traits. Ecology 91 (1), 299–305.
Larsen, S., Pace, G., and Ormerod, S. J. (2011). Experimental effects of sediment deposition on the structure and function of macroinvertebrate assemblages in temperate streams. River Res. applic. 27 (2), 257–267. doi:10.1002/rra.1361
Lechthaler, W., and Car, M. (2005). Simuliidae: Key to larvae and pupae from central and western Europe. Riegersburg, Austria: Eutaxa - Technisches Büro für Biologie.
Lechthaler, W., and Stockinger, W. (2005). Trichoptera: Key to larvae from central Europe. Riegersburg, Austria: Eutaxa - Technisches Büro für Biologie.
Lefcheck, J. S., and Duffy, J. E. (2015). Multitrophic functional diversity predicts ecosystem functioning in experimental assemblages of estuarine consumers. Ecology 96 (11), 2973–2983. doi:10.1890/14-1977.1
Leitner, P., Hauer, C., Ofenböck, T., Pletterbauer, F., Schmidt-Kloiber, A., and Graf, W. (2015). Fine sediment deposition affects biodiversity and density of benthic macroinvertebrates: A case study in the freshwater pearl mussel river waldaist (upper Austria). Limnologica 50, 54–57. doi:10.1016/j.limno.2014.12.003
Liu, D., Liu, H., Wang, X., and Kremere, E. (2019). World small hydropower development report 2019. Hangzhou, China: United Nations Industrial Development Organization; International Center on Small Hydro Power.
Magneville, C., Loiseau, N., Albouy, C., Casajus, N., Claverie, T., Escalas, A., et al. (2021). _mFD: A computation of functional spaces and functional indices_. R package version 1.0.0. Available at: https://github.com/CmlMagneville/mFD.
Magneville, C., Loiseau, N., Albouy, C., Casajus, N., Claverie, T., Escalas, A., and Villéger, S. (2022). mFD: An R package to compute and illustrate the multiple facets of functional diversity. Ecography 2022 (1). doi:10.1111/ecog.05904
Manzano-Agugliaro, F., Taher, M., Zapata-Sierra, A., Juaidi, A., and Montoya, F. G. (2017). An overview of research and energy evolution for small hydropower in Europe. Renew. Sustain. Energy Rev. 75, 476–489. doi:10.1016/j.rser.2016.11.013
Microsoft, R Core Team (2020). Microsoft R open. Version 4.0.2. Redmond, Washington, USA: Microsoft.
Moog, O., Chovanec, A., Hinteregger, H., and Römer, A. (1999). Richtlinie für die saprobiologische Gewässergütebeurteilung von Fließgewässern. Wien: Wasserwirtschaftskataster. Bundesministerium fur Land-und Forstwirtschaft.
Moog, O. (1995). Fauna aquatica austriaca. Wien: Wasserwirtschaftskataster, Bundesministerium für Land-und Forstwirtschaft.
Mouillot, D., Graham, N. A. J., Villéger, S., Mason, N. W. H., and Bellwood, D. R. (2013). A functional approach reveals community responses to disturbances. Trends Ecol. Evol. 28 (3), 167–177. doi:10.1016/j.tree.2012.10.004
Mueller, M., Pander, J., and Geist, J. (2011). The effects of weirs on structural stream habitat and biological communities. J. Appl. Ecol. 48 (6), 1450–1461. doi:10.1111/j.1365-2664.2011.02035.x
Nicolai, P. (1983). Blefariceridi (Diptera: Blephariceridae). Rome, Italy: Consiglio Nazionale delle Ricerche.
Olmi, M. (1978). Driopidi, elmintidi (Coleoptera dryopidae, elminthidae). Rome, Italy: Consiglio Nazionale delle Ricerche.
Peres-Neto, P. R., Dray, S., and ter Braak, C. J. (2017). Linking trait variation to the environment: Critical issues with community-weighted mean correlation resolved by the fourth-corner approach. Ecography 40 (7), 806–816.
Pistón, N., de Bello, F., Dias, A. T., Götzenberger, L., Rosado, B. H., de Mattos, E. A., and Carmona, C. P. (2019). Multidimensional ecological analyses demonstrate how interactions between functional traits shape fitness and life history strategies. J. Ecol. 107 (5), 2317–2328.
Rossaro, B. (1982). Chironomidi, 2 (Diptera chironomidae: Orthocladiinae). Rome, Italy: Consiglio Nazionale delle Ricerche.
Rubel, F., Brugger, K., Haslinger, K., and Auer, I. (2017). The climate of the European Alps: Shift of very high resolution Köppen-Geiger climate zones 1800-2100. Meteorol. Z. 26 (2), 115–125. doi:10.1127/metz/2016/0816
Schmedtje, U., and Colling, M. (1996). Ökologische Typisierung der aquatischen Makrofauna. Wien: Bayerisches Landesamt für Wasserwirtschaft.
Schmidt-Kloiber, A., and Hering, D. (2015). www.freshwaterecology.info - an online tool that unifies, standardises and codifies more than 20,000 European freshwater organisms and their ecological preferences. Ecol. Indic. 53, 271–282. doi:10.1016/j.ecolind.2015.02.007
Schülting, L., Feld, C. K., and Graf, W. (2016). Effects of hydro-and thermopeaking on benthic macroinvertebrate drift. Sci. total Environ. 573, 1472–1480.
Scotti, A., and Bottarin, R. (2021). Fine-scale multiannual survey of benthic invertebrates in a glacier-fed stream used for hydropower generation. Sci. Data 8 (1), 105–106. doi:10.1038/s41597-021-00887-x
Scotti, A., Füreder, L., Marsoner, T., Tappeiner, U., Stawinoga, A. E., and Bottarin, R. (2020). Effects of land cover type on community structure and functional traits of alpine stream benthic macroinvertebrates. Freshw. Biol. 65 (3), 524–539. doi:10.1111/fwb.13448
Scotti, A., Jacobsen, D., Ĩtefan, V., Tappeiner, U., and Bottarin, R. (2022). Small hydropower—small ecological footprint? A multi-annual environmental impact analysis using aquatic macroinvertebrates as bioindicators. Part 1: Effects on community structure. Front. Environ. Sci. 10, 902603. doi:10.3389/fenvs.2022.902603
Scotti, A., Jacobsen, D., Tappeiner, U., and Bottarin, R. (2019). Spatial and temporal variation of benthic macroinvertebrate assemblages during the glacial melt season in an Italian glacier-fed stream. Hydrobiologia 827 (1), 123–139. doi:10.1007/s10750-018-3731-8
Siefert, A., Violle, C., Chalmandrier, L., Albert, C. H., Taudiere, A., Fajardo, A., et al. (2015). A global meta-analysis of the relative extent of intraspecific trait variation in plant communities. Ecol. Lett. 18 (12), 1406–1419. doi:10.1111/ele.12508
Statzner, B., and Bêche, L. A. (2010). Can biological invertebrate traits resolve effects of multiple stressors on running water ecosystems? Freshw. Biol. 55, 80–119. doi:10.1111/j.1365-2427.2009.02369.x
Suter, G. W., and Cormier, S. M. (2015). Why care about aquatic insects: Uses, benefits, and services. Integr. Environ. Assess. Manag. 11 (2), 188–194. doi:10.1002/ieam.1600
Tachet, H., Richoux, P., Bournaud, M., and Usseglio-Polatera, P. (2010). Invertébrés d'Eau douce: Systématique, biologie, écologie (vol. 15). Paris: CNRS éditions.
Venus, T. E., Hinzmann, M., Bakken, T. H., Gerdes, H., Godinho, F. N., Hansen, B., Pinheiro, A., and Sauer, J. (2020). The public's perception of run-of-the-river hydropower across Europe. Energy Policy 140, 111422. doi:10.1016/j.enpol.2020.111422
Villéger, S., Brosse, S., Mouchet, M., Mouillot, D., and Vanni, M. J. (2017). Functional ecology of fish: Current approaches and future challenges. Aquat. Sci. 79 (4), 783–801.
Villéger, S., Mason, N. W., and Mouillot, D. (2008). New multidimensional functional diversity indices for a multifaceted framework in functional ecology. Ecology 89 (8), 2290–2301.
Vitousek, P. M., Mooney, H. A., Lubchenco, J., and Melillo, J. M. (1997). Human domination of Earth's ecosystems. Science 277 (5325), 494–499. doi:10.1126/science.277.5325.494
Wallace, J. B., and Webster, J. R. (1996). The role of macroinvertebrates in stream ecosystem function. Annu. Rev. Entomol. 41 (1), 115–139. doi:10.1146/annurev.en.41.010196.000555
Wang, H., Chen, Y., Liu, Z., and Zhu, D. (2016). Effects of the "run-of-river" hydro scheme on macroinvertebrate communities and habitat conditions in a mountain river of northeastern China. Water 8 (1), 31. doi:10.3390/w8010031
WWF (2021). The potential of barrier removal to reconnect europe’s rivers. Available at: https://wwfint.awsassets.panda.org/downloads/wwf_potential_of_barrier_removal_report_under_embargo_until_19_04_1.pdf (Accessed 02 25, 2022).
Zappa, W., Junginger, M., and Van Den Broek, M. (2019). Is a 100% renewable European power system feasible by 2050? Appl. Energy 233, 1027–1050.
Keywords: CWM, functional space, glacier-fed stream, run-of-river (RoR) hydropower plant, small hydropower (SHP), energy policies, green energies
Citation: Scotti A, Jacobsen D and Bottarin R (2022) Small hydropower—Small ecological footprint? A multi-annual environmental impact analysis using aquatic macroinvertebrates as bioindicators. Part 2: Effects on functional diversity. Front. Environ. Sci. 10:904547. doi: 10.3389/fenvs.2022.904547
Received: 25 March 2022; Accepted: 27 June 2022;
Published: 22 July 2022.
Edited by:
Alberto Doretto, Università del Piemonte Orientale, ItalyCopyright © 2022 Scotti, Jacobsen and Bottarin. This is an open-access article distributed under the terms of the Creative Commons Attribution License (CC BY). The use, distribution or reproduction in other forums is permitted, provided the original author(s) and the copyright owner(s) are credited and that the original publication in this journal is cited, in accordance with accepted academic practice. No use, distribution or reproduction is permitted which does not comply with these terms.
*Correspondence: Alberto Scotti, alberto.scotti@eurac.edu