Missing Data in Sea Turtle Population Monitoring: A Bayesian Statistical Framework Accounting for Incomplete Sampling
 Lucy C. M. Omeyer1
  Trevelyan J. McKinley2*
  Nathalie Bréheret3 Gaëlle Bal3
  George Petchell Balchin4 Abdon Bitsindou5 Eva Chauvet3
  Tim Collins6 Bryan K. Curran5,7 Angela Formia8
  Alexandre Girard9,10
  Marc Girondot10
  Brendan J. Godley1 Jean-Gabriel Mavoungou3 Laurène Poli3 Dominic Tilley1 Hilde VanLeeuwe5
  Kristian Metcalfe1*
- 1Centre for Ecology and Conservation, College of Life and Environmental Sciences, University of Exeter, Penryn, United Kingdom
- 2College of Medicine and Health, University of Exeter, Exeter, United Kingdom
- 3Association Renatura Congo, Ecocentre, Pointe Noire, Republic of Congo
- 4Department of Evolution, Behaviour and Environment, School of Life Sciences, University of Sussex, Brighton, United Kingdom
- 5Congo Program, Wildlife Conservation Society (WCS), Brazzaville, Republic of Congo
- 6Marine Program, Wildlife Conservation Society (WCS), Bronx, NY, United States
- 7Rainforest Trust, Warrenton, VA, United States
- 8Gulf of Guinea Sea Turtle Program, Wildlife Conservation Society, Libreville, Gabon
- 9Central African Sea Turtle Conservation Network, Rastoma, Paris, France
- 10Laboratoire Ecologie, Systématique et Evolution, Equipe de Processus Ecologiques et Pressions Anthropiques, UMR 8079 Centre National de la Recherche Scientifique (CNRS), AgroParisTech et Université Paris-Saclay, Orsay Cedex, France
Monitoring how populations respond to sustained conservation measures is essential to detect changes in their population status and determine the effectiveness of any interventions. In the case of sea turtles, their populations are difficult to assess because of their complicated life histories. Ground-derived clutch counts are most often used as an index of population size for sea turtles; however, data are often incomplete with varying sampling intensity within and among sites and seasons. To address these issues, we: (1) develop a Bayesian statistical modelling framework that can be used to account for sampling uncertainties in a robust probabilistic manner within a given site and season; and (2) apply this to a previously unpublished long-term sea turtle dataset (n = 17 years) collated for the Republic of the Congo, which hosts two sympatrically nesting species of sea turtle (leatherback turtle [Dermochelys coriacea] and olive ridley turtle [Lepidochelys olivacea]). The results of this analysis suggest that leatherback turtle nesting levels dropped initially and then settled into quasi-cyclical levels of interannual variability, with an average of 573 (mean, 95% prediction interval: 554–626) clutches laid annually between 2012 and 2017. In contrast, nesting abundance for olive ridley turtles has increased more recently, with an average of 1,087 (mean, 95% prediction interval: 1,057–1,153) clutches laid annually between 2012 and 2017. These findings highlight the regional and global importance of this rookery with the Republic of the Congo, hosting the second largest documented populations of olive ridley and the third largest for leatherback turtles in Central Africa; and the fourth largest non-arribada olive ridley rookery globally. Furthermore, whilst the results show that Congo’s single marine and coastal national park provides protection for over half of sea turtle clutches laid in the country, there is scope for further protection along the coast. Although large parts of the African coastline remain to be adequately monitored, the modelling approach used here will be invaluable to inform future status assessments for sea turtles given that most datasets are temporally and spatially fragmented.
1 Introduction
Status assessments are fundamental to species conservation, since they provide a holistic overview of population trends and threats that can be used to drive changes in national and regional policy, and facilitate targeted management decisions (Magera et al., 2013; Mazaris et al., 2017; Valdivia et al., 2018). Globally, all seven species of sea turtle are threatened and face a wide variety of threats throughout their range and lifecycle, and so are subject to various conservation measures, such as protection of females and eggs at nesting beaches, and at foraging grounds where individuals congregate (Hamann et al., 2010; Rees et al., 2016). For such long-lived, wide-ranging, migratory species, understanding how sea turtles respond to these relatively simple but sustained conservation measures necessitates monitoring to detect changes in their status (Nichols and Williams, 2006; Mazaris et al., 2017).
For sea turtles, the most common method used to derive population estimates is ground-derived counts of the number of clutches laid in a particular season (Witherington et al., 2009; Stewart et al., 2011; Stokes et al., 2014). While used as an index of population size (Gerrodette and Taylor, 1999), nesting trends do not mirror population trends due to variability in demographic parameters and environmental factors. For instance, due to the energetic costs associated with migration and reproduction, resource availability at distant foraging grounds can lead to variability in re-migration interval (i.e. the number of years between breeding seasons) and clutch frequency (i.e. the number of clutches laid during a nesting season) (Frazer and Richardson, 1985; Broderick et al., 2001; Solow et al., 2002; Limpus et al., 2003; Rivalan et al., 2005; Saba et al., 2007). This intrinsic variability means that long-term monitoring is essential to obtain robust estimates, and decades are often needed to detect underlying population trends (Broderick et al., 2003; Heppell et al., 2003; Jackson et al., 2008; Sims et al., 2008; IUCN, 2018), which can be used to inform the International Union for Conservation of Nature (IUCN) Red List and regional species status assessments (Seminoff and Shanker, 2008; Wallace et al., 2010; Wallace et al., 2011).
Obtaining complete nesting censuses for sea turtles is often challenging, resulting in spatial and temporal variation in monitoring efforts, which can hinder effective status assessments (Nichols and Williams, 2006; Jackson et al., 2008; Sims et al., 2008; Piacenza et al., 2019; Whiting et al., 2020). The observed variability in monitoring efficacy is most commonly due to the availability of sustained funding, as well as the logistical and financial constraints associated with undertaking comprehensive censuses over many months (Miller, 1997), at monitoring sites that are often located in remote and inaccessible areas. In addition, in cases where data do exist, it may not be publicly available or accessible, due to a lack of technical expertise, or the capacity to support analyses that account for the variable quality of data collected, as well as perceived concerns about how the data will be used or shared (Hays and Hawkes, 2018; Wildermann et al., 2018). Despite being well studied, spatial variability in the global distribution of sea turtle populations results in substantial variation in the availability, quality, and duration of monitoring data (Seminoff and Shanker, 2008). Research over the last few decades has revealed that the Atlantic coast of Africa is a globally important region for sea turtles (Fretey, 2001; Formia et al., 2003), hosting several major nesting aggregations of leatherback (Dermochelys coriacea; Witt et al., 2009), olive ridley (Lepidochelys olivacea; Metcalfe et al., 2015), and green turtles (Chelonia mydas; Honarvar et al., 2016; Patrício et al., 2017). Despite this awareness, the status of documented rookeries across this region (with the exception of Guinea Bissau and Príncipe) remain classified as ‘Data Deficient’ (Broderick and Patrício, 2019) because a minimum of 10 years of data are necessary to accurately estimate population trends for assessment (Piacenza et al., 2019).
Such a case is typified in the Republic of the Congo, where the status of nesting sea turtles have until now been based on the analysis of spatially and temporally fragmented data (Godgenger et al., 2009; Girard et al., 2016), despite nearly two decades of monitoring efforts along the entire coast of the country. Here, we aim to address this knowledge gap and support regional efforts to protect sea turtles, by providing the first long-term (> 10 years) assessment of leatherback and olive ridley turtle nesting trends for a major rookery in Central Africa. Our specific aims were to: (1) collate and digitise all available historical nesting data from the multiple organisations involved in sea turtle monitoring, (2) use these data to derive estimates of nesting effort for the Congolese rookeries over time, which in turn requires robust estimates of the number of clutches laid each year, and (3) understand how well extant protected areas encompass nesting effort. To account for variation in monitoring effort across different nesting sites both within and among years, we developed a Bayesian statistical modelling framework that enabled us to account for these uncertainties in a robust probabilistic manner within each site and season.
2 Materials and Methods
2.1 Study Area and Policy Context
The Republic of the Congo is located on the Atlantic coast of Central Africa and situated in the highly dynamic transition zone between the Guinea Current and Benguela Current. This is a globally significant marine region characterised by intense seasonal upwelling of cold-water nutrients, resulting in some of the most productive coastal and offshore waters (net primary productivity > 300 gCM-2y-1) in the world (Sherman and Hempel, 2008). Consequently, this region is a biodiversity hotspot (Polidoro et al., 2017) hosting globally important populations of marine vertebrates (Wallace et al., 2010; Wallace et al., 2011), with the Republic of the Congo supporting important nesting beaches for populations of olive ridley and leatherback turtles, as well as important foraging grounds for juvenile green and hawksbill turtles (Godgenger et al., 2009; Metcalfe et al., 2020). In 2011, long-term data gathered by Wildlife Conservation Society (WCS) and Renatura Congo, in partnership with the Ministère de l’Économie Forestière, resulted in all sea turtle species being classified as highly protected (Arrêté n° 6075 du 9 avril 2011 déterminant les espèces animales intégralement et partiellement protégées).
2.2 Nesting Beach Monitoring Data
To investigate annual trends in nesting effort for olive ridley and leatherback turtles, we used daily ground counts of clutches recorded from 17 nesting beaches (hereafter referred to as ‘sites’; Figure 1), situated along the coast of the Republic of the Congo, from the border with Gabon in the north to Cabinda in the south, across 17 nesting seasons (2000/2001 – 2016/2017). The nesting season in this region typically starts between September and October, and ends in March or April of the following year (Godgenger et al., 2009; Witt et al., 2009; Metcalfe et al., 2015). During each nesting season, patrols were conducted at dawn to record the previous night’s nesting activity, with two field assistants surveying the entire nesting beach. At least two people were engaged in each patrol to ensure that the total width of beach available for nesting was surveyed for signs of visible activity – with one field assistant walking along the vegetation line and the other along the high tide line. During these patrols, nesting activities were identified to species (where possible), marked with wooden stakes, and their position recorded using either triangulation from marker posts, or in more recent years a global positioning system (GPS) hand-held receiver.
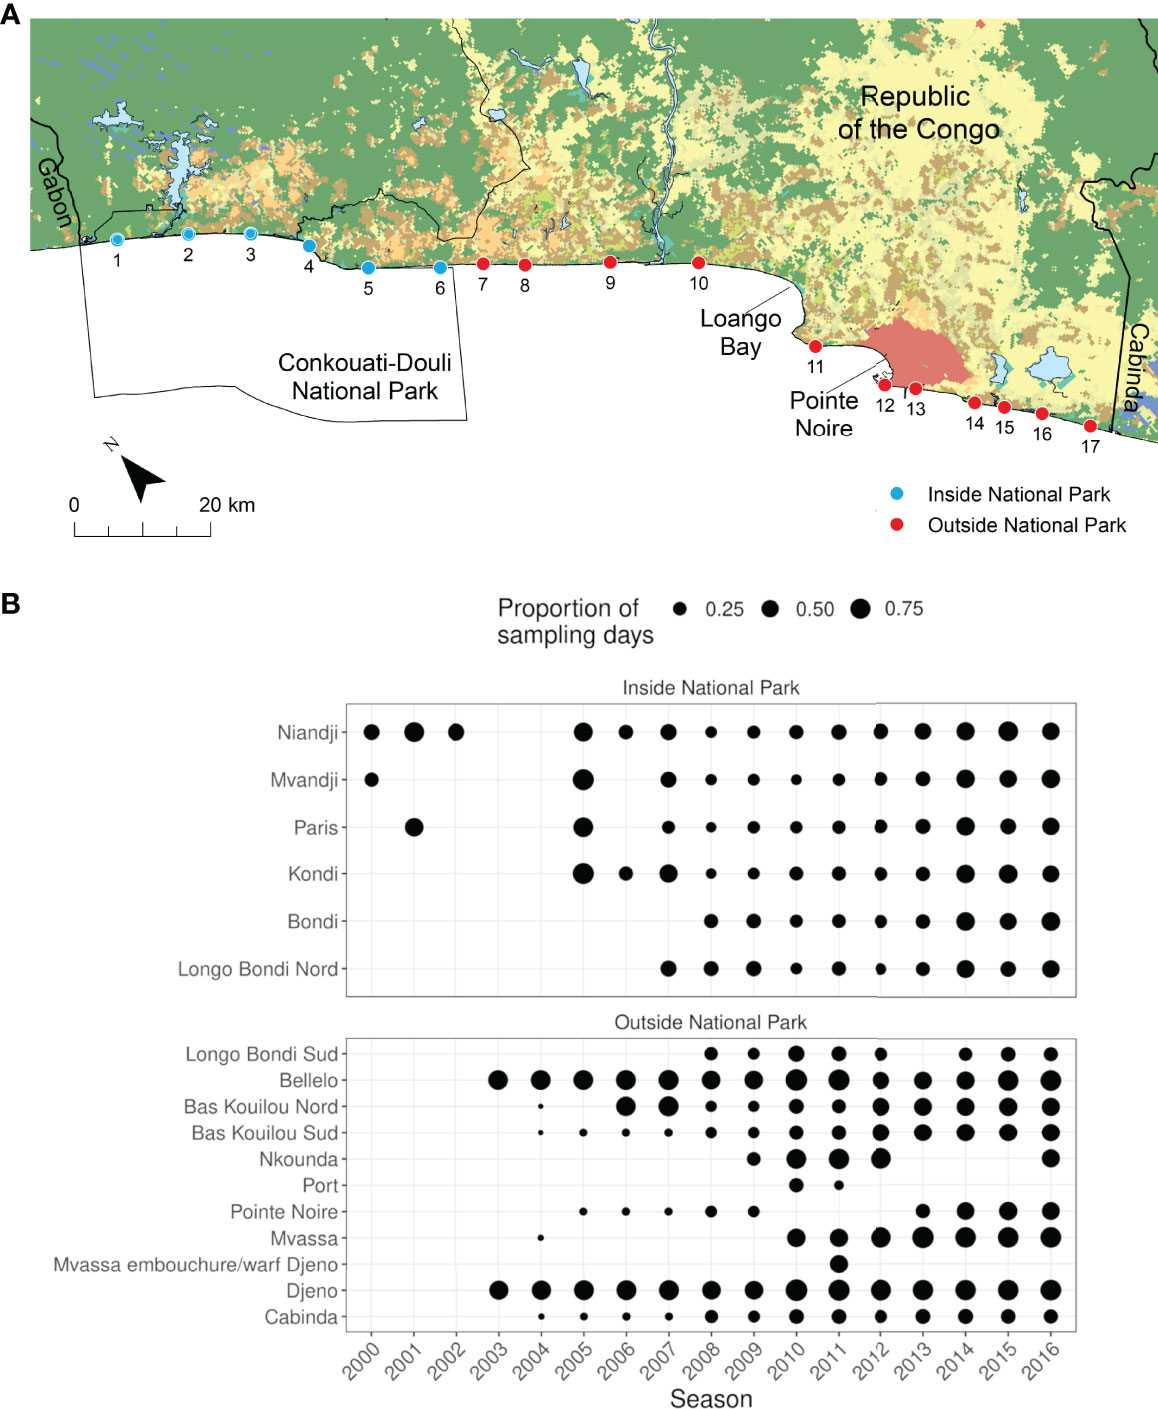
Figure 1 Location of the 17 nesting beaches monitored across 17 nesting seasons between 2000/2001 and 2016/2017 (A) and sampling effort at those sites shown as the proportion of sampling days in the season (241 days between September and April) that each site was surveyed (B). Beach names: 1. Niandji, 2. Mvandji, 3. Paris, 4. Kondi, 5. Bondi, 6. Longo Bondi Nord, 7. Longo Bondi Sud, 8. Bellelo, 9. Bas Kouilou Nord, 10. Bas Kouilou Sud, 11. Nkounda, 12. Port, 13. Pointe Noire, 14. Mvassa, 15. Mvassa embouchure/warf Djeno, 16. Djeno, and 17. Cabinda. (see Figure S1 for further detailed information in variability in monitoring effort over time at each site). Habitat data (terrestrial shading) derived from Global Land Cover (https://land.copernicus.eu/global/products/lc).
In the last decade, several organisations have been involved in monitoring sea turtles in the Republic of the Congo. These include the Ministère de l’Economie Forestière (MEF) and the Wildlife Conservation Society (WCS) for sites inside Conkouati-Douli National Park, and Renatura Congo for all other sites outside of the national park (Figure 1). Logistical constraints have meant that the monitoring regime has varied within and among nesting seasons, leading to inconsistencies in monitoring effort across years (Figures 1; S1). For instance, the start and end dates of monitoring have differed across sites and seasons, particularly for olive ridley turtles, where there is often partial coverage of the beginning of the nesting season in the region (Metcalfe et al., 2015). In addition, to maximise coverage and limited resources outside of the Republic of the Congo’s only marine and coastal protected area (Conkouati-Douli National Park; Figure 1), the number of sites monitored and effort at those sites have varied across nesting seasons (Godgenger et al., 2009). While some sites were subject to daily monitoring throughout the season, others were monitored periodically or weekly (Figures 1; S1). The total number of clutches encountered during these censuses is therefore likely to represent an underestimate of actual nesting effort, particularly for olive ridley turtles as explained above.
2.3 Modelling Seasonal Nesting Effort
In order to facilitate comparisons across years, it was necessary to infer seasonal nesting effort for each species (i.e., the total number of clutches laid at each site each nesting season) from partially observed counts (as these are the only data available to assess population size and trends at these sites). Several mathematical and statistical models have previously been published to describe the seasonal shape of nesting, using both incomplete and complete monitoring data (Godley et al., 2001; Troëng et al., 2004; Girondot et al., 2006; Gratiot et al., 2006; Godgenger et al., 2009; Witt et al., 2009; Girondot, 2010; Metcalfe et al., 2015), with advantages and disadvantages associated with different methods (Whiting et al., 2014). We decided to adopt a Bayesian approach to model fitting here, since this provides a powerful way to handle missing data, aggregate predictions across multiple sites and seasons, and propagate all associated uncertainties appropriately. In addition, posterior inference is not constrained by having to use asymptotic central limit theorem approximations. We describe the specific model form in more detail below.
2.3.1 Nesting Season Model
In the context of this study, we chose to model each season at each site for each species independently, where the observed clutch counts at each day are assumed to arise from a negative binomial distribution, with a non-linear mean function that changes over time. Prior to using a negative binomial distribution, we explored the use of a Poisson model, which resulted in overdispersion that was better dealt with using the negative binomial.
The model is constructed as follows: for species s at site b in season u on day t, we observed Ysbut clutches. Since we fitted separate models to each species/site/season combination, in the description below, we drop the subscripts for brevity. We modelled the observed number of new clutches in a time period (t – 1,t), for a single species at a specific site in a given season as:
where μ(t - 1):t is the mean number of clutches in the given time period, and ϕ is a size parameter. Hence if Y ~ NB(µ, ϕ), then
Hence, we assumed that the observation processes at different days are independent given the mean. The mean function captures the average number of new clutches at time t and is given by:
and depends on parameters α > 0 (controlling the magnitude; the average number of new clutches around the peak),tp (controlling the date of the peak nesting effort), tf defining a region of constant nesting effort around the peak, and s1,s2 > 0 (controlling the rates of increase and decrease of the nesting effort around the peak; larger values corresponding to the nesting effort having slower rates of increase and decrease respectively). This is similar to the approach developed in Girondot (2017) and Laloë et al. (2020) except that we always forced the mean to decline towards zero in the tails of the nesting season, which is a general pattern observed across most sea turtle species (Miller, 1997), as well as at the sites and seasons under study (Godgenger et al., 2009). In contrast, the approaches developed in Girondot (2017) and Laloë et al. (2020) have a constant mean nesting effort outside of the nesting season, which can be exactly zero if required.
As stated earlier, nesting beaches were not always surveyed every day, and since care was taken to mark clutches that had already been counted, we assumed that the probability that clutches were missed on the day of the survey (or counted multiple times on different days) was negligible. Therefore, we assumed that all clutches observed on day t correspond to the cumulative number of clutches that arose in the period between the last survey date and time t. Hence, if the last survey date was at time t - k and the current time is t, then the number of new clutches in the period (t – k,t] is a sum of independent negative binomial random variables with varying means, which has a non-standard, but tractable probability mass function (Furman, 2007; Girondot, 2017).
However, as there are other factors that may impact the probability of a clutch being observed, such as daily tidal patterns, wave activity, and exposure to wind and rain (Metcalfe et al., 2015), we placed an upper bound of k = 7 days over which to sum. We chose this upper bound following work conducted in Gabon, where the authors observed that clutches were generally easy to locate from markings in the sand up until that point. Therefore, if the time period between surveying was greater than this, we assumed that all clutches present before t - 7 were lost before the survey day at time t.
To complete the Bayesian specification, we need to specify suitable prior distributions. Since we had a large number (338) of datasets to fit to, each with varying degrees of information and surveillance coverage, we decided to use a flexible hierarchical prior structure that allows for a wide range of different shaped mean functions, but simplifies to a more parsimonious form in the absence of strong information to the contrary. This is an alternative to classical approaches, which fit a range of different model structures and choose between them using a model choice criterion that penalises for model complexity, such as AIC. As such, we specified (hierarchical) prior distributions as:
with hyperparameters:
Here, Exp(v) denotes an exponential random variable with rate v; N(μ, σ2) denotes a normal distribution with mean μ and variance σ2; U(a, b) is a uniform distribution with bounds a and b; InvG(θ, k) is an inverse-gamma distribution with shape parameter θ and rate parameter k; and T(distribution, L, U) denotes a truncated distribution between L and U. We re-scaled time t, such that t = 0 corresponded to September 1st in any given year, and hence these prior choices mean that, in the absence of data, the functional form becomes symmetrical around the peak, and the peak sits around t = 120 days, which is our prior estimate for the middle of the nesting season for these rookeries1. If we had site-specific prior information for all sites, then it would have been possible to develop more informative prior distributions for these parameters, as per Girondot and Rizzo (2015). However, since we had a very large number of sites without access to the detailed traditional ecological knowledge sources required, we instead used the flexible structural prior approach described here.
The prior predictive distribution encompassed a wide range of potential functional forms, although in the absence of data resulted in 95% prior predictive bounds of between 0 and approx. 80 clutches at the end of a season, with a prior predictive mean of around 10 clutches. These prior choices reflect our belief that sites where there are few data points are likely to correspond to sites where there is a strong a priori belief that there are likely to be low numbers of clutches, since higher surveillance efforts are necessarily focused on larger rookeries. For sites where the sampling effort was higher, then these prior choices applied very weak shrinkage effects, but allowed for a wide range of potential outcomes, as highlighted by the fitted plots in Figure S2, which show good fits. We also performed a sensitivity analysis where the prior predictive distribution allowed for a higher range of outcomes in the absence of data and discuss the impacts of this in more detail in the discussion.
We did not find it necessary to explicitly bound tp, since the hierarchical model and shrinkage prior on σtp allowed the peak of the nesting season to vary in different datasets, but kept it constrained within biologically plausible time periods. We truncated the size parameter of the negative binomial error to be less than 50, enforcing mild prior overdispersion relative to a more informative Poisson assumption.
2.3.2 Model Fit and Evaluation
We fitted a total of 338 models using Markov chain Monte Carlo (MCMC), implemented in the NIMBLE package (de Valpine et al., 2017) in R (R Core Team, 2021). We used two MCMC chains for each model, with 40,000 iterations for each chain, and discarded the first 10,000 iterations as burn-in. We ran models in parallel on a 12-core MacBook Pro. Convergence was assessed visually from the MCMC trace plots, as well as by using the multivariate extension of the Gelman-Rubin diagnostic (Gelman and Rubin, 1992; Brooks and Gelman, 1998). All models returned multivariate diagnostics of < 1.03 (2 significant figures) with an upper quartile of 1.007. Full model fits for each of the 338 models are provided in Figure S2. Trace plots are available for one worked example in Supplementary Methods S1. Full trace plots for the remaining model fits are available on request.
Once each of the models were fitted, we derived full posterior distributions for the parameters, the mean number of new clutches over time, and the predicted number of clutches at any given time (Supplementary Methods S1). We also generated plots of the cumulative number of clutches over a season, with associated prediction intervals (PI; Supplementary Methods S1). The latter corresponds to what we would expect to see under the same conditions if the surveys were to be run again, and hence these are useful plots to assess the model fit, and to ascertain whether the models are fit for purpose. These plots revealed that the default model worked well for almost all cases. There are a few datasets which suggest possibly more than one peak to the nesting effort. It would have been possible to develop a model to capture these multiple peaks, but the predictive bounds encompassed the observations sufficiently well in all cases except perhaps for leatherback turtles at Niandji (2001–2002). For the latter site, the surveillance coverage was sufficiently good that once we conditioned the predictions on the observed data (see section 2.3.3), there would have been negligible benefit from developing a new model. All final fitted model plots are shown in Figure S2 (columns one and two).
2.3.3 Annual Trends in Nesting Effort
To illustrate overall trends in nesting effort, we extracted the posterior predictive mean estimates for the total number of clutches in each site/season/species combination, through which we fitted loess-smoothed trend lines (Figures 2; S3). Since we assume that we observed all clutches within up to a 7-day prior window of each observation point, we use the models to predict in time intervals that were outside of these windows only, thereby ensuring that the predicted number of clutches was at least as large as the observed number of clutches (Figure S2; column three).
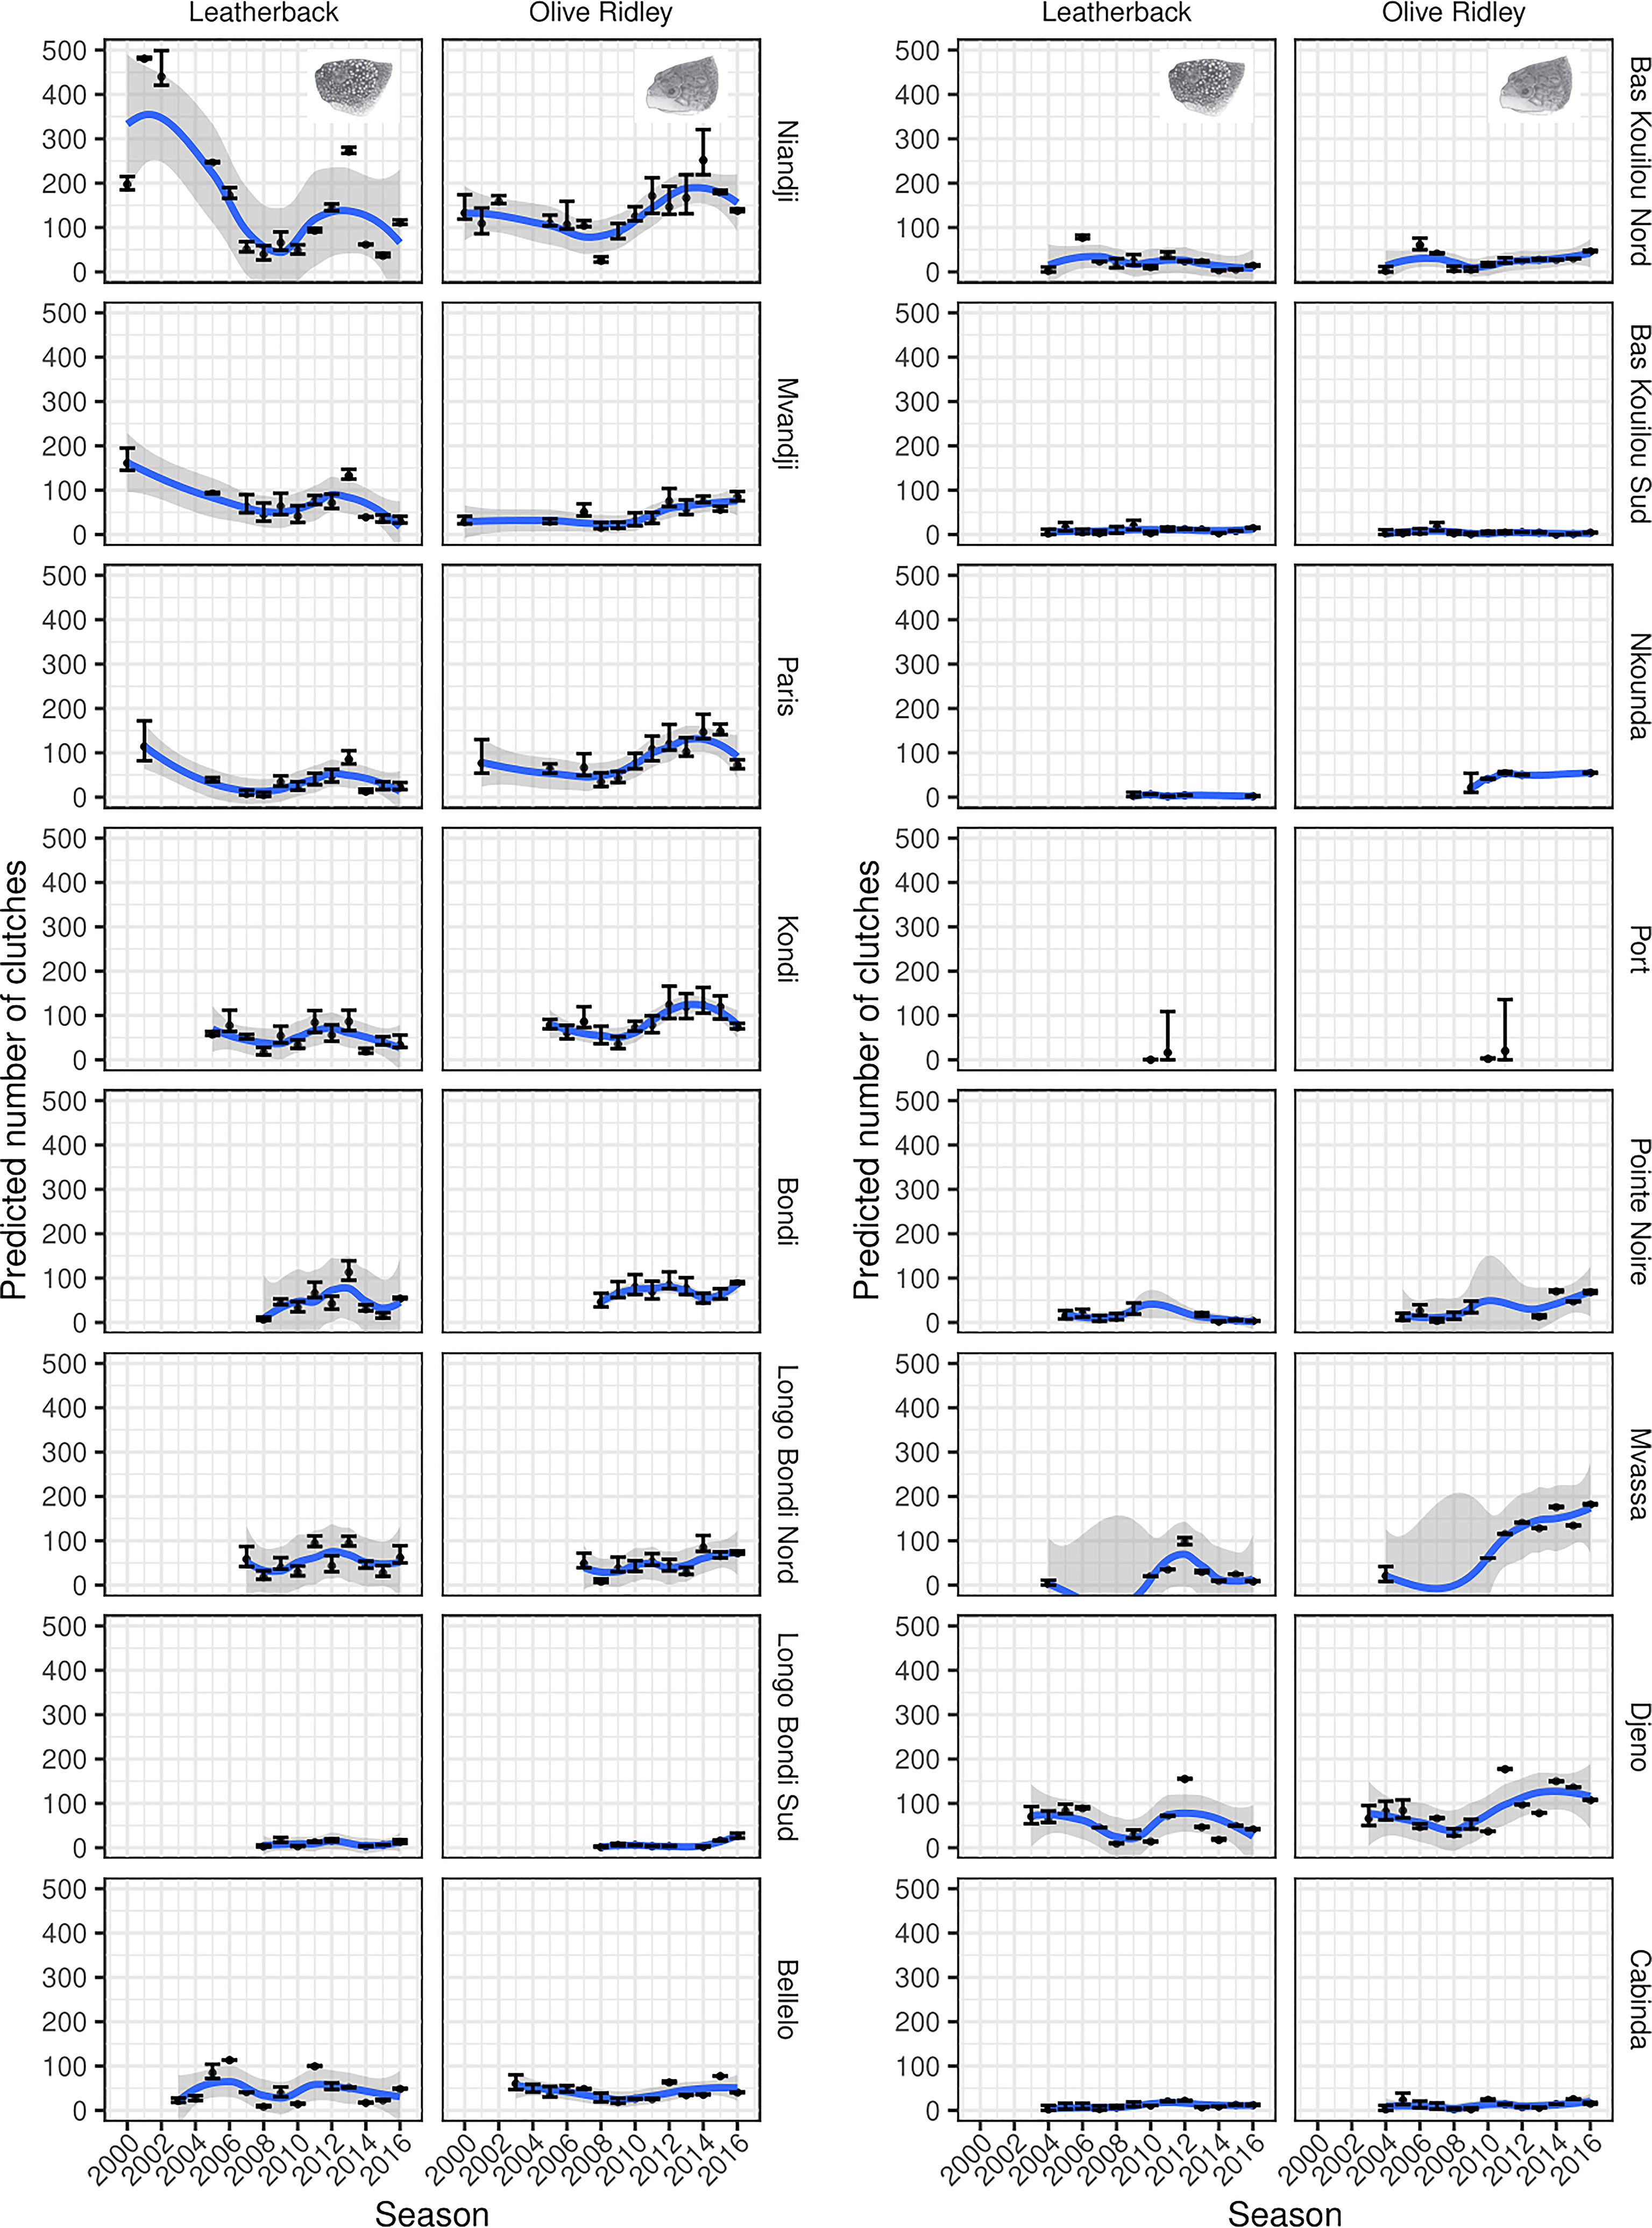
Figure 2 Total predicted number of clutches in each site/season/species combination. Points correspond to posterior predictive means and error bars to 95% prediction intervals. The trend lines correspond to loess-smoothed fits through the posterior predictive means, with the grey ribbons depicting the 95% confidence intervals for the smoothed fits. This plot corresponds to Figure S3 in the supplemental material which shows the results of a sensitivity analysis where we used a less informative range on the peak nesting effort to determine the impact of our prior choices.
Since we had full posterior distributions for the total nesting effort for each site/season/species combination, we could also aggregate estimates across all sites within each year to produce posterior distributions for the aggregated nesting effort in each season for each species. However, since not all sites were monitored each year (particularly prior to 2010/2011; Figures 1; S1), it was necessary to estimate the likely nesting effort for the missing sites/seasons in order to explore aggregated trends over time. For each site, we calculated a posterior predictive distribution for the median nesting effort across all years where data were available. We then sampled the number of nests in missing seasons from this distribution. The aggregated trends are shown in Figure 2. We removed a single site when deriving the aggregated plots (Mvassa embouchure/warf Djeno) as it was only surveyed for a single season (Figures 1; S1), and thus, the estimated values would potentially be highly misleading. We note that this approach will likely underestimate the posterior variability relating to the missing sites, but for the purposes of visualising the trends, this was a reasonable approximation, as long as the proportion of the total clutches arising from these imputations were small at a given year. As such, in the aggregated plots, we remove seasons with a posterior mean of > 30% of the total clutches being estimated.
As sea turtle nesting data tend to be temporally fragmented, the IUCN Marine Turtle Specialist Group (MTSG) compares changes between oldest and most recent 3- to 5-year averages, which are calculated from absolute count data. In this instance, as we aim to filling the gaps in monitoring effort, we calculated the percentage change from the posterior predictive distributions for the aggregated nesting effort to ensure our findings are comparable with those reported by the IUCN MTSG.
Data visualisation and analyses were performed using the statistical language R (R Core Team, 2021) using the NIMBLE (de Valpine et al., 2017), tidyverse (Wickham et al., 2019), patchwork (Pedersen, 2020), magrittr (Bache and Wickham, 2014), ggbeeswarm (Clarke and Sherrill-Mix, 2017), ggrepel (Slowikowski et al., 2021), and coda (Plummer et al., 2006) packages. The convolution of negative binomials probability mass function was implemented in NIMBLE by adapting code from the HelpersMG package (under the GPL-2 licence, Girondot, 2021). Supplemental Material was generated using rmarkdown (Allaire et al., 2020), bookdown (Xie, 2020a), and knitr (Xie, 2020b).
3 Results
3.1 Monitoring Effort
Throughout the study period no site was consistently monitored, with monitoring efforts ranging between 1 and 15 nesting seasons among sites. On average, sites inside the national park have been monitored for longer (mean = 12, SD = 2.1, range: 9–15 years) compared to those outside (mean = 9, SD = 4.7, range: 1–14; Figures 1, S1). The number of sampling days varied both within and among years and sites (range: 5–219). Bellelo and Djeno (located outside the national park) were the most consistently monitored sites and were sampled for a total of 2,356 and 2,530 days, respectively, across 14 of the 17 nesting seasons, resulting in an average of 168 (SD = 28, range: 124–215) and 181 (SD = 21, 147–219) sampling days each nesting season.
3.2 Nesting Trends
The patterns suggest that the total nesting effort across all sites for leatherback turtles initially declines, before settling into a cyclical pattern of interannual variability—certainly in the seasons where low levels of imputation were required (Figures 3; S4). The initial decline seems to be consistent across the three sites inside the national park that were sampled in the early seasons (Figures 2; S3). Nesting effort for the olive ridley turtle is harder to diagnose early on, because there were very few sites sampled. However, the individual site trajectories show either fairly stable estimates, or slight increases over time (Figures 2; S3). For more recent seasons with better sampling coverage, these aggregate to a more prominent increase from 2009/2010 onwards (Figures 3; S4).
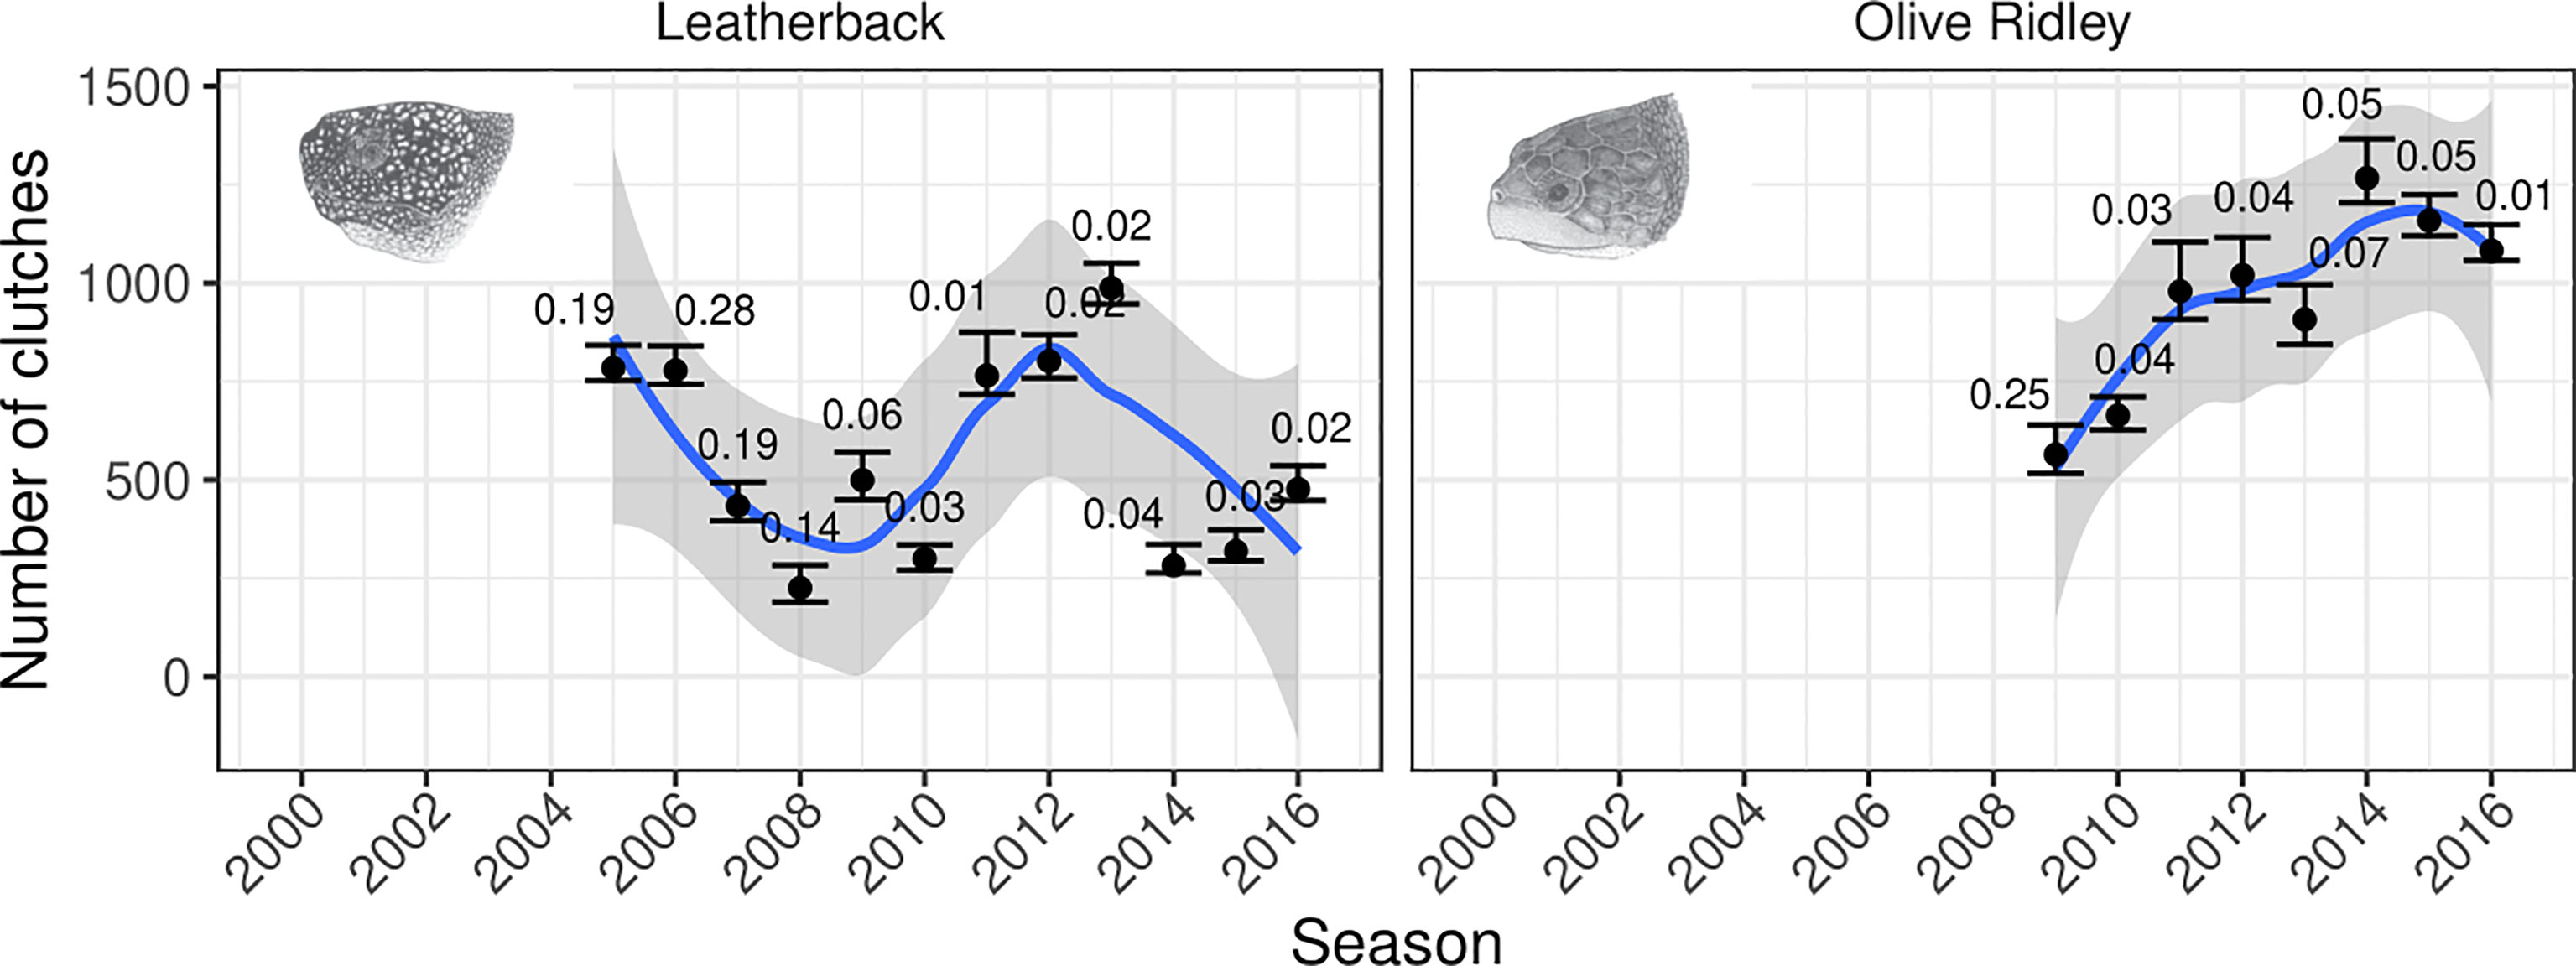
Figure 3 Predictions for the number of clutches for leatherback and olive ridley turtles each season between 2000/2001 and 2016/2017. The points correspond to the posterior predictive mean estimates for the total number of clutches in that season, aggregated across all sites, with the error bars corresponding to the 95% prediction intervals. The number above the error bars correspond to the proportion of the clutches estimated in each season. We have removed any season with a posterior mean of > 30% of the total clutches being estimated. The trend lines correspond to loess-smoothed fits through the posterior means, with the grey ribbons depicting the 95% confidence intervals for the smoothed fits. This plot corresponds to Figure S4 in the supplemental material which shows the results of a sensitivity analysis where we used a less informative range on the peak nesting effort to determine the impact of our prior choices.
Applying the IUCN MTSG Red List assessment method to the complete time series, an approach which compares change in clutch counts between the oldest (2000/2001–2004/2005) and most recent (2012/2013–2016/2017) 3 to 5-year averages from count data, would be heavily biased due to large amounts of imputation being required for the early years, and would thus render unreliable estimates. However, estimates based on the most recent 10 years, a period during which monitoring efforts have been higher and so required far less imputations2, indicate positive trends in nesting effort for both species. For instance, olive ridley turtle clutch counts increased by 57% (mean, 95% PI: 50%–63%), from an average of 693 (95% PI: 665–754) clutches per annum between 2007 and 2012, to an average of 1,087 (95% PI: 1,057–1,153) clutches per annum between 2012 and 2017. For the leatherback turtle, clutch counts increased by 29% (mean, 95% PI: 22%–35%) from an average of 445 (95% PI: 422–500) clutches per annum between 2007 and 2012, to an average of 573 (95% PI: 554–626) clutches per annum between 2012 and 2017.
3.3 Protected Area Efficacy
Of the cumulative 17,639 sampling days conducted during the study period, 37% and 63% were allocated to sites inside and outside of the national park, respectively. Based on the full (2000/2001–2016/2017) time series, the results highlight that nesting effort for olive ridley turtles both inside and outside of the national park followed a similar pattern to the national trends, whereby olive ridley nesting effort increases from 2009/2010 onwards (Figure 4); with a fairly even distribution in nesting effort, with the national park hosting on average, 56% (95% PI: 52–57%) of olive ridley turtle clutches over seasons with posterior means of < 30% of the total clutches being estimated.

Figure 4 Predictions for the number of clutches for leatherback and olive ridley turtles each season between 2000/2001 and 2016/2017 outside and inside the national park. For each panel, the points correspond to the posterior predictive mean estimates for the total number of clutches in that season, aggregated across all sites, with the error bars corresponding to the 95% prediction intervals. The number above the error bars correspond to the proportion of the clutches estimated in each season. We have removed any season with a posterior mean of > 30% of the total clutches being estimated. The trend lines correspond to loess-smoothed fits through the posterior means, with the grey ribbons depicting the 95% confidence intervals for the smoothed fits.
On the other hand, whilst leatherback turtles showed similar patterns to the national trend with varying levels of interannual variability both inside and outside of the national park, clutch counts remained relatively stable for sites outside of the national park, while they decreased for sites inside of the national park (Figure 4). It is apparent from Figure 2 that this decline is driven predominantly by the three largest sites that were sampled early on, although it is consistent across those sites. The national park hosts, on average, 63% (95% PI: 57–64%) of leatherback turtle clutches over seasons with posterior means of < 30% of the total clutches being estimated.
Similar trends in the distribution of nesting effort are evident when considering only the most recent 5-year timeseries (2012/2013–2016/2017), with on average 56% (95% PI: 53%–57%, posterior mean maximum proportion estimated across park status: 0.10) and 66% (95% PI: 60%–67%, posterior mean maximum proportion estimated across park status: 0.07) of olive ridley and leatherback turtle clutches laid inside the national park, respectively. This corresponds to posterior mean estimates for the 5-year average annual nesting effort of 606 (95% PI: 583–633) and 376 (95% PI: 363–390) clutches per annum laid inside the national park for olive ridley and leatherback turtles, respectively.
4 Discussion
Status assessments are fundamental to species conservation, however, they are often hindered by a lack of long-term spatial and temporal data (Nichols and Williams, 2006; Jackson et al., 2008; Sims et al., 2008; Piacenza et al., 2019; Whiting et al., 2020). In the case of sea turtles, ground-derived counts of the number of clutches laid in a nesting season are most often used to derive population trends and abundance (Witherington et al., 2009; Stewart et al., 2011; Stokes et al., 2014; Omeyer et al., 2021), although such estimates are prone to variability in sampling effort within and among years and sites. Here, we combine data from several sources to present the first overview of long-term trends in sea turtle nesting effort in the Republic of the Congo using a Bayesian statistical modelling framework that accounts for sampling uncertainties within sites and seasons in a robust probabilistic manner.
4.1 Nesting Trends
The global importance of the Atlantic coast of Africa for sea turtles has been highlighted over the last few decades (Fretey, 2001; Formia et al., 2003), but it remains a data-poor region due to the lack of accessible long-term published quantitative data despite active monitoring in the region for over almost two decades. Consequently, obtaining a better understanding of the spatial ecology of olive ridley and leatherback turtles has become a conservation priority (Formia et al., 2003; Mazaris et al., 2014). With this study, we update the temporally and spatially fragmented data for the Republic of the Congo presented in Godgenger et al. (2009), and highlight the importance of long-term monitoring to obtain a better understanding of interannual variation in clutch counts and explore underlying population trends. Specifically, our results suggest that nesting effort for olive ridley turtles has increased in recent years and mirrors the trend in increased nesting effort observed from 2008/2009 onwards in neighbouring Gabon (Metcalfe et al., 2015). The increase in nesting abundance across both countries is likely to be the result of increased monitoring and protection of females and their eggs at key nesting sites and surrounding coastal waters (Witt et al., 2008; Maxwell et al., 2011; Dawson et al., 2017). For example, the actions of Renatura Congo have reduced illegal take during the nesting season each year to below 5% for eggs and below 1% when considering only nesting females, thanks to beach patrols and environmental education campaigns aimed at both children and adults (Girard and Breheret, 2013). Whilst the findings presented here contrast with those presented in Godgenger et al. (2009), which suggested a downward trend for olive ridley turtles, it should be noted that this previous assessment was based on only 3 sites and 4 years of data, whereas we have looked at many more sites over many more seasons. When aggregated, the model predictions suggest a steady increase in the number of clutches across the entire rookery (Figure 3), at least within those seasons with a high surveillance coverage of sites. Care must be taken here since we needed to estimate unsampled sites within any given season, however, if we look at the site-specific predictions (with no imputation in Figure 2), there is evidence to suggest that most sites either have fairly constant trends or slight increases over time. Together, these results reinforce the importance of sustained monitoring to detect longer-term trends and where possible wider spatial coverage of monitoring efforts.
On the other hand, for leatherback turtles, the underlying trend is more uncertain. High interannual variability in nesting effort is not uncommon for leatherback turtles (e.g. Colman et al., 2019) and is likely to be the result of a range of factors. First, compared to the omnivorous and opportunistic diet of olive ridley turtles (e.g. Colman et al., 2014), which appears to make them more resilient to variation in ocean productivity (Santidrián Tomillo et al., 2020), the life cycle of the leatherback turtle’s gelatinous prey is affected by large-scale climate variability and ocean productivity. This can in turn lead to variation in prey availability, feeding efficiency, and energy assimilation that can influence remigration intervals and therefore, lead to high interannual variability in nesting effort (Broderick et al., 2001; Saba et al., 2007; Santidrián Tomillo et al., 2020). In addition, mean migration distance between foraging and nesting grounds is much greater for leatherback than for olive ridley turtles (Hays and Scott, 2013), leading to greater energetic costs of migration for the former species, likely having knock-on effects on reproductive output for the species. Similar oscillations in nesting effort for the leatherback turtle have been observed at Bioko Island, Equatorial Guinea (Honarvar et al., 2016), suggesting that individuals nesting in this region may experience similar environmental effects at shared foraging grounds. Post-nesting satellite tracking of individuals across the region could help identify these areas and allow for increased protection outside of the nesting season (Witt et al., 2011). For example, while the fine-scale movement of olive ridley and leatherback turtles has been investigated during the inter-nesting season in both Gabon and the Republic of the Congo (Witt et al., 2008; Maxwell et al., 2011; Pikesley et al., 2013; Dawson et al., 2017), leatherback turtles are yet to be tagged in the latter country to investigate their movement both during and after the nesting season.
Second, estimates of nesting effort at various spatial scales are also influenced by variation in nest site fidelity within and among species. While the drivers of nest site selection are not fully understood (Hamann et al., 2010; Rees et al., 2016), leatherback turtles tend to use wider nesting areas than hard-shelled sea turtles. For example, 62% of olive ridley turtles (n = 13) tracked in Gabon nested within 10 km of their previous clutch (Maxwell et al., 2011) and the average distance between nesting events was 4.8 km in Brazil (Matos et al., 2012). In contrast, leatherback turtles have been shown to nest hundreds of kilometres apart within the same nesting season at multiple locations (e.g. Stewart et al., 2014; Horrocks et al., 2016). From available satellite tracking (Witt et al., 2008) and tag return data (unpublished data, Angela Formia), it is clear that leatherback turtles nesting in southern Gabon and the Republic of the Congo exhibit similar behaviour and so likely form part of one extended nesting population, with individuals utilising waters and nesting beaches of both countries within the same season. Therefore, while deriving national abundance estimates and population trends is a good exercise, it would seem more appropriate to do so at a regional scale to account for variation in nest site fidelity; thus, providing more robust estimates for status assessments, particularly when long-term data are not yet publicly available at all sites.
In terms of the importance of this rookery, the collation of historical nesting data has revealed the almost continuous presence of nesting activity along the Republic of the Congo’s coast – from the border with Gabon in the north to Cabinda in the south. Regionally, the results of this study suggest that the Republic of the Congo hosts the second largest documented rookery for olive ridley turtles in Central Africa, second only to Gabon, and the third largest documented rookery for leatherback turtles, third to Gabon and Equatorial Guinea (Table 1). However, it should be noted that large parts of the Atlantic African coastline remain to be adequately surveyed throughout the region (i.e., Cabinda, Democratic Republic of the Congo, and Angola; Table 1), and long-term data for other regions may be available, but have not been assessed to date. At a global scale, the Republic of the Congo likely hosts the fourth largest non-arribada olive ridley documented rookery in the Atlantic, after Gabon (Metcalfe et al., 2015), Brazil (Colman et al., 2020), and French Guiana (Abreu-Grobois and Plotkin, 2008; Plot et al., 2012). Nevertheless, while clutch counts are most often used as a proxy of sea turtle population size, it would be more robust, although logistically challenging, to monitor nesting females to obtain demographic parameters for population modelling (Shamblin et al., 2017; Casale and Ceriani, 2020; Shamblin et al., 2021).
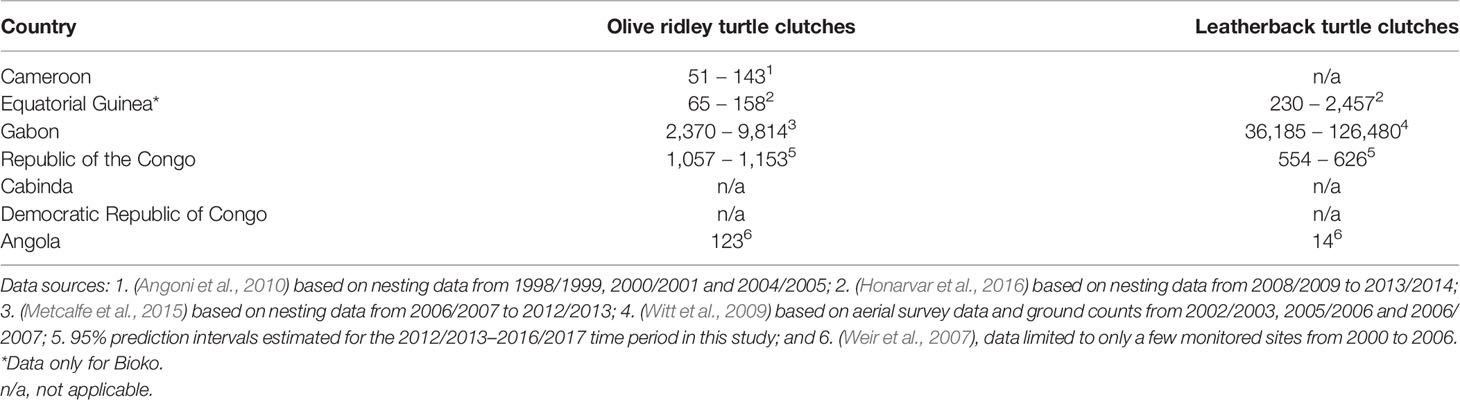
Table 1 Estimated number of olive ridley and leatherback turtle clutches laid annually at nesting beaches along the Atlantic coast of Central Africa.
4.2 Protected Areas
Protecting nesting sea turtle females and their eggs forms part of a suite of conservation measures applied by conservation practitioners to aid population recovery (e.g. Mazaris et al., 2017; Valdivia et al., 2018). The results of this study highlight the key role of Conkouati-Douli National Park, the Republic of the Congo’s only marine and coastal protected area, which, on average, hosts > 50% of annual nesting effort within its boundaries, encompassing 35% of the country’s coastline. The importance of this site could reflect the fact that Conkouati-Douli National Park is situated in an area of relatively low human population density and growth, and so has been exposed to lower levels of direct take, incidental capture at sea, and human disturbance over the last decade compared to those areas outside of the national park. However, the results also suggest that there is scope for further protection outside of the national park. For example, only half of olive ridley clutches are laid in the protected area, compared to approximately two thirds for leatherback turtles. Considering the high nest site fidelity of olive ridley turtles, it is possible that increased protection could be achieved by protecting a few additional sites, as shown for this species in Gabon, where over two thirds of clutches laid outside of protected areas were located along 9% of the surveyed coastline (Metcalfe et al., 2015). While protection is most easily achievable at nesting beaches for sea turtles, there is an urgent need for satellite tracking studies in the region to identify both inter-nesting and foraging areas to extend in-water protection for adults of both species (Pikesley et al., 2013). Nevertheless, because adult females only represent ca. 1% of sea turtle populations (Heppell, 1998; Casale and Heppell, 2016), detecting a signal in recovery within protected areas could take years given age at sexual maturity in sea turtles, and requires the protection of hatchlings and juveniles for population recovery. To this effect, Renatura Congo has been developing a bycatch release programme alongside nesting beach protection, which has contributed to the release of > 18,500 green, hawksbill, leatherbacks, and olive ridley turtles incidentally caught in the small-scale fisheries since 2005 and has allowed the identification of nursery and foraging sites for green and hawksbill turtles in Congolese waters (Girard and Breheret, 2013; Metcalfe et al., 2020). The Congolese government has made significant efforts to expand its existing marine protected area network to encompass critical habitat for sea turtles, with a stakeholder led planning process currently underway (Our Ocean, 2016; Congo Marine, 2018; Metcalfe et al., 2020). Together, these conservation strategies likely play key roles contributing to the observed increase in nesting abundance for olive ridley and leatherback turtles in the Republic of the Congo, and are probably benefitting green and hawksbill turtles nesting elsewhere.
4.3 Modelling Caveats and Recommendations
The Bayesian modelling approach developed and used in this study is a powerful way to fill in the gaps in surveillance effort at individual sites during each nesting season. In addition, it is a transparent method for which code is provided and which adapts to many datasets, and promotes collaboration between organisations with differing monitoring regimes. Nonetheless, there are various ways that this could be extended or improved upon. We used a flexible mean structure that was a variation on previous approaches (Godgenger et al., 2009; Girondot, 2017; Laloë et al., 2020), but is constrained to decay towards zero in the tails of the nesting season, to match our prior beliefs about the nesting dynamics in these rookeries. We decided to use a nested hierarchical model structure to allow for a flexible set of mean structures that enforced a more parsimonious form in the absence of strong data to the contrary. This approach reliably captures trends in almost all of the sites (Figure S2). However, for a few specific datasets, there were possible departures from this structure, such as multiple peaks in nesting effort. In practice the use of a negative binomial error structure resulted in the predictive bounds that encompassed these observations well for all, but one case (discussed in Section 2.3.2). However, if we did see more unusual structures in future datasets, then we could extend the set of mean structures and use e.g. Watanabe-Akaike information criterion (Watanabe, 2010) to inform the optimal choice of model structure, or use Bayesian model averaging (Kass and Raftery, 1995), although it would increase computational effort. An alternative could be to use a more flexible curve structure, such as splines, or a latent Gaussian process, but these would require some constraints to ensure adequate behaviour at the beginning and end of the season. Since these models are being used to extrapolate into the tails of the nesting season, without some form of informed structure, there is, however, the potential to produce biologically implausible trajectories when data are lacking, such as when surveillance efforts are focused only at the beginning or end of the season.
Clearly any model predictions are dependent on the choice of model, and in this case, also the choice of prior distributions. We made the prior assumption that sites that are known to be key rookeries are likely to be subject to more surveillance effort than smaller sites, and hence in the absence of data, the prior predictive distribution gave 95% prediction intervals of between 0 and around 80 clutches in any given season. For sites with good temporal coverage in surveillance effort, then this choice of prior was very flexible, and allowed for mean trajectories resulting in many more than 80 clutches (see Figure S2). However, the choice of prior will have more of an impact in sites with temporally biased surveillance efforts, such as Port (2011−2012), where all the surveillance effort was placed at the beginning of the season. In this case, there was little information to inform the trajectory, and hence there is more uncertainty in the extrapolated predictions. We believe these prior choices are sensible, but to assess their impact, we performed a sensitivity analysis where we used a less informative range on the peak nesting effort. This led to a prior predictive distribution with 95% prediction intervals of between 0 and around 750 clutches in a given season. We note that this uncertainty encompasses all trajectories from the fitted models, and so allows for the possibility that a poorly sampled site could have a large number of clutches. Figures S3, S4 show the site-specific and aggregated impacts of these changes respectively. We can see that it is principally only Port (2011−2012) that is affected, due to the poor temporal coverage of surveillance throughout the season. This impacts the aggregated trends by increasing the upper bounds of the prediction intervals. However, it does not change our qualitative assessments about the overall trends, and makes little impact to the predictions or predictive uncertainty as long as long as temporal coverage of data points is good across a season. This suggests that if resources are scarce, then less intensive coverage over the whole extent of the nesting season is likely to provide more information than intensive surveillance over shorter periods of nesting effort (Jackson et al., 2008; Sims et al., 2008; Delcroix et al., 2014).
At the current time, each species/site/season combination is treated as being independent, and we resort to using median posterior predictive imputation when we have non-surveyed sites in a given season, in order to generate trend estimates of nesting effort aggregated across sites. This simple approach has various drawbacks, and hence we have restricted discussion of aggregated trends to be only in years with low amounts of imputation. As such, there is scope in future work to develop a more nuanced approach that explicitly models trends over time that might produce better predictions for missing sites and seasons. In particular, Laloë et al. (2020) explore various ways to tackle this problem by either assuming constant, exponential or non-monotonic trends over time, and then build this into the imputations for missing seasons. Considering that both populations nesting in Republic of the Congo are likely extensions of the ones nesting in Gabon, the analytical method used in this study could be extended to incorporate nesting data from the latter country, which would allow to extract population trends and associated uncertainty at a regional scale.
4.4 Conclusion
We provide the first long-term assessment of population trends for olive ridley and leatherback turtles nesting in the Republic of the Congo and reiterate the importance of the Atlantic coast of Africa for sea turtles, with the Republic of the Congo being of regional and global importance as a potential extension of the populations nesting in Gabon. Such data will be critical to inform future status assessments for olive ridley and leatherback turtles in the region, as well as for sea turtles globally when available data are spatially and temporally fragmented.
Data Availability Statement
Raw nest beach monitoring data gathered at sites outside of the national park will be made available upon request to the board of Renatura Congo (contact@renatura.org). Raw nest beach monitoring data gathered at sites inside Conkouati-Douli National Park and code to run models are available from the Dryad Digital Repository: doi:10.5061/dryad.prr4xgxp3..
Ethics Statement
The animal study was reviewed and approved by University of Exeter Ethics Committee (Application ID: 491524).
Author Contributions
GB, AB, NB, EC, BC, AF, MG, J-GM, and HV were responsible for developing protocols and coordinating field teams. GB, AB, NB, EC, BC, AF, KM, DT, and HV were responsible for collating, digitizing, and cleaning nest beach monitoring data. TM, GPB, LO, BG, and KM developed and tested the seasonal nesting model. LO, TM, BG, and KM interpreted and analyzed the results and produced the first draft. All co-authors contributed to writing of the paper and gave final approval for publication.
Funding
KM, DT, and BG were supported by the Darwin Initiative (Projects 17-005/20-009/23-011/26-014) through funding from the Department for Environment, Food and Rural Affairs (Defra) in the UK. TM is supported by an “Expanding Excellence in England” award from Research England.
Conflict of Interest
The authors declare that the research was conducted in the absence of any commercial or financial relationships that could be construed as a potential conflict of interest.
Publisher’s Note
All claims expressed in this article are solely those of the authors and do not necessarily represent those of their affiliated organizations, or those of the publisher, the editors and the reviewers. Any product that may be evaluated in this article, or claim that may be made by its manufacturer, is not guaranteed or endorsed by the publisher.
Acknowledgments
We thank the reviewers and the editor, whose input greatly improved the manuscript. The Wildlife Conservation Society (WCS) Congo Program and Renatura Congo are grateful to the local field teams who have been supported by funding from the United States Fish and Wildlife Service (Marine Turtle Conservation Fund, US Department of the Interior), the Waitt Foundation, European Union, Total E&P Congo, Forest Ecosystem of Central Africa (ECOFAC), Protection of Marine Turtles of Central Africa (PROTOMAC), Network of Protected Areas of Central Africa (RAPAC), and Fonds Français pour l’environnement mondial (FFEM). All monitoring was conducted in partnership with the Ministère de l’Economie Forestière (MEF), with appropriate permissions to disseminate findings provided by the Ministry of Scientific Research and Technological Innovation (Permits: N°023/MRSIT/DGRST/DMAST and N°167/MRSIT/IRF/DS). Sea turtle skull figures used with permission of WIDECAST, original artwork by Tom McFarland.
Supplementary Material
The Supplementary Material for this article can be found online at: https://www.frontiersin.org/articles/10.3389/fmars.2022.817014/full#supplementary-material
Supplementary Methods S1 | Model details and exemplar code for running a model in a single site.
Footnotes
- ^ in practice we found a mathematically equivalent non-centred parameterisation worked slightly better—see Supplementary Materials for details.
- ^ we calculated the posterior means for the maximum mean proportion of estimated clutches across the two 5-year periods of 0.21 and 0.09 for olive ridley and leatherback turtles, respectively.
References
Abreu-Grobois A., Plotkin P. (2008). “Lepidochelys olivacea”, in Lepidochelys Olivacea. IUCN Red List Threat. Species 2008 e.T11534A3292503. Available at: http://dx.doi.org/10.2305/IUCN.UK. 2008.RLTS.T11534A3292503.en.
Allaire J., Xie Y., McPherson J., Luraschi J., Ushey K., Atkins A., et al. (2020) Rmarkdown: Dynamic Documents for R. Available at: https://github.com/rstudio/rmarkdown.
Angoni H., Akoa A., Bilong C. B., Fretey J. (2010). La Tortue Marine Au Cameroun, Genre Lepidochelys: Nidification, Biométrie De Lepidochelys Olivacea (Eschscholt, 1829)(Reptilia, Cheloniidae) Dans La Réserve De Faune De Campo (Sud Cameroun). Int. J. Biol. Chem. Sci. 4, 649–656. doi: 10.4314/ijbcs.v4i3.60472
Bache S. M., Wickham H. (2014) Magrittr: A Forward-Pipe Operator for R. R Packag. Version 1.5. Available at: https://cran.r-project.org/package=magrittr.
Broderick A. C., Glen F., Godley B. J., Hays G. C. (2003). Variation in Reproductive Output of Marine Turtles. J. Exp. Mar. Biol. Ecol. 288, 95–109. doi: 10.1016/S0022-0981(03)00003-0
Broderick A. C., Godley B. J., Hays G. C. (2001). Trophic Status Drives Interannual Variability in Nesting Numbers of Marine Turtles. Proc. R. Soc B. 268, 1481–1487. doi: 10.1098/rspb.2001.1695
Broderick A., Patrício A. R. (2019). Chelonia Mydas (South Atlantic Subpopulation), Green Turtle. IUCN Red. List. Threat. Spec., e.T142121866A142086337. doi: 10.2305/IUCN.UK.2019-2.RLTS.T142121866A142086337.en
Brooks S. P., Gelman A. (1998). General Methods for Monitoring Convergence of Iterative Simulations? J. Comput. Graph. Stat. 7, 434–455. doi: 10.1080/10618600.1998.10474787
Casale P., Ceriani S. A. (2020). Sea Turtle Populations are Overestimated Worldwide From Remigration Intervals: Correction for Bias. Endanger. Spec. Res. 41, 141–151. doi: 10.3354/esr01019
Casale P., Heppell S. (2016). How Much Sea Turtle Bycatch is Too Much? A Stationary Age Distribution Model for Simulating Population Abundance and Potential Biological Removal in the Mediterranean. Endanger. Spec. Res. 29, 239–254. doi: 10.3354/esr00714
Clarke E., Sherrill-Mix S. A. (2017) Ggbeeswarm: Categorical Scatter (Violin Point) Plots. R Packag. Version 0.6.0. Available at: https://cran.r-project.org/web/packages/ggbeeswarm/index.html.
Colman L. P., Lara P. H., Bennie J., Broderick A. C., de Freitas J. R., Marcondes A., et al. (2020). Assessing Coastal Artificial Light and Potential Exposure of Wildlife at a National Scale: The Case of Marine Turtles in Brazil. Biodivers. Conserv. 29, 1135–1152. doi: 10.1007/s10531-019-01928-z
Colman L. P., Sampaio C. L. S., Weber M. I., De Castilhos J. C. (2014). Diet of Olive Ridley Sea Turtles, Lepidochelys Olivacea, in the Waters of Sergipe, Brazil. Chelonian. Conserv. Biol 13, 266–271. doi: 10.2744/CCB-1061.1
Colman L. P., Thomé J. C. A., Almeida A.de P., Baptistotte C., Paulo P. C., Broderick A. C., et al. (2019). Thirty Years of Leatherback Turtle Dermochelys Coriacea Nesting in Espírito Santo, Brazil, 1988-2017: Reproductive Biology and Conservation. Endanger. Spec. Res. 39, 147–158. doi: 10.3354/esr00961
Congo Marine (2018). Strategic Information to Support Marine Spatial Planning. Republic of the Congo Version I May 2018 (Cornwall UK: Unpublished report. Centre for Ecology and Conservation, University of Exeter).
Dawson T. M., Formia A., Agamboué P. D., Asseko G. M., Boussamba F., Cardiec F., et al. (2017). Informing Marine Protected Area Designation and Management for Nesting Olive Ridley Sea Turtles Using Satellite Tracking. Front. Mar. Sci. 4. doi: 10.3389/fmars.2017.00312
Delcroix E., Bédel S., Santelli G., Girondot M. (2014). Monitoring Design for Quantification of Marine Turtle Nesting With Limited Effort: A Test Case in the Guadeloupe Archipelago. Oryx 48, 95–105. doi: 10.1017/S0030605311000792
de Valpine P., Turek D., Paciorek C. J., Anderson-Bergman C., Lang D. T., Bodik R. (2017). Programming With Models: Writing Statistical Algorithms for General Model Structures With NIMBLE. J. Comput. Graph. Stat. 26, 403–413. doi: 10.1080/10618600.2016.1172487
Formia A., Tiwari M., Fretey J., Billes A. (2003). Sea Turtle Conservation Along the Atlantic Coast of Africa. Mar. Turt. Newsl. 100, 33–37.
Frazer N. B., Richardson J. I. (1985). Annual Variation in Clutch Size and Frequency for Loggerhead Turtles, Caretta Caretta, Nesting at Little Cumberland Island, Georgia, USA. Herpetologica 41, 246–251.
Fretey (2001). “Biogéographie Et Conservation Des Tortues Marines De La Côte Atlantique De L’afrique,” in Convention on the Conservation of Migratory Species of Wild Animals (CMS) (Bonn, Germany: CMS Technical Series Publication no 6. UNEP/CMS Secretariat). 429 pp.
Furman E. (2007). On the Convolution of the Negative Binomial Random Variables. Stat. Probab. Lett. 77, 169–172. doi: 10.1016/j.spl.2006.06.007
Gelman A., Rubin D. B. (1992). Inference From Iterative Simulation Using Multiple Sequences. Stat. Sci. 7, 457–472. doi: 10.1214/ss/1177011136
Gerrodette T., Taylor B. (1999). “Estimating Population Size,” in Research and Management Techniques for the Conservation of Sea Turtles. Eds. Eckert K. L., Bjorndal K. A., Abreu-Grobois A., Donnelly M. (Washington, DC. USA: IUCN/SSC Marine Turtle Specialist Group Publication No. 543 4).
Girard A., Breheret N. (2013). The Renatura Sea Turtle Conservation Program in Congo. Munibe. Monogr. Nat. Ser. 1, 65–69. doi: 10.21630/mmns.2013.1.09
Girard A., Godgenger M., Gibudi A., Fretey J., Billes A., Roumet D., et al. (2016). Marine Turtles Nesting Activity Assessment and Trend Along the Central African Atlantic Coast for the Period of 1999-2008. Int. J. Mar. Sci. Ocean. Technol. 3, 21–32. doi: 10.19070/2577-4395-160005
Girondot M. (2010). Estimating Density of Animals During Migratory Waves: A New Model Applied to Marine Turtles at Nesting Sites. Endanger. Spec. Res. 12, 95–105. doi: 10.3354/esr00292
Girondot M. (2017). Optimizing Sampling Design to Infer the Number of Marine Turtles Nesting on Low and High Density Sea Turtle Rookeries Using Convolution of Negative Binomial Distribution. Ecol. Indic. 81, 83–89. doi: 10.1016/j.ecolind.2017.05.063
Girondot M. (2021) Tools for Environmental Analyses, Ecotoxicology and Various R. Available at: https://cran.r-project.org/package=HelpersMG.
Girondot M., Rivalan P., Wongsopawiro R., Briane J. P., Hulin V., Caut S., et al. (2006). Phenology of Marine Turtle Nesting Revealed by Statistical Model of the Nesting Season. BMC Ecol. 6, 11. doi: 10.1186/1472-6785-6-11
Girondot M., Rizzo A. (2015). Bayesian Framework to Integrate Traditional Ecological Knowledge Into Ecological Modeling: A Case Study. J. Ethnobiol. 35, 337–353. doi: 10.2993/etbi-35-02-337-353.1
Godgenger M. C., Bréheret N., Bal G., N’Damité K., Girard A., Girondot M. (2009). Nesting Estimation and Analysis of Threats for Critically Endangered Leatherback Dermochelys Coriacea and Endangered Olive Ridley Lepidochelys Olivacea Marine Turtles Nesting in Congo. Oryx 43, 556–563. doi: 10.1017/S0030605309990329
Godley B. J., Broderick A. C., Hays G. C. (2001). Nesting of Green Turtles (Chelonia Mydas) at Ascension Island, South Atlantic. Biol. Conserv. 97, 151–158. doi: 10.1016/S0006-3207(00)00107-5
Gratiot N., Gratiot J., Kelle L., de Thoisy B. (2006). Estimation of the Nesting Season of Marine Turtles From Incomplete Data: Statistical Adjustment of a Sinusoidal Function. Anim. Conserv. 9, 95–102. doi: 10.1111/j.1469-1795.2005.00015.x
Hamann M., Godfrey M. H., Seminoff J. A., Arthur K., Barata P. C. R., Bjorndal K. A., et al. (2010). Global Research Priorities for Sea Turtles: Informing Management and Conservation in the 21st Century. Endanger. Spec. Res. 11, 245–269. doi: 10.3354/esr00279
Hays G. C., Hawkes L. A. (2018). Satellite Tracking Sea Turtles: Opportunities and Challenges to Address Key Questions. Front. Mar. Sci. 5. doi: 10.3389/fmars.2018.00432
Hays G. C., Scott R. (2013). Global Patterns for Upper Ceilings on Migration Distance in Sea Turtles and Comparisons With Fish, Birds and Mammals. Funct. Ecol. 27, 748–756. doi: 10.1111/1365-2435.12073
Heppell S. S. (1998). Application of Life-History Theory and Population Model Analysis to Turtle Conservation. Copeia 1998, 367–375. doi: 10.2307/1447430
Heppell S. S., Snover M. L., Crowder L. B. (2003). “Sea Turtle Population Ecology,” in The Biology of Sea Turtles, vol. Volume II . Eds. Lutz P. L., Musick J. A., Wyneken J. (Boca Raton (Florida, USA: CRC Press, Inc), 275–306.
Honarvar S., Fitzgerald D. B., Weitzman C. L., Sinclair E. M., Echube J. M. E., O’Connor M., et al. (2016). Assessment of Important Marine Turtle Nesting Populations on the Southern Coast of Bioko Island, Equatorial Guinea. Chelonian. Conserv. Biol. 15, 79–89. doi: 10.2744/ccb-1194.1
Horrocks J. A., Stapleton S., Guada H., Lloyd C., Harris E., Fastigi M., et al. (2016). International Movements of Adult Female Leatherback Turtles in the Caribbean: Results From Tag Recovery Data (2002-2013). Endanger. Spec. Res. 29, 279–287. doi: 10.3354/esr00718
Jackson A. L., Broderick A. C., Fuller W. J., Glen F., Ruxton G. D., Godley B. J. (2008). Sampling Design and its Effect on Population Monitoring: How Much Monitoring do Turtles Really Need? Biol. Conserv. 141, 2932–2941. doi: 10.1016/j.biocon.2008.09.002
Kass R. E., Raftery A. E. (1995). Bayes Factors. J. Am. Stat. Assoc. 90, 773–795. doi: 10.1080/01621459.1995.10476572
Laloë J. O., Monsinjon J., Gaspar C., Touron M., Genet Q., Stubbs J., et al. (2020). Production of Male Hatchlings at a Remote South Pacific Green Sea Turtle Rookery: Conservation Implications in a Female-Dominated World. Mar. Biol. 167, 1–13. doi: 10.1007/s00227-020-03686-x
Limpus C. J., Miller J. D., Parmenter C. J., Limpus D. J. (2003). The Green Turtle, Chelonia Mydas, Population of Raine Island and the Northern Great Barrier Reef: 1843-2001. Mem. Queensl. Muse. 49, 349–440.
Magera A. M., Mills Flemming J. E., Kaschner K., Christensen L. B., Lotze H. K. (2013). Recovery Trends in Marine Mammal Populations. PloS One 8, e77908. doi: 10.1371/journal.pone.0077908
Matos L., Silva A. C. C. D., Castilhos J. C., Weber M. I., Soares L. S., Vicente L. (2012). Strong Site Fidelity and Longer Internesting Interval for Solitary Nesting Olive Ridley Sea Turtles in Brazil. Mar. Biol. 159, 1011–1019. doi: 10.1007/s00227-012-1881-1
Maxwell S. M., Breed G. A., Nickel B. A., Makanga-Bahouna J., Pemo-Makaya E., Parnell R. J., et al. (2011). Using Satellite Tracking to Optimize Protection of Long-Lived Marine Species: Olive Ridley Sea Turtle Conservation in Central Africa. PloS One 6, e19905. doi: 10.1371/journal.pone.0019905
Mazaris A. D., Almpanidou V., Wallace B. P., Pantis J. D., Schofield G. (2014). A Global Gap Analysis of Sea Turtle Protection Coverage. Biol. Conserv 173, 17–23. doi: 10.1016/j.biocon.2014.03.005
Mazaris A. D., Schofield G., Gkazinou C., Almpanidou V., Hays G. C. (2017). Global Sea Turtle Conservation Successes. Sci. Adv. 3, e1600730. doi: 10.1126/sciadv.1600730
Metcalfe K., Agamboué P. D., Augowet E., Boussamba F., Cardiec F., Fay J. M., et al. (2015). Going the Extra Mile: Ground-Based Monitoring of Olive Ridley Turtles Reveals Gabon Hosts the Largest Rookery in the Atlantic. Biol. Conserv. 190, 14–22. doi: 10.1016/j.biocon.2015.05.008
Metcalfe K., Bréheret N., Bal G., Chauvet E., Doherty P. D., Formia A., et al. (2020). Tracking Foraging Green Turtles in the Republic of the Congo: Insights Into Spatial Ecology From a Data Poor Region. Oryx 53, 1–8. doi: 10.1017/S0030605319000309
Miller J. D. (1997). “Reproduction in Sea Turtles,” in Biology of Sea Turtles, vol. Volume I . Eds. Lutz P. L., Musick J. A. (Boca Raton (Florida, USA: CRC Press, Inc), 51–81.
Nichols J. D., Williams B. K. (2006). Monitoring for Conservation. Trends Ecol. Evol. 21, 668–673. doi: 10.1016/j.tree.2006.08.007
Omeyer L. C. M., Stokes K. L., Beton D., Çiçek B. A., Davey S., Fuller W. J., et al. (2021). Investigating Differences in Population Recovery Rates of Two Sympatrically Nesting Sea Turtle Species. Anim. Conserv. 24, 832–846. doi: 10.1111/acv.12689
Patrício A. R., Formia A., Barbosa C., Broderick A. C., Bruford M., Carreras C., et al. (2017). Dispersal of Green Turtles From Africa’s Largest Rookery Assessed Through Genetic Markers. Mar. Ecol. Prog. Ser. 569, 215–225. doi: 10.3354/meps12078
Pedersen T. L. (2020) Patchwork: The Composer of Plots. R Packag. Version 1.0.1. Available at: https://cran.r-project.org/web/packages/patchwork/index.html.
Piacenza S. E., Richards P. M., Heppell S. S. (2019). Fathoming Sea Turtles: Monitoring Strategy Evaluation to Improve Conservation Status Assessments. Ecol. Appl. 29, 1300–1315. doi: 10.1002/eap.1942
Pikesley S. K., Maxwell S. M., Pendoley K., Costa D. P., Coyne M. S., Formia A. (2013). On the Front Line: Integrated Habitat Mapping for Olive Ridley Sea Turtles in the Southeast Atlantic. Divers. Distrib. 19, 1518–1530. doi: 10.1111/ddi.12118
Plot V., de Thoisy B., Blanc S., Kelle L., Lavergne A., Roger-Bérubet H., et al. (2012). Reproductive Synchrony in a Recovering Bottlenecked Sea Turtle Population. J. Anim. Ecol 81, 341–351. doi: 10.1111/j.1365-2656.2011.01915.x
Plummer M., Best N., Cowles K., Vines K. (2006). CODA: Convergence Diagnosis and Output Analysis for MCMC. R. News 6, 7–11.
Polidoro B. A., Ralph G. M., Strongin K., Harvey M., Carpenter K. E., Arnold R., et al. (2017). The Status of Marine Biodiversity in the Eastern Central Atlantic (West and Central Africa). Aquat. Conserv. Mar. Freshw. Ecosyst. 27, 1021–1034. doi: 10.1002/aqc.2744
R Core Team (2021). R: A Language and Environment for Statistical Computing (Vienna, Austria: R Found. Stat. Comput). doi: 10.1017/CBO9781107415324.004
Rees A. F., Alfaro-Shigueto J., Barata P., Bjorndal K., Bolten A., Bourjea J., et al. (2016). Are We Working Towards Global Research Priorities for Management and Conservation of Sea Turtles? Endang. Spec. Res. 31, 337–382. doi: 10.3354/esr00801
Rivalan P., Prévot-Julliard A. C., Choquet R., Pradel R., Jacquemin B., Girondot M. (2005). Trade-Off Between Current Reproductive Effort and Delay to Next Reproduction in the Leatherback Sea Turtle. Oecologia 145, 564–574. doi: 10.1007/s00442-005-0159-4
Saba V. S., Santidrián Tomillo P., Reina R. D., Spotila J. R., Musick J. A., Evans D. A., et al. (2007). The Effect of the El Niño Southern Oscillation on the Reproductive Frequency of Eastern Pacific Leatherback Turtles. J. Appl. Ecol. 44, 395–404. doi: 10.1111/j.1365-2664.2007.01276.x
Santidrián Tomillo P., Fonseca L. G., Ward M., Tankersley N., Robinson N. J., Orrego C. M., et al. (2020). The Impacts of Extreme El Niño Events on Sea Turtle Nesting Populations. Clim. Change 159, 163–176. doi: 10.1007/s10584-020-02658-w
Seminoff J. A., Shanker K. (2008). Marine Turtles and IUCN Red Listing: A Review of the Process, the Pitfalls, and Novel Assessment Approaches. J. Exp. Mar. Bio. Ecol. 356, 52–68. doi: 10.1016/j.jembe.2007.12.007
Shamblin B. M., Dodd M. G., Griffin D. B. B., Pate S. M., Godfrey M. H., Coyne M. S., et al. (2017). Improved Female Abundance and Reproductive Parameter Estimates Through Subpopulation-Scale Genetic Capture-Recapture of Loggerhead Turtles. Mar. Biol. 164, 1–14. doi: 10.1007/s00227-017-3166-1
Shamblin B. M., Dodd M. G., Pate S. M., Godfrey M. H., Pfaller J. B., Williams K. L., et al. (2021). In Search of the “Missing Majority” of Nesting Loggerhead Turtles: Improved Inter-Seasonal Recapture Rates Through Subpopulation-Scale Genetic Tagging. Mar. Biol. 168, 1–14. doi: 10.1007/s00227-020-03820-9
Sherman K., Hempel G. (2008). The UNEP Large Marine Ecosystem Report: A Perspective on Changing Conditions in LMEs of the World’s Regional Seas (Nairobi, Kenya: United Nations Environment Programme).
Sims M., Bjorkland R., Mason P., Crowder L. B. (2008). Statistical Power and Sea Turtle Nesting Beach Surveys: How Long and When? Biol. Cons. 141, 2921–2931. doi: 10.1016/j.biocon.2008.07.021
Slowikowski K., Schep A, Hughes S, Kien Dang T, Lukauskas S, Irisson J. -O., et al (2021). Ggrepel: Automatically Position non-Overlapping Text Labels With “Ggplot2”. R Package Version 0.9.1.
Solow A. R., Bjorndal K. A., Bolten A. B. (2002). Annual Variation in Nesting Numbers of Marine Turtles: The Effect of Sea Surface Temperature on Re-Migration Intervals. Ecol. Lett. 5, 742–746. doi: 10.1046/j.1461-0248.2002.00374.x
Stewart K. R., Martin K. J., Johnson C., Desjardin N., Eckert S. A., Crowder L. B. (2014). Increased Nesting, Good Survival and Variable Site Fidelity for Leatherback Turtles in Florida, USA. Biol. Conserv. 176, 117–125. doi: 10.1016/j.biocon.2014.05.008
Stewart K., Sims M., Meylan A., Witherington B., Brost B., Crowder L. B. (2011). Leatherback Nests Increasing Significantly in Florida, USA; Trends Assessed Over 30 Years Using Multilevel Modeling. Ecol. Appl. 21, 263–273. doi: 10.1890/09-1838.1
Stokes K. L., Fuller W. J., Glen F., Godley B. J., Hodgson D. J., Rhodes K. A., et al. (2014). Detecting Green Shoots of Recovery: The Importance of Long-Term Individual-Based Monitoring of Marine Turtles. Anim. Conserv. 17, 593–602. doi: 10.1111/acv.12128
Troëng S., Chacón D., Dick B. (2004). Possible Decline in Leatherback Turtle Dermochelys Coriacea Nesting Along the Coast of Caribbean Central America. Oryx 38, 395–403. doi: 10.1017/S0030605304000766
Valdivia A., Wolf S., Suckling K. (2018). Marine Mammals and Sea Turtles Listed Under the U.S. Endangered Species Act are Recovering. PloS One 14, e0210164. doi: 10.1101/319921
Wallace B. P., DiMatteo A. D., Bolten A. B., Chaloupka M. Y., Hutchinson B. J., Abreu-Grobois F. A., et al. (2011). Global Conservation Priorities for Marine Turtles. PloS One 6, e24510. doi: 10.1371/journal.pone.0024510
Wallace B. P., DiMatteo A. D., Hurley B. J., Finkbeiner E. M., Bolten A. B., Chaloupka M. Y., et al. (2010). Regional Management Units for Marine Turtles: A Novel Framework for Prioritizing Conservation and Research Across Multiple Scales. PloS One 5, e15465. doi: 10.1371/journal.pone.0015465
Watanabe S. (2010). Asymptotic Equivalence of Bayes Cross Validation and Widely Applicable Information Criterion in Singular Learning Theory. J. Mach. Learn. Res. 11, 3571–3594.
Weir C. R., Ron T., Morais M., Duarte A. D. C. (2007). Nesting and at-Sea Distribution of Marine Turtles in Angola, West Africa 2000-2006: Occurrence, Threats and Conservation Implications. Oryx 44, 224–231. doi: 10.1017/S003060530700186X
Whiting A. U., Chaloupka M., Limpus C. J. (2020). Sampling Nesting Sea Turtles: Impact of Survey Error on Trend Detection. Mar. Ecol. Prog. Ser 634, 213–223. doi: 10.3354/meps13202
Whiting A. U., Chaloupka M., Pilcher N., Basintal P., Limpus C. J. (2014). Comparison and Review of Models Describing Sea Turtle Nesting Abundance. Mar. Ecol. Prog. Ser. 508, 233–246. doi: 10.3354/meps10832
Wickham H., Averick M., Bryan J., Chang W., McGowan L. D., François R., et al. (2019). Welcome to the Tidyverse. J. Open Source Software 4, 1686. doi: 10.21105/joss.01686
Wildermann N. E., Gredzens C., Avens L., BarriosGarrido H. A., Bell I., Blumenthal J., et al. (2018). Informing Research Priorities for Immature Sea Turtles Through Expert Elicitation. Endanger. Spec. Res. 37, 55–76. doi: 10.3354/esr00916
Witherington B., Kubilis P., Brost B., Meylan A. (2009). Decreasing Annual Nest Counts in a Globally Important Loggerhead Sea Turtle Population. Ecol. Appl. 19, 30–54. doi: 10.1890/08-0434.1
Witt M. J., Baert B., Broderick A. C., Formia A., Fretey J., Gibudi A., et al. (2009). Aerial Surveying of the World’s Largest Leatherback Turtle Rookery: A More Effective Methodology for Large-Scale Monitoring. Biol. Cons. 142, 1719–1727. doi: 10.1016/j.biocon.2009.03.009
Witt M. J., Bonguno E. A., Broderick A. C., Coyne M. S., Formia A., Gibudi A., et al. (2011). Tracking Leatherback Turtles From the World’s Largest Rookery: Assessing Threats Across the South Atlantic. Proc. R. Soc B. Biol. Sci. 278, 2338–2347. doi: 10.1098/rspb.2010.2467
Witt M. J., Broderick A. C., Coyne M. S., Formia A., Ngouessono S., Parnell R. J., et al. (2008). Satellite Tracking Highlights Difficulties in the Design of Effective Protected Areas for Critically Endangered Leatherback Turtles Dermochelys Coriacea During the Inter-Nesting Period. Oryx 42, 296–300. doi: 10.1017/S0030605308006947
Xie Y. (2020a) Bookdown: Authoring Books and Technical Documents With R Markdown. Available at: https://github.com/rstudio/bookdown.
Xie Y. (2020b) Knitr: A General-Purpose Package for Dynamic Report Generation in R. Available at: https://yihui.org/knitr/
Keywords: Africa, leatherback turtle, sea turtles, olive ridley turtle, Bayesian hierarchical modelling, population status, Republic of the Congo, seasonality
Citation: Omeyer LCM, McKinley TJ, Bréheret N, Bal G, Petchell Balchin G, Bitsindou A, Chauvet E, Collins T, Curran BK, Formia A, Girard A, Girondot M, Godley BJ, Mavoungou J-G, Poli L, Tilley D, VanLeeuwe H and Metcalfe K (2022) Missing Data in Sea Turtle Population Monitoring: A Bayesian Statistical Framework Accounting for Incomplete Sampling. Front. Mar. Sci. 9:817014. doi: 10.3389/fmars.2022.817014
Received: 17 November 2021; Accepted: 27 April 2022;
Published: 08 June 2022.
Edited by:
Charles Rice, Clemson University, United StatesReviewed by:
Susan Elizabeth Hilber Piacenza, Oregon State University, United StatesRussell James Thomson, Western Sydney University, Australia
Copyright © 2022 Omeyer, McKinley, Bréheret, Bal, Petchell Balchin, Bitsindou, Chauvet, Collins, Curran, Formia, Girard, Girondot, Godley, Mavoungou, Poli, Tilley, VanLeeuwe and Metcalfe. This is an open-access article distributed under the terms of the Creative Commons Attribution License (CC BY). The use, distribution or reproduction in other forums is permitted, provided the original author(s) and the copyright owner(s) are credited and that the original publication in this journal is cited, in accordance with accepted academic practice. No use, distribution or reproduction is permitted which does not comply with these terms.
*Correspondence: Trevelyan J. McKinley, t.mckinley@exeter.ac.uk; Kristian Metcalfe, kristian.metcalfe@exeter.ac.uk